Stock-market:
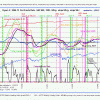 ECRI reported the WLI at a level of 130.6 and the six months smoothed annualized growth WLIg at +7.2%, both figures are up from last week, as shown in Fig 2. Last November the IBH model generated a sell-basic signal and 2 days later a sell A signal, indicating that the model had exited the S&P500.
In my 12-21-12 update I expressed concern that the basic sell signal was perhaps a bad signal, and last week I attached the a chart showing the performance after this basic sell signal and how it relates to the envelope of all previous performances after basic sell signals. It was evident that the performance graph was way over the maximum envelope line which did not fit the typical performance of the S&P after previous basic sell signals.
The reason for this abnormal signal was that the WLI was negatively affected by the high number of initial claims for unemployment insurance after hurricane Sandy (similar to the Conference Board LEI). Leading indicators are supposed to provide information on the direction of the economy a few months ahead, and a temporary spike in the claims figure is clearly not reflecting a new trend of employment. The WLI should have been adjusted for this temporary unemployment phenomenon to indicate the future economic conditions correctly. I have applied “normal” claims figures for the 3 weeks of high claims after hurricane Sandy and have re-calculated the WLI using our “shadow WLI” model. With the adjusted WLI figures the IBH model did not generate a sell-basic signal in November and none to date either – figure 2 reflecting these conditions, with the model now being invested in the S&P500.
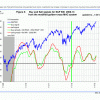 MAC Fig 3 shows the spreads of the moving averages, both having increased from last week. The sell spread (red graph) has moved further away from crossing the zero line, and a sell signal will not be generated in the near future. The model stays invested.
Bond-market:
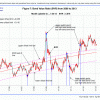 The Bond Value Ratio is shown in Fig 7. The BVR has declined from last week and the trend appears to be downwards. In the longer term BVR will reach the long-term trendline and long-bond investors will have suffered considerable losses by then. The model avoids high beta bonds.
The Yield Curve:
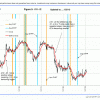 Figure 5 charts (i10 – i2). The trend is up now as one can clearly see – the model expects the yield curve to steepen. FLAT and STPP are ETNs. STPP profits from a steepening yield curve and FLAT increases in value when the yield curve flattens
Recession:
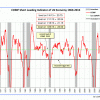 Attached is the updated COMP which gained considerably since last week. This indicator is far away from a recession signal.
Gold:
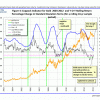 The updated Coppock indicator for gold is shown in figure 4. It has not formed a trough yet, and no buy signal so far, but the year-over-year rolling return percentage change expressed in standard deviation terms seems to indicate an oversold condition.

Leave a Reply
You must be logged in to post a comment.