Stock-market:
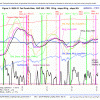 ECRI reported the WLI at a level of 130.4 and the six months smoothed annualized growth WLIg at +6.1%, both figures up from last week, as shown in Fig 2. Nine weeks ago the IBH model generated a sell-basic signal and 2 days later a sell A signal, indicating that the model had exited the S&P500. So far the S&P has gained since the sell signal. In my 12-21-12 update I expressed concern that the basic sell signal was perhaps a bad signal.
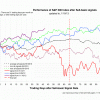 I have attached the a chart showing the performance after the basic sell signal and how it relates to the envelope of all previous performances after basic sell signals. The purple graph shows the performance of the S&P after the last basic sell signal. It is evident that currently the market is about 9% higher and the performance graph is way over the maximum envelope line which does not fit the typical performance of the S&P after previous basic sell signals.
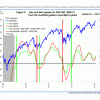 MAC Fig 3 shows the spreads of the moving averages. The sell spread (red graph) has now formed a trough and a sell signal will not be generated in the near future. The model stays invested.
Bond-market:
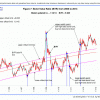 The Bond Value Ratio is shown in Fig 7. The BVR has been declining since August 2012 and long bonds with them. The trend appears to be downwards but the over the lat week the level was unchanged. In the longer term BVR will reach the long-term trendline and long-bond investors will have suffered considerable losses by then. The model stays avoids high beta bonds.
The Yield Curve:
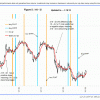 Figure 5 charts (i10 – i2). The trend is up now as one can clearly see – the model expects the yield curve to steepen. FLAT and STPP are ETNs. STPP profits from a steepening yield curve and FLAT increases in value when the yield curve flattens.
Recession:
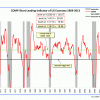 Attached is the updated COMP which gained a bit since last week. This indicator is far away from a recession signal.
Gold:
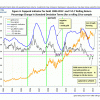 The updated Coppock indicator for gold is shown in figure 4. It has not formed a trough yet, and no buy signal so far, but the year-over-year rolling return percentage change expressed in standard deviation terms seems to indicate an oversold condition. See my article at dshort Is it Time to Buy Gold Again?

Leave a Reply
You must be logged in to post a comment.