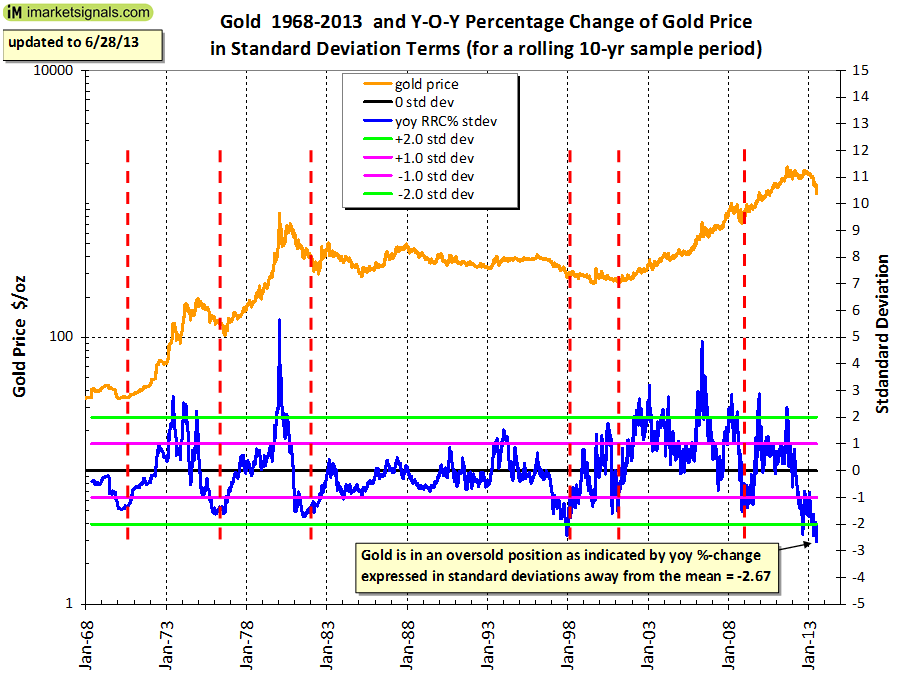
Gold has declined substantially and many commentators believe that the price will go much lower. But will it? The chart below shows the gold price plotted on a semi-log scale from 1968 to 2013, and the year-on-year percentage change of the price expressed in standard deviation terms for a rolling 10-year sample period. What strikes one is that the recent decline is not particularly spectacular in comparison to previous declines, and that the y-o-y percentage change of the price is now minus 2.67 standard deviations (sigma) away from the mean, the lowest that it ever got.
The population within a deviation of 2,67 sigma, using excel functions, is p= ERF(2.67/SQRT(2))= 0.992415. Thus the population within the one outer extreme of the normal distribution curve is (1-p)/2= 0.38% of the total population. So if you are betting on a further decline of the deviation (and gold price), then your chance of winning is 1/0.38% or 1:263. Good luck to you.
It is also evident from the chart that whenever the y-o-y percentage price change reached a level near minus 2 sigma, then invariably gold began an upward move fairly soon thereafter. A bounce of the gold price is now overdue.
The current state of affairs calls to mind the first three of Bob Farrell’s rules:
- Markets tend to return to the mean over time.
- Excesses in one direction will lead to an opposite excess in the other direction.
- There are no new eras — excesses are never permanent.

 Click to enlarge
If gold went to five standard deviations on the upside twice, it could go to five standard deviations on the down side.
No, that will not happen now. The spikes to the upside are due to the percentage yoy change of gold price being a high multiple of the average of the percentage yoy change over the preceding 10 years. In 1987 230% and 27%: multiple= 8.5, and in 2006 67% and 3%: multiple= 22. Currently the multiple is 1.2.
Shouldn’t this be a chart of the standard deviation of the difference in the log of the price rather than the percent change? This would probably be more illuminating and would likely eliminate the effect that bud noticed.
Thanks for the suggestion. I will recalculate with the price in logs.
As of 7/26 Gold is at around $1320 and GLD pretty much flashed a Buy signal last week.
Are you saying it’s a Bull trap?
If so, how far does your model says Gold will go higher before testing the $1200 area again?
Does your model take into account the highly unusual low interest rates and the historically unprecedented injection of liquidity into the markets as of late?
Thank you.
The Coppock model only works with the weighted moving average of the rate of change of the gold price.
Indicator = 10 x WMA of (ROC[59] + ROC[49])
There are no other inputs, such as low interest rates and injection of liquidity by the FED. To determine at what price a buy signal will appear I have to forward project the gold price with random numbers. I have not done that yet.
Hi Georg,
Could you please post a chart of the standard deviation of the difference in the log of the price (rather than the percent change)?
Thanks
When I have a chance I will do this, not a problem.
You’re saying that chances that the price of gold will go down are slim. Yet there is no buy-signal from the modified Coppock Gold indicator.
1. By the time the Coppock Gold indicator will show a buy signal the price maybe up by several hundred dollars. Does it make sense to wait?
2. If the gold price is unlikely to go down isn’t it better to hold gold than fiat paper currency?
3. I’d like to follow up on the question of im2of5 (Jul 29, 2013)above: “If so, how far does your model says Gold will go higher before testing the $1200 area again”?
4. Does your model say the price of gold will be testing $1200 area again? I was under impression that you’ve said that it’s unlikely (“So if you are betting on a further decline of the deviation (and gold price), then your chance of winning is 1/0.38% or 1:263. Good luck to you.”). Am I missing something?
Cheers
1. I will do a forward simulation of the gold price to see under what circumstances a Coppock buy signal can be expected.
2. We are not financial advisors.
3. I have no idea whether gold will test $1200 again.
4. The model does not say whether gold will be testing $1200 again. I did the calculations and wrote the article at the end of June when gold was $1192. At that time the chances of it going even lower were very low. I also said gold was ready for a bounce, and it is now, one month later, over $1300. I have no idea whether it will go much higher than that in the short term.
Cheers.
Matt read this. Futures Markets Signal Gold Ready to Erupt
Euro Pacific Capital.
http://advisorperspectives.com/commentaries/euro_080913.php