
In a previous article I demonstrated that one could get high returns by using a ranking system, and periodically rebalancing one’s portfolio to hold only the 10 highest ranked stocks of a S&P 500 stock pool. One can further improve returns by ensuring that the pool does not contain poor performing stocks. Removing poor performing stocks from the S&P 500 pool and adding high performing stocks resulted in a pool of 429 stocks to which I applied my ranking/trading system. It stands to reason that selecting stocks from a pool of high performance stocks will produce higher returns than if one selected from a pool of less well performing stocks. This is indeed the case. Best10+ produced annual returns of about 50% over the last 14 years, versus 35% if one had only used all the stocks of the S&P 500 to select from.
The modified S&P 500 stock pool
An argument can be made that the modification to the composition of the S&P 500 stock pool is based on hindsight. That is true, and I am not claiming that an investor in 1999 would have been able to assemble this exact pool of companies from which Best10+ makes its selection. However, one could have assembled a stock pool having similar characteristics then, and modified it every few years to take account of changes in stock performances.
Going forward, it makes no sense to have stocks in a pool whose performances have been dismal, to say the least. The expectation is that these stocks will also under-perform in the future. Equally, why should one not include companies which are currently not in the S&P 500, or foreign ones, which have out-performed the market in the past and demonstrated this convincingly for a long time? One can expect these companies to do well in the future too.
I therefore removed 91 stocks from the S&P 500 which had equal, or worse returns over the last 10 years than the S&P 500 index, and also those which had a maximum drawdown of 70% or higher. There are currently a number of S&P 500 stocks which had negative annualized 10-year returns of almost -10% and drawdowns of over 80% in the last 10 years. So why should one continue to have them in a pool where they can only diminish the performance of the group?
I added 20 stocks with better performance than S&P 500 index and drawdowns equal to, or lower than the index; not only stocks of American companies, but also stocks of U.S. listed foreign companies which have a large presence in the emerging markets and big market capitalizations. This resulted in a pool of 429 companies for the model to select from.
The system then proceeds to periodically find the 10 highest ranked stocks of the pool using the ranking system, and trades them according to the trading rules, all as described below.
Ranking System
To find stocks which may be undervalued all 429 stocks of the modified S&P 500 pool are ranked weekly according to the following parameters:
- Valuation (measured as market capitalization, debt and cash relative to earnings before interest, taxes, depreciation & amortization, future cash flow and projected earnings),
- Efficiency (measured as free cash flow relative to total assets),
- Financial Strength (measured as future cash flow relative to total debt),
- Short Interest (being the short interest ratio),
- Trend (measured as the stock price relative to a moving average of the price),
with the highest rank obtainable being 100.
Trading Rules
Stocks are sold from the portfolio once their ranks falls below 97 and replaced by the highest ranked stocks at that time. The model does not restrict buying to stocks to those which are ranked 97 or higher.
The model assumes stocks to be bought and sold at the next day’s opening price after a signal is generated. Variable slippage accounting for brokerage fees and transaction slippage were taken into account. (See the Appendix for variable slippage.) Taxes are assumed to be deferred, as for retirement accounts.
Performance
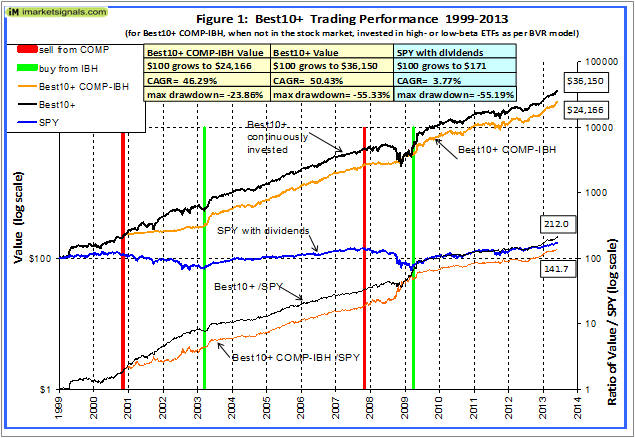
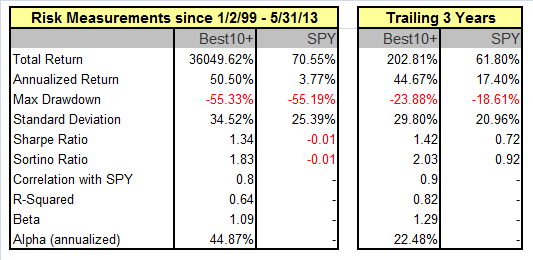
The trading performance of the system is shown in Figure 1 further down. The annualized return over the last 14 years and 5 months was an exceptionally high 50.4%, and the maximum draw-down was 55%, same as for SPY, the exchange traded fund which tracks the S&P 500 index. $100 grew to about $36,000 over this period, and the system performed so well that there was no need to take one’s money out of the market during the business cycle contraction of 2001.
Annualized returns for periods of 2 to 14 years were all higher than 43%; they are listed in Table 2 in the Appendix.
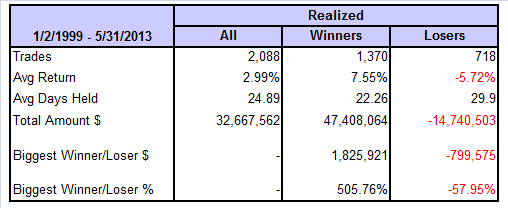
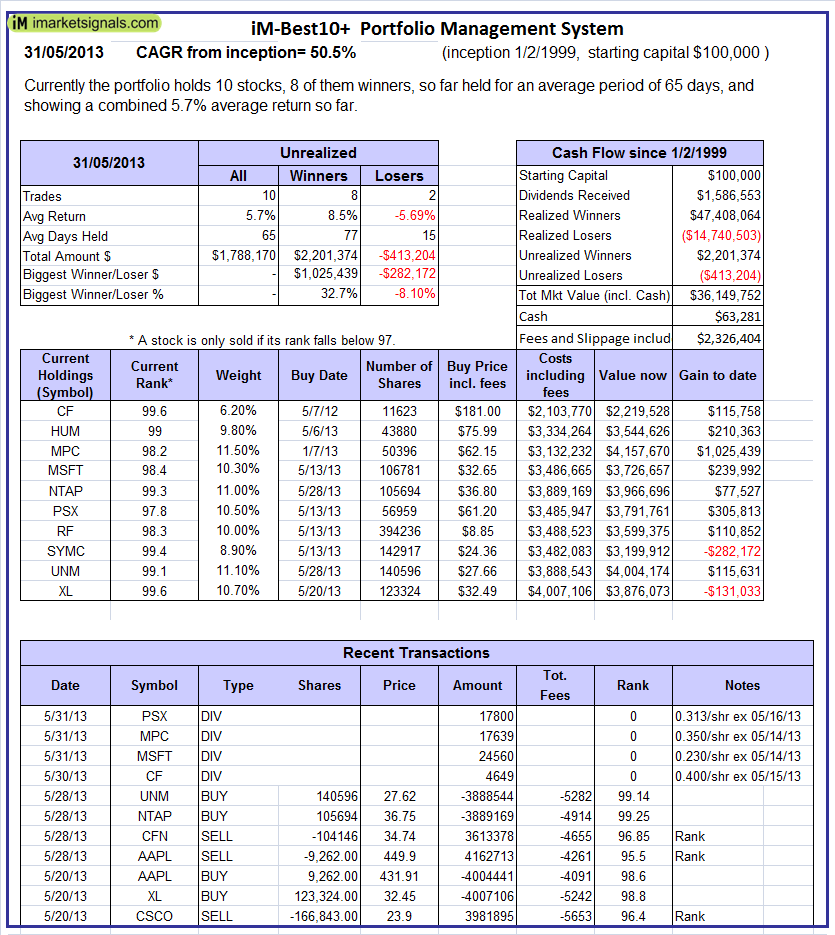
For an investment of $100,000 made on Jan-2-1999 and holding about 10 stocks at any time, there were over the last 14 years and 5 months 2,088 realized trades, 1,370 of them winners and 718 losers, as shown in the table below; the figures include transaction costs of $2,326,404 arising from slippage and brokerage fees.
 (click on image to enlarge)
Also one can see from the general slope of the ratio graphs at the bottom of the chart that Best10+ always outperformed SPY, producing 212 times the value which one would have had from a 1999 buy-and-hold investment in SPY.
(Selecting from a pool of companies which did not include the additional 20 non-S&P 500 companies and only selecting the best 10 stocks from a reduced 409 stock pool of S&P 500 companies would have produced a CAGR of 46.7%, which is approximately 3% less than what Best10+ produced which selected from the combined pool of 429 stocks, but significantly higher than the CAGR of 35.2% from Best10, which selected from all the 500 stocks of the S&P 500.)
Performance during recession periods
During the period from Jan-1999 to May-2013 there were two recessions. Returns can usually be increased, and drawdowns decreased, by placing the portfolio’s funds, when not in the stock market, into treasury bond funds. My COMP-IBH system provides information when to exit the market and when to re-enter it, and the system’s buy and sell signals are shown in Figure 1 as the vertical green and red lines, respectively.
Following this strategy would have decreased the model’s annualized return to May 2013 by about 4%, however the maximum drawdown would have only been 24% instead of 55%, all as shown in Figure 1.
Annual Returns
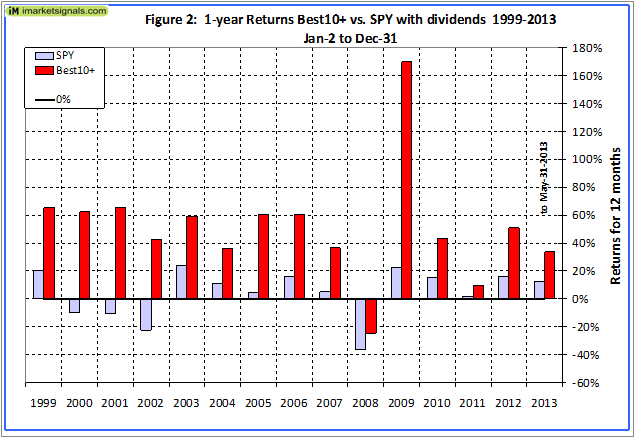
Annual performance from January to December ranged from a maximum of 170% for 2009 to a minimum of -24% for 2008, as can be seen in Figure 2. (This is the return if one had bought stocks on the first day of the year, then traded according to the model’s signals, and sold all the holdings on the last day of the year.)
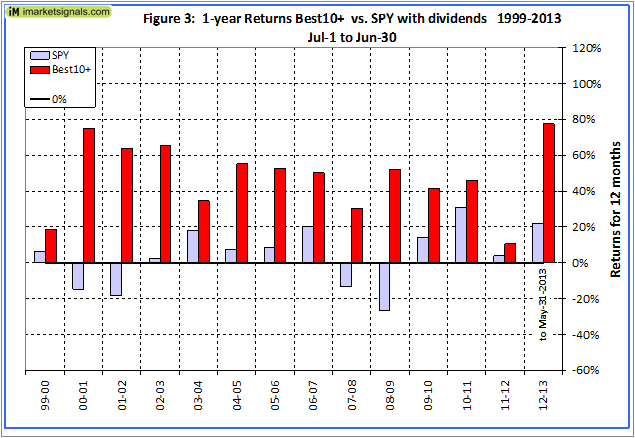
The 12-month performance from July to June ranged from a maximum of 75% for 2000-01, to a minimum of 11% for 2011-12, as can be seen in Figure 3. There was never a loss over a 12-month investment period starting in July of any year.
 Terminal Values
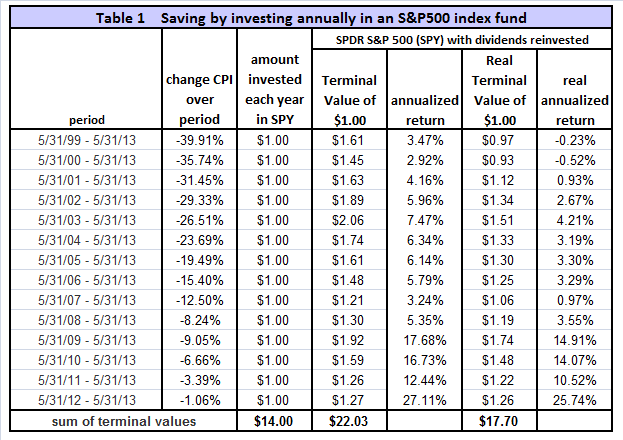
Table 1 in the Appendix shows the terminal values to the end of May 2013 for annual investments in an S&P 500 index fund on an ongoing basis for the last 14 years. Assuming an investment of $1.00 at the end of May of every year, from 1999 to 2012, one would have invested a total of $14 cumulatively by the end. Summing the 14 terminal values, this strategy would have netted the sum of $22.03 by May 31, 2013, and accounting for inflation this would only have amounted to $17.70.
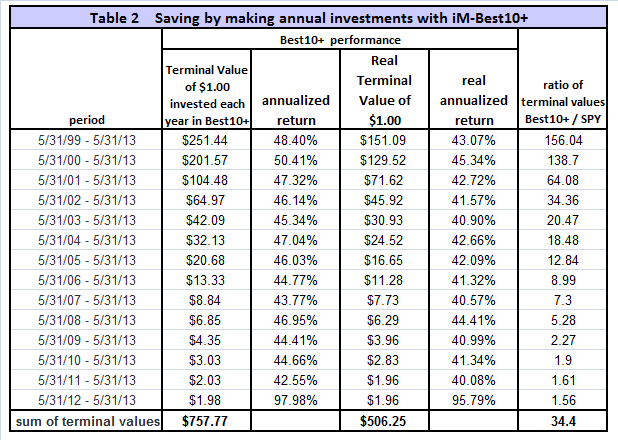
Making the same $1.00 annual investments in a portfolio managed according to the Best10+ trading system would have provided a terminal value of $757.77, as shown in Table 2 in the Appendix. That is 34 times of what one would have had from an S&P 500 index fund. Also one can see that the lowest annualized return over all the various time periods was 43.8%, namely for the period 2007-13.
Comparison of Best10+ with Best10
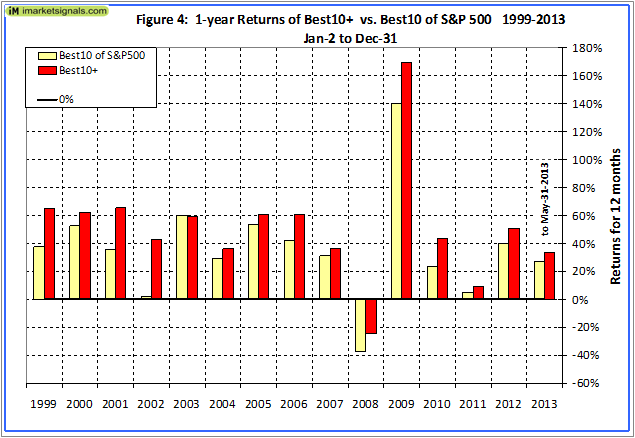
Figure 4 compares the annual performance of Best10+ with the performance of Best10 which selected its stocks from all the S&P 500 companies comprising the index. One can see the better performance of Best10+ over the years.
Liquidity
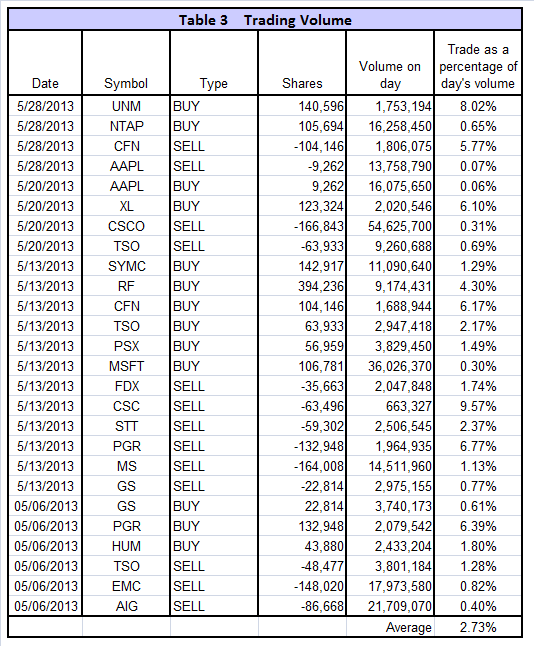
Table 3 in the Appendix lists the 26 trades during May 2013, and also the total trading volume for these stocks on the particular days. This portfolio has a value of almost $40-million and the individual trades require a large number of shares to be bought and sold. Although the number of shares required to be traded is large, it is still only a small fraction of the total daily volume traded, on average 2.7% of the total, and the trades from this model would probably not have affected the stock prices detrimentally. Thus the Best10+ system is suitable for sizeable portfolios, possibly up to a $50-million portfolio value, because all stocks in the pool are highly liquid and easy to trade.
Larger portfolios would require more stocks to be selected by the ranking system, but then one can expect the returns to be lower too. For example, a Best15+ or a Best20+ portfolio would have produced annualized returns of 33.4% and 28.5%, respectively, lower than the 50.5% return of Best10+, but still amazingly high, nevertheless.
Conclusion
The intent of this analysis was not to provide an accurate number for a percentage return over time emanating from the use of this system, but to show that by holding a few of the highest ranked stocks of a pool of good companies one would always have outperformed a buy-and-hold investment in an S&P 500 index fund by a wide margin. Also by weeding out poor performers in the S&P 500 and adding better performers from outside the S&P 500 will increase investment returns by a few percent.
This portfolio management system does require trading of about 6 stocks a week (resulting in an average annual portfolio turnover of 910%), but this small weekly effort would have provided high returns.
A simple ranking system is consistently applied to the stock selection process, which makes this not a complex, high risk system which could easily break down. Additionally, selecting only large and mid-cap stocks from a known pool of stocks assures liquidity, even if the portfolio value is big.
More particulars can be found on our website’s “Systems” page where one can also follow weekly the progress of a Best10+ portfolio having an inception date of January 2, 2009.
Appendix
 (click on image to enlarge)
Variable Slippage
The model assumes that stocks are bought/sold at the next day’s opening price. Since one may not be able to obtain the opening price for the whole transaction, a slippage factor is applied to account for a possible higher/lower price for the transaction.
The slippage percentage is calculated for every transaction based on this algorithm:
1) The 10 day average of the daily traded $-amount is calculated (price*volume).
2) The slippage is set according to where the average falls in this table:
| 0 – $50K | 5.00% |
| $50K – $100K | 1.50% |
| $100K – $350K | 0.75% |
| $350K – $1M | 0.50% |
| $1M – $5M | 0.25% |
| $5M+ | 0.10% |
3) Add (1/ Price)% to the result from Step 2.
For example, Step 3 would add 1% to the slippage if the stock trades at $1, 0.1% if it trades at $10, etc.
For the following transaction on 5/28/13
|
Date |
Symbol |
Type |
Shares |
Trading Volume on day |
Price excluding slippage |
|
5/28/2013 |
NTAP | BUY |
105,694 |
16,258,450 |
36.75 |
the slippage percentage would be (0.10 + 1/36.75) = 0.127% of $36.75, amounting to about 5 cents per share. So the average price per share paid for this transaction is $36.80.
First published June 6, 2013 by dshort Advisor Perspective, iM-Best10+: A Portfolio Management System for High Returns
Hi, I’ve enjoyed your writings for several years.
I have to tell you that I occasionally imagine you as a Kepler, sifting through the data, looking for the magic number or formula that would reveal God, the universe, and everything. I know this isn’t a wholly positive image, but you have to admit Kepler is pretty good company. I want to be clear I have great respect and am grateful to you for sharing your work.
Two questions:
Why best 10? Did your back testing show anything special about holding 10 stocks?
I notice one of the stocks you hold, CF, has a substantially lower allocation than the others. Why is that?
Thanks!
I found that selecting 10 stocks seems to be the optimum number when you have a pool of over 400 stocks. I looked at only holding 5 stocks, but that reduces the return a few percent. This is because if one of them underperforms, then it makes a bigger differnce than if you held 10 stocks. Also holding 15 or 20 stocks provides lower returns, as I pointed out in the article.
The reason that CF has a lower allocation is that there was not enough money available at the time to buy more of them. Money comes from dividends and when you sell stocks.
Are you selling or renting this model on the Portfolio Simulations system. I would like to trade this portfolio and benefit from you knowledge. How do I do that.
(contact details deleted)
We are working out the best way to get the weekly buy and sell signals to the individual investor. Please be patient within a week or two we will have this sorted out.
When you run this as a portfolio system can you also put out trade signals for the 10+comp-IBH to let us know when we should be in cash
Yes, no problem. Currently we are far away from recession. When we get a recession signal from any of our 3 indicators we will be on high alert. Our recession indicators should signal this with a lead time of about 5 months.
Georg as always love to see you’re great work!
You mentioned that the Best10+Comp+IBH value had a max drawdown of -23.86%! What time frame was the drawdown and was it from stocks or the BVR model?
The maximum drawdown was from stocks early in October 2011, not bonds.
Hello Georg,
Great work as always.
As mentioned by ‘mrescoe’ I would too like to use your system and am patiently waiting to find out the “how” whenever you decide … & I hope it will be soon.
Thank you …
Stef.
Please refer to the notice inserted at the beginning of this article