
  |
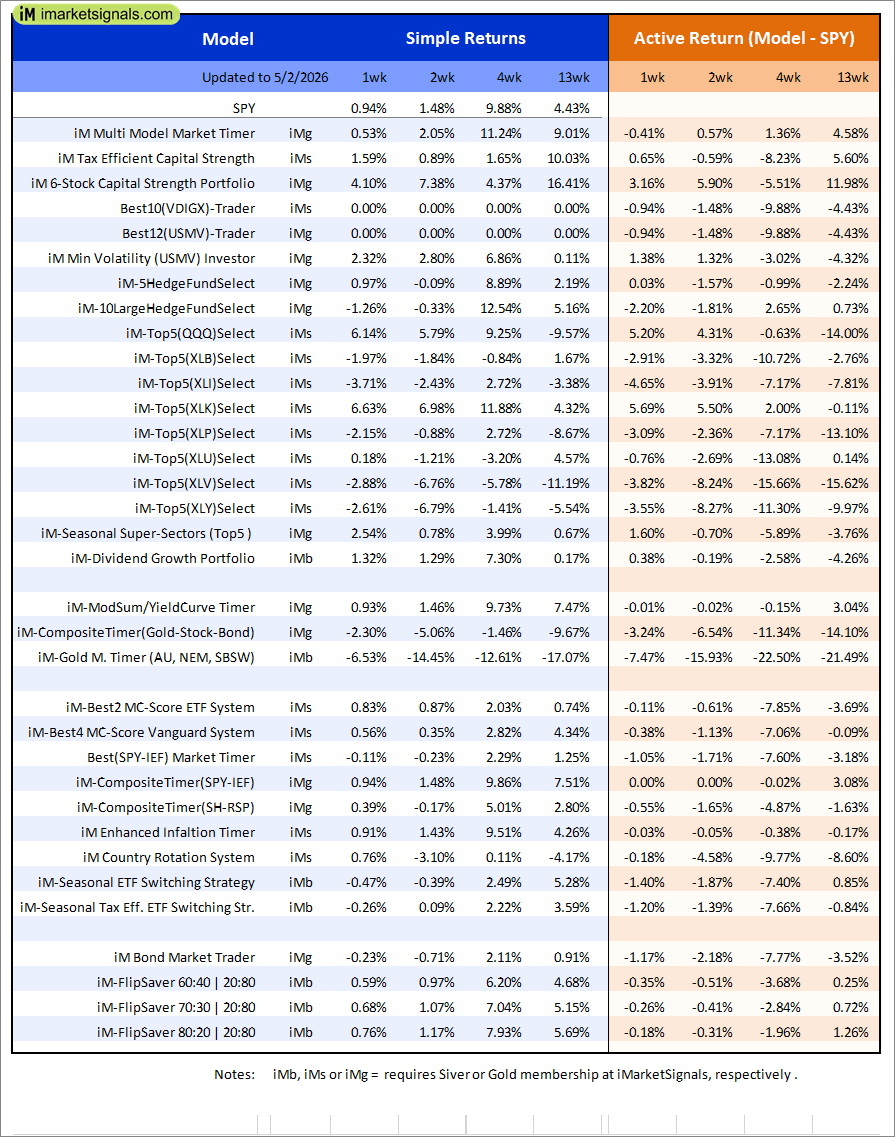
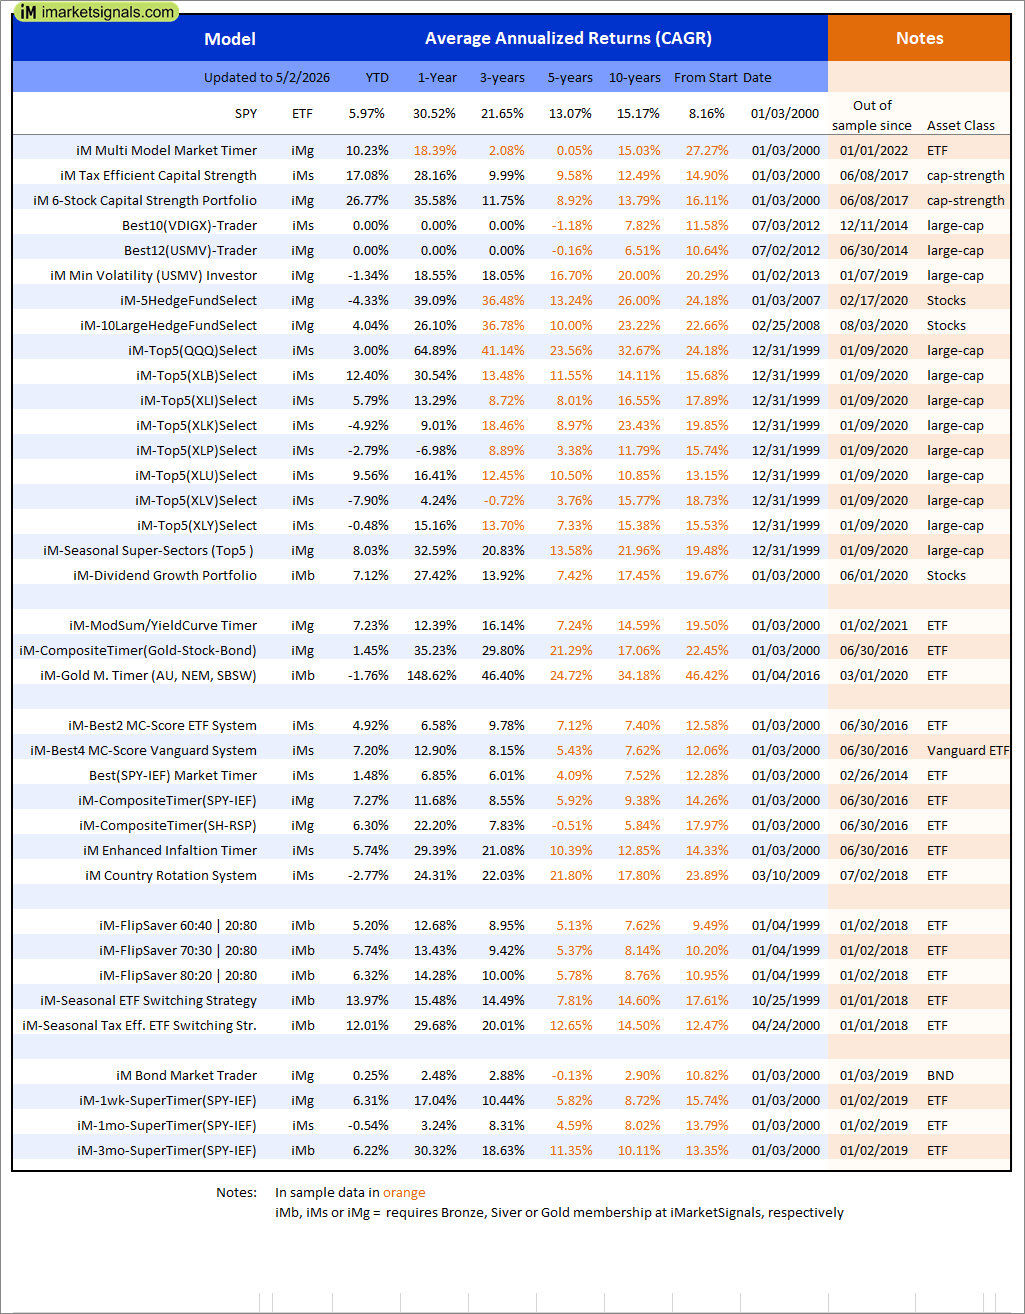
Out of sample performance summary of our models for the past 1, 2, 4 and 13 week periods. The active active return indicates how the models over- or underperformed the benchmark ETF SPY. Also the YTD, and the 1-, 3-, 5- and 10-year annualized returns are shown in the second table |
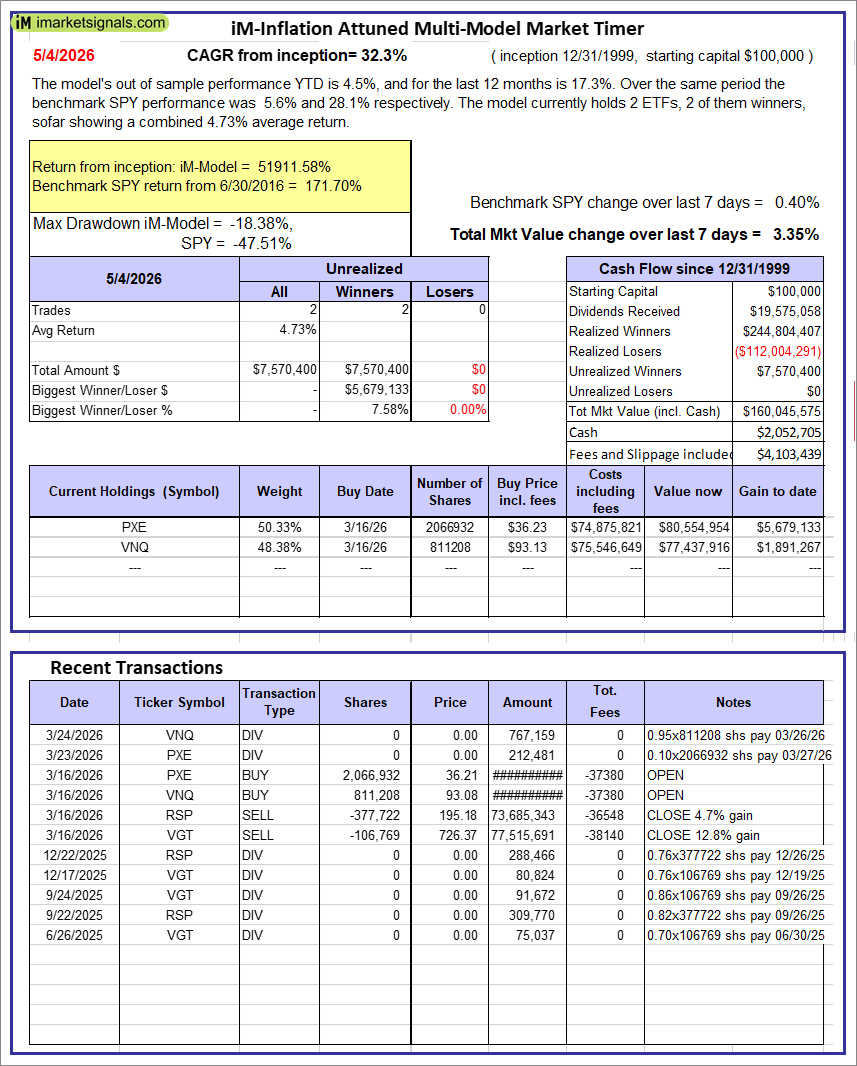 |
iM-Inflation Attuned Multi-Model Market Timer: The model’s out of sample performance YTD is 4.5%, and for the last 12 months is 17.3%. Over the same period the benchmark SPY performance was 5.6% and 28.1% respectively. Over the previous week the market value of the iM-Inflation Attuned Multi-Model Market Timer gained 3.35% at a time when SPY gained 0.40%. A starting capital of $100,000 at inception on 3/24/2017 would have grown to $160,045,575 which includes $2,052,705 cash and excludes $4,103,439 spent on fees and slippage. |
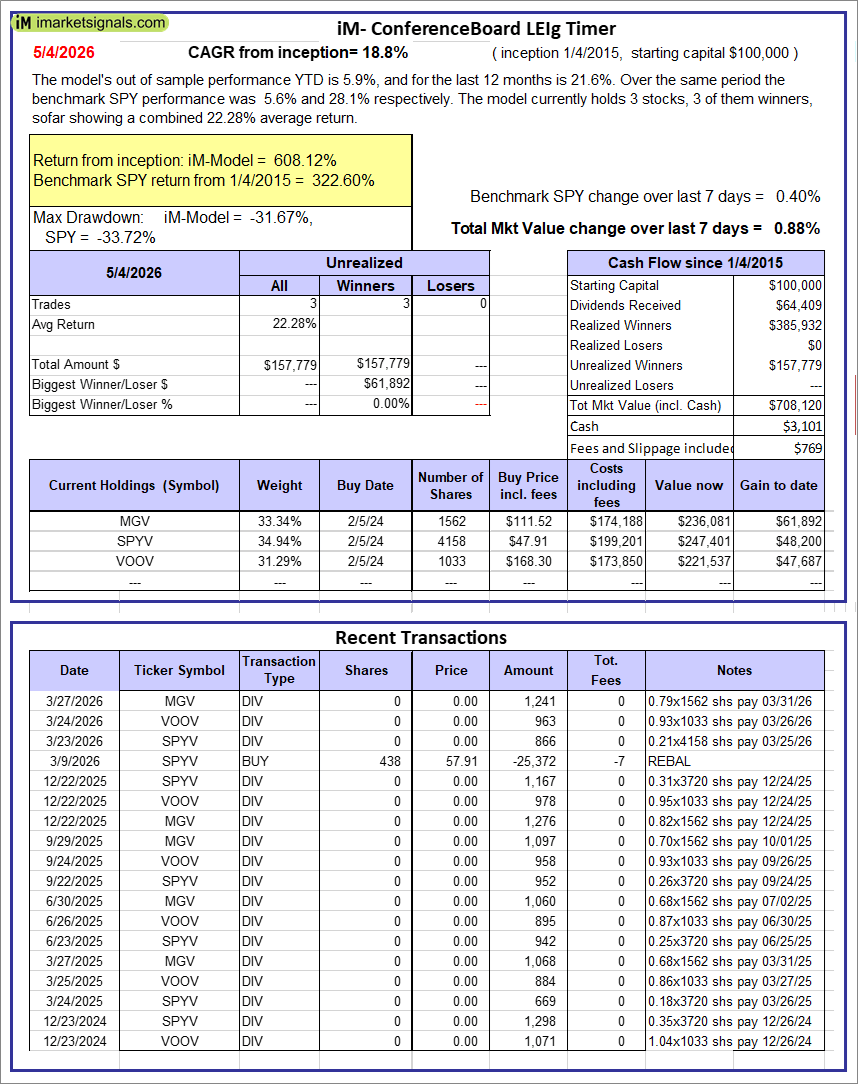 |
iM-Conference Board LEIg Timer: The model’s performance YTD is 14.3%, and for the last 12 months is 7.3%. Over the same period the benchmark SPY performance was 20.1% and 9.4% respectively. Over the previous week the market value of the iM-Conference Board LEIg Timer gained 0.88% at a time when SPY gained 0.40%. A starting capital of $100,000 at inception on 4/5/2017 would have grown to $708,120 which includes $3,101 cash and excludes $769 spent on fees and slippage. |
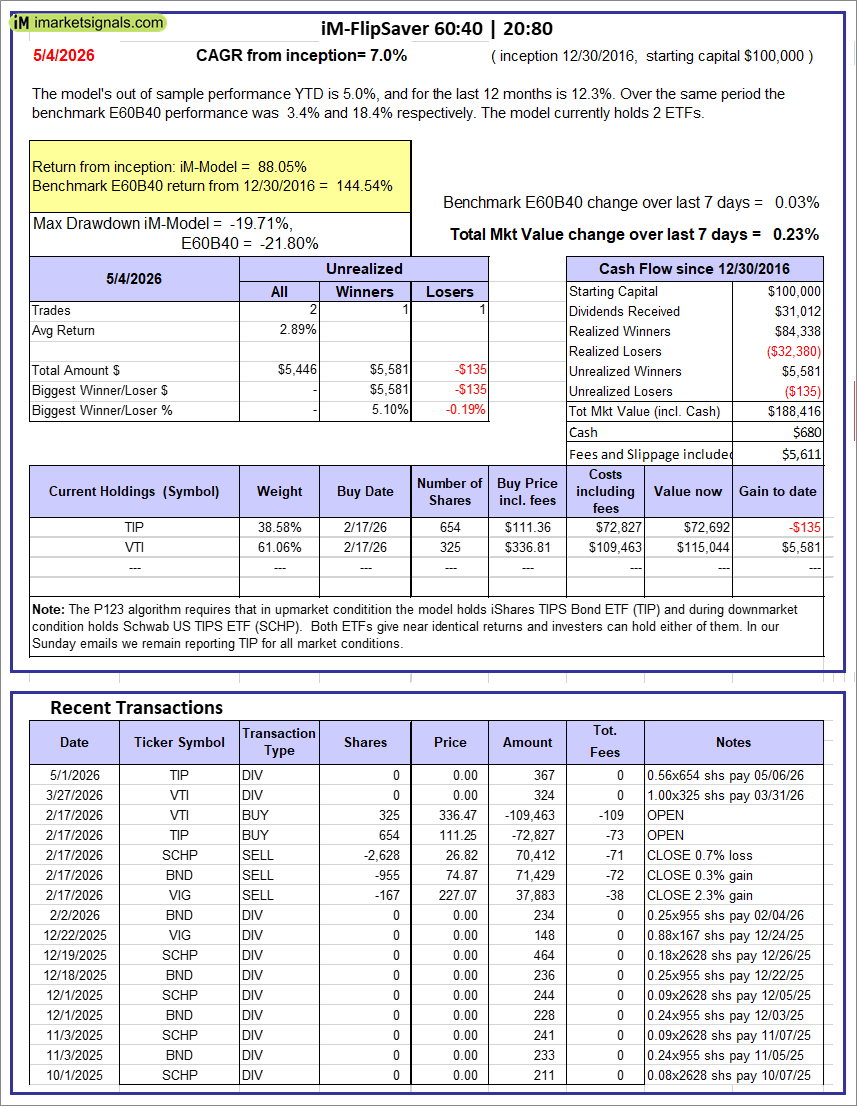 |
iM-FlipSaver 60:40 | 20:80 – 2017: The model’s out of sample performance YTD is 5.0%, and for the last 12 months is 12.3%. Over the same period the benchmark E60B40 performance was 3.4% and 18.4% respectively. Over the previous week the market value of iM-FlipSaver 80:20 | 20:80 gained 0.23% at a time when SPY gained 0.03%. A starting capital of $100,000 at inception on 7/16/2015 would have grown to $188,416 which includes $680 cash and excludes $5,611 spent on fees and slippage. |
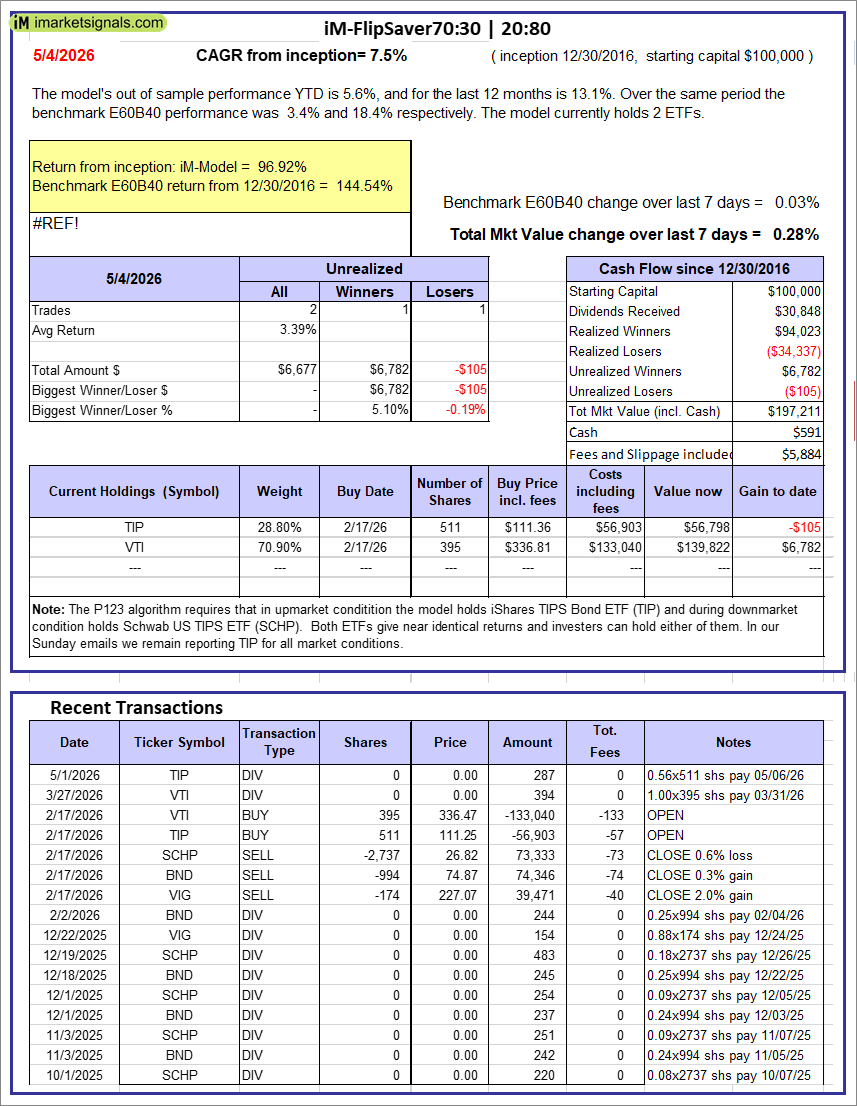 |
iM-FlipSaver 70:30 | 20:80 – 2017: The model’s out of sample performance YTD is 5.6%, and for the last 12 months is 13.1%. Over the same period the benchmark E60B40 performance was 3.4% and 18.4% respectively. Over the previous week the market value of iM-FlipSaver 70:30 | 20:80 gained 0.28% at a time when SPY gained 0.03%. A starting capital of $100,000 at inception on 7/15/2015 would have grown to $197,211 which includes $591 cash and excludes $5,884 spent on fees and slippage. |
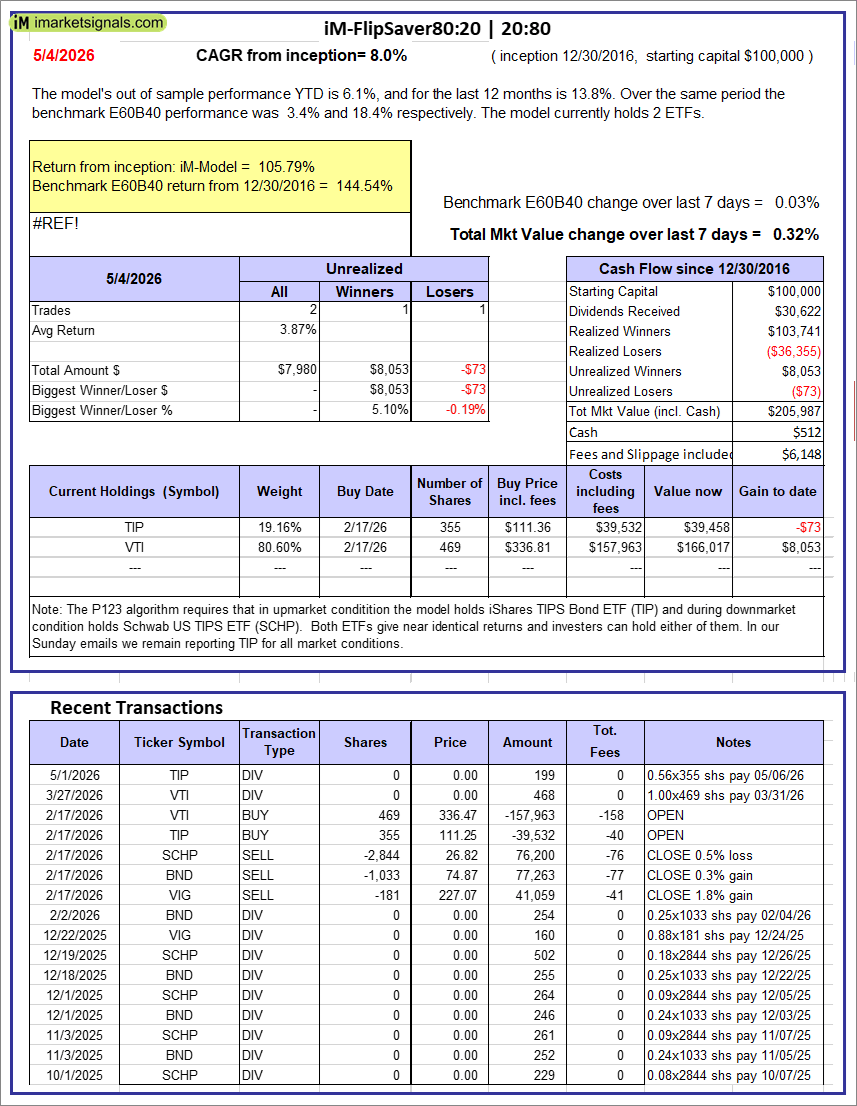 |
iM-FlipSaver 80:20 | 20:80 – 2017: The model’s out of sample performance YTD is 6.1%, and for the last 12 months is 13.8%. Over the same period the benchmark E60B40 performance was 3.4% and 18.4% respectively. Over the previous week the market value of iM-FlipSaver 80:20 | 20:80 gained 0.32% at a time when SPY gained 0.03%. A starting capital of $100,000 at inception on 1/2/2017 would have grown to $205,987 which includes $512 cash and excludes $6,148 spent on fees and slippage. |
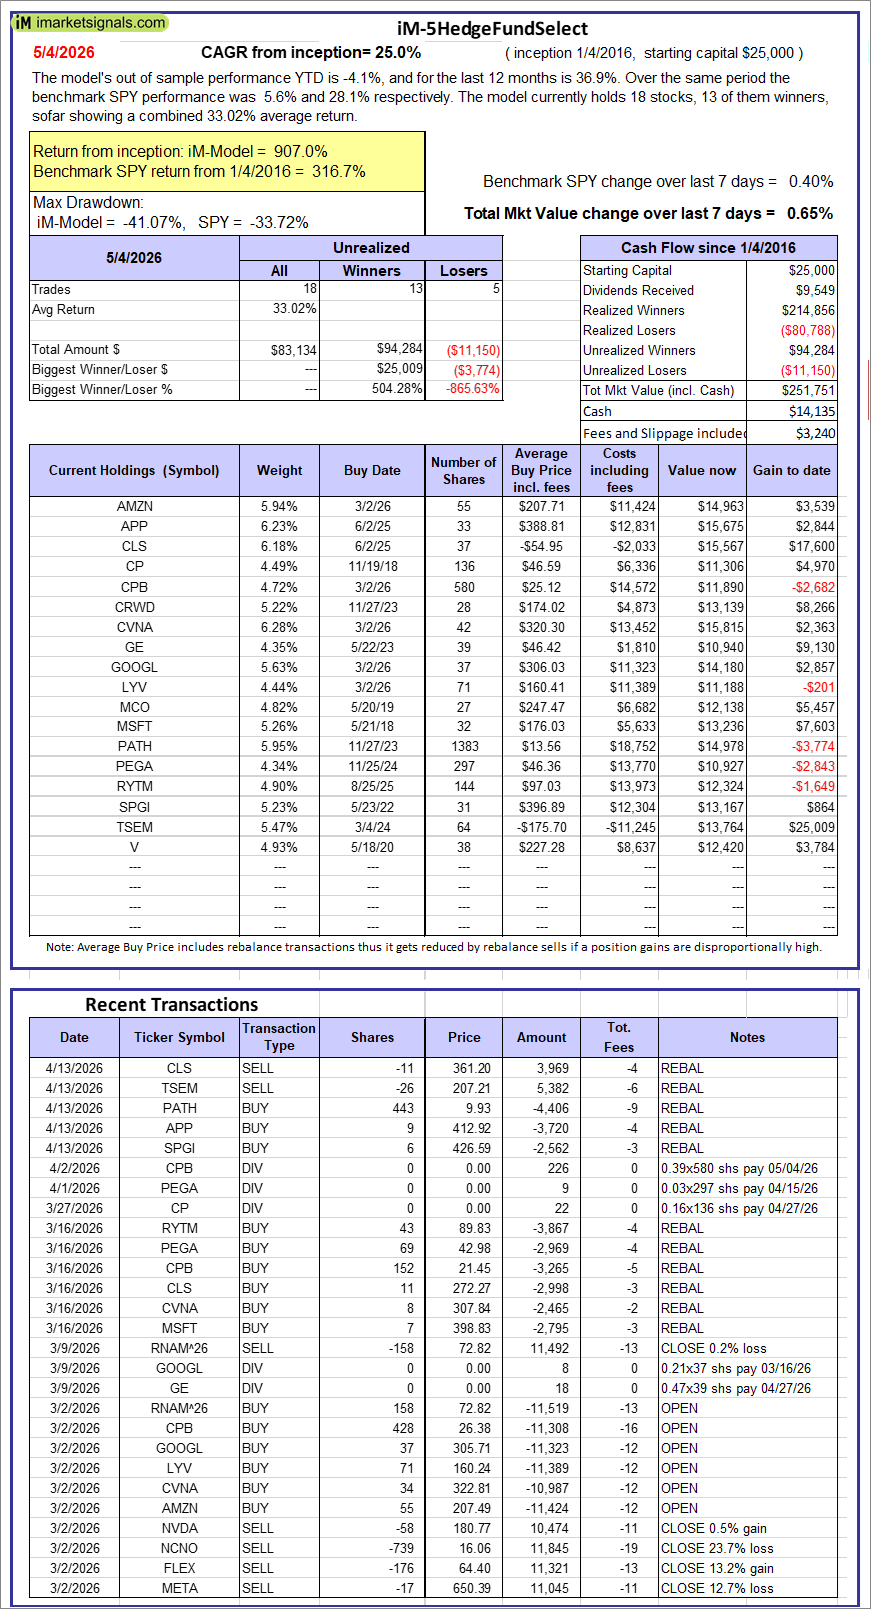 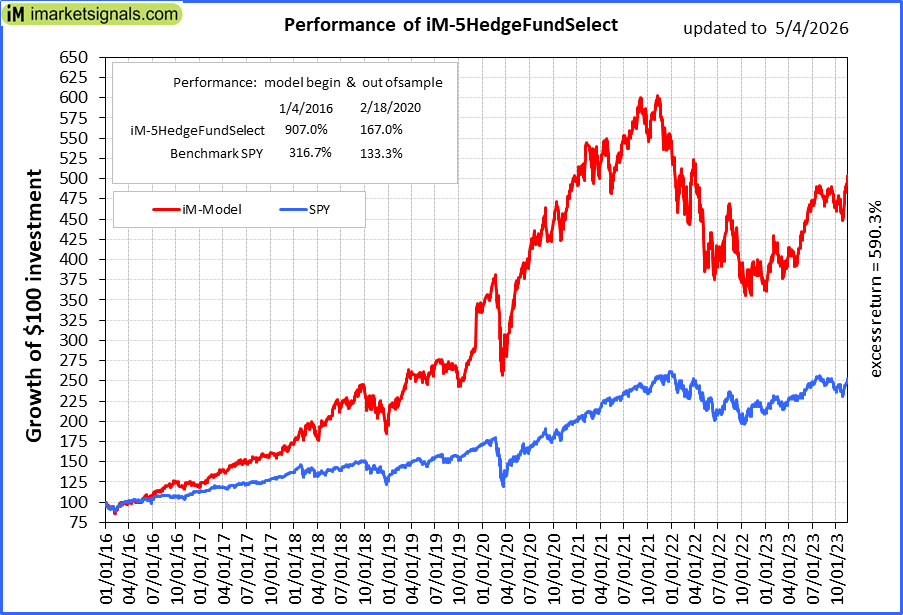 |
iM-5HedgeFundSelect: Since inception, on 1/5/2016, the model gained 907.01% while the benchmark SPY gained 316.68% over the same period. Over the previous week the market value of iM-5HedgeFundSelect gained 0.65% at a time when SPY gained 0.40%. A starting capital of $25,000 at inception on 1/5/2016 would have grown to $251,751 which includes $14,135 cash and excludes $3,240 spent on fees and slippage. |
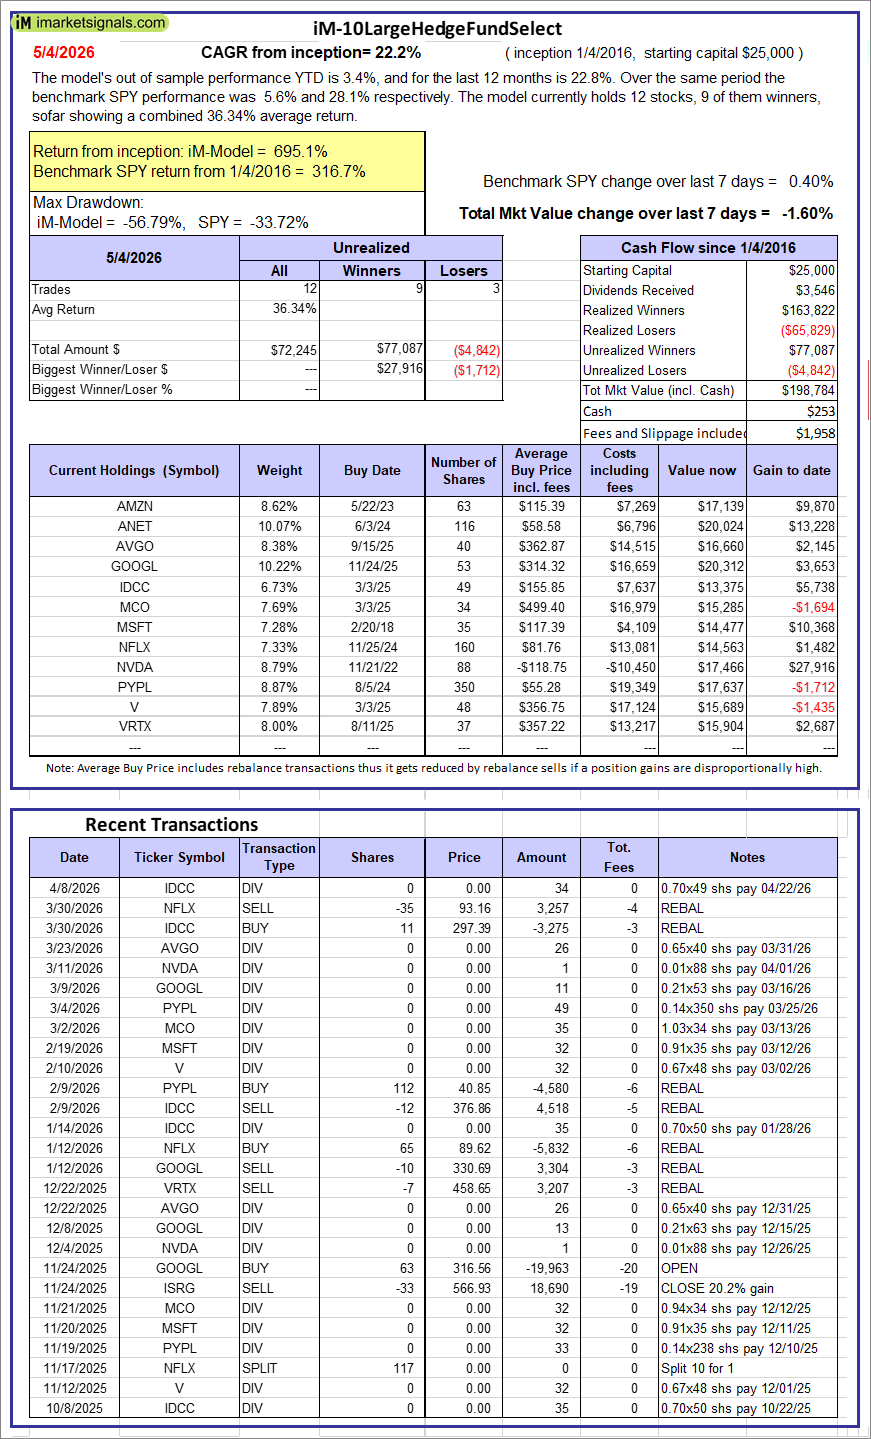 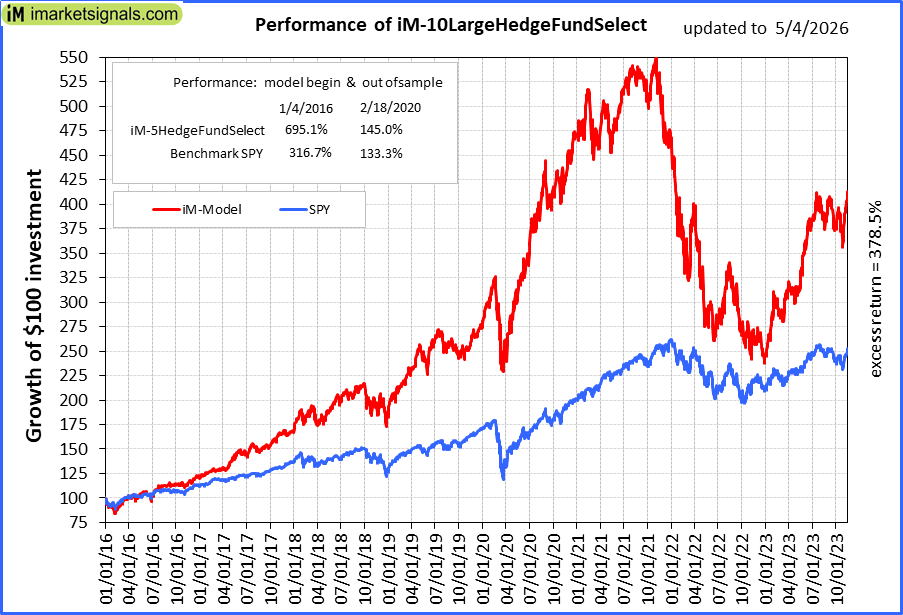 |
iM-10LargeHedgeFundSelect: Since inception, on 1/5/2016, the model gained 695.14% while the benchmark SPY gained 316.68% over the same period. Over the previous week the market value of iM-10LargeHedgeFundSelect gained -1.60% at a time when SPY gained 0.40%. A starting capital of $25,000 at inception on 1/5/2016 would have grown to $198,784 which includes $253 cash and excludes $1,958 spent on fees and slippage. |
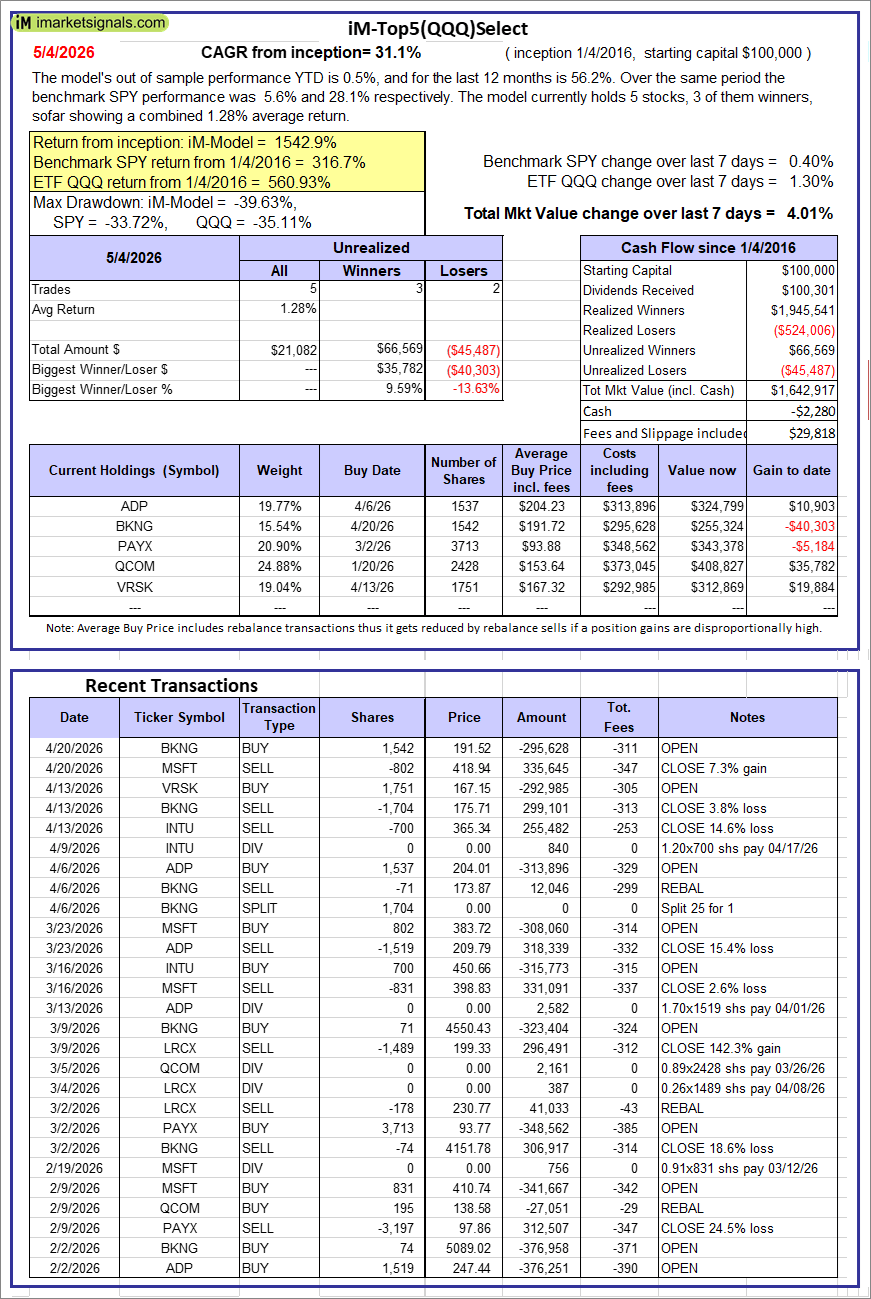 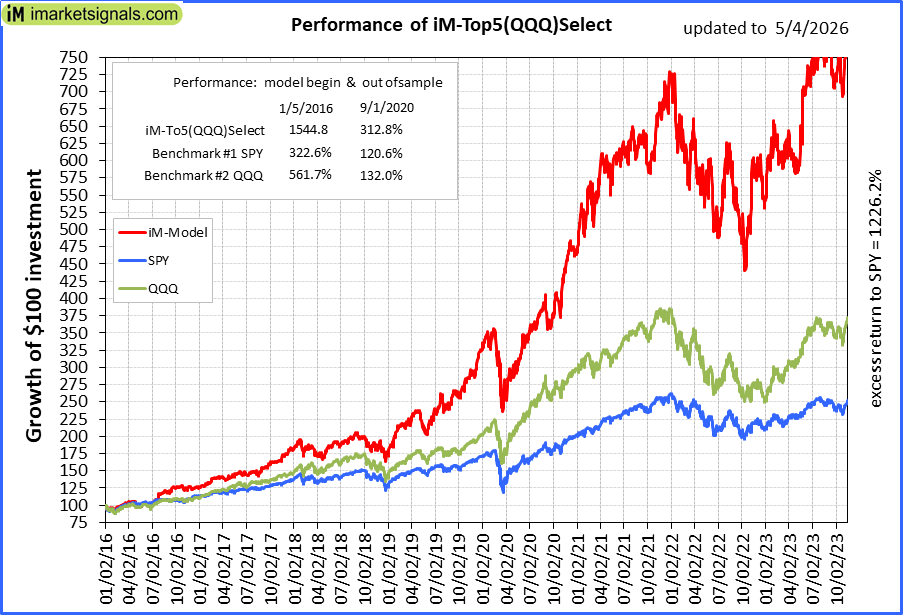 |
iM-Top5(QQQ)Select: Since inception, on 1/5/2016, the model gained 1542.92% while the benchmark SPY gained 316.68% over the same period. Over the previous week the market value of iM-Top5(QQQ)Select gained 4.01% at a time when SPY gained 0.40%. A starting capital of $100,000 at inception on 1/5/2016 would have grown to $1,642,917 which includes -$2,280 cash and excludes $29,818 spent on fees and slippage. |
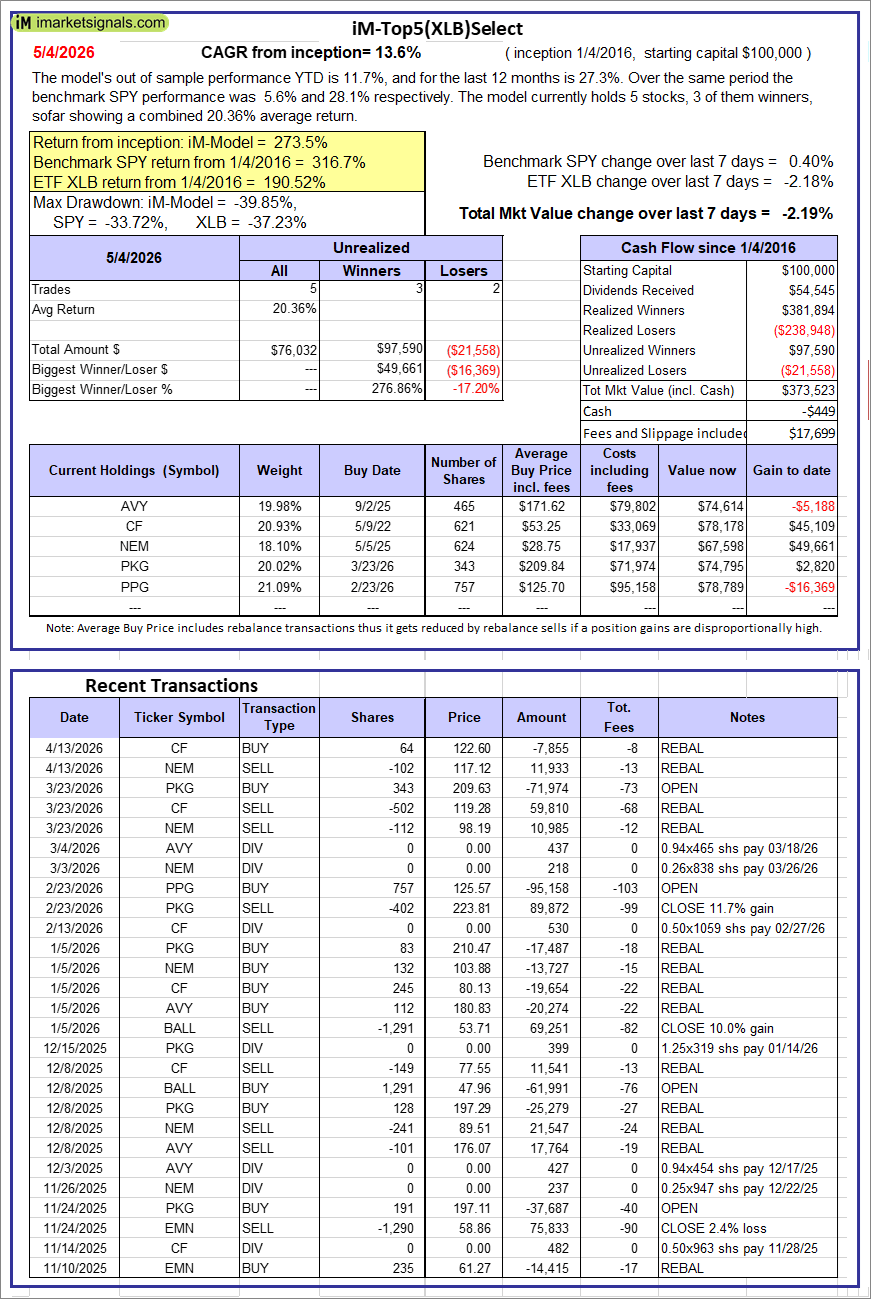 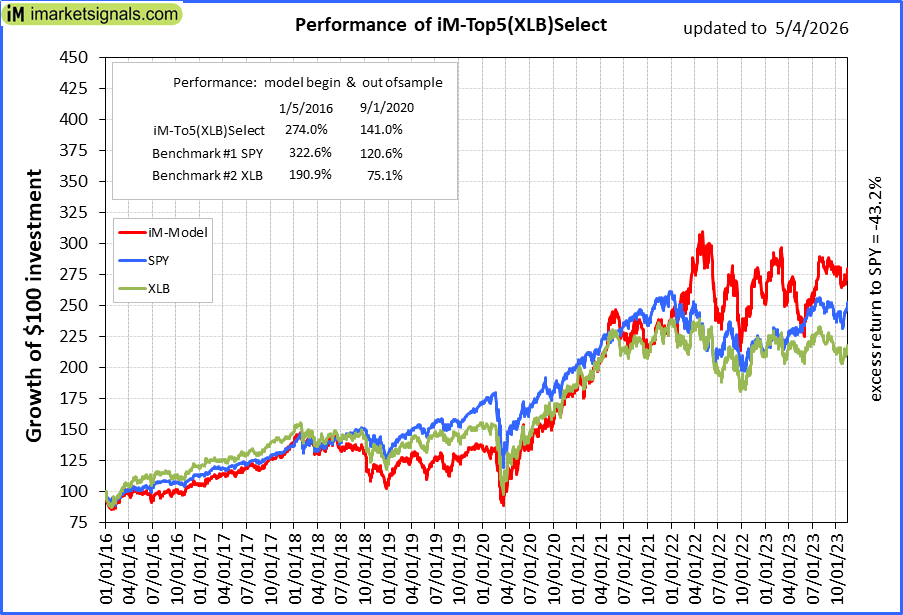 |
iM-Top5(XLB)Select: Since inception, on 1/5/2016, the model gained 273.52% while the benchmark SPY gained 316.68% over the same period. Over the previous week the market value of iM-Top5(XLB)Select gained -2.19% at a time when SPY gained 0.40%. A starting capital of $100,000 at inception on 1/5/2016 would have grown to $373,523 which includes -$449 cash and excludes $17,699 spent on fees and slippage. |
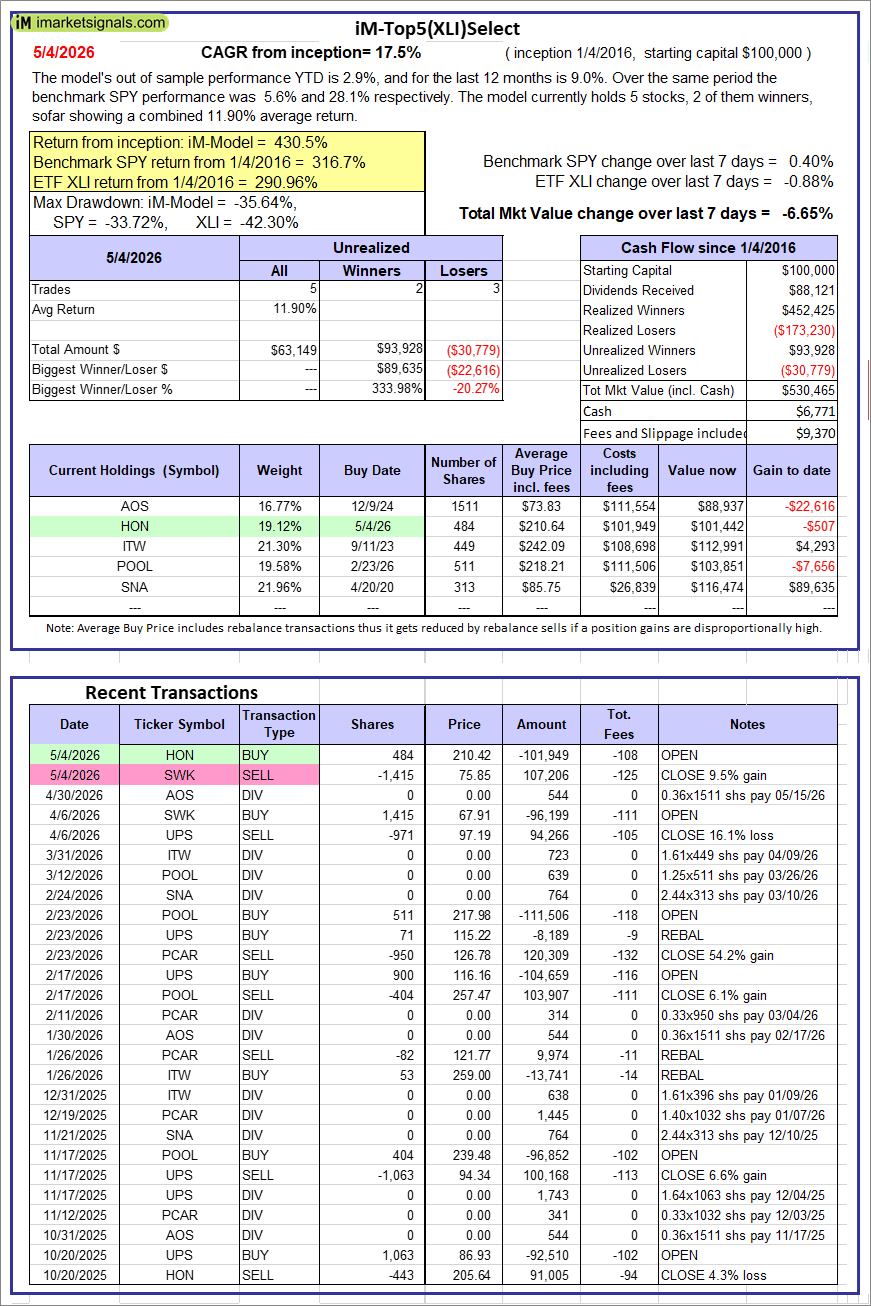 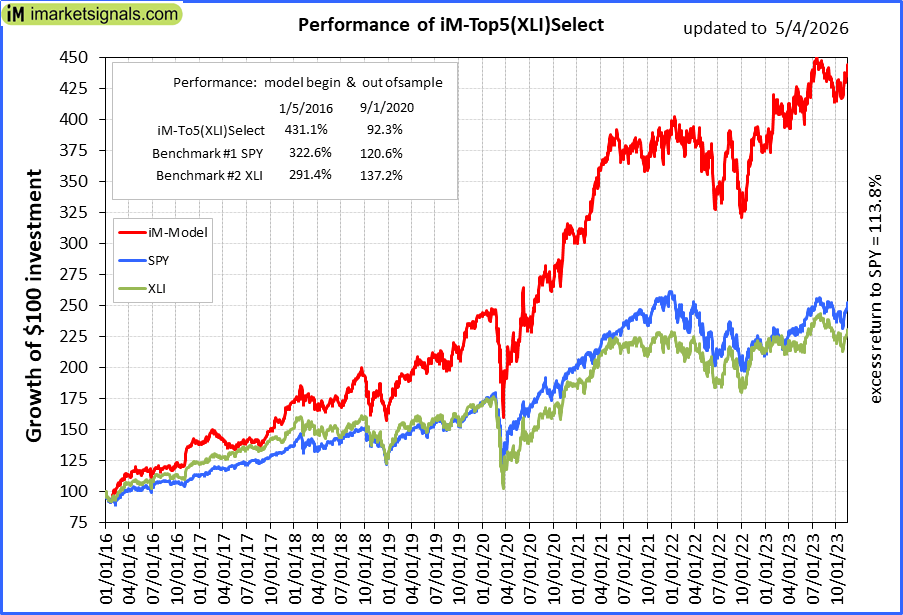 |
iM-Top5(XLI)Select: Since inception, on 1/5/2016, the model gained 430.47% while the benchmark SPY gained 316.68% over the same period. Over the previous week the market value of iM-Top5(XLI)Select gained -6.65% at a time when SPY gained 0.40%. A starting capital of $100,000 at inception on 1/5/2016 would have grown to $530,465 which includes $6,771 cash and excludes $9,370 spent on fees and slippage. |
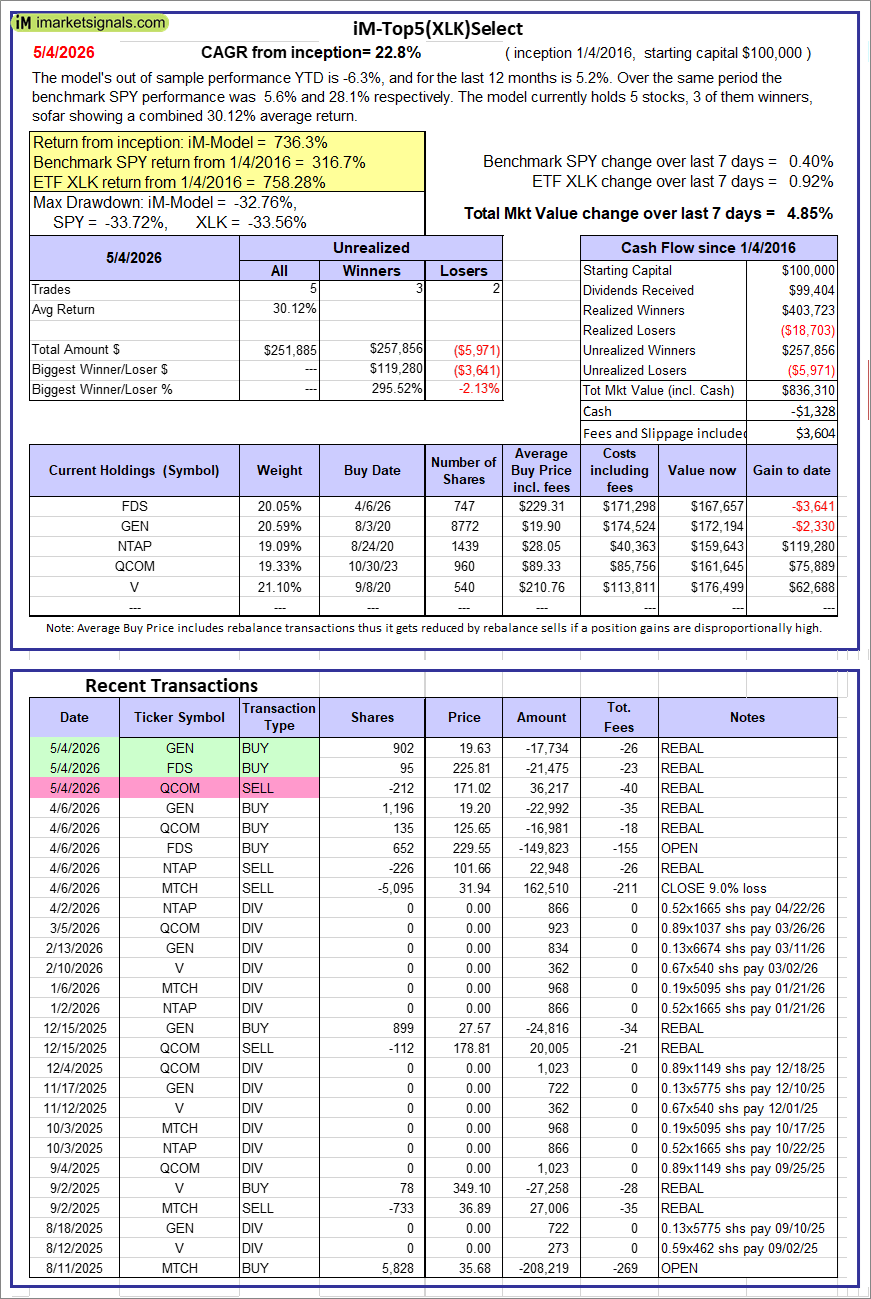 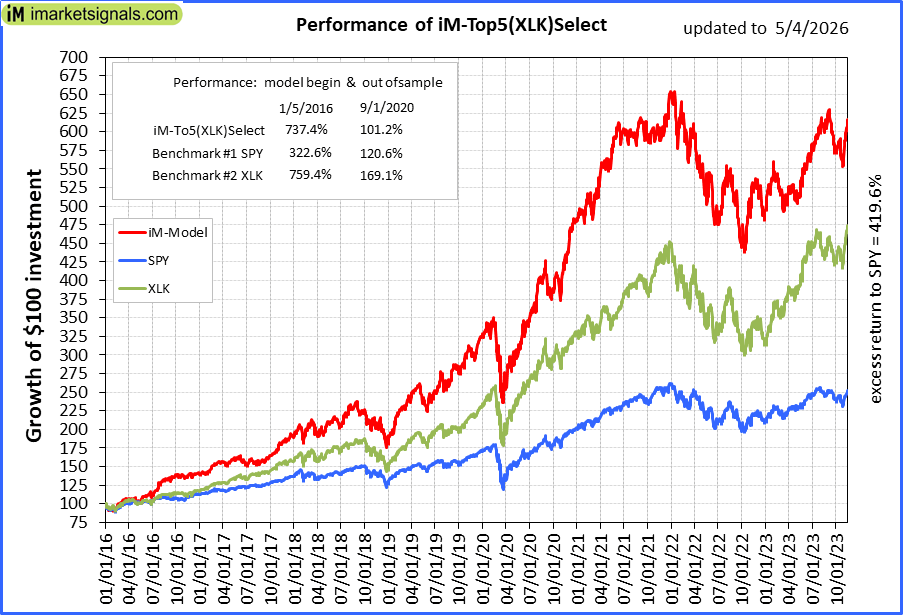 |
iM-Top5(XLK)Select: Since inception, on 1/5/2016, the model gained 736.31% while the benchmark SPY gained 316.68% over the same period. Over the previous week the market value of iM-Top5(XLK)Select gained 4.85% at a time when SPY gained 0.40%. A starting capital of $100,000 at inception on 1/5/2016 would have grown to $836,310 which includes -$1,328 cash and excludes $3,604 spent on fees and slippage. |
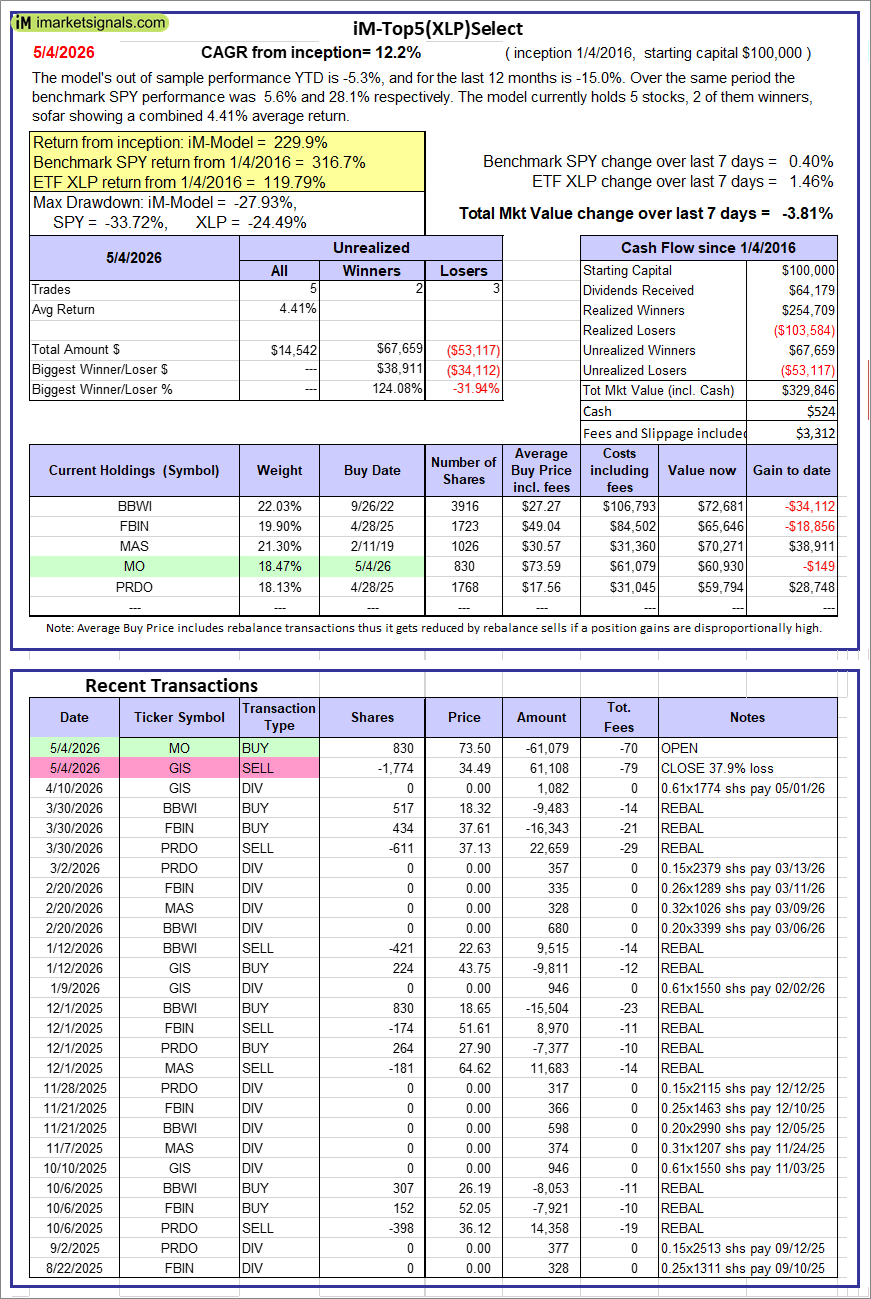 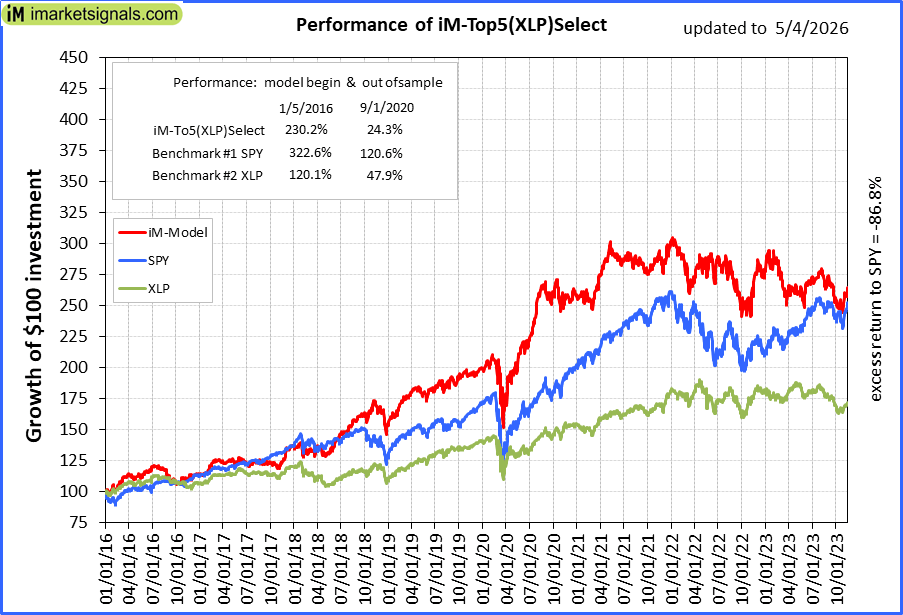 |
iM-Top5(XLP)Select: Since inception, on 1/5/2016, the model gained 229.85% while the benchmark SPY gained 316.68% over the same period. Over the previous week the market value of iM-Top5(XLP)Select gained -3.81% at a time when SPY gained 0.40%. A starting capital of $100,000 at inception on 1/5/2016 would have grown to $329,846 which includes $524 cash and excludes $3,312 spent on fees and slippage. |
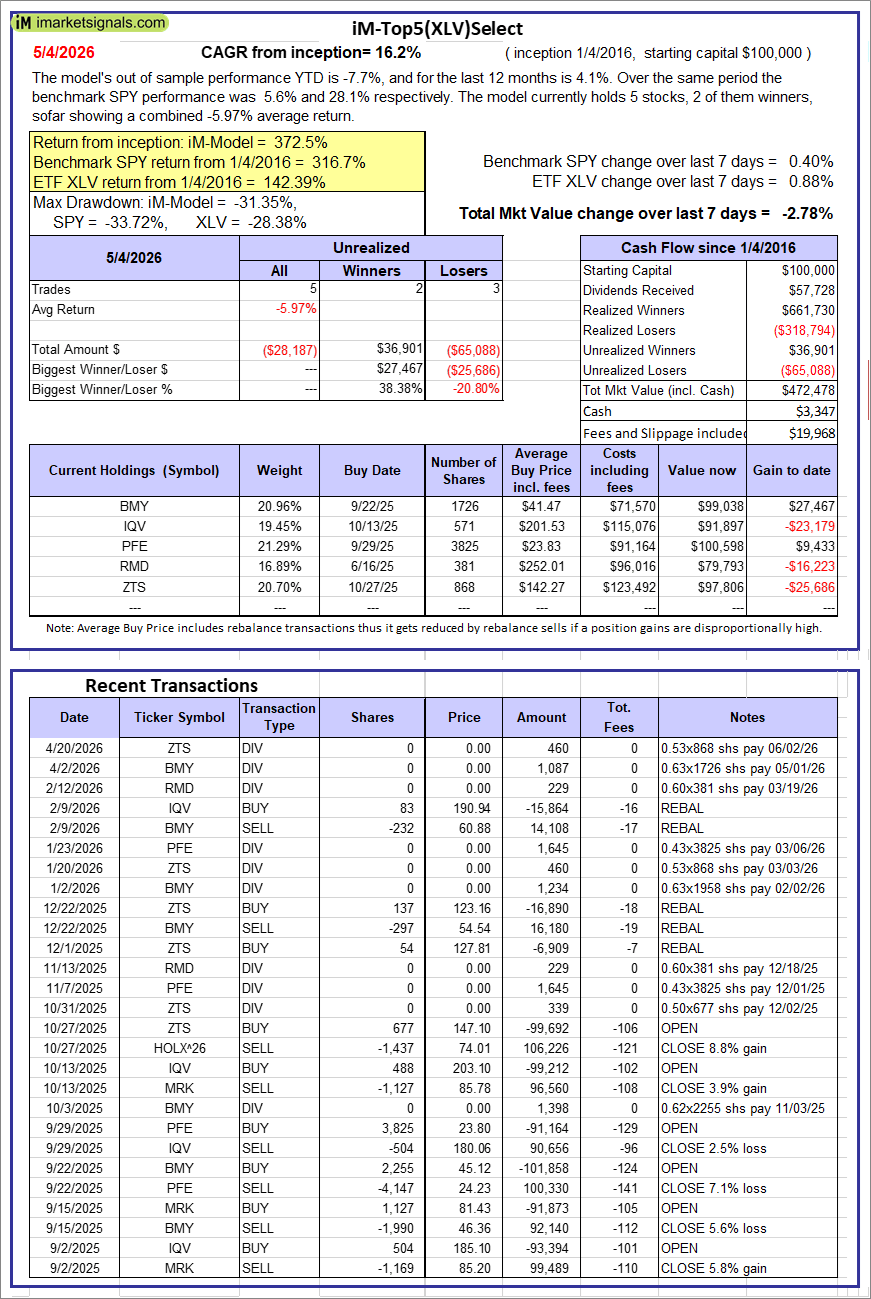 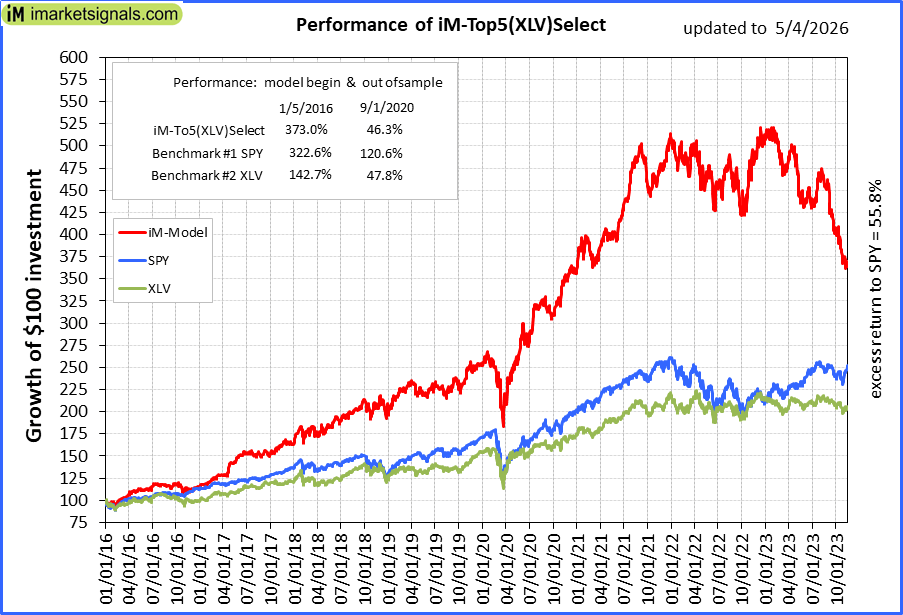 |
iM-Top5(XLV)Select: Since inception, on 1/5/2016, the model gained 372.48% while the benchmark SPY gained 316.68% over the same period. Over the previous week the market value of iM-Top5(XLV)Select gained -2.78% at a time when SPY gained 0.40%. A starting capital of $100,000 at inception on 1/5/2016 would have grown to $472,478 which includes $3,347 cash and excludes $19,968 spent on fees and slippage. |
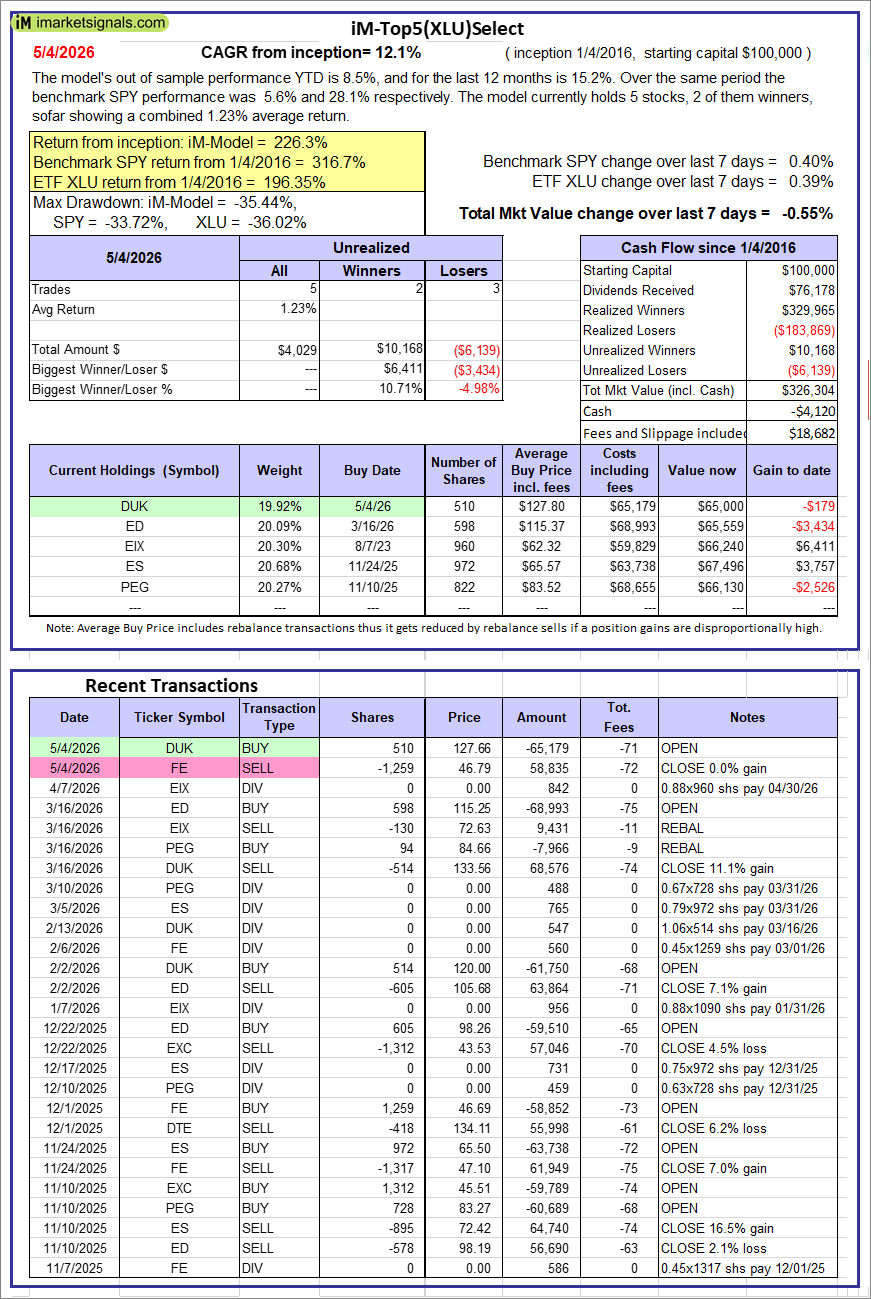 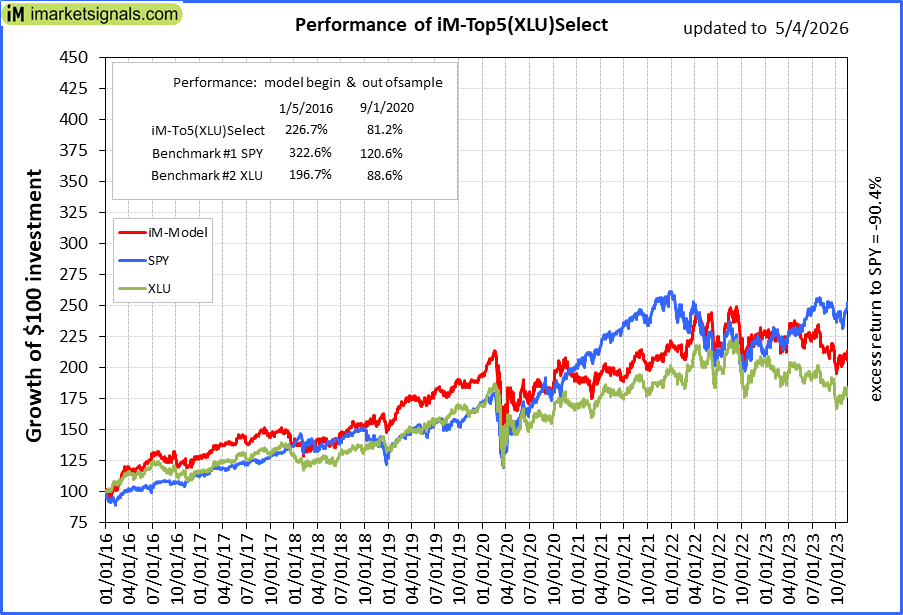 |
iM-Top5(XLU)Select: Since inception, on 1/5/2016, the model gained 226.30% while the benchmark SPY gained 316.68% over the same period. Over the previous week the market value of iM-Top5(XLU)Select gained -0.55% at a time when SPY gained 0.40%. A starting capital of $100,000 at inception on 1/5/2016 would have grown to $326,304 which includes -$4,120 cash and excludes $18,682 spent on fees and slippage. |
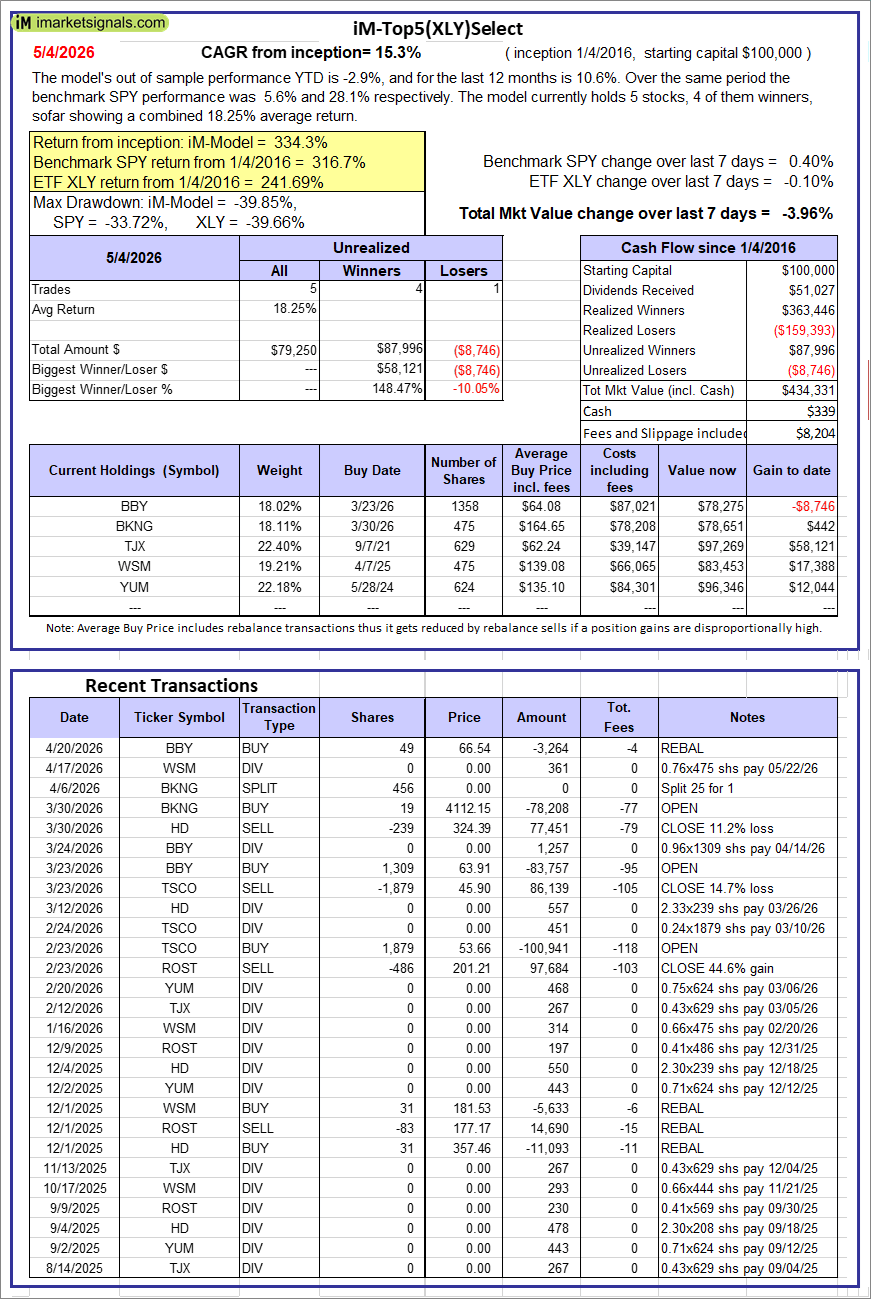 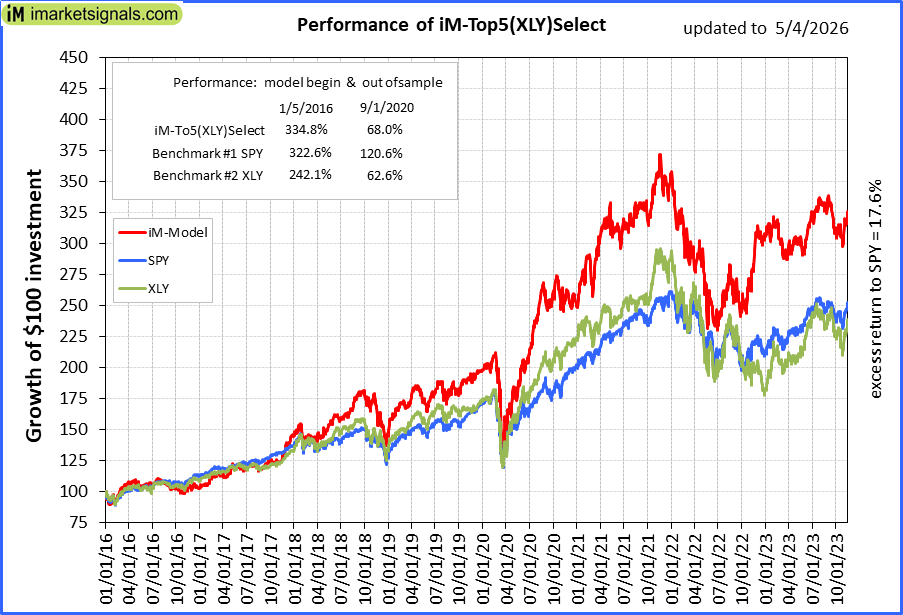 |
iM-Top5(XLY)Select: Since inception, on 1/5/2016, the model gained 334.33% while the benchmark SPY gained 316.68% over the same period. Over the previous week the market value of iM-Top5(XLY)Select gained -3.96% at a time when SPY gained 0.40%. A starting capital of $100,000 at inception on 1/5/2016 would have grown to $434,331 which includes $339 cash and excludes $8,204 spent on fees and slippage. |
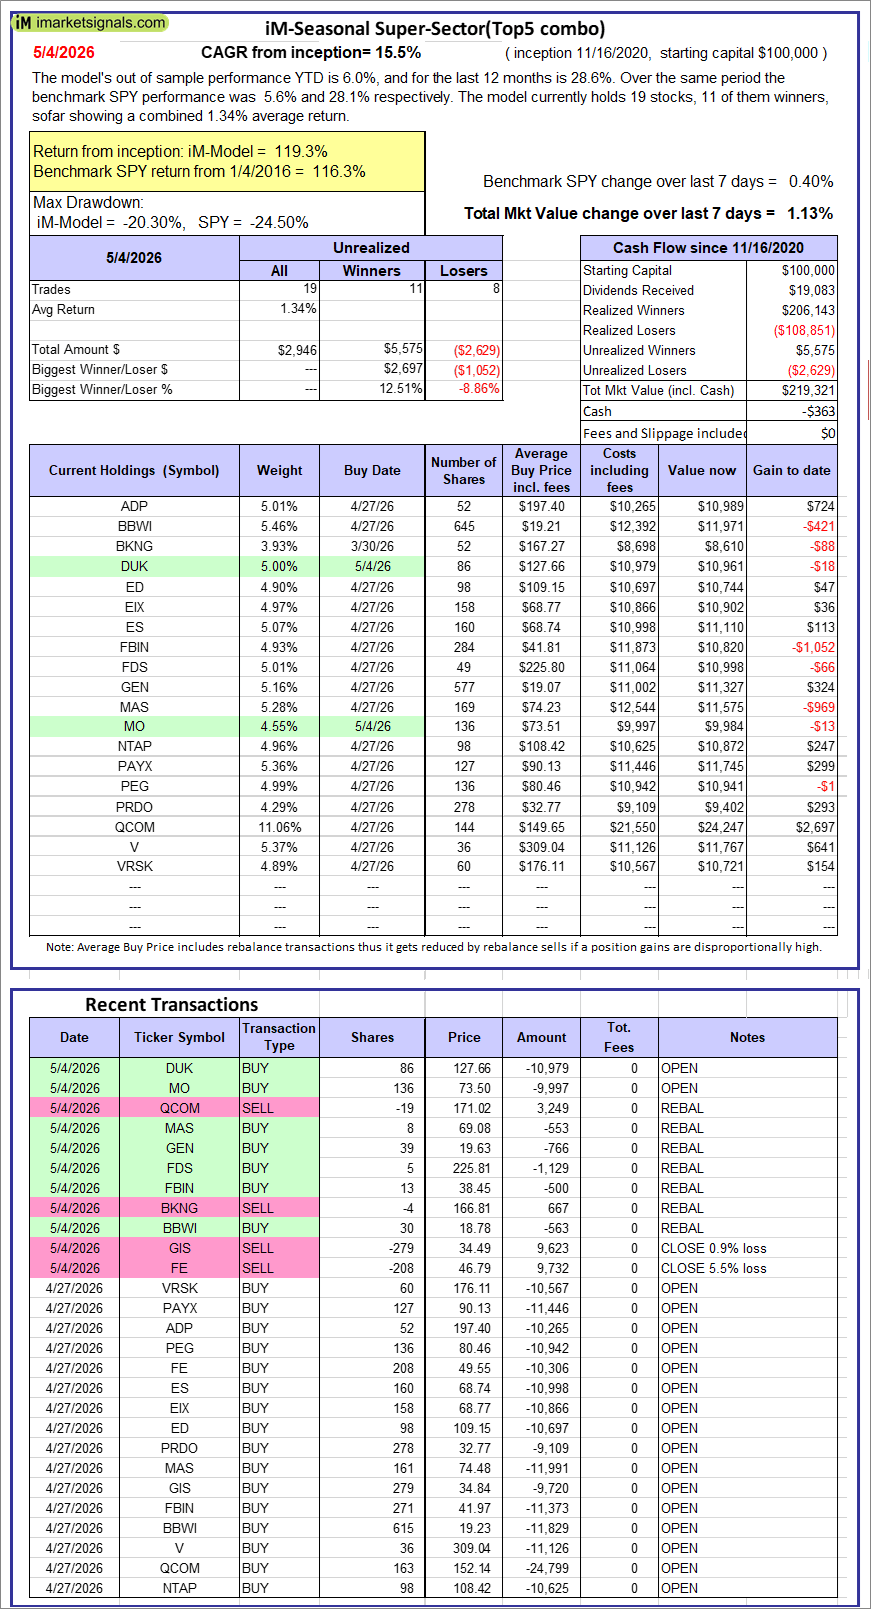 |
iM-Seasonal Super-Sectors (Top5 combo) : Since inception, on 11/17/2020, the model gained 119.32% while the benchmark SPY gained 116.30% over the same period. Over the previous week the market value of iM-Seasonal Super-Sectors (Top5 combo) gained 1.13% at a time when SPY gained 0.40%. A starting capital of $100,000 at inception on 11/17/2020 would have grown to $219,321 which includes -$363 cash and excludes $00 spent on fees and slippage. |
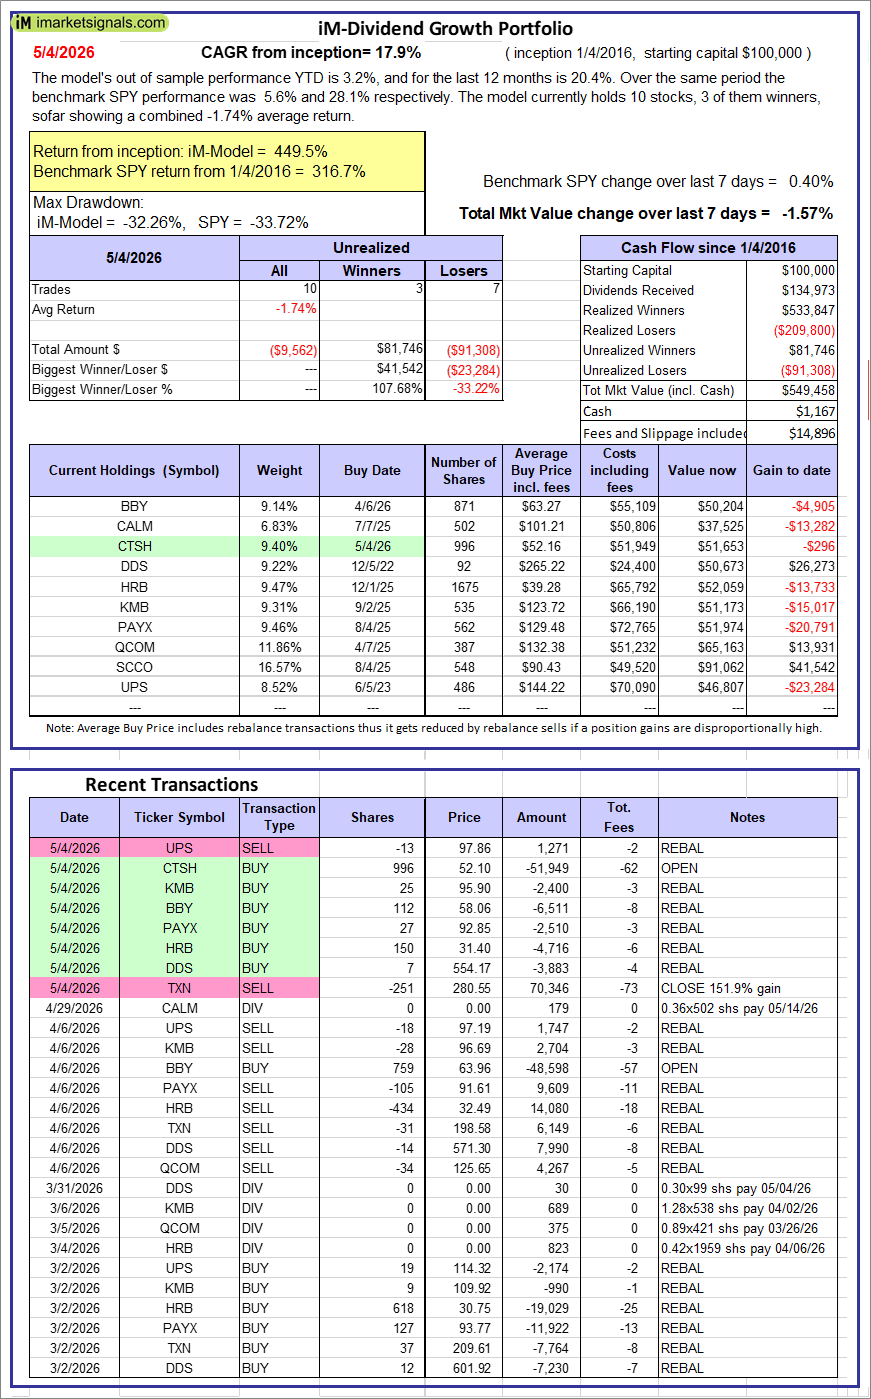 |
iM-Dividend Growth Portfolio: The model’s out of sample performance YTD is 3.2%, and for the last 12 months is 20.4%. Over the same period the benchmark SPY performance was 5.6% and 28.1% respectively. Over the previous week the market value of the iM-Dividend Growth Portfolio gained -1.57% at a time when SPY gained 0.40%. A starting capital of $100,000 at inception on 6/30/2016 would have grown to $549,458 which includes $1,167 cash and excludes $14,896 spent on fees and slippage. |
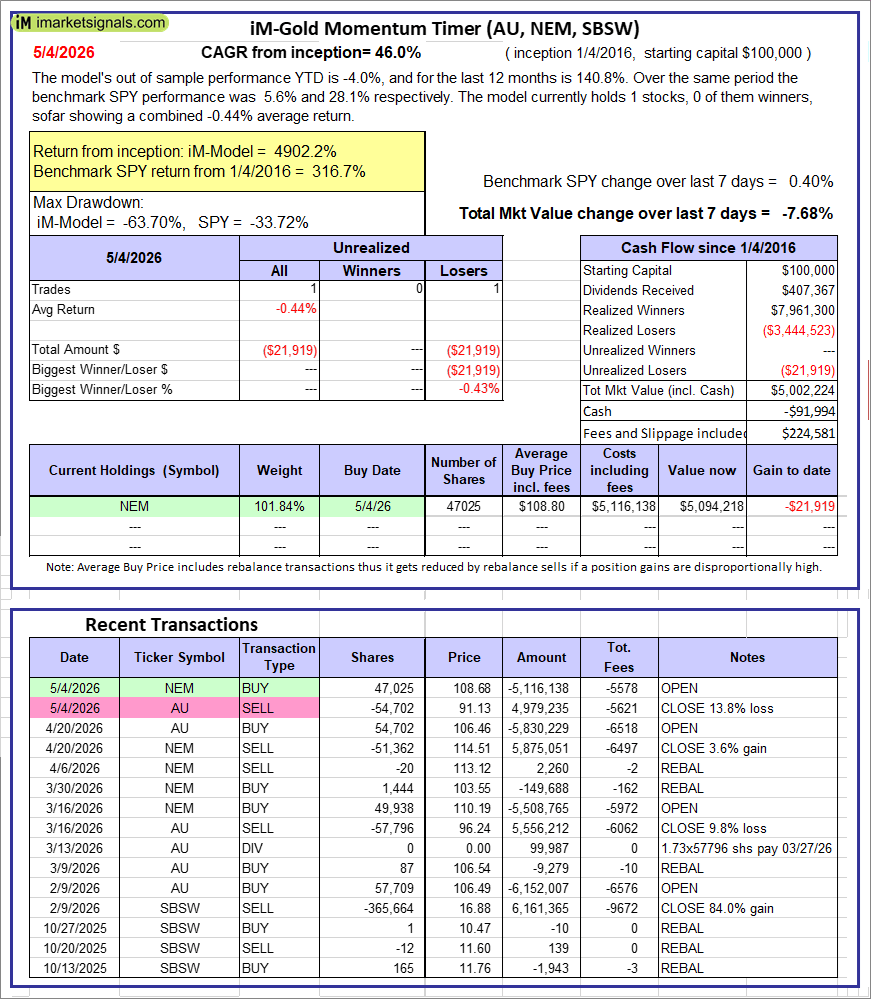 |
iM-Gold Momentum Timer (AU, NEM, SBSW): The model’s out of sample performance YTD is -4.0%, and for the last 12 months is 140.8%. Over the same period the benchmark SPY performance was 5.6% and 28.1% respectively. Over the previous week the market value of iM-Gold Momentum Timer (AU, NEM, SBSW) gained -7.68% at a time when SPY gained 0.40%. A starting capital of $100,000 at inception on 6/30/2016 would have grown to -$91,994 which includes $224,581 cash and excludes Gain to date spent on fees and slippage. |
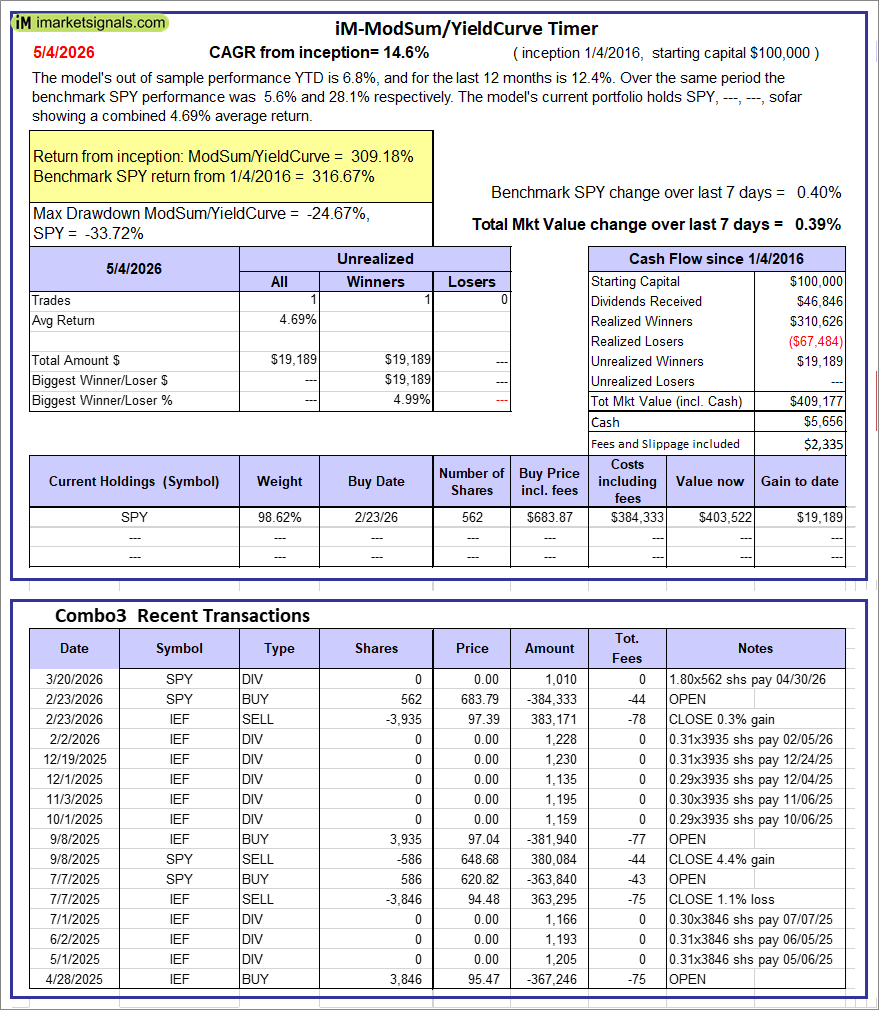 |
iM-ModSum/YieldCurve Timer: The model’s out of sample performance YTD is 6.8%, and for the last 12 months is 12.4%. Over the same period the benchmark SPY performance was 5.6% and 28.1% respectively. Over the previous week the market value of iM-PortSum/YieldCurve Timer gained 0.39% at a time when SPY gained 0.40%. A starting capital of $100,000 at inception on 1/1/2016 would have grown to $409,177 which includes $5,656 cash and excludes $2,335 spent on fees and slippage. |
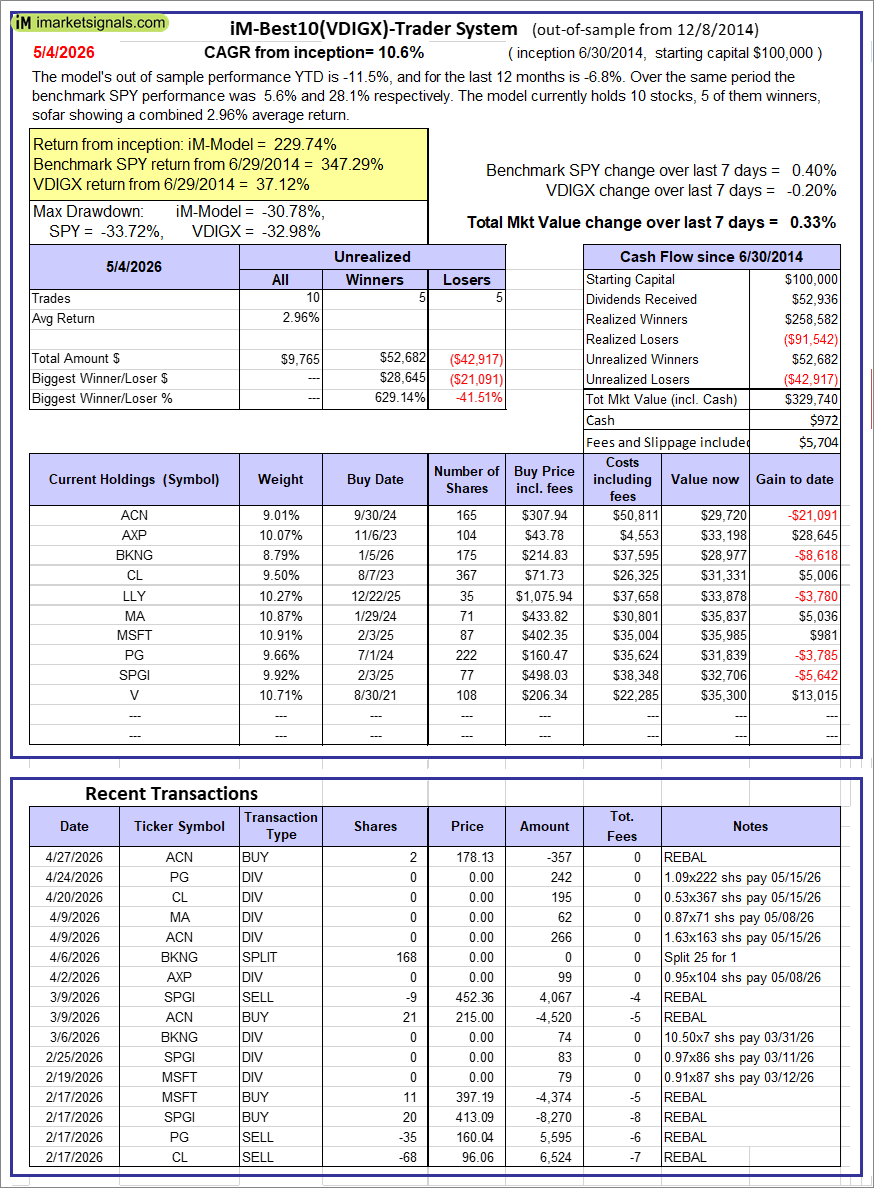 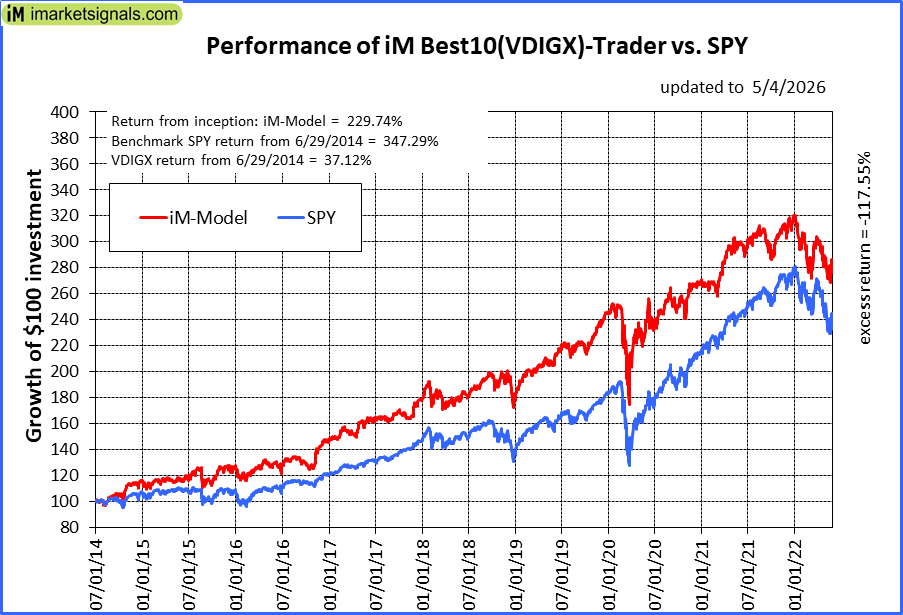 |
iM-Best10(VDIGX)-Trader: The model’s out of sample performance YTD is -11.5%, and for the last 12 months is -6.8%. Over the same period the benchmark SPY performance was 5.6% and 28.1% respectively. Since inception, on 7/1/2014, the model gained 229.74% while the benchmark SPY gained 347.29% and VDIGX gained 37.12% over the same period. Over the previous week the market value of iM-Best10(VDIGX) gained 0.33% at a time when SPY gained 0.40%. A starting capital of $100,000 at inception on 7/1/2014 would have grown to $329,740 which includes $972 cash and excludes $5,704 spent on fees and slippage. |
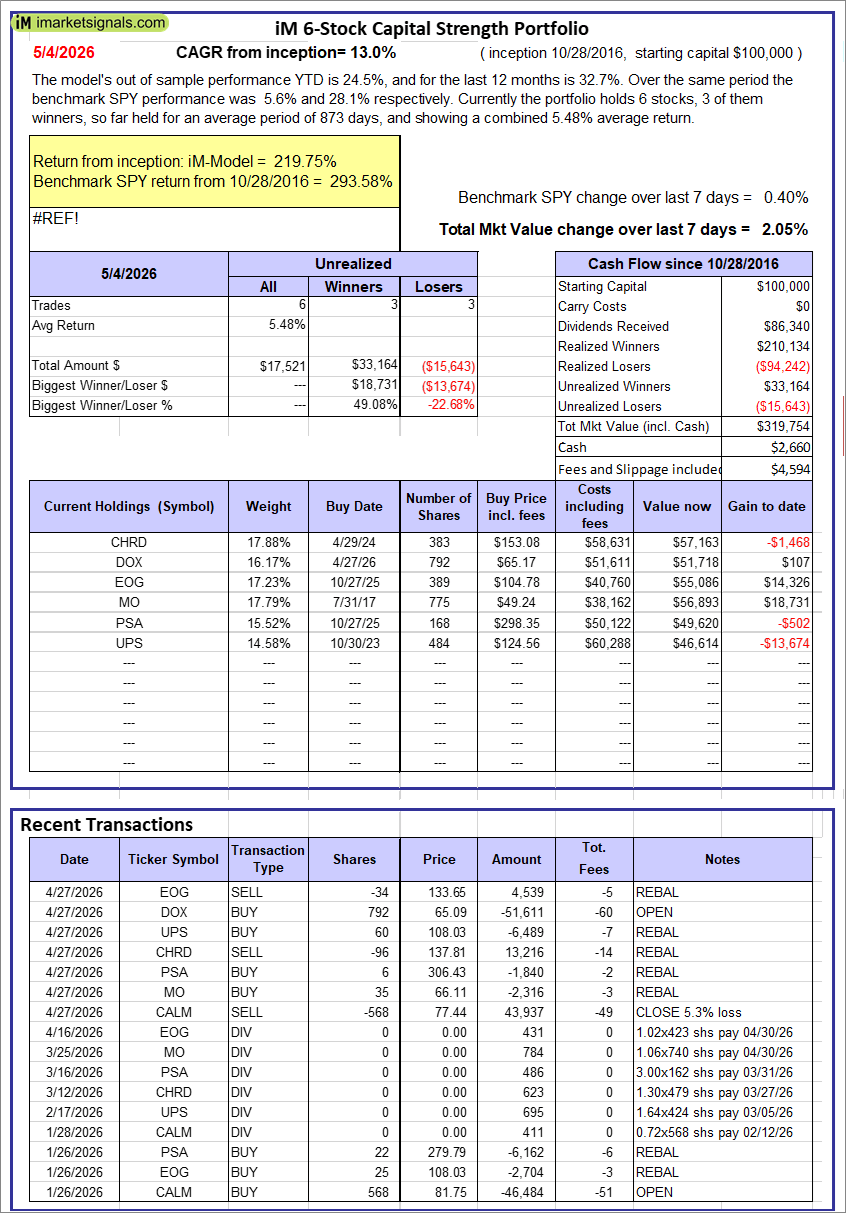 |
iM 6-Stock Capital Strength Portfolio: The model’s out of sample performance YTD is 24.5%, and for the last 12 months is 32.7%. Over the same period the benchmark SPY performance was 5.6% and 28.1% respectively. Over the previous week the market value of the iM 6-Stock Capital Strength Portfolio gained 2.05% at a time when SPY gained 0.40%. A starting capital of $100,000 at inception on 10/28/2016 would have grown to $319,754 which includes $2,660 cash and excludes $4,594 spent on fees and slippage. |
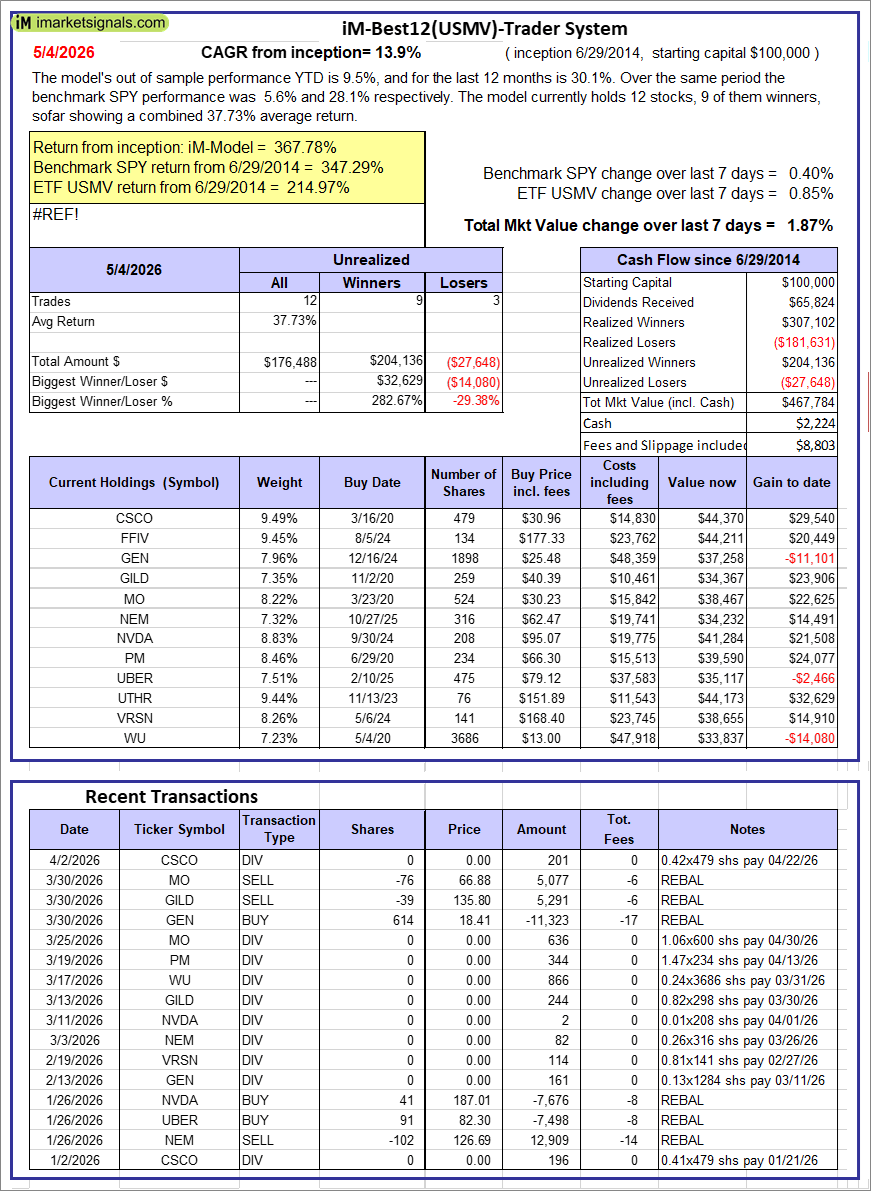 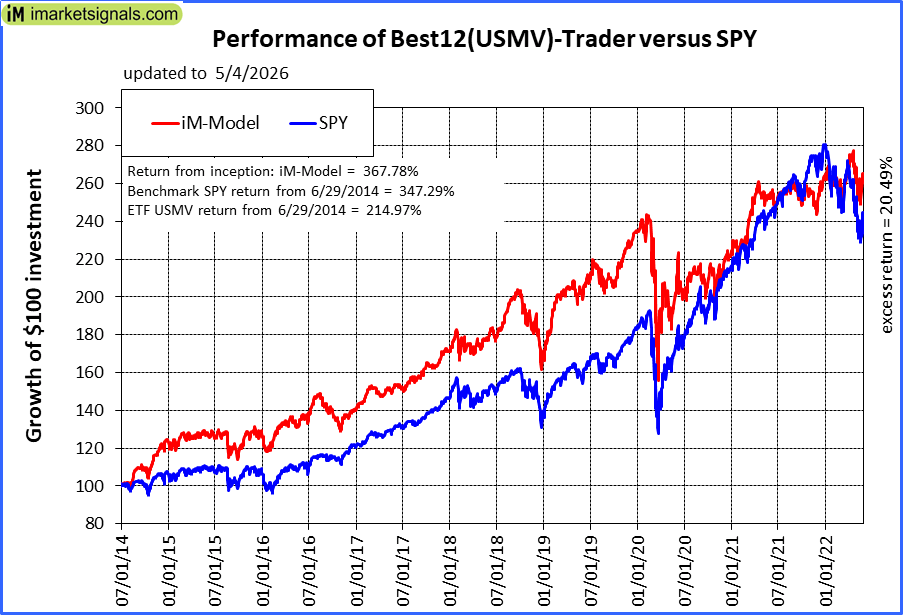 |
iM-Best12(USMV)-Trader: The model’s out of sample performance YTD is 9.5%, and for the last 12 months is 30.1%. Over the same period the benchmark SPY performance was 5.6% and 28.1% respectively. Since inception, on 6/30/2014, the model gained 367.78% while the benchmark SPY gained 347.29% and the ETF USMV gained 214.97% over the same period. Over the previous week the market value of iM-Best12(USMV)-Trader gained 1.87% at a time when SPY gained 0.40%. A starting capital of $100,000 at inception on 6/30/2014 would have grown to $467,784 which includes $2,224 cash and excludes $8,803 spent on fees and slippage. |
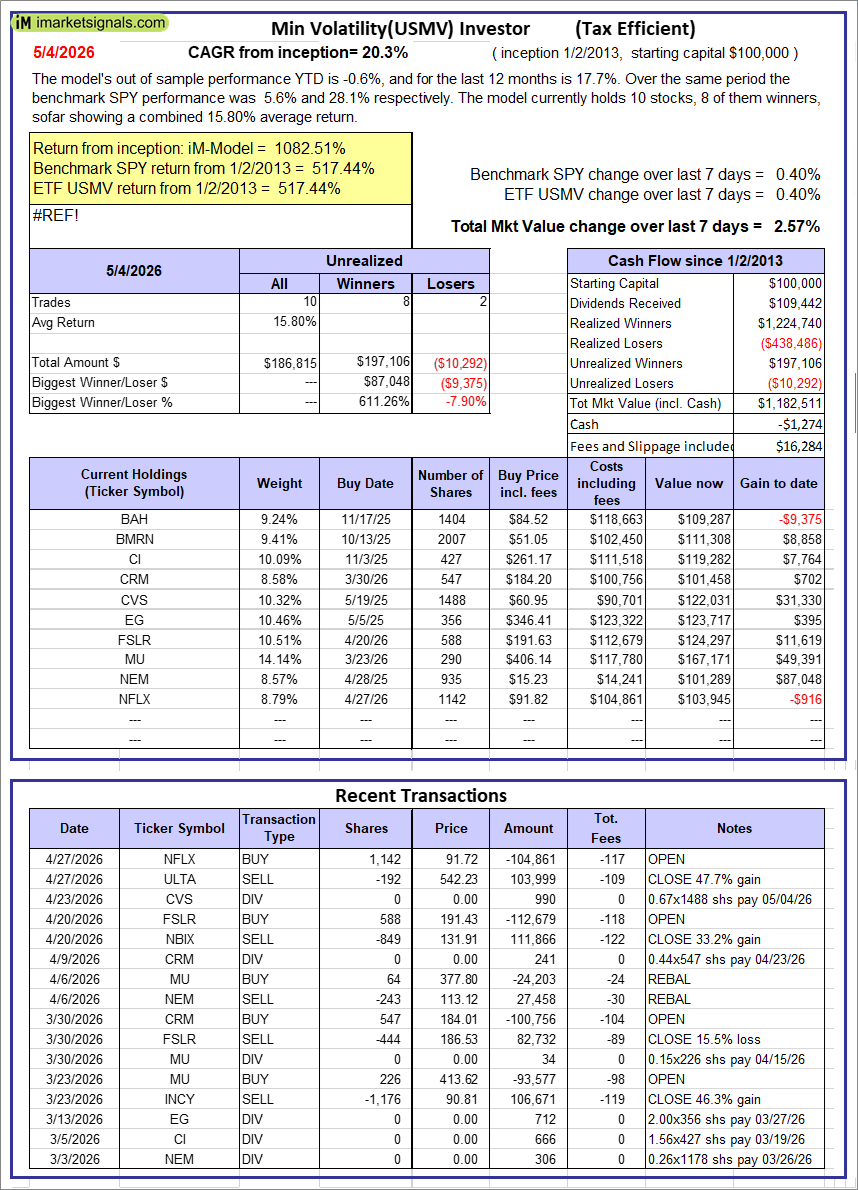 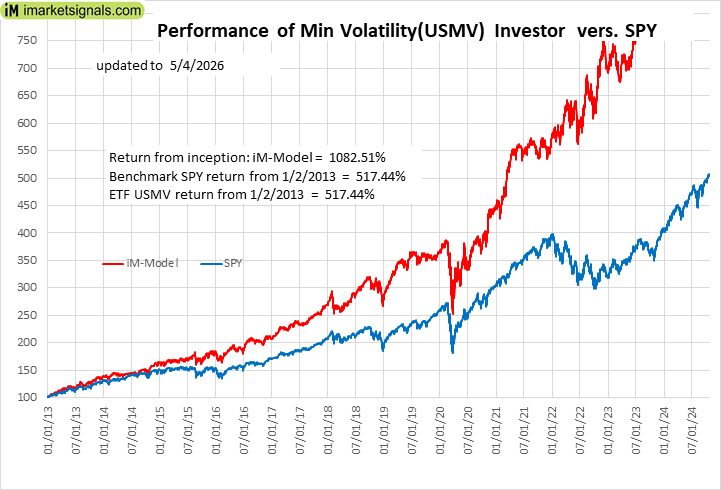 |
iM-Min Volatility(USMV) Investor (Tax Efficient): The model’s out of sample performance YTD is -0.6%, and for the last 12 months is 17.7%. Over the same period the benchmark SPY performance was 5.6% and 28.1% respectively. Since inception, on 1/3/2013, the model gained 1082.51% while the benchmark SPY gained 517.44% and the ETF USMV gained 517.44% over the same period. Over the previous week the market value of iM-Best12(USMV)Q1 gained 2.57% at a time when SPY gained 0.40%. A starting capital of $100,000 at inception on 1/3/2013 would have grown to $1,182,511 which includes -$1,274 cash and excludes $16,284 spent on fees and slippage. |
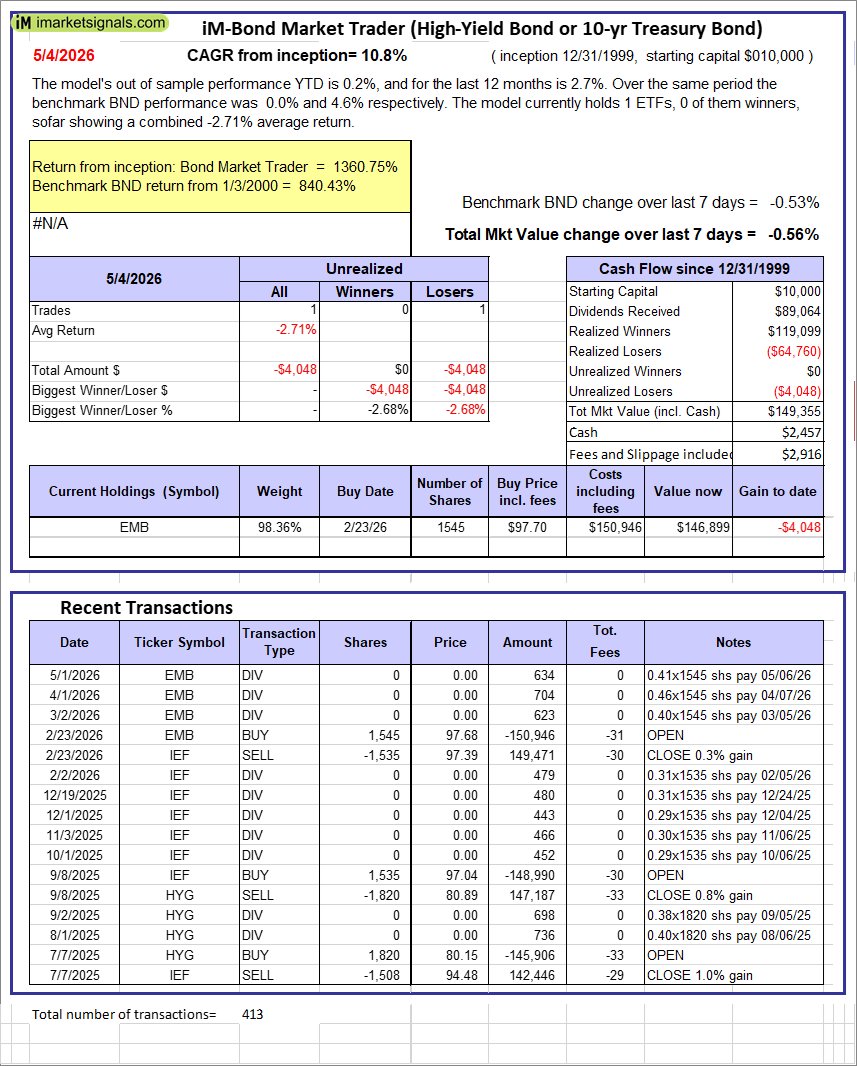 |
iM-Bond Market Trader (High-Yield Bond or 10-yr Treasury Bond): The model’s out of sample performance YTD is 0.2%, and for the last 12 months is 2.7%. Over the same period the benchmark BND performance was 0.0% and 4.6% respectively. Over the previous week the market value of the iM-Bond Market Trader (High-Yield Bond or 10-yr Treasury Bond) gained -0.56% at a time when BND gained -0.53%. A starting capital of $10,000 at inception on 1/3/2000 would have grown to $149,355 which includes $2,457 cash and excludes $2,916 spent on fees and slippage. |
|
|
iM-ModSum/YieldCurve Timer: The model’s out of sample performance YTD is 6.8%, and for the last 12 months is 12.4%. Over the same period the benchmark SPY performance was 5.6% and 28.1% respectively. Over the previous week the market value of iM-PortSum/YieldCurve Timer gained 0.39% at a time when SPY gained 0.40%. A starting capital of $100,000 at inception on 1/1/2016 would have grown to $409,177 which includes $5,656 cash and excludes $2,335 spent on fees and slippage. |
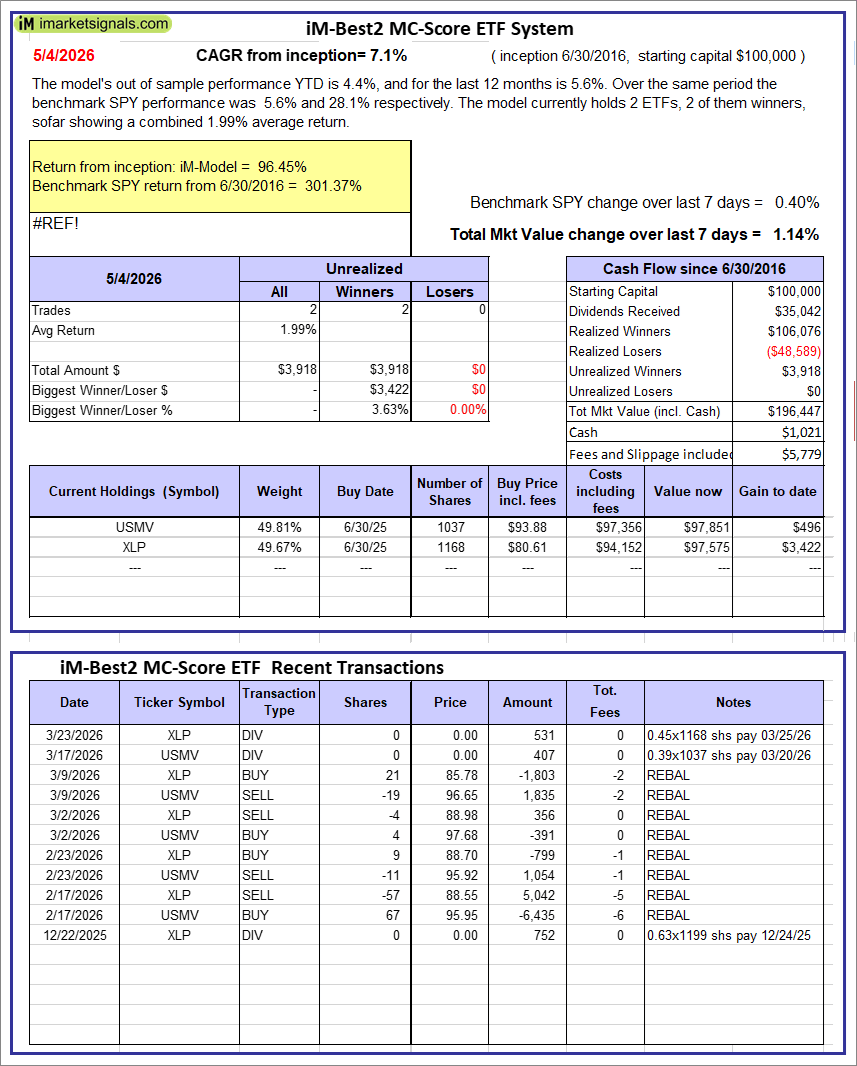 |
iM-Best2 MC-Score ETF System: The model’s out of sample performance YTD is 4.4%, and for the last 12 months is 5.6%. Over the same period the benchmark SPY performance was 5.6% and 28.1% respectively. Over the previous week the market value of the iM-Best2 MC-Score ETF System gained 1.14% at a time when SPY gained 0.40%. A starting capital of $100,000 at inception on 6/30/2016 would have grown to $196,447 which includes $1,021 cash and excludes $5,779 spent on fees and slippage. |
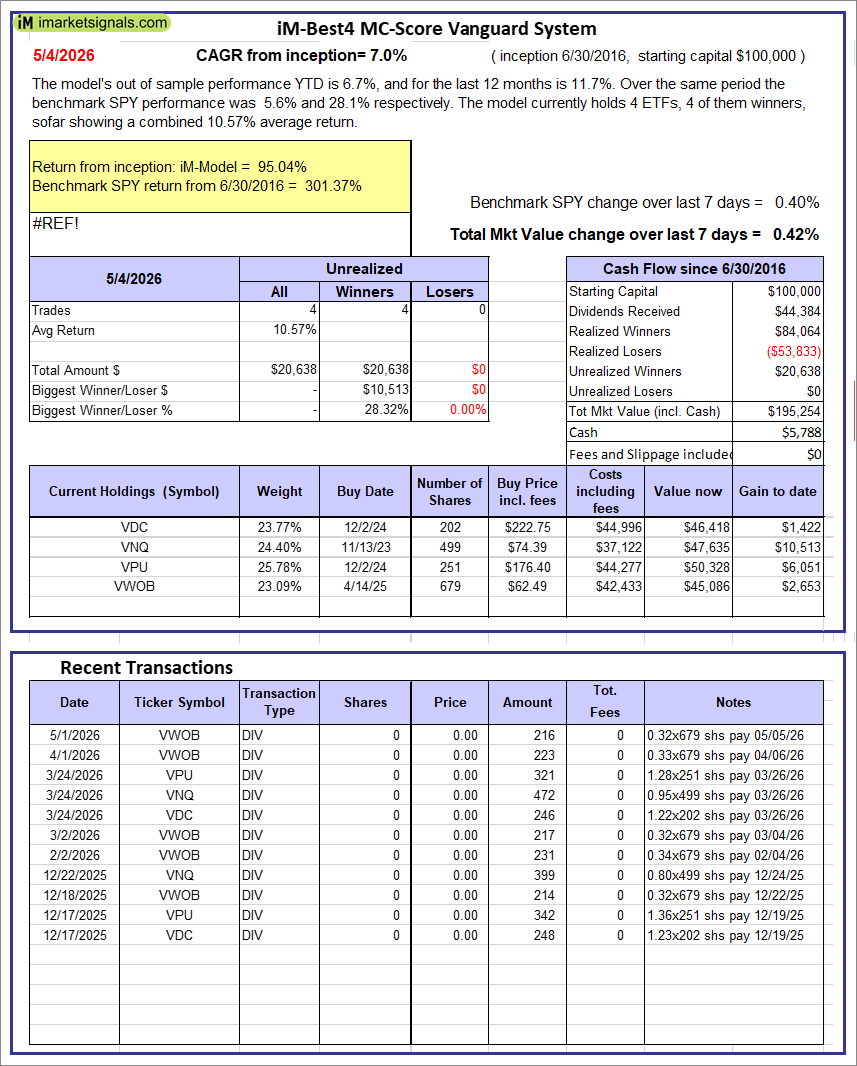 |
iM-Best4 MC-Score Vanguard System: The model’s out of sample performance YTD is 6.7%, and for the last 12 months is 11.7%. Over the same period the benchmark SPY performance was 5.6% and 28.1% respectively. Over the previous week the market value of the iM-Best4 MC-Score Vanguard System gained 0.42% at a time when SPY gained 0.40%. A starting capital of $100,000 at inception on 6/30/2016 would have grown to $195,254 which includes $5,788 cash and excludes $00 spent on fees and slippage. |
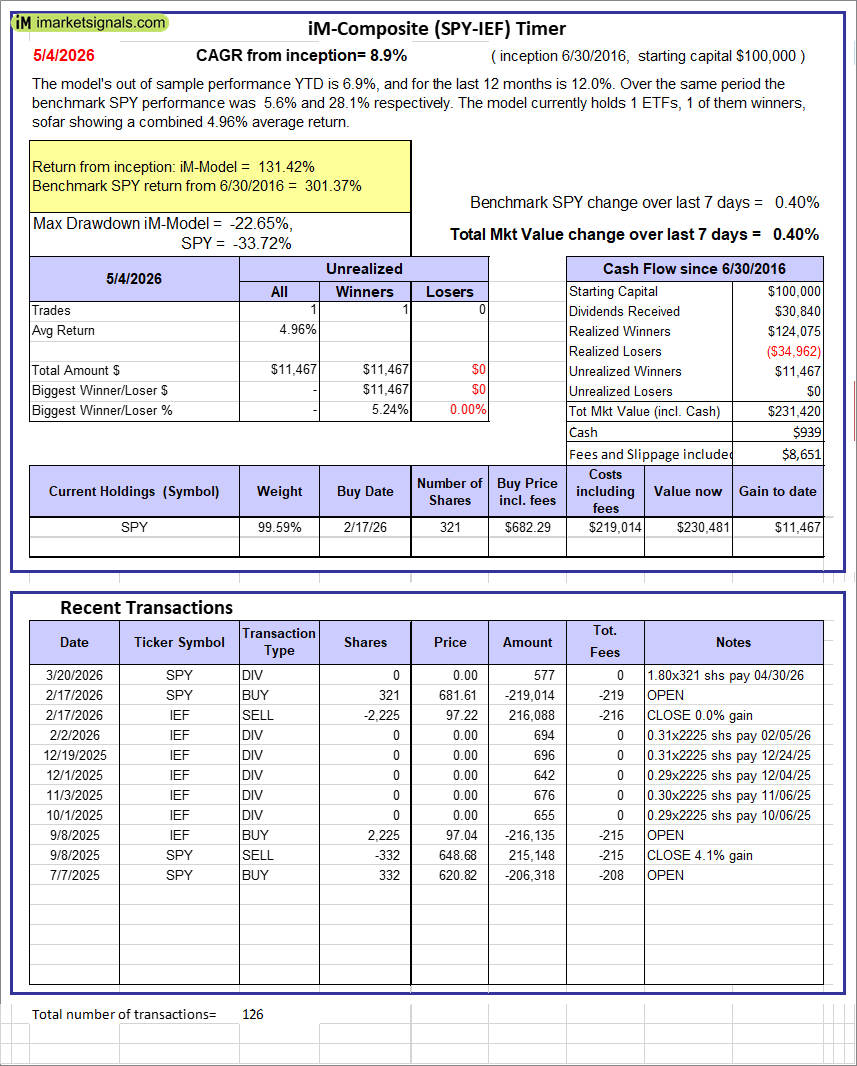 |
iM-Composite (SPY-IEF) Timer: The model’s out of sample performance YTD is 6.9%, and for the last 12 months is 12.0%. Over the same period the benchmark SPY performance was 5.6% and 28.1% respectively. Over the previous week the market value of the iM-Composite (SPY-IEF) Timer gained 0.40% at a time when SPY gained 0.40%. A starting capital of $100,000 at inception on 6/30/2016 would have grown to $231,420 which includes $939 cash and excludes $8,651 spent on fees and slippage. |
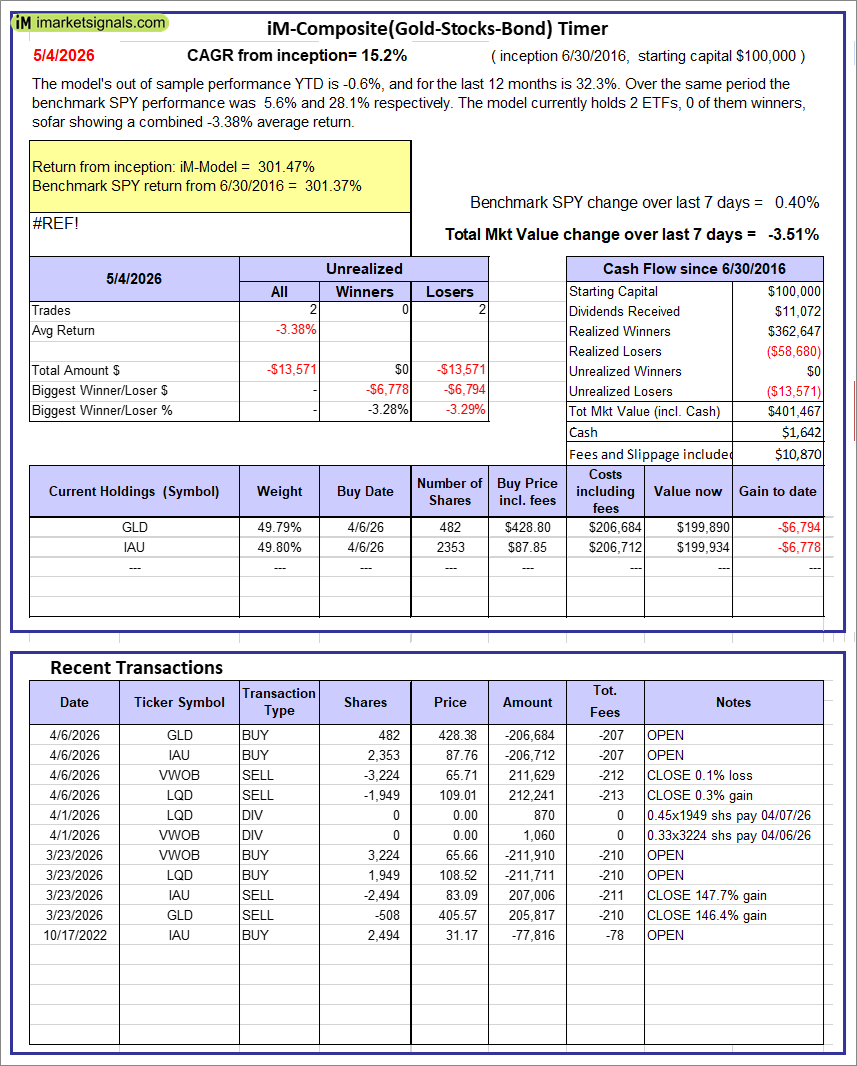 |
iM-Composite(Gold-Stocks-Bond) Timer: The model’s out of sample performance YTD is -0.6%, and for the last 12 months is 32.3%. Over the same period the benchmark SPY performance was 5.6% and 28.1% respectively. Over the previous week the market value of the iM-Composite(Gold-Stocks-Bond) Timer gained -3.51% at a time when SPY gained 0.40%. A starting capital of $100,000 at inception on 6/30/2016 would have grown to $401,467 which includes $1,642 cash and excludes $10,870 spent on fees and slippage. |
iM-Best Reports – 5/4/2026
Posted in pmp SPY-SH