
Bond-market:
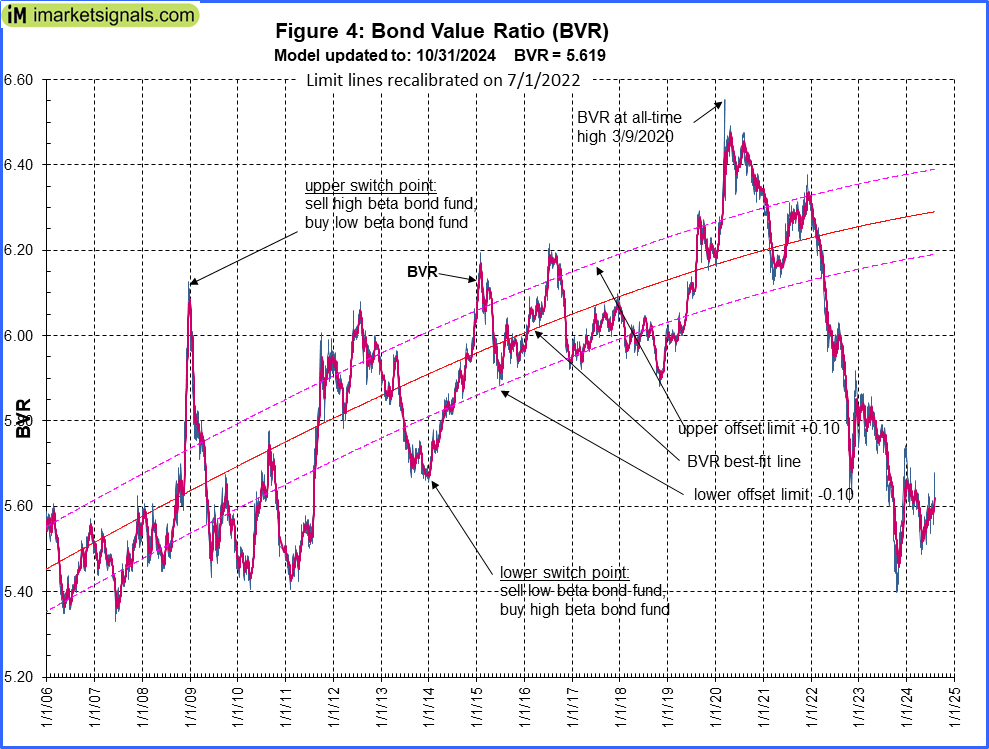 The BVR-model favors high beta bonds (long-bonds) and intermediate duration bonds when the BVR rises. The Bond Value Ratio as shown in Fig 4 is above week’s value, and according to the model, only when BVR turns upward after having been lower than the lower offset-line should one consider long bonds again.
The Yield Curve:
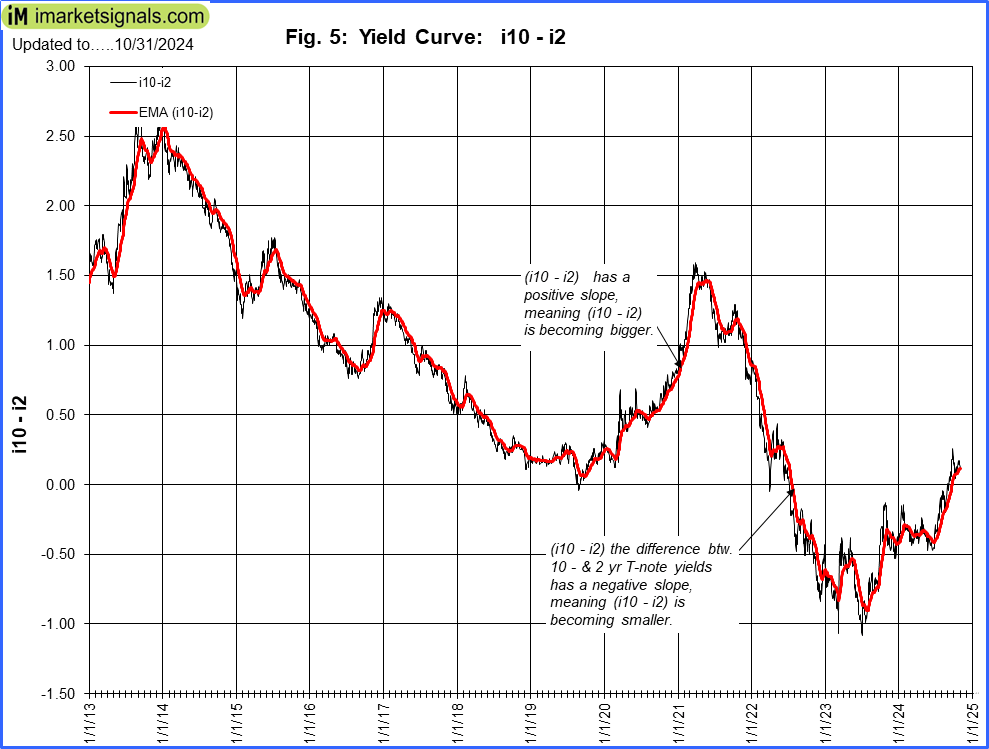 The yield curve model indicates the trend of the 10-year and 2-year Treasuries yield spread. Figure 5 charts (i10 – i2), the yield curve is steapening. This model confirms the direction of the BVR.
Gold:
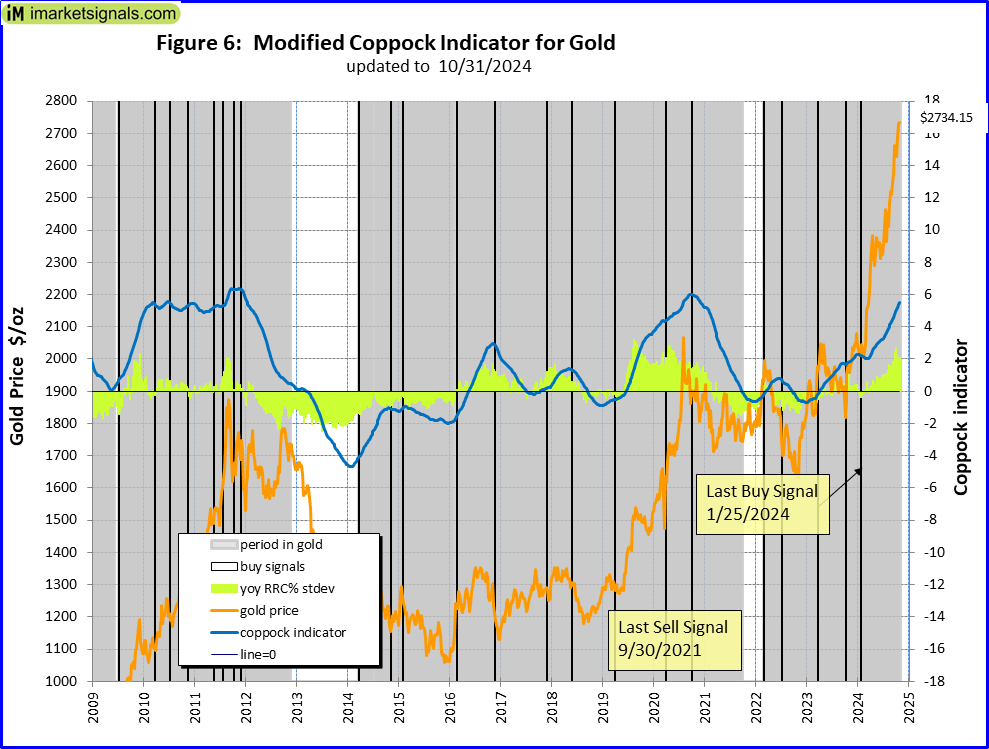 The modified Coppock Gold indicator, shown in Fig 6, generated a buy signal beginning March 2022 and is invested in gold.
This indicator is described in Is it Time to Buy Gold Again? – Wait for the buy signal …….
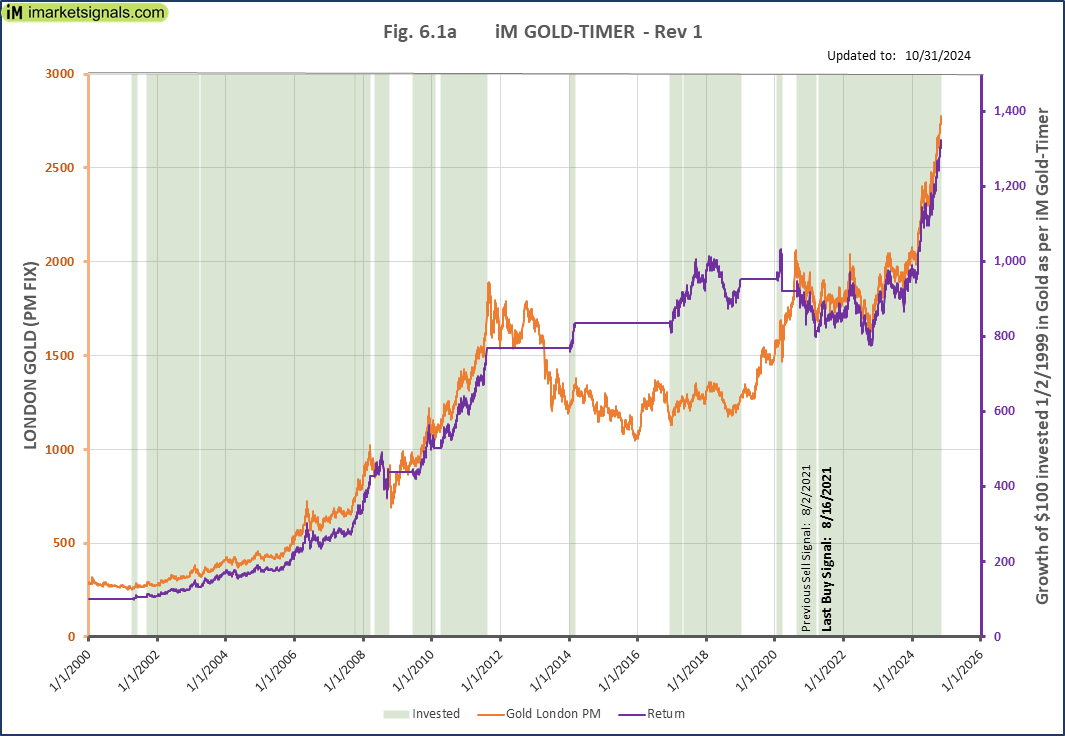 The iM GOLD-TIMER Rev-1 This model generated a new a buy signal mid August 2021 after being in cash for two weeks and thus invested in gold.
Silver:
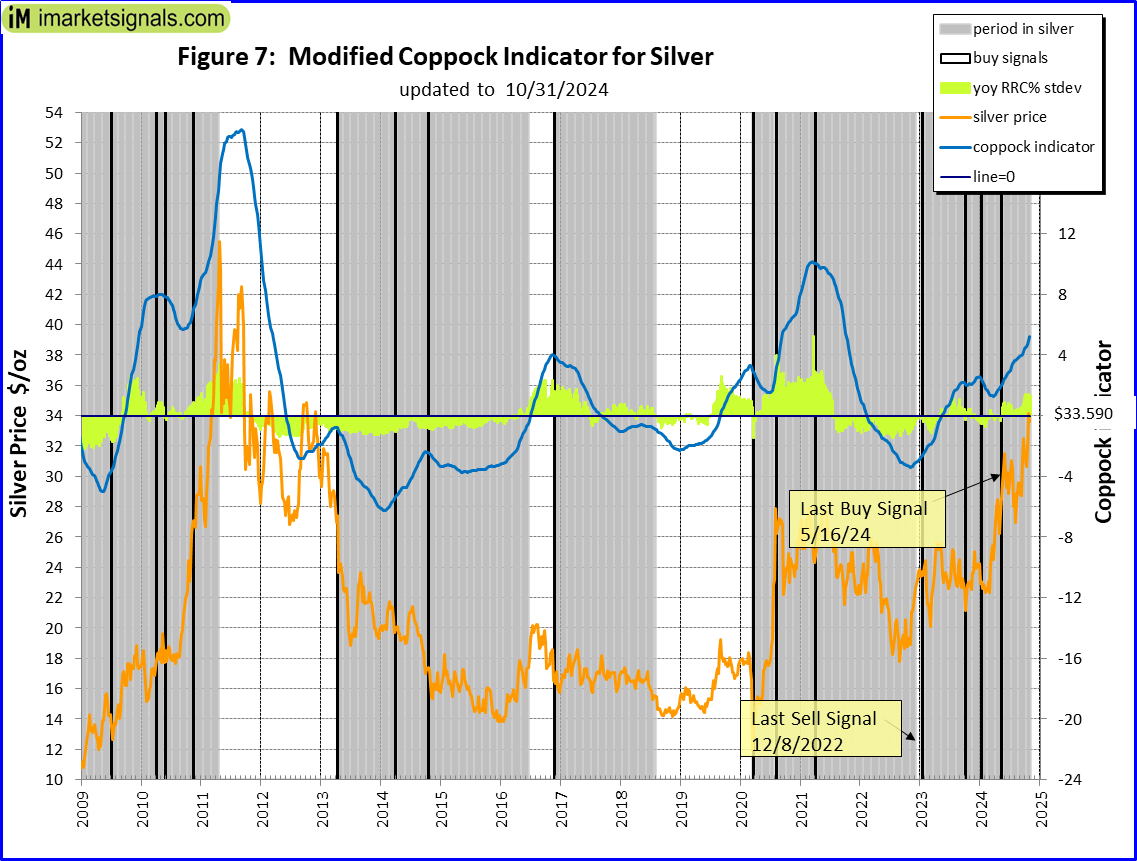 The modified Coppock Silver indicator shown in Fig 7. iM-coppock model regenerated a buy signal end mid May 2024 and is invested in Silver.
This indicator is described in Silver – Better Than Gold: A Modified Coppock Indicator for Silver.
Leave a Reply
You must be logged in to post a comment.