
  |
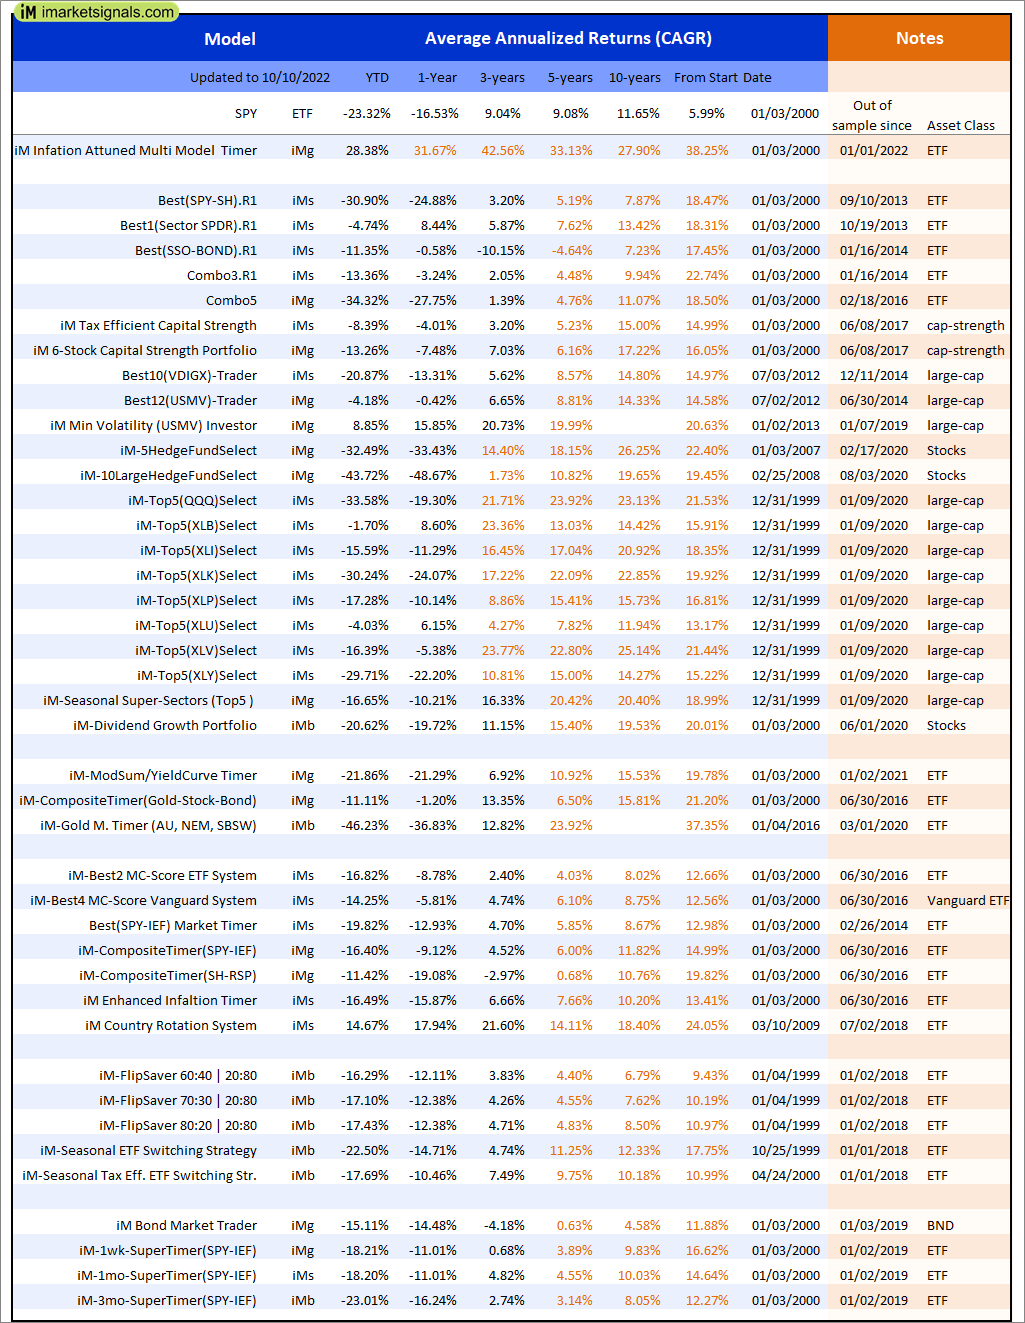
Out of sample performance summary of our models for the past 1, 2, 4 and 13 week periods. The active active return indicates how the models over- or underperformed the benchmark ETF SPY. Also the YTD, and the 1-, 3-, 5- and 10-year annualized returns are shown in the second table |
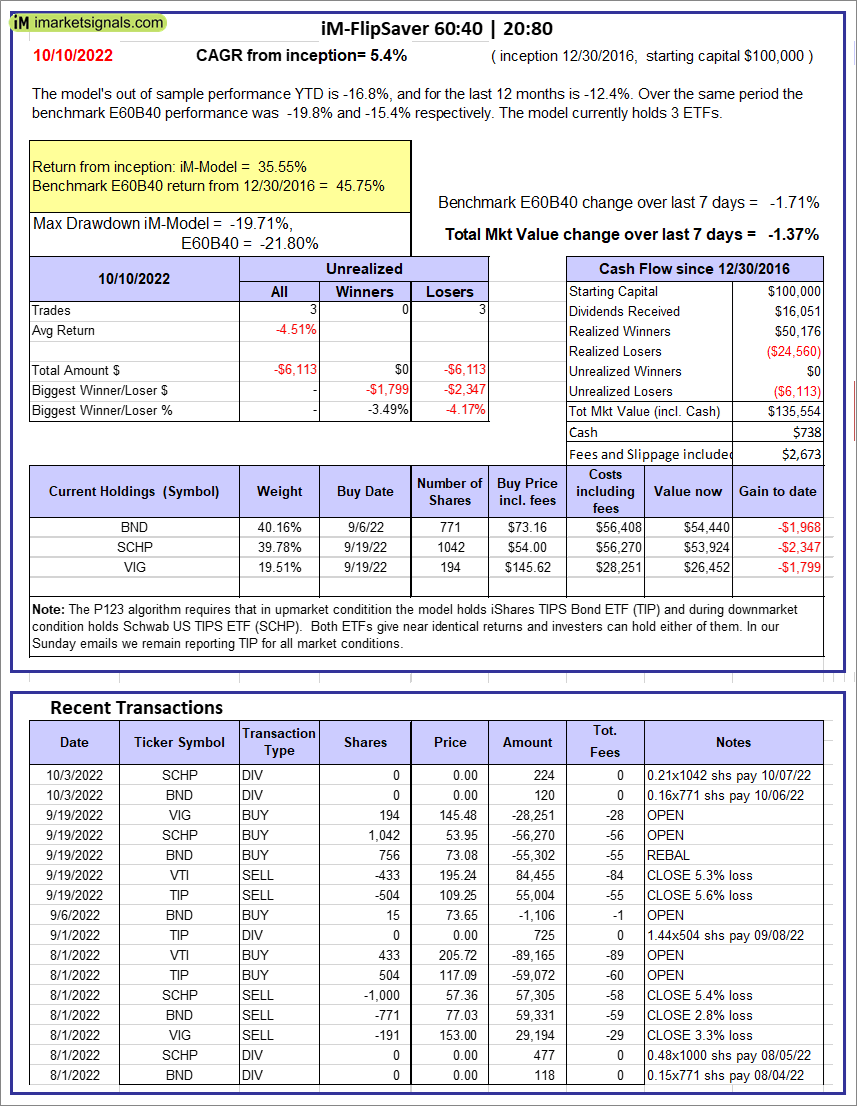 |
iM-FlipSaver 60:40 | 20:80 – 2017: The model’s out of sample performance YTD is -16.8%, and for the last 12 months is -12.4%. Over the same period the benchmark E60B40 performance was -19.8% and -15.4% respectively. Over the previous week the market value of iM-FlipSaver 80:20 | 20:80 gained -1.37% at a time when SPY gained -1.71%. A starting capital of $100,000 at inception on 7/16/2015 would have grown to $135,554 which includes $738 cash and excludes $2,673 spent on fees and slippage. |
 |
iM-FlipSaver 70:30 | 20:80 – 2017: The model’s out of sample performance YTD is -17.1%, and for the last 12 months is -12.4%. Over the same period the benchmark E60B40 performance was -19.8% and -15.4% respectively. Over the previous week the market value of iM-FlipSaver 70:30 | 20:80 gained -1.37% at a time when SPY gained -1.71%. A starting capital of $100,000 at inception on 7/15/2015 would have grown to $139,401 which includes $850 cash and excludes $2,831 spent on fees and slippage. |
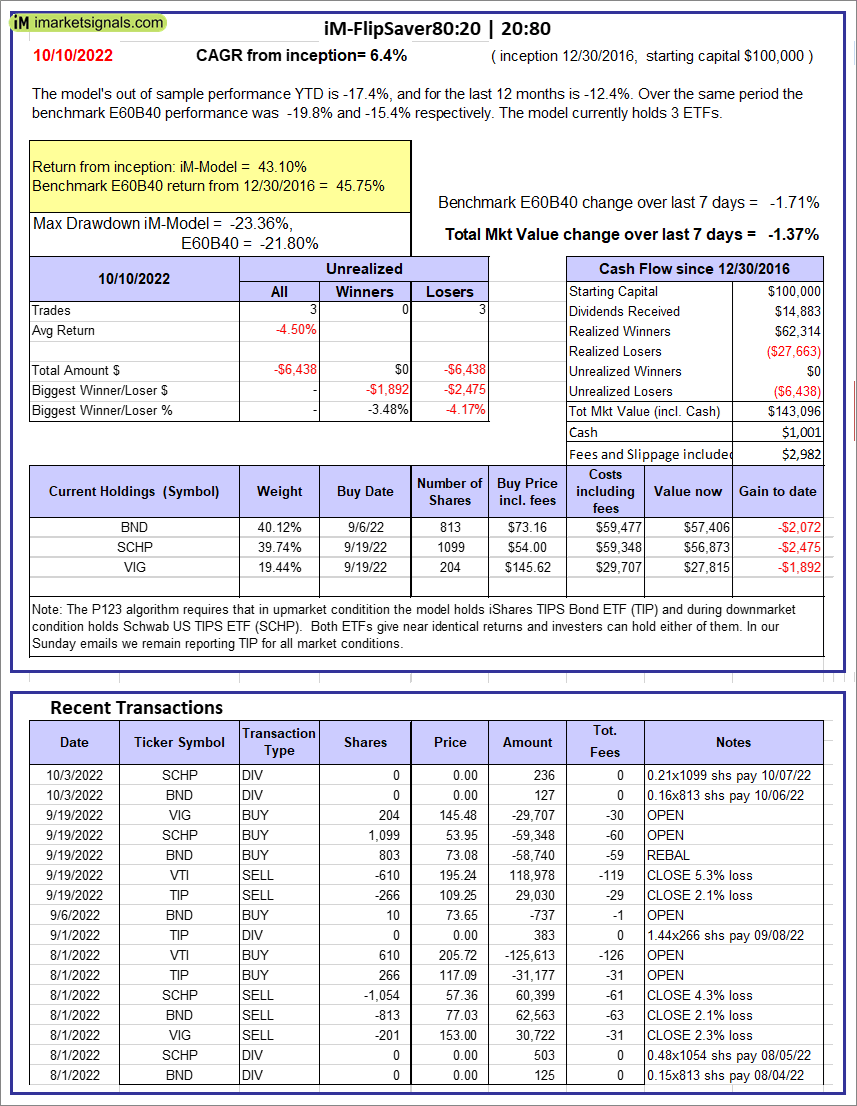 |
iM-FlipSaver 80:20 | 20:80 – 2017: The model’s out of sample performance YTD is -17.4%, and for the last 12 months is -12.4%. Over the same period the benchmark E60B40 performance was -19.8% and -15.4% respectively. Over the previous week the market value of iM-FlipSaver 80:20 | 20:80 gained -1.37% at a time when SPY gained -1.71%. A starting capital of $100,000 at inception on 1/2/2017 would have grown to $143,096 which includes $1,001 cash and excludes $2,982 spent on fees and slippage. |
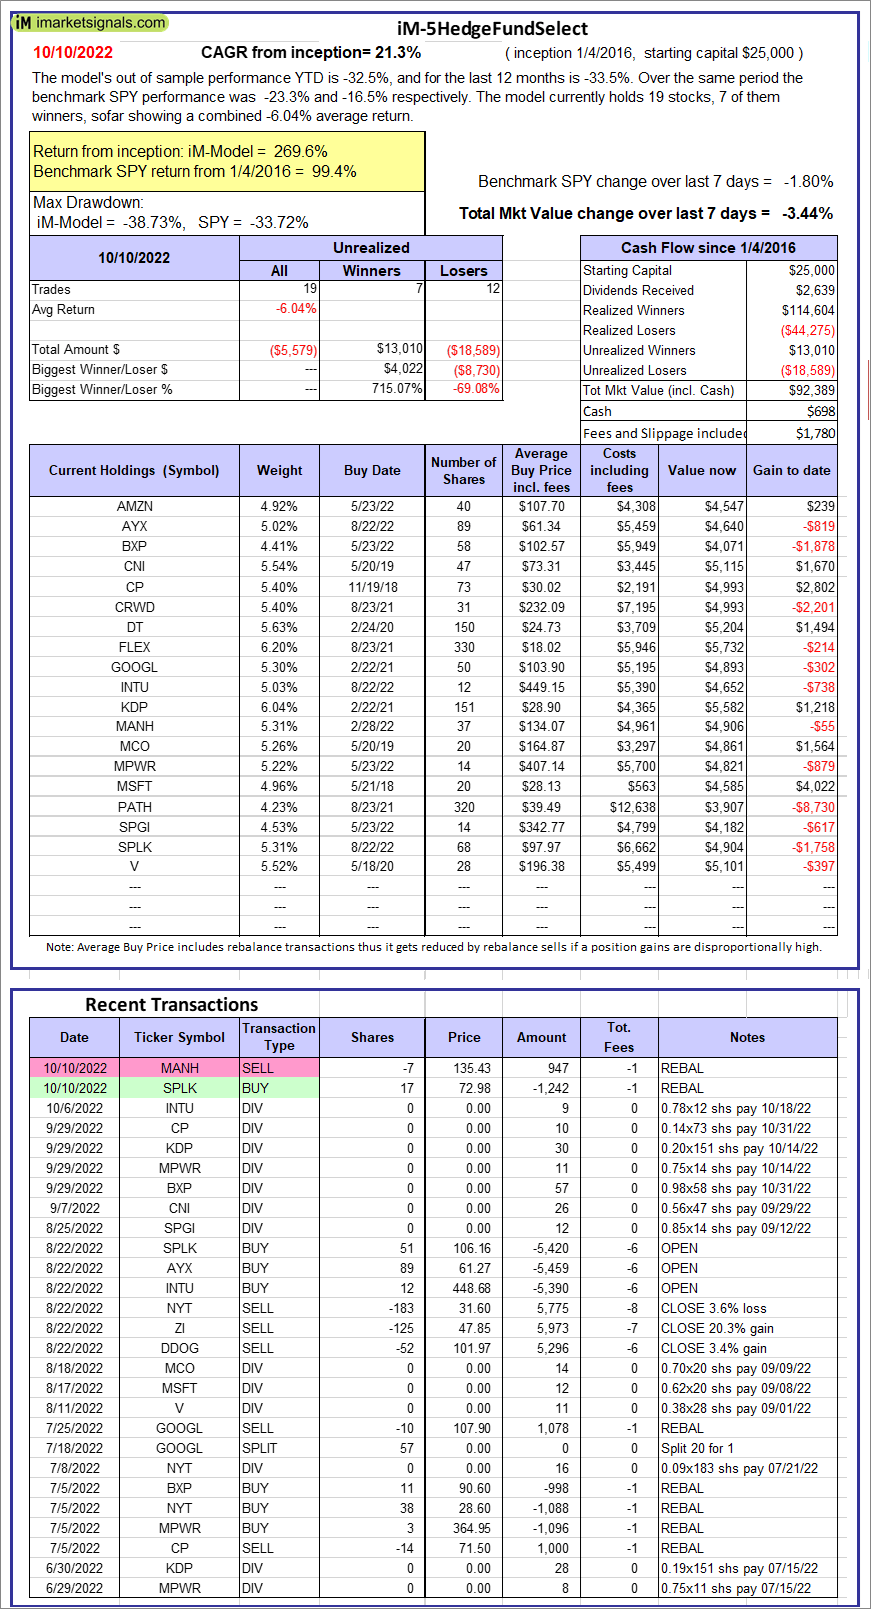 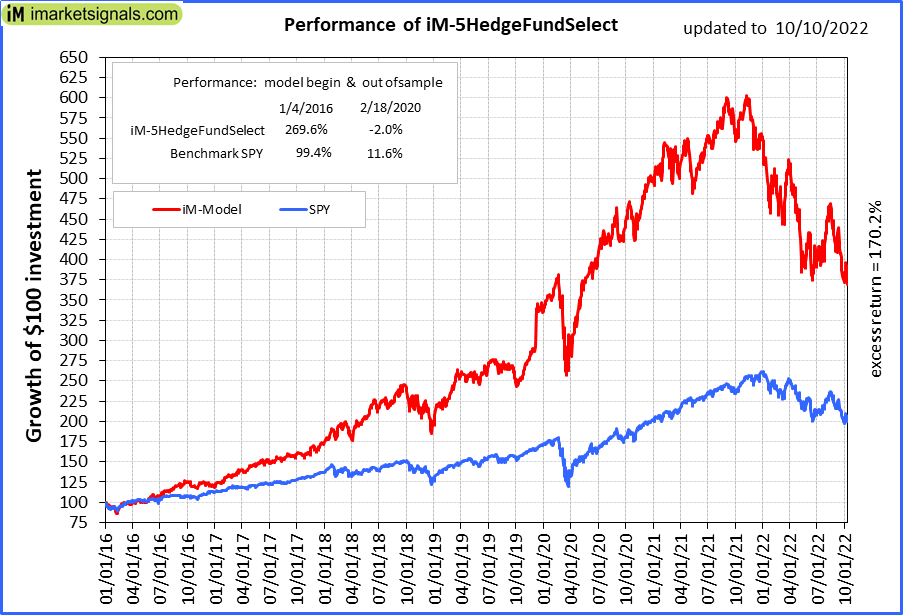 |
iM-5HedgeFundSelect: Since inception, on 1/5/2016, the model gained 269.55% while the benchmark SPY gained 99.37% over the same period. Over the previous week the market value of iM-5HedgeFundSelect gained -3.44% at a time when SPY gained -1.80%. A starting capital of $25,000 at inception on 1/5/2016 would have grown to $92,389 which includes $698 cash and excludes $1,780 spent on fees and slippage. |
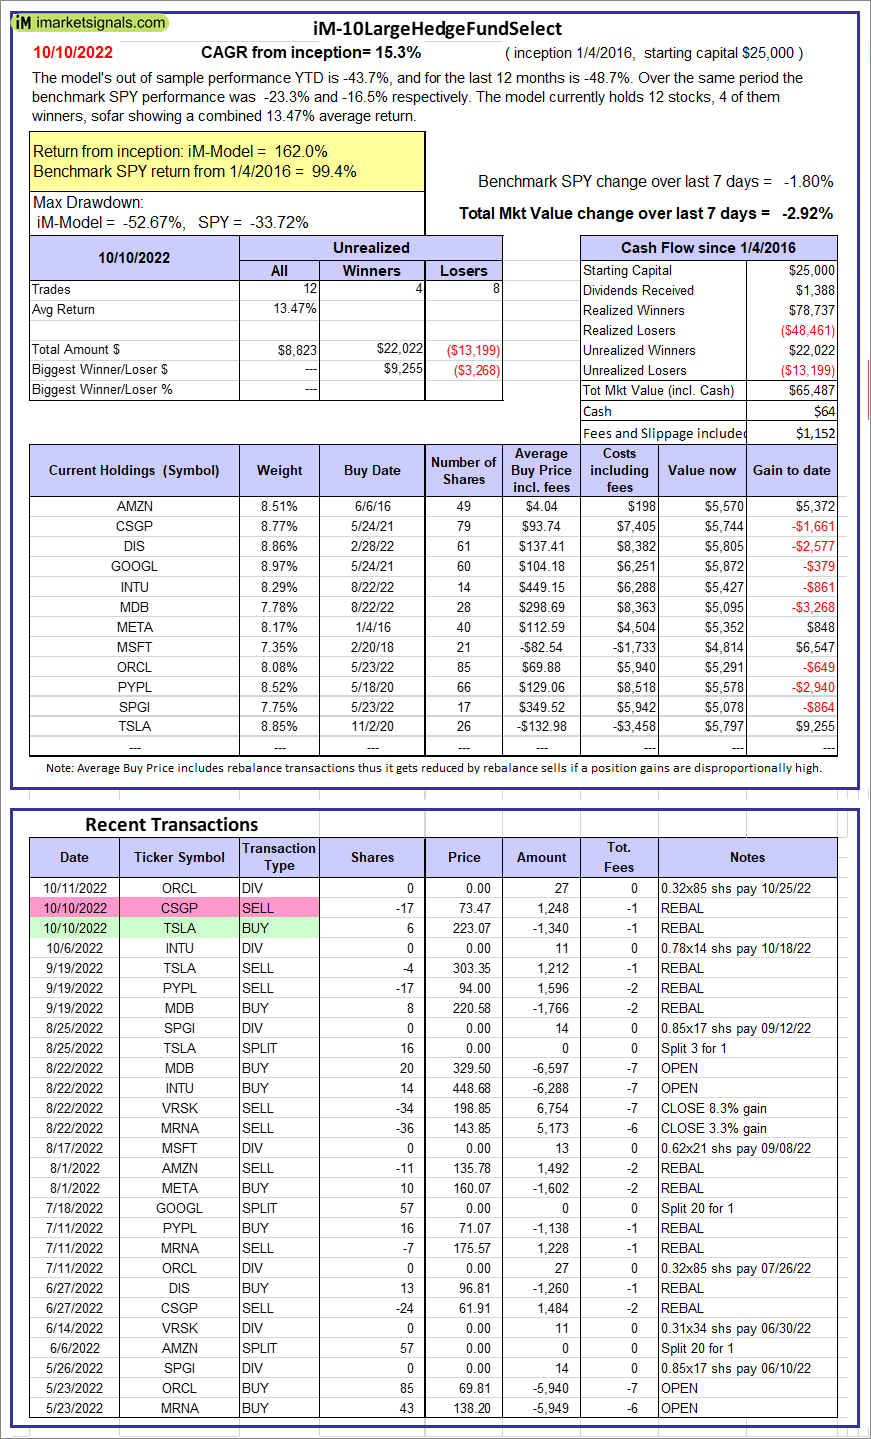 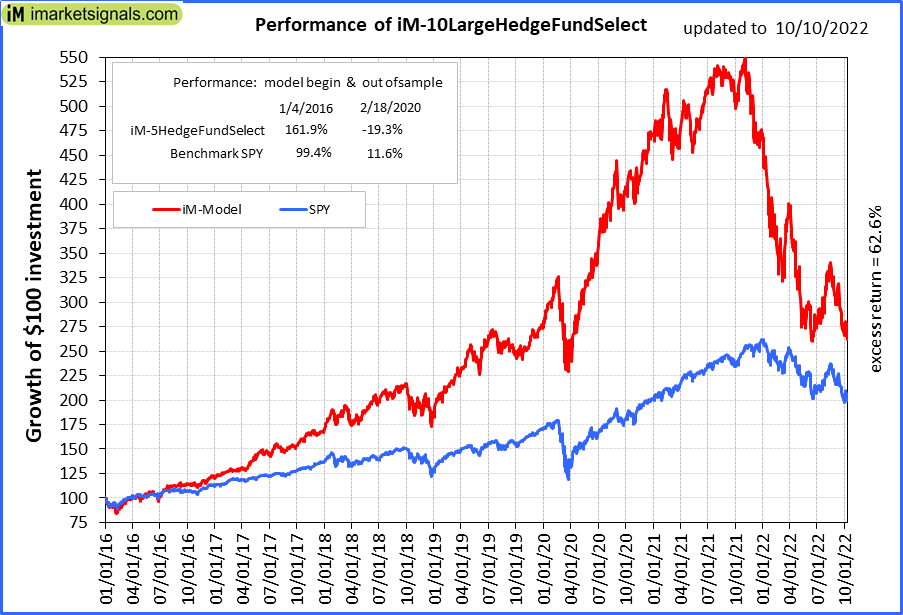 |
iM-10LargeHedgeFundSelect: Since inception, on 1/5/2016, the model gained 161.95% while the benchmark SPY gained 99.37% over the same period. Over the previous week the market value of iM-10LargeHedgeFundSelect gained -2.92% at a time when SPY gained -1.80%. A starting capital of $25,000 at inception on 1/5/2016 would have grown to $65,487 which includes $64 cash and excludes $1,152 spent on fees and slippage. |
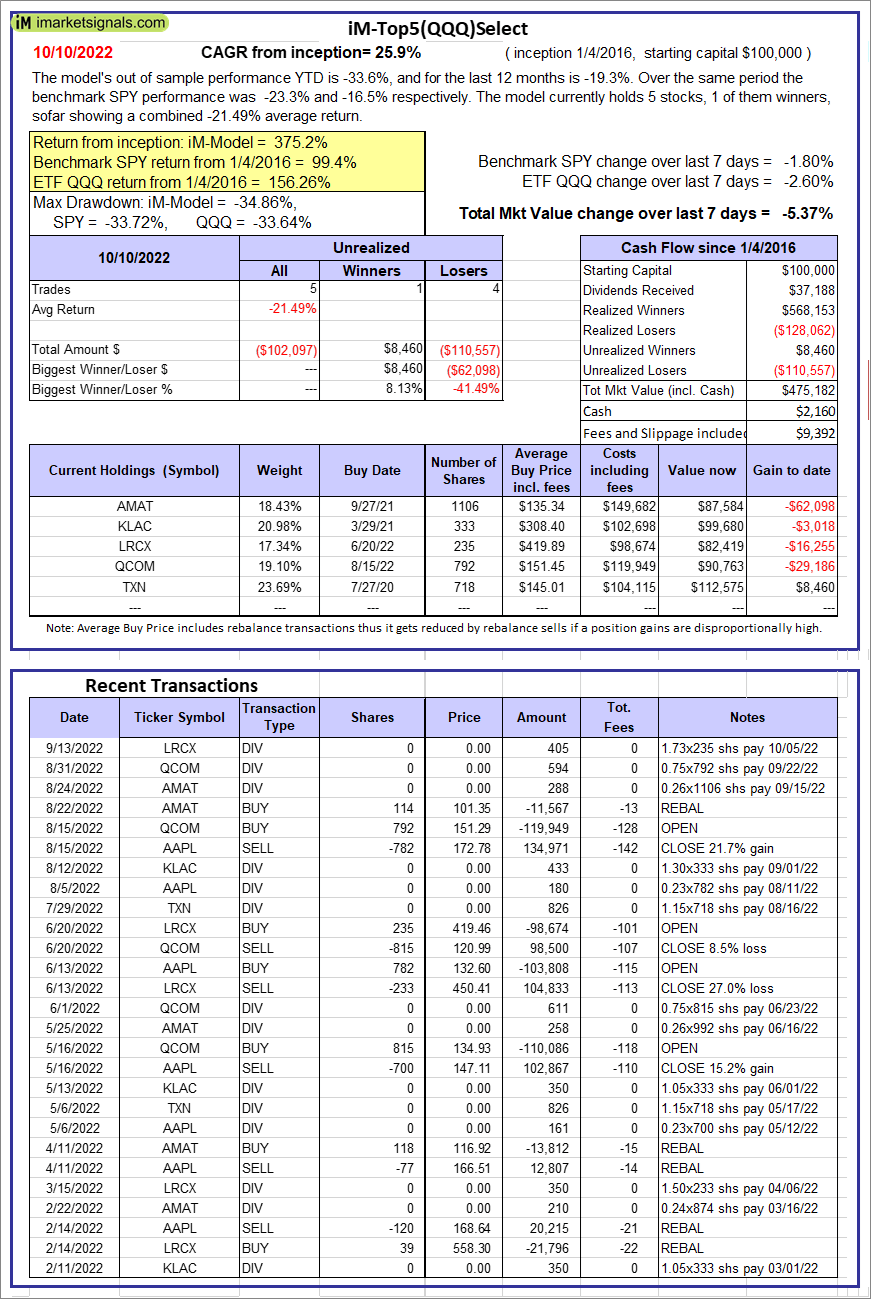 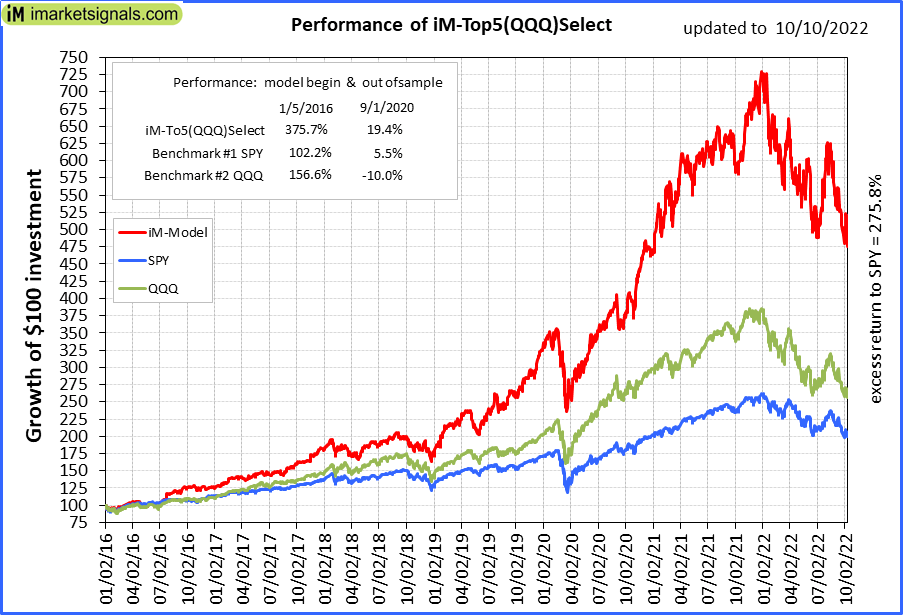 |
iM-Top5(QQQ)Select: Since inception, on 1/5/2016, the model gained 375.18% while the benchmark SPY gained 99.37% over the same period. Over the previous week the market value of iM-Top5(QQQ)Select gained -5.37% at a time when SPY gained -1.80%. A starting capital of $100,000 at inception on 1/5/2016 would have grown to $475,182 which includes $2,160 cash and excludes $9,392 spent on fees and slippage. |
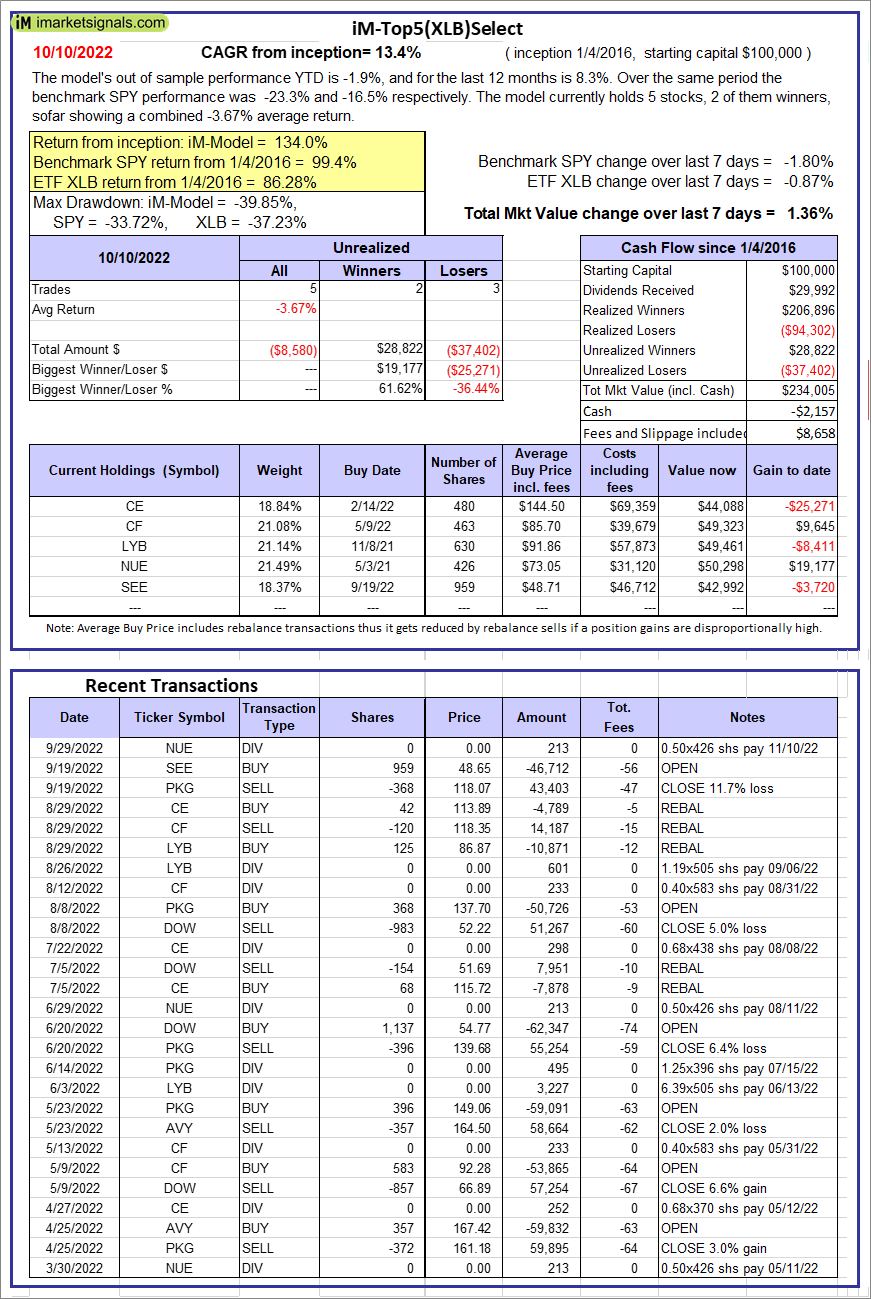 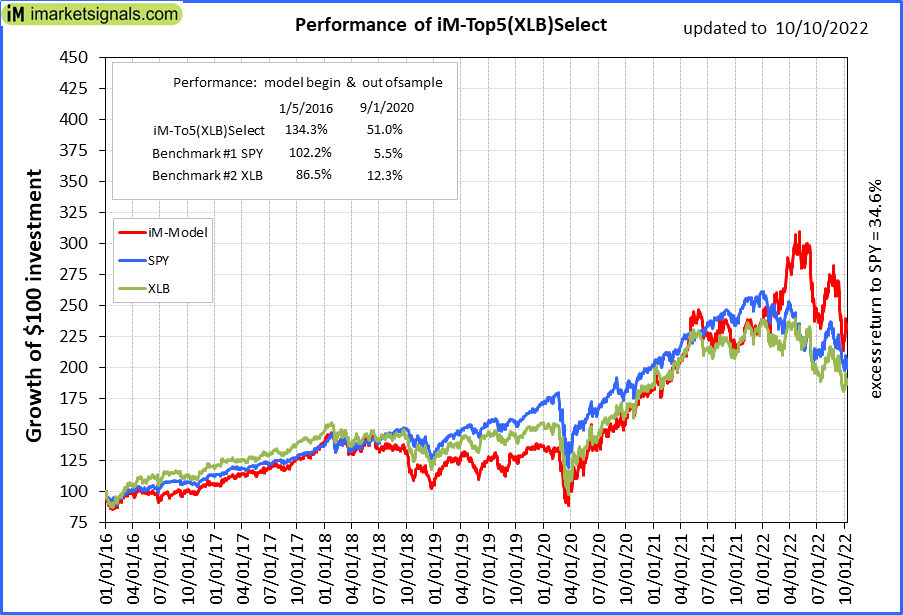 |
iM-Top5(XLB)Select: Since inception, on 1/5/2016, the model gained 134.01% while the benchmark SPY gained 99.37% over the same period. Over the previous week the market value of iM-Top5(XLB)Select gained 1.36% at a time when SPY gained -1.80%. A starting capital of $100,000 at inception on 1/5/2016 would have grown to $234,005 which includes -$2,157 cash and excludes $8,658 spent on fees and slippage. |
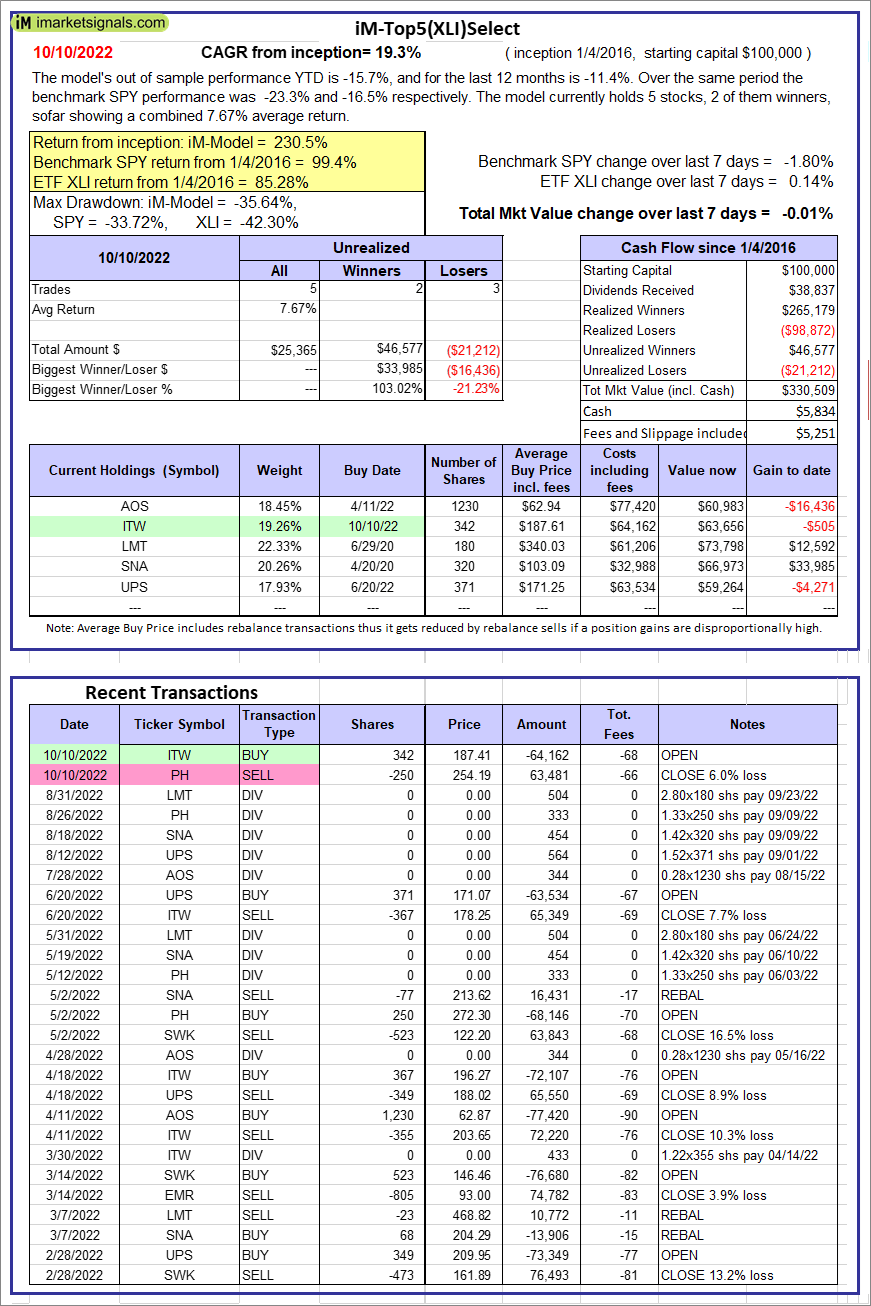 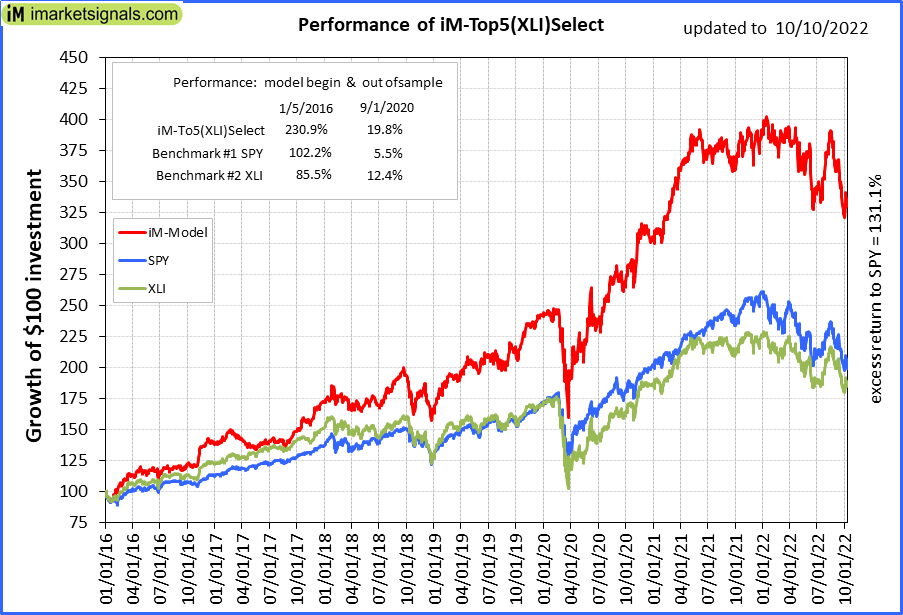 |
iM-Top5(XLI)Select: Since inception, on 1/5/2016, the model gained 230.51% while the benchmark SPY gained 99.37% over the same period. Over the previous week the market value of iM-Top5(XLI)Select gained -0.01% at a time when SPY gained -1.80%. A starting capital of $100,000 at inception on 1/5/2016 would have grown to $330,509 which includes $5,834 cash and excludes $5,251 spent on fees and slippage. |
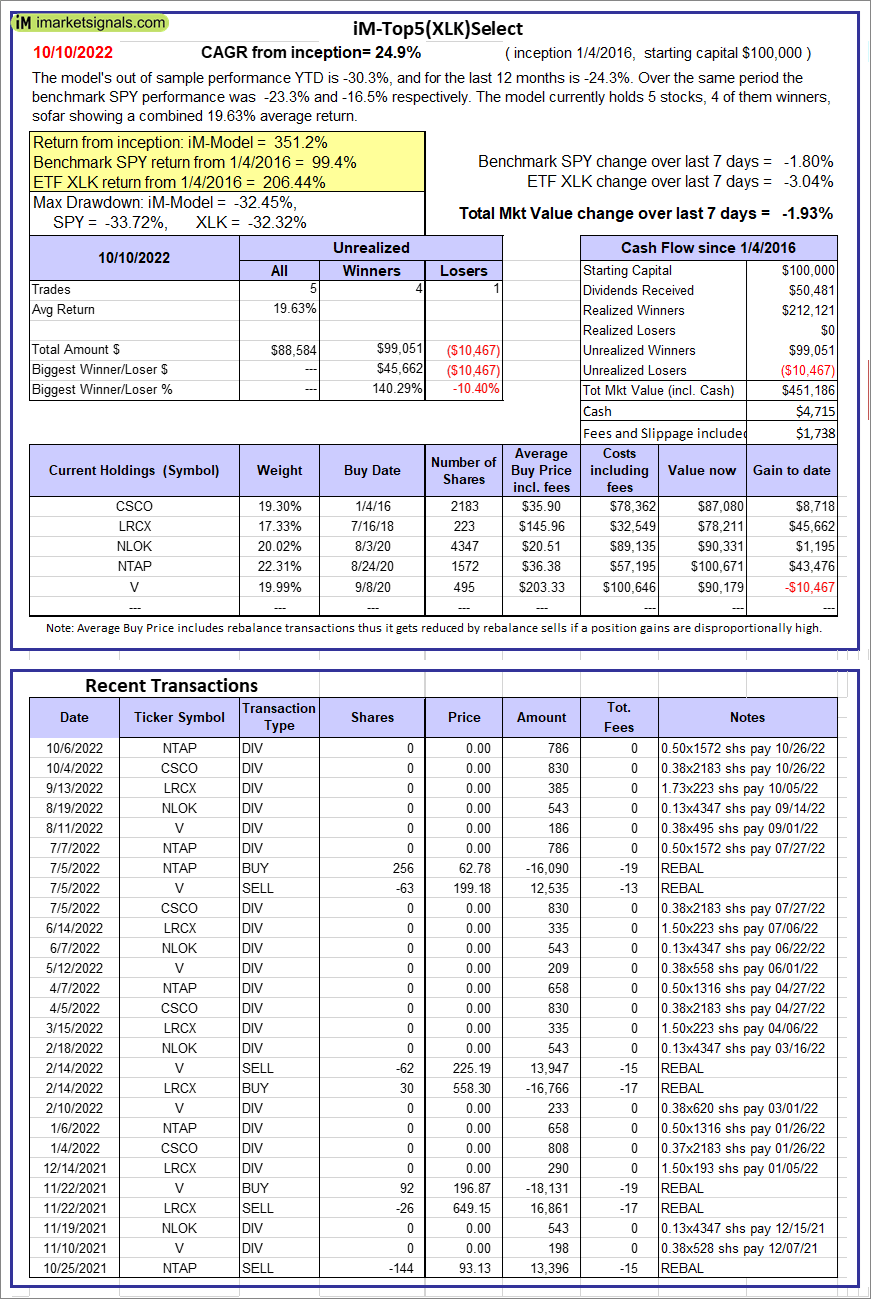 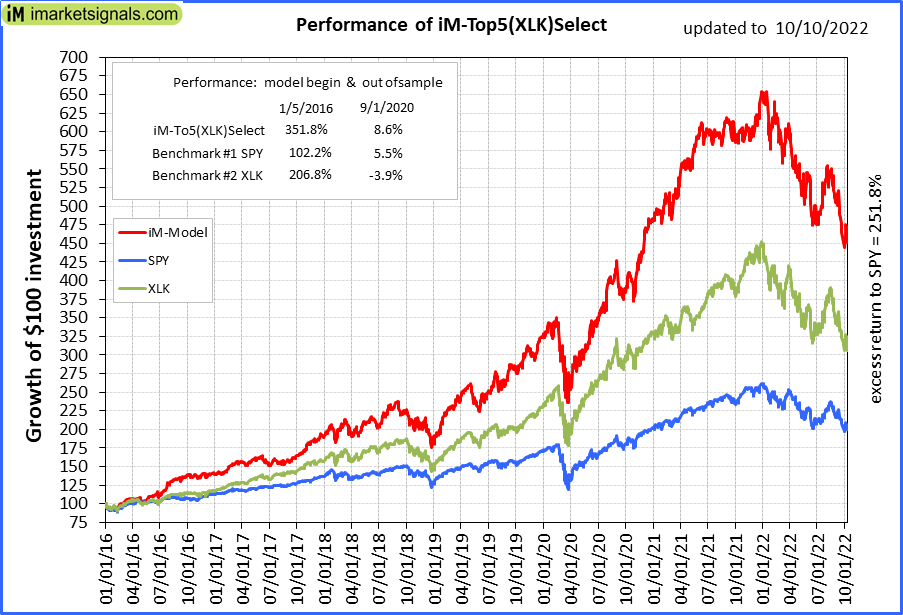 |
iM-Top5(XLK)Select: Since inception, on 1/5/2016, the model gained 351.19% while the benchmark SPY gained 99.37% over the same period. Over the previous week the market value of iM-Top5(XLK)Select gained -1.93% at a time when SPY gained -1.80%. A starting capital of $100,000 at inception on 1/5/2016 would have grown to $451,186 which includes $4,715 cash and excludes $1,738 spent on fees and slippage. |
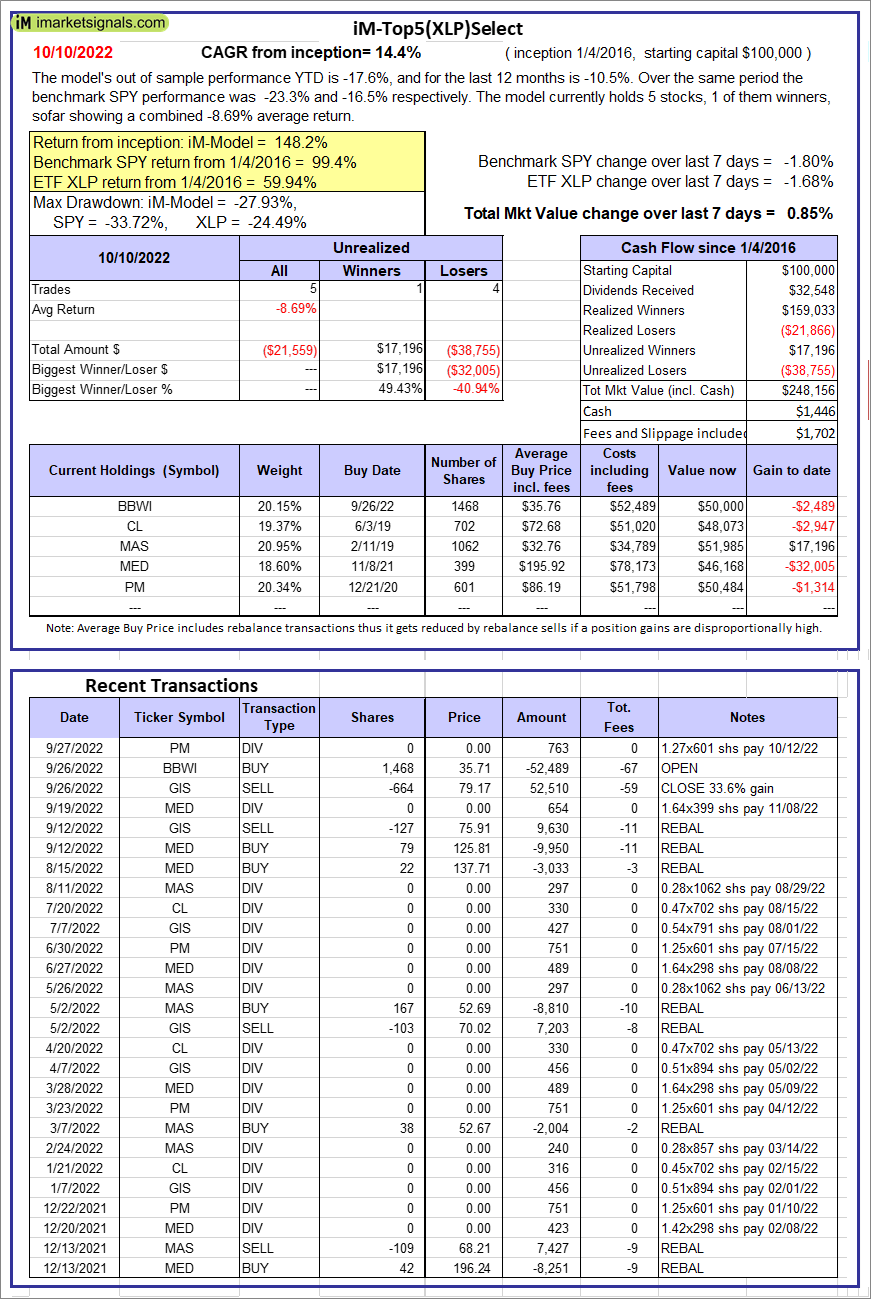 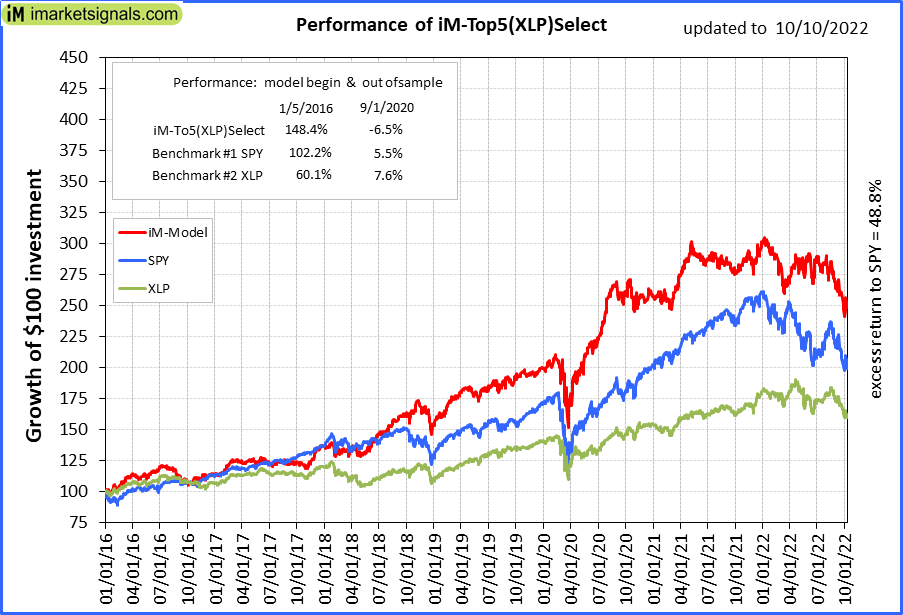 |
iM-Top5(XLP)Select: Since inception, on 1/5/2016, the model gained 148.16% while the benchmark SPY gained 99.37% over the same period. Over the previous week the market value of iM-Top5(XLP)Select gained 0.85% at a time when SPY gained -1.80%. A starting capital of $100,000 at inception on 1/5/2016 would have grown to $248,156 which includes $1,446 cash and excludes $1,702 spent on fees and slippage. |
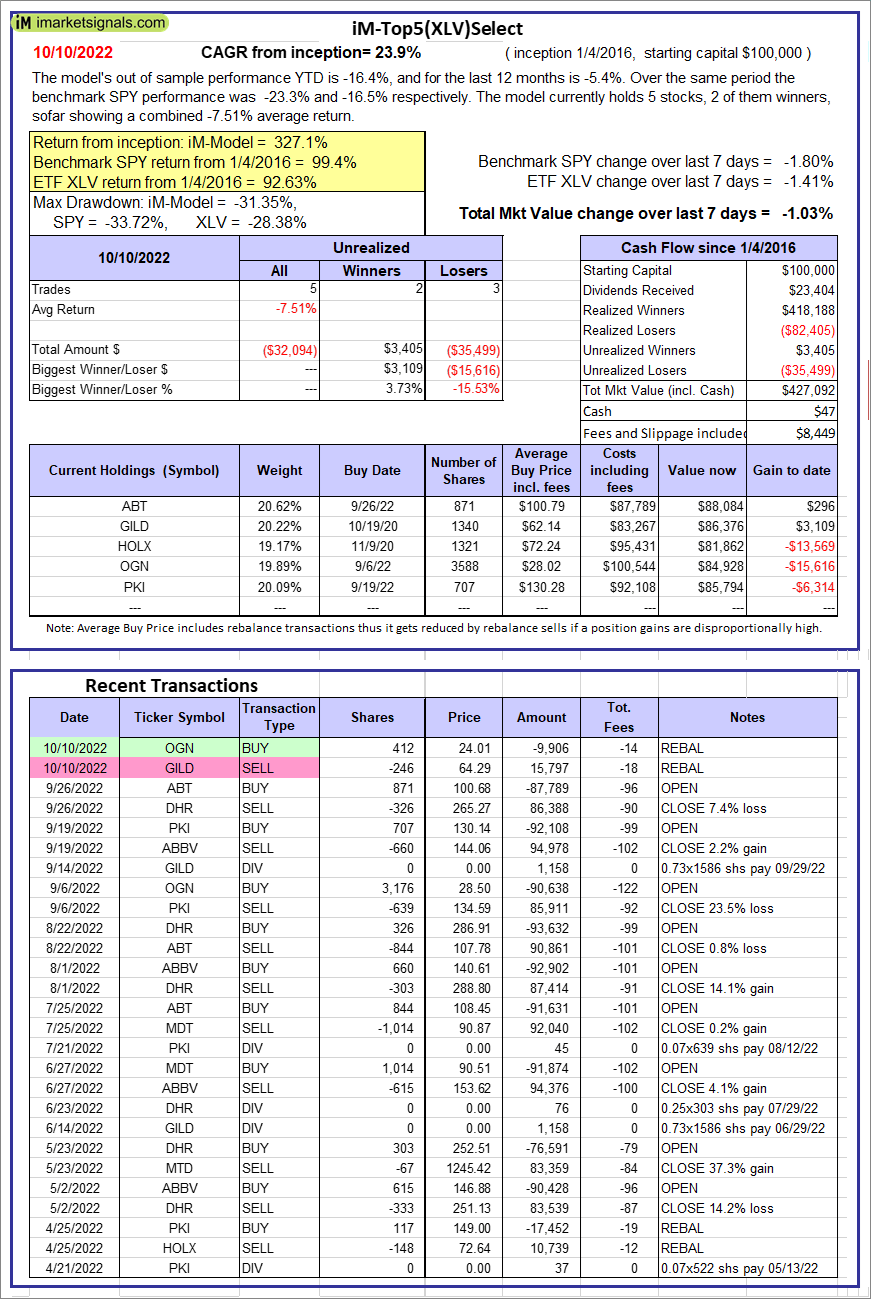  |
iM-Top5(XLV)Select: Since inception, on 1/5/2016, the model gained 327.09% while the benchmark SPY gained 99.37% over the same period. Over the previous week the market value of iM-Top5(XLV)Select gained -1.03% at a time when SPY gained -1.80%. A starting capital of $100,000 at inception on 1/5/2016 would have grown to $427,092 which includes $47 cash and excludes $8,449 spent on fees and slippage. |
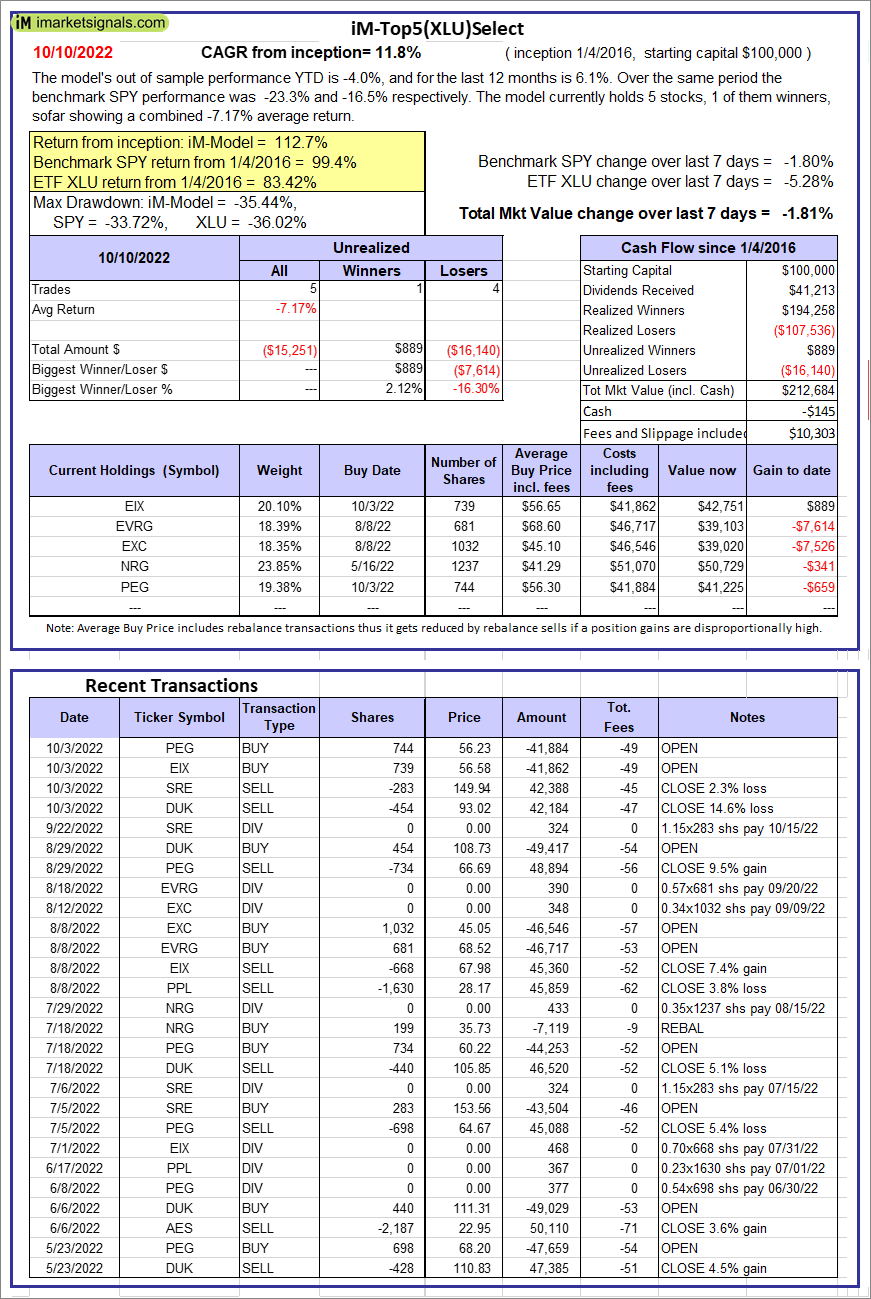 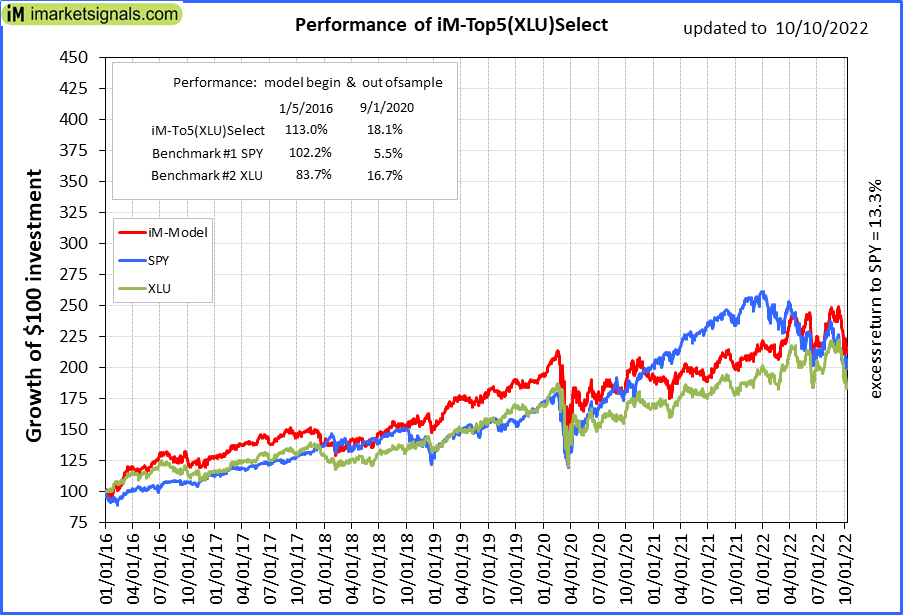 |
iM-Top5(XLU)Select: Since inception, on 1/5/2016, the model gained 112.68% while the benchmark SPY gained 99.37% over the same period. Over the previous week the market value of iM-Top5(XLU)Select gained -1.81% at a time when SPY gained -1.80%. A starting capital of $100,000 at inception on 1/5/2016 would have grown to $212,684 which includes -$145 cash and excludes $10,303 spent on fees and slippage. |
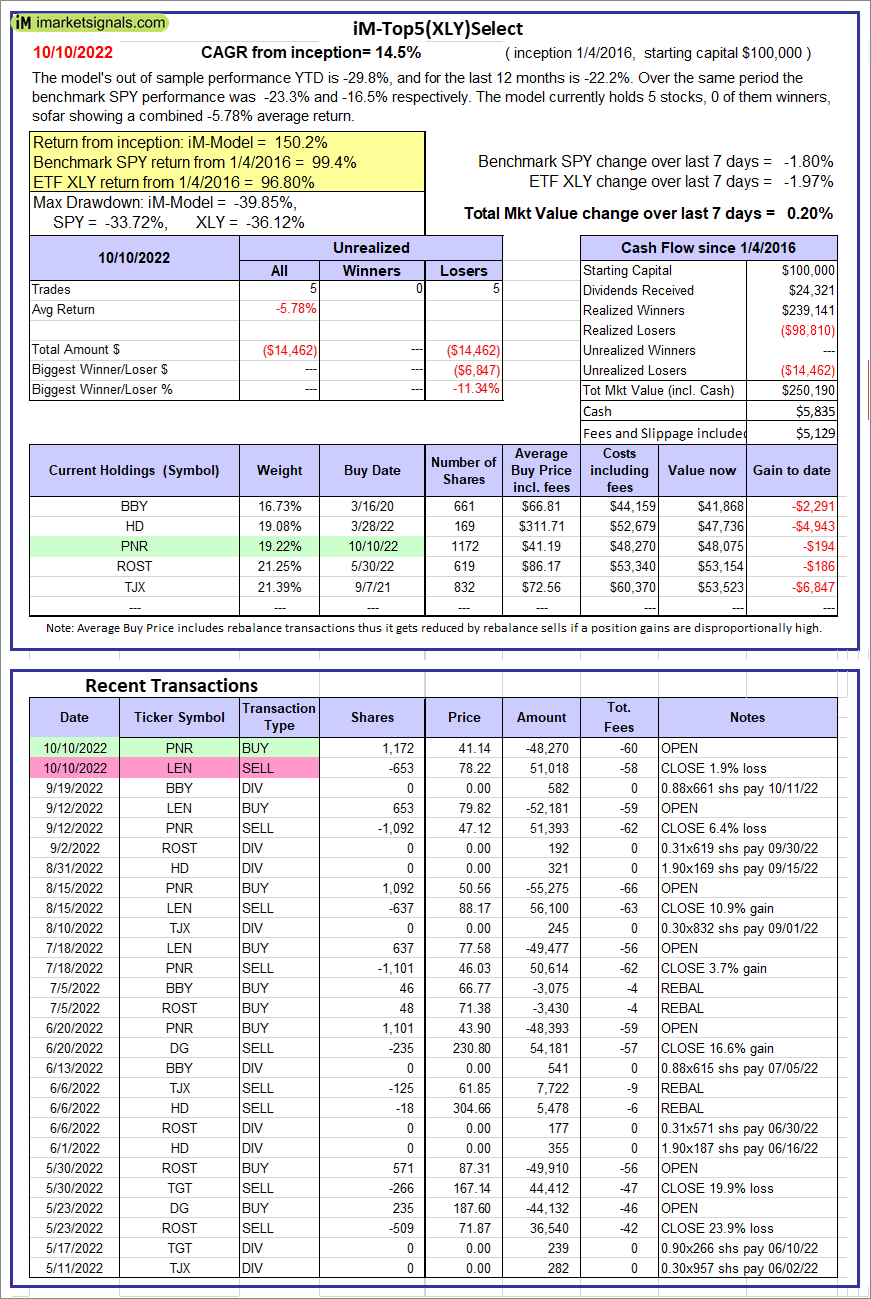 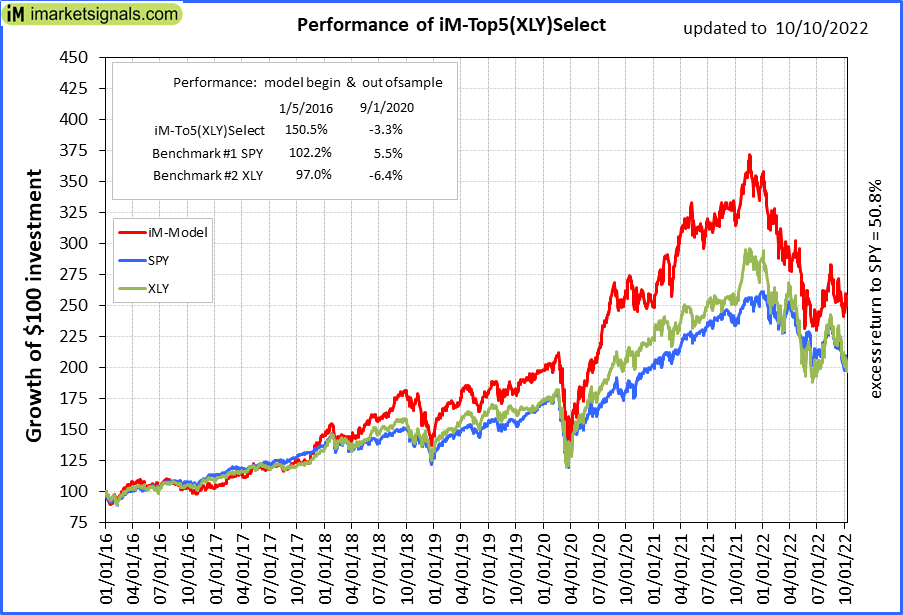 |
iM-Top5(XLY)Select: Since inception, on 1/5/2016, the model gained 150.19% while the benchmark SPY gained 99.37% over the same period. Over the previous week the market value of iM-Top5(XLY)Select gained 0.20% at a time when SPY gained -1.80%. A starting capital of $100,000 at inception on 1/5/2016 would have grown to $250,190 which includes $5,835 cash and excludes $5,129 spent on fees and slippage. |
 |
iM-Seasonal Super-Sectors (Top5 combo) : Since inception, on 11/17/2020, the model gained 7.71% while the benchmark SPY gained 3.50% over the same period. Over the previous week the market value of iM-Seasonal Super-Sectors (Top5 combo) gained -2.01% at a time when SPY gained -1.80%. A starting capital of $100,000 at inception on 11/17/2020 would have grown to $107,712 which includes $2,678 cash and excludes $00 spent on fees and slippage. |
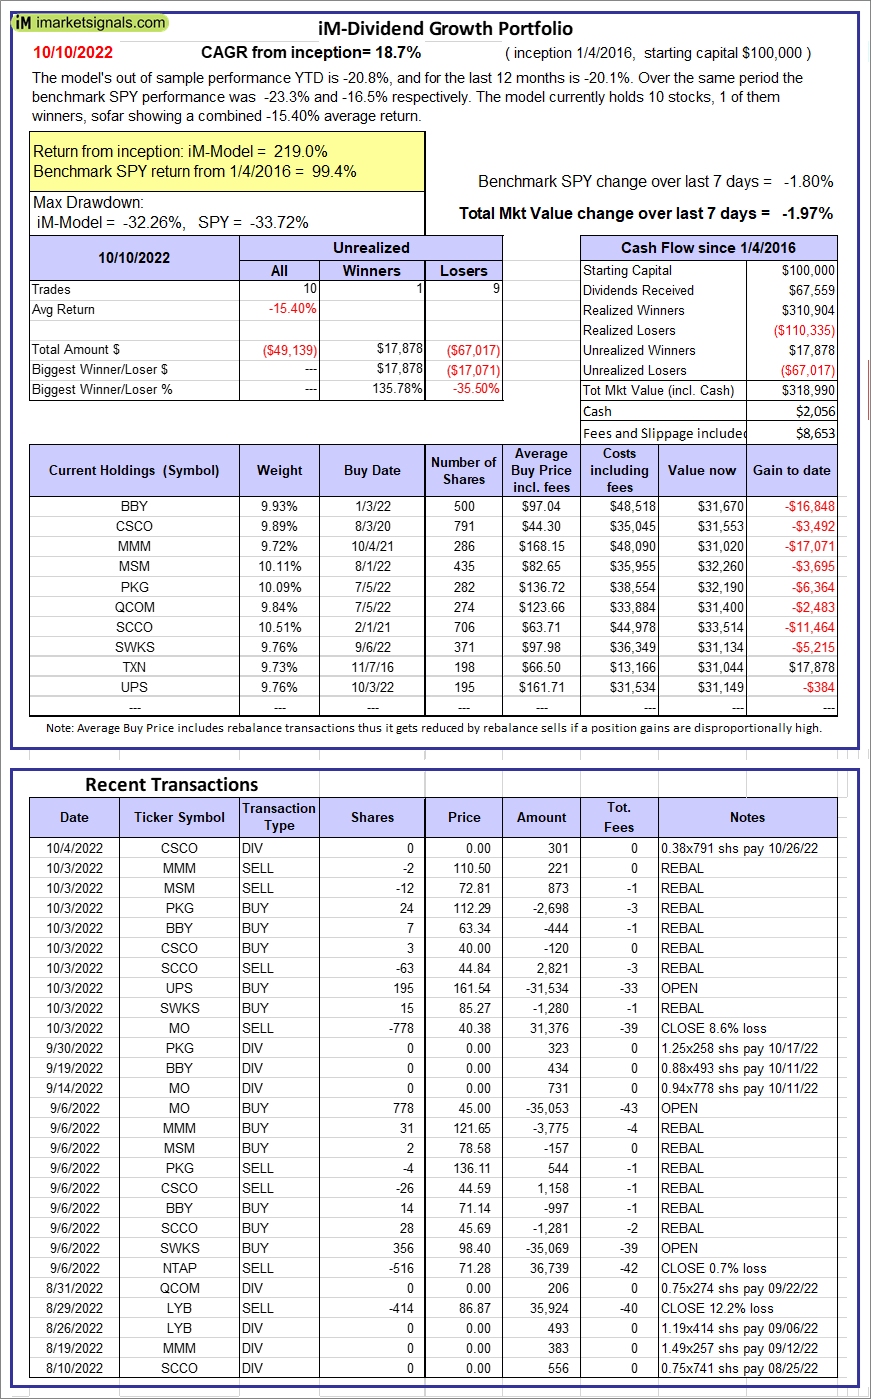 |
iM-Dividend Growth Portfolio: The model’s out of sample performance YTD is -20.8%, and for the last 12 months is -20.1%. Over the same period the benchmark SPY performance was -23.3% and -16.5% respectively. Over the previous week the market value of the iM-Dividend Growth Portfolio gained -1.97% at a time when SPY gained -1.80%. A starting capital of $100,000 at inception on 6/30/2016 would have grown to $318,990 which includes $2,056 cash and excludes $8,653 spent on fees and slippage. |
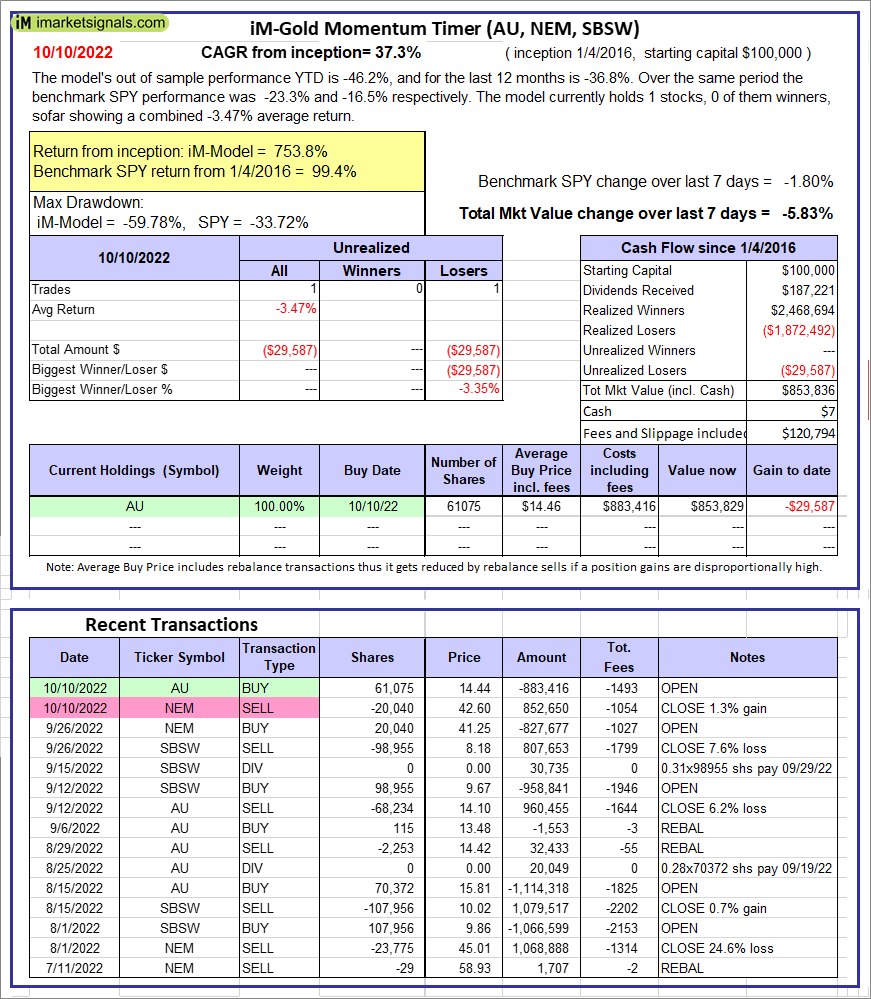 |
iM-Gold Momentum Timer (AU, NEM, SBSW): The model’s out of sample performance YTD is -46.2%, and for the last 12 months is -36.8%. Over the same period the benchmark SPY performance was -23.3% and -16.5% respectively. Over the previous week the market value of iM-Gold Momentum Timer (AU, NEM, SBSW) gained -5.83% at a time when SPY gained -1.80%. A starting capital of $100,000 at inception on 6/30/2016 would have grown to $07 which includes $120,794 cash and excludes Gain to date spent on fees and slippage. |
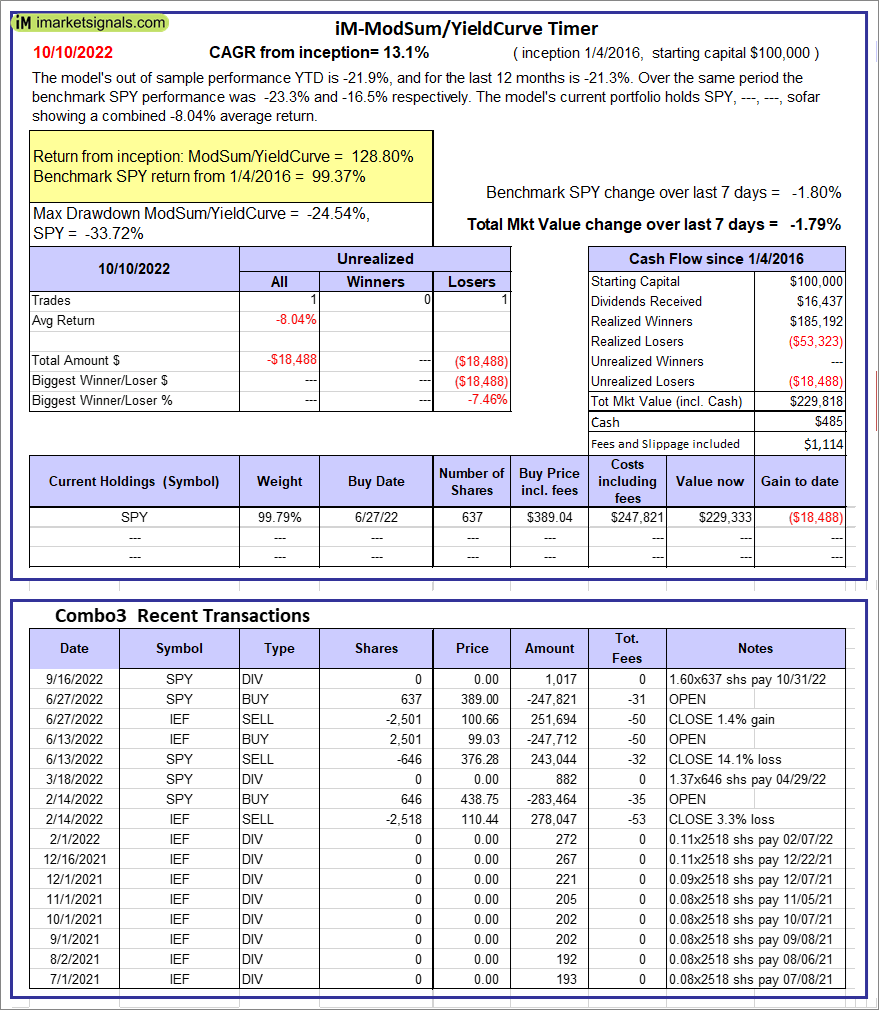 |
iM-ModSum/YieldCurve Timer: The model’s out of sample performance YTD is -21.9%, and for the last 12 months is -21.3%. Over the same period the benchmark SPY performance was -23.3% and -16.5% respectively. Over the previous week the market value of iM-PortSum/YieldCurve Timer gained -1.79% at a time when SPY gained -1.80%. A starting capital of $100,000 at inception on 1/1/2016 would have grown to $229,818 which includes $485 cash and excludes $1,114 spent on fees and slippage. |
 |
iM-Best(SPY-SH).R1: The model’s out of sample performance YTD is -31.1%, and for the last 12 months is -25.1%. Over the same period the benchmark SPY performance was -23.3% and -16.5% respectively. Over the previous week the market value of Best(SPY-SH) gained -1.79% at a time when SPY gained -1.80%. A starting capital of $100,000 at inception on 1/2/2009 would have grown to $61,115 which includes $272 cash and excludes $2,306 spent on fees and slippage. |
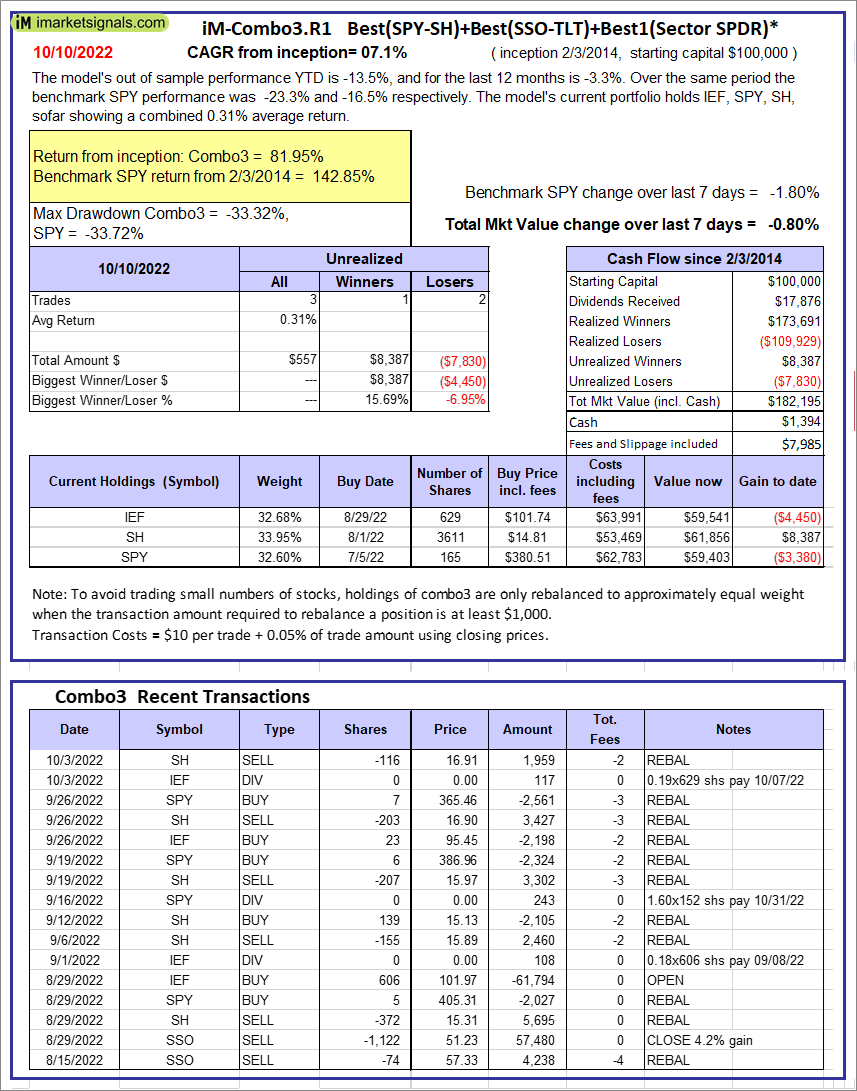 |
iM-Combo3.R1: The model’s out of sample performance YTD is -13.5%, and for the last 12 months is -3.3%. Over the same period the benchmark SPY performance was -23.3% and -16.5% respectively. Over the previous week the market value of iM-Combo3.R1 gained -0.80% at a time when SPY gained -1.80%. A starting capital of $100,000 at inception on 2/3/2014 would have grown to $182,195 which includes $1,394 cash and excludes $7,985 spent on fees and slippage. |
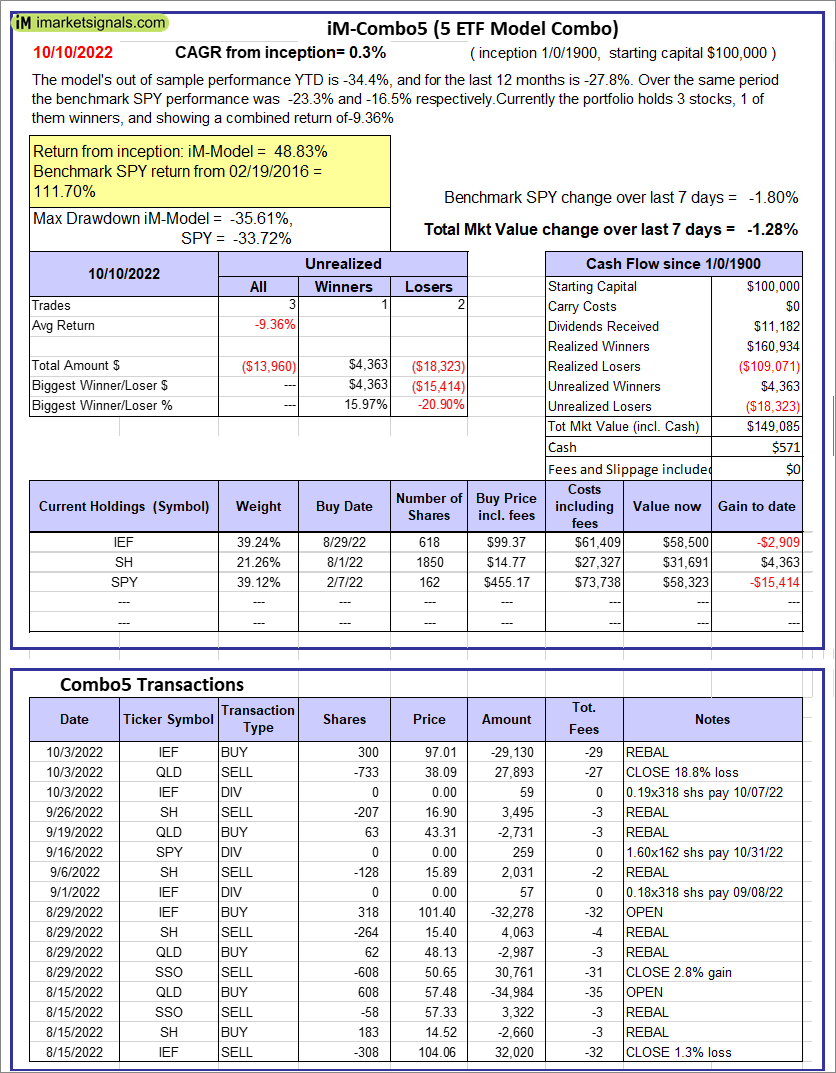 |
iM-Combo5: The model’s out of sample performance YTD is -34.4%, and for the last 12 months is -27.8%. Over the same period the benchmark SPY performance was -23.3% and -16.5% respectively. Over the previous week the market value of iM-Combo5 gained -1.28% at a time when SPY gained -1.80%. A starting capital of $100,000 at inception on 2/22/2016 would have grown to $149,085 which includes $571 cash and excludes $0 spent on fees and slippage. |
 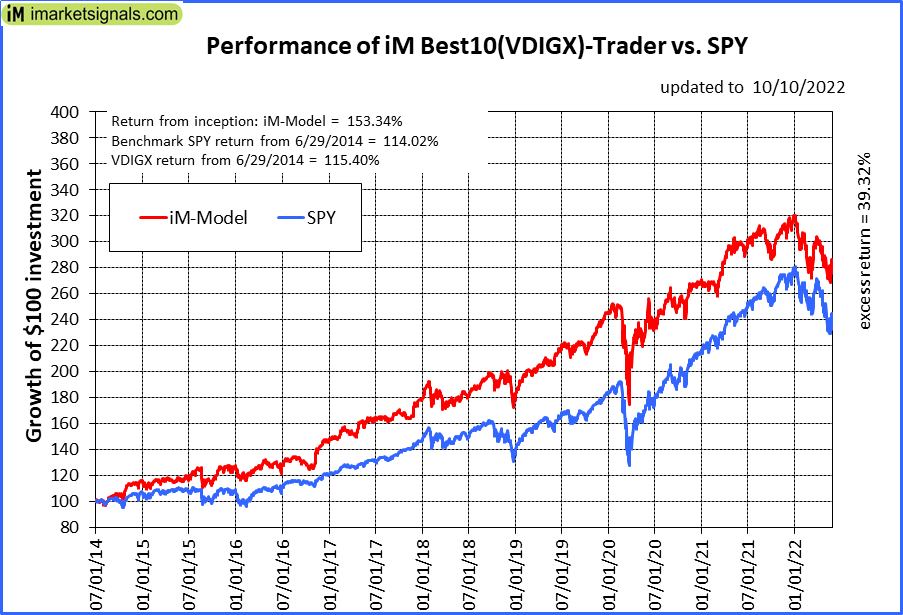 |
iM-Best10(VDIGX)-Trader: The model’s out of sample performance YTD is -20.9%, and for the last 12 months is -13.4%. Over the same period the benchmark SPY performance was -23.3% and -16.5% respectively. Since inception, on 7/1/2014, the model gained 153.34% while the benchmark SPY gained 114.02% and VDIGX gained 115.40% over the same period. Over the previous week the market value of iM-Best10(VDIGX) gained -1.80% at a time when SPY gained -1.80%. A starting capital of $100,000 at inception on 7/1/2014 would have grown to $253,342 which includes $486 cash and excludes $4,365 spent on fees and slippage. |
 |
iM 6-Stock Capital Strength Portfolio: The model’s out of sample performance YTD is -13.5%, and for the last 12 months is -7.8%. Over the same period the benchmark SPY performance was -23.3% and -16.5% respectively. Over the previous week the market value of the iM 6-Stock Capital Strength Portfolio gained -0.10% at a time when SPY gained -1.80%. A starting capital of $100,000 at inception on 10/28/2016 would have grown to $187,988 which includes $4,602 cash and excludes $2,452 spent on fees and slippage. |
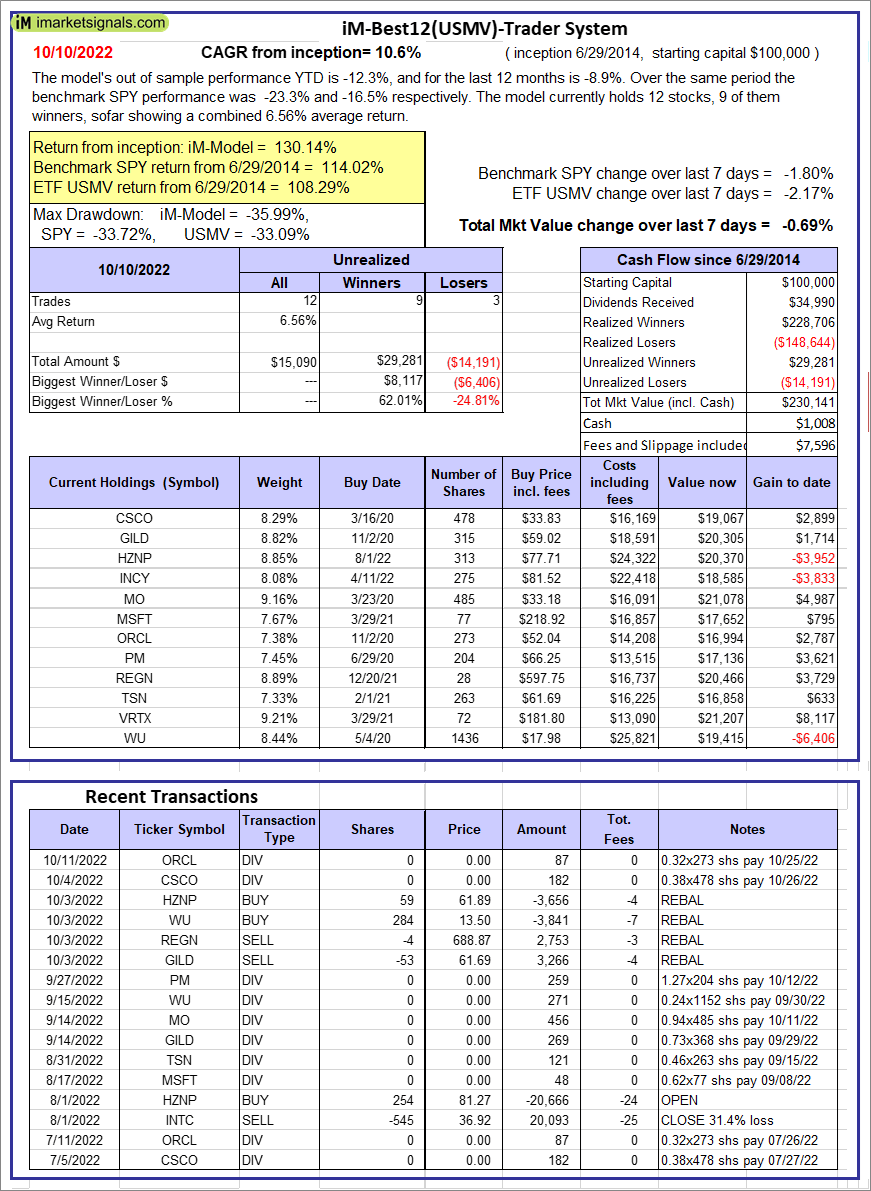  |
iM-Best12(USMV)-Trader: The model’s out of sample performance YTD is -12.3%, and for the last 12 months is -8.9%. Over the same period the benchmark SPY performance was -23.3% and -16.5% respectively. Since inception, on 6/30/2014, the model gained 130.14% while the benchmark SPY gained 114.02% and the ETF USMV gained 108.29% over the same period. Over the previous week the market value of iM-Best12(USMV)-Trader gained -0.69% at a time when SPY gained -1.80%. A starting capital of $100,000 at inception on 6/30/2014 would have grown to $230,141 which includes $1,008 cash and excludes $7,596 spent on fees and slippage. |
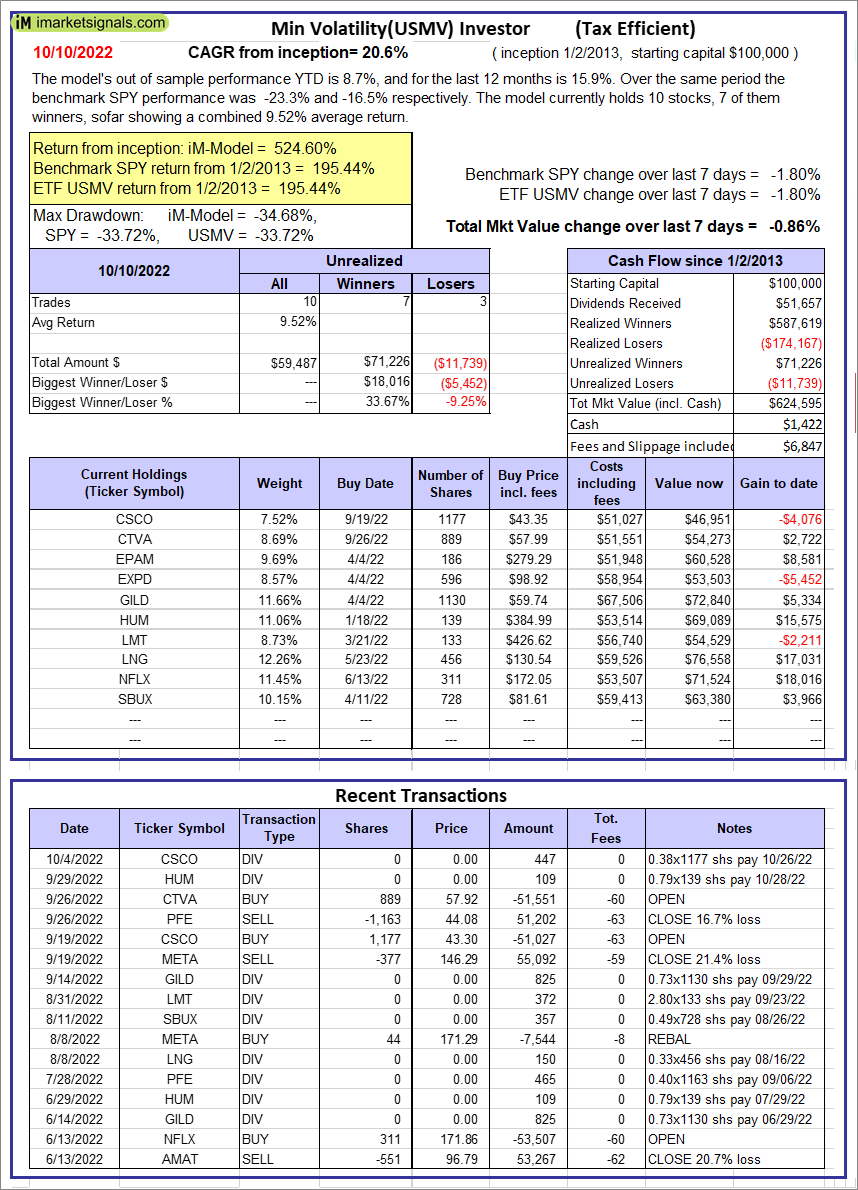 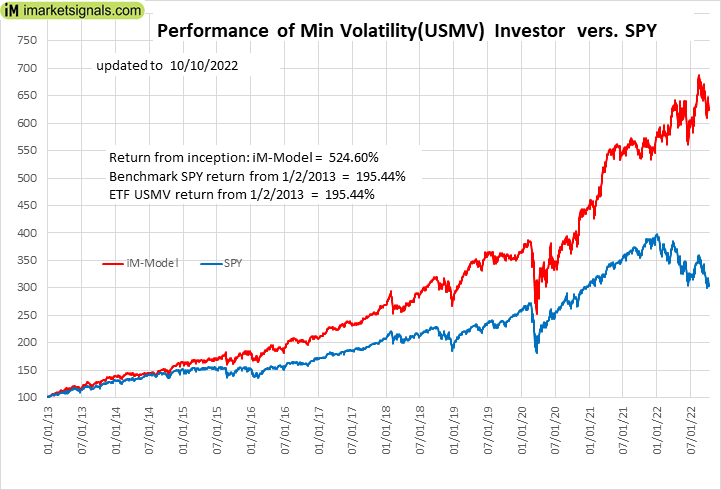 |
iM-Min Volatility(USMV) Investor (Tax Efficient): The model’s out of sample performance YTD is 8.7%, and for the last 12 months is 15.9%. Over the same period the benchmark SPY performance was -23.3% and -16.5% respectively. Since inception, on 1/3/2013, the model gained 524.60% while the benchmark SPY gained 195.44% and the ETF USMV gained 195.44% over the same period. Over the previous week the market value of iM-Best12(USMV)Q1 gained -0.86% at a time when SPY gained -1.80%. A starting capital of $100,000 at inception on 1/3/2013 would have grown to $624,595 which includes $1,422 cash and excludes $6,847 spent on fees and slippage. |
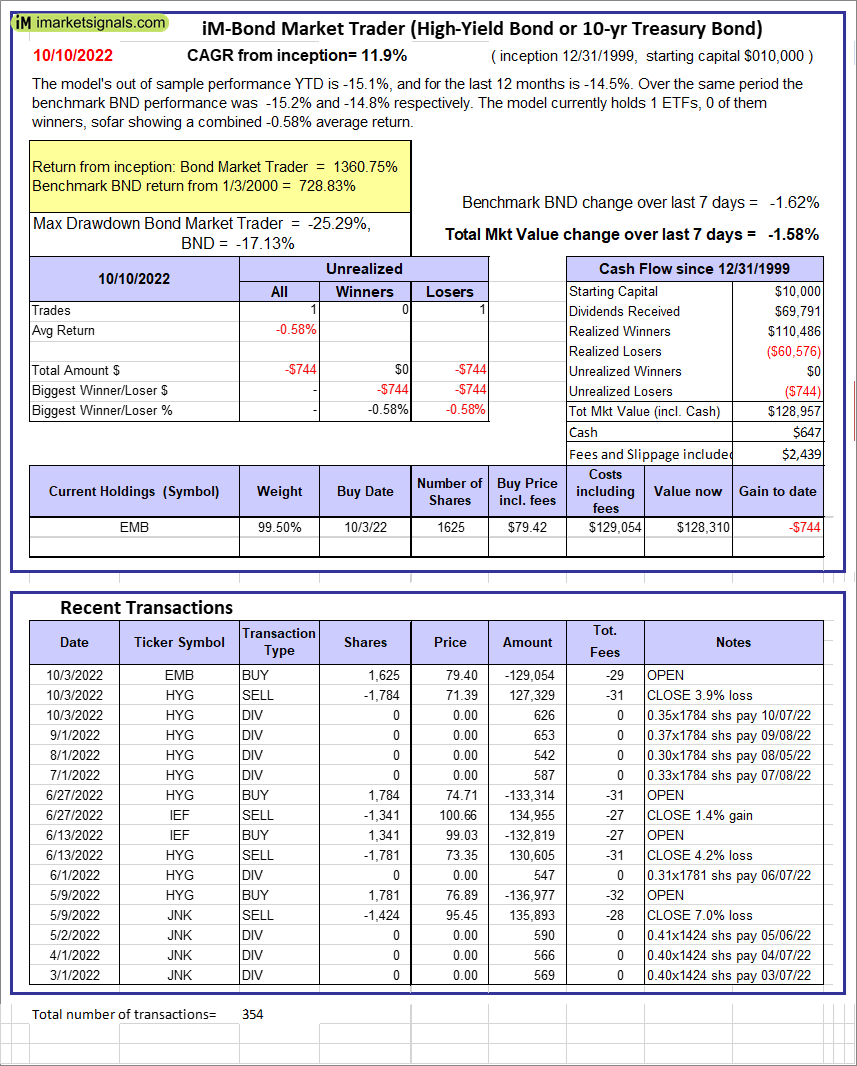 |
iM-Bond Market Trader (High-Yield Bond or 10-yr Treasury Bond): The model’s out of sample performance YTD is -15.1%, and for the last 12 months is -14.5%. Over the same period the benchmark BND performance was -15.2% and -14.8% respectively. Over the previous week the market value of the iM-Bond Market Trader (High-Yield Bond or 10-yr Treasury Bond) gained -1.58% at a time when BND gained -1.62%. A starting capital of $10,000 at inception on 1/3/2000 would have grown to $128,957 which includes $647 cash and excludes $2,439 spent on fees and slippage. |
|
|
iM-ModSum/YieldCurve Timer: The model’s out of sample performance YTD is -21.9%, and for the last 12 months is -21.3%. Over the same period the benchmark SPY performance was -23.3% and -16.5% respectively. Over the previous week the market value of iM-PortSum/YieldCurve Timer gained -1.79% at a time when SPY gained -1.80%. A starting capital of $100,000 at inception on 1/1/2016 would have grown to $229,818 which includes $485 cash and excludes $1,114 spent on fees and slippage. |
 |
iM-Best2 MC-Score ETF System: The model’s out of sample performance YTD is -16.6%, and for the last 12 months is -8.5%. Over the same period the benchmark SPY performance was -23.3% and -16.5% respectively. Over the previous week the market value of the iM-Best2 MC-Score ETF System gained -1.72% at a time when SPY gained -1.80%. A starting capital of $100,000 at inception on 6/30/2016 would have grown to $129,842 which includes $26 cash and excludes $1,816 spent on fees and slippage. |
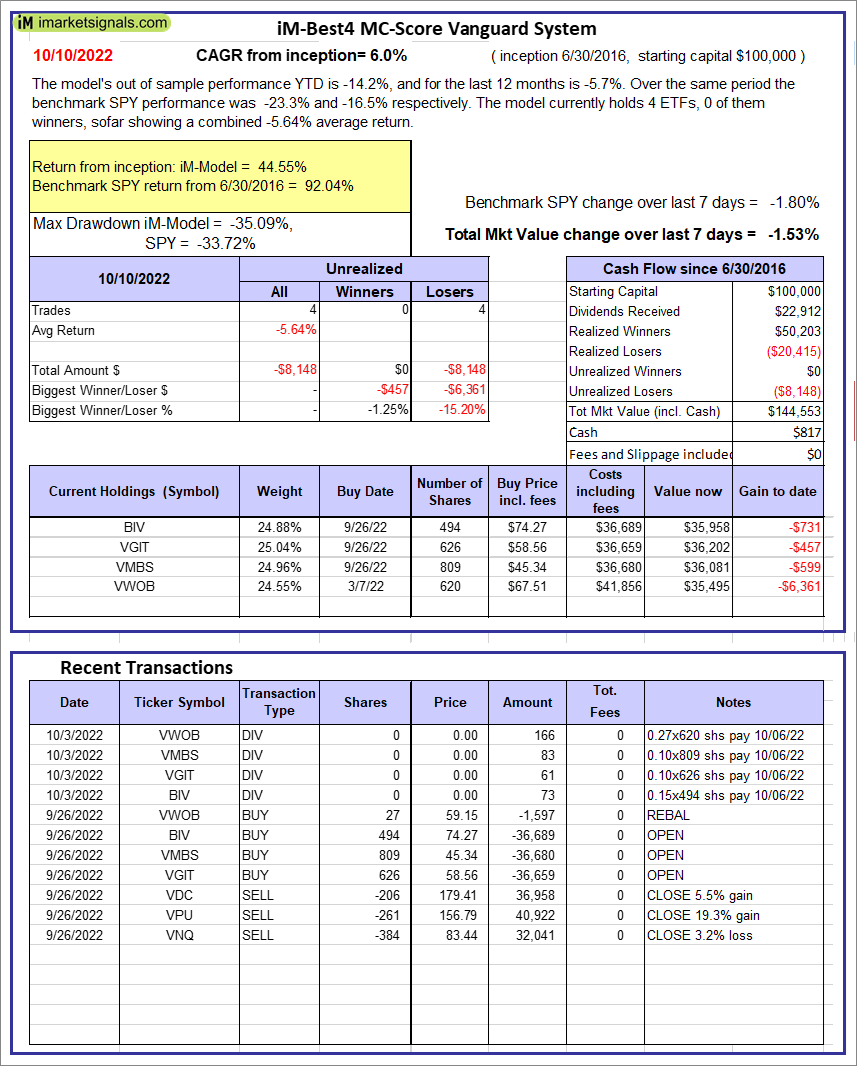 |
iM-Best4 MC-Score Vanguard System: The model’s out of sample performance YTD is -14.2%, and for the last 12 months is -5.7%. Over the same period the benchmark SPY performance was -23.3% and -16.5% respectively. Over the previous week the market value of the iM-Best4 MC-Score Vanguard System gained -1.53% at a time when SPY gained -1.80%. A starting capital of $100,000 at inception on 6/30/2016 would have grown to $144,553 which includes $817 cash and excludes $00 spent on fees and slippage. |
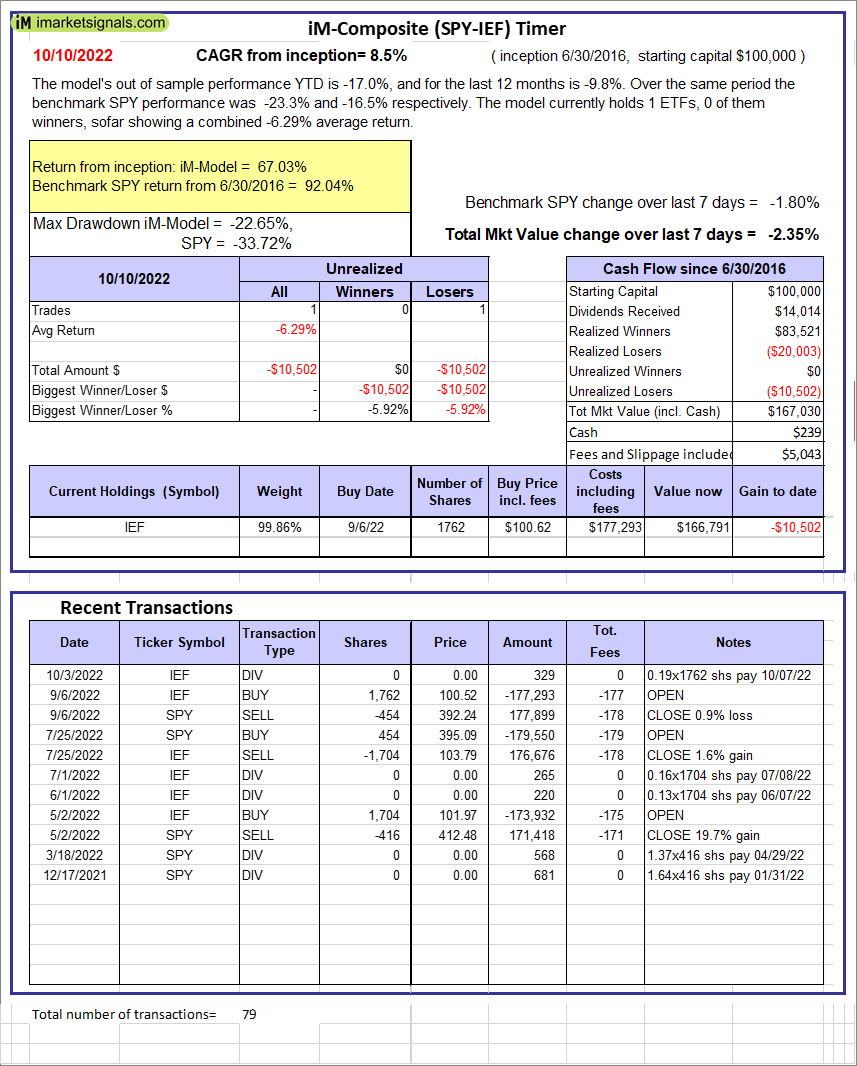 |
iM-Composite (SPY-IEF) Timer: The model’s out of sample performance YTD is -17.0%, and for the last 12 months is -9.8%. Over the same period the benchmark SPY performance was -23.3% and -16.5% respectively. Over the previous week the market value of the iM-Composite (SPY-IEF) Timer gained -2.35% at a time when SPY gained -1.80%. A starting capital of $100,000 at inception on 6/30/2016 would have grown to $167,030 which includes $239 cash and excludes $5,043 spent on fees and slippage. |
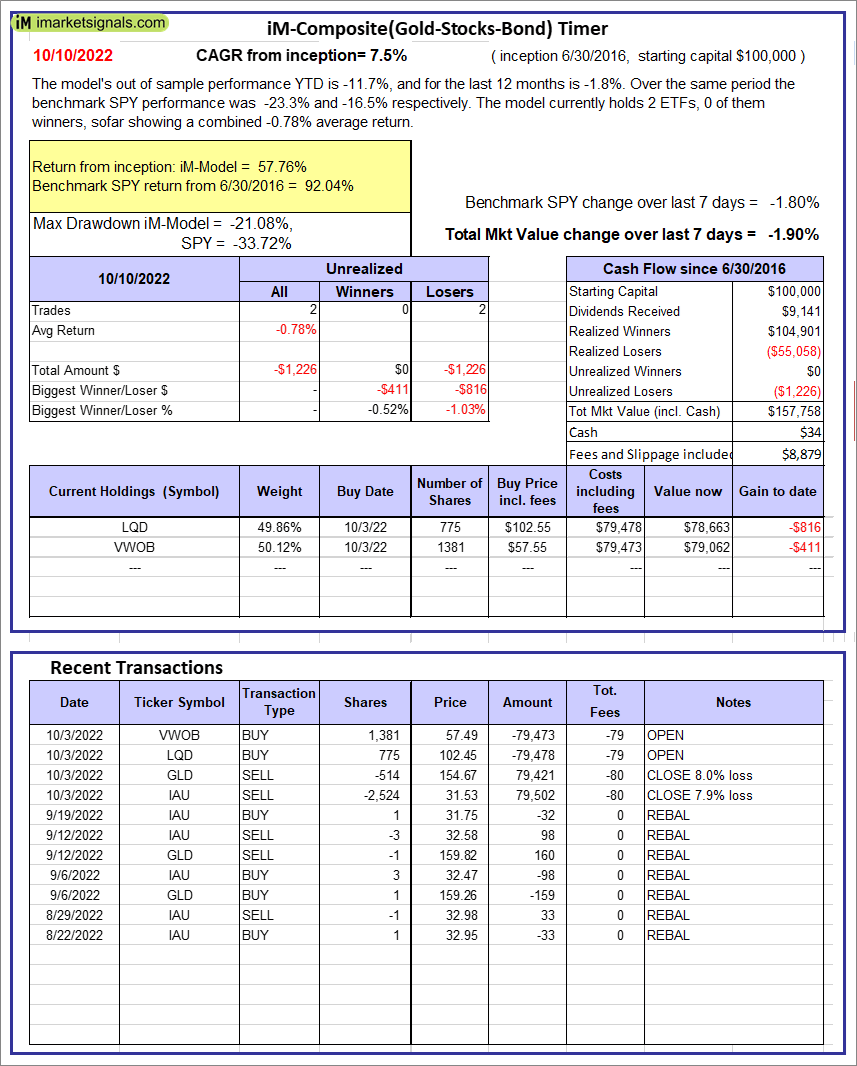 |
iM-Composite(Gold-Stocks-Bond) Timer: The model’s out of sample performance YTD is -11.7%, and for the last 12 months is -1.8%. Over the same period the benchmark SPY performance was -23.3% and -16.5% respectively. Over the previous week the market value of the iM-Composite(Gold-Stocks-Bond) Timer gained -1.90% at a time when SPY gained -1.80%. A starting capital of $100,000 at inception on 6/30/2016 would have grown to $157,758 which includes $34 cash and excludes $8,879 spent on fees and slippage. |
iM-Best Reports – 10/10/2022
Posted in pmp SPY-SH
Leave a Reply
You must be logged in to post a comment.