
  |
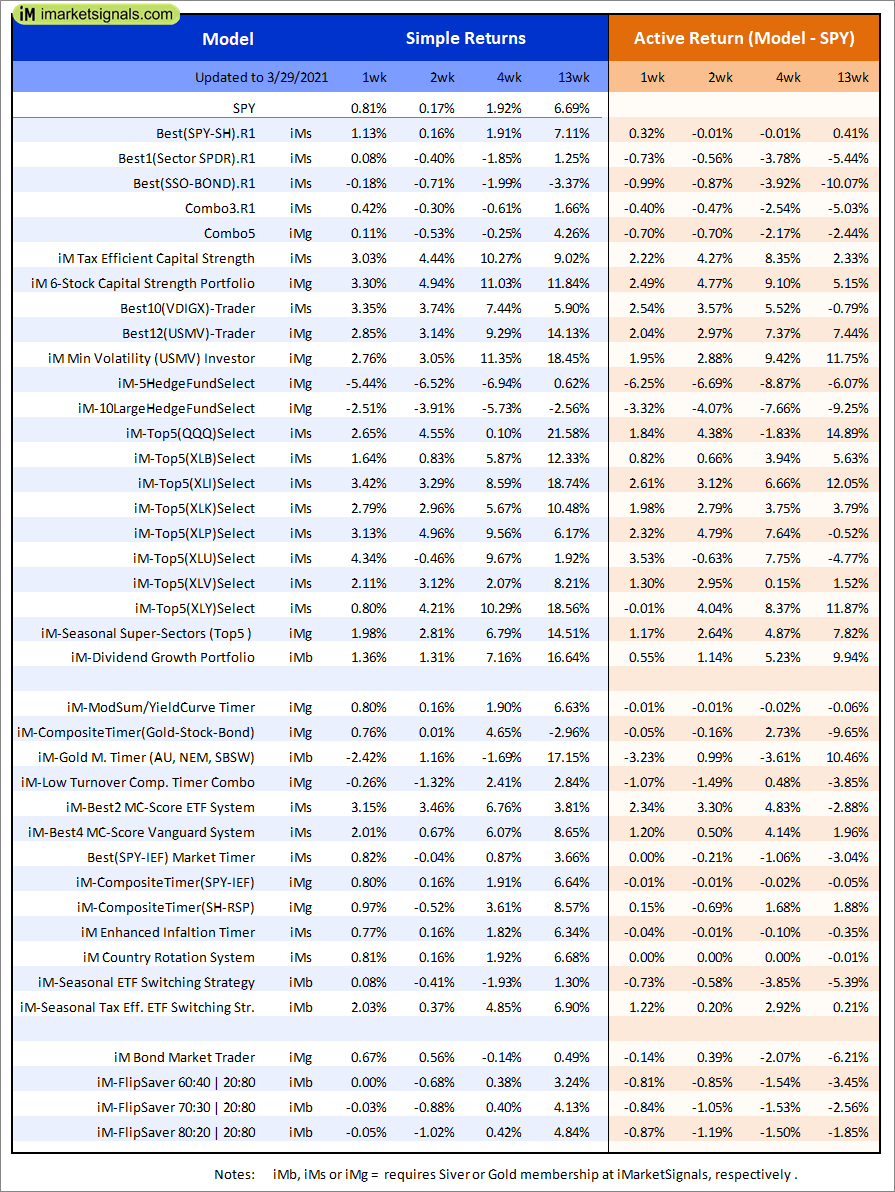
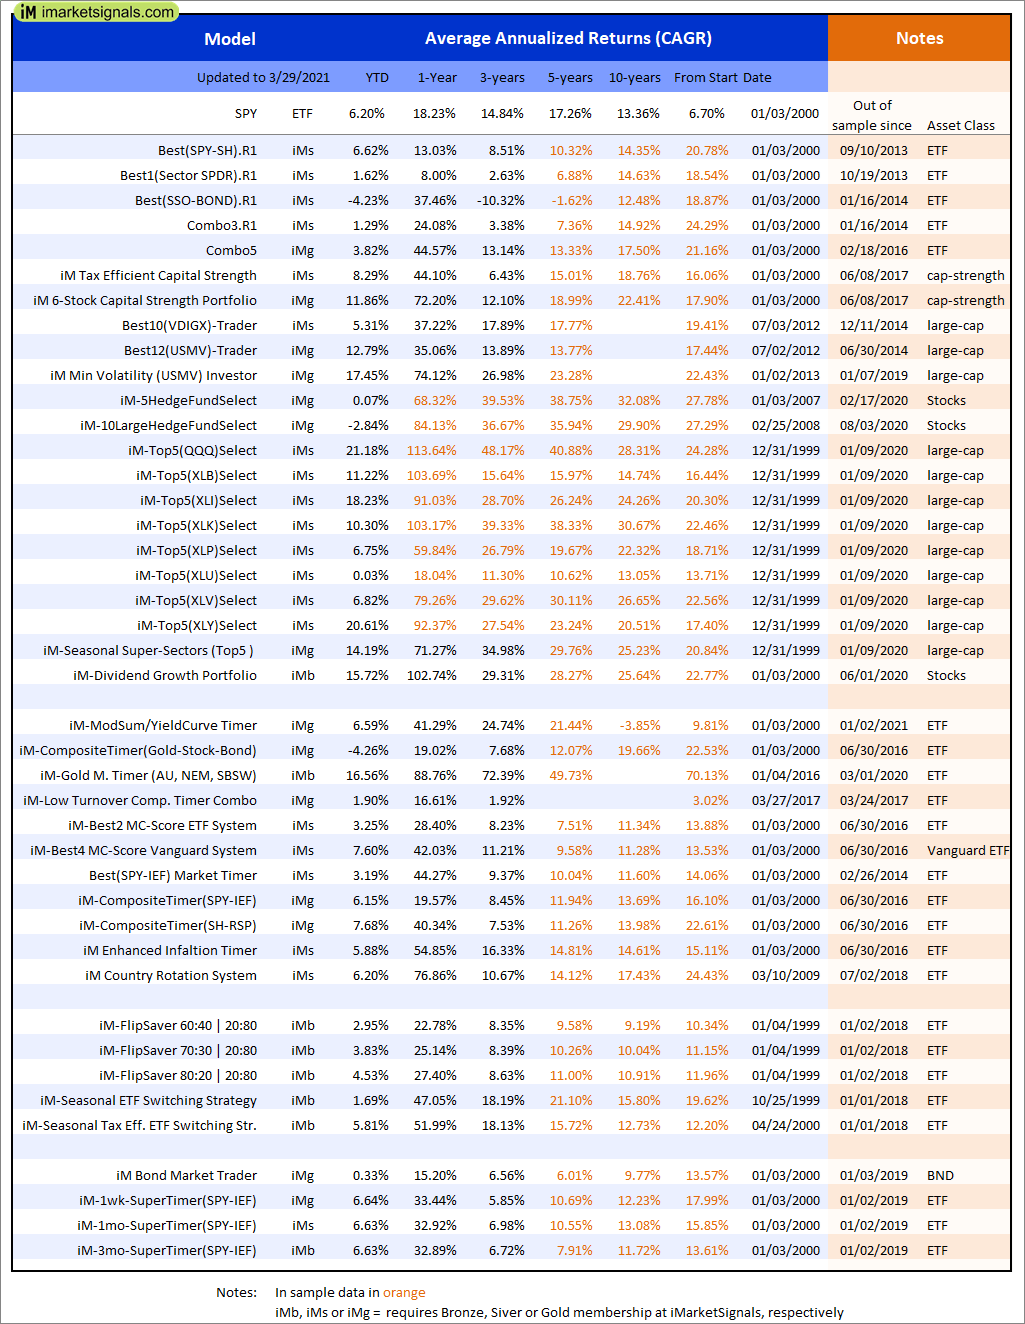
Out of sample performance summary of our models for the past 1, 2, 4 and 13 week periods. The active active return indicates how the models over- or underperformed the benchmark ETF SPY. Also the YTD, and the 1-, 3-, 5- and 10-year annualized returns are shown in the second table |
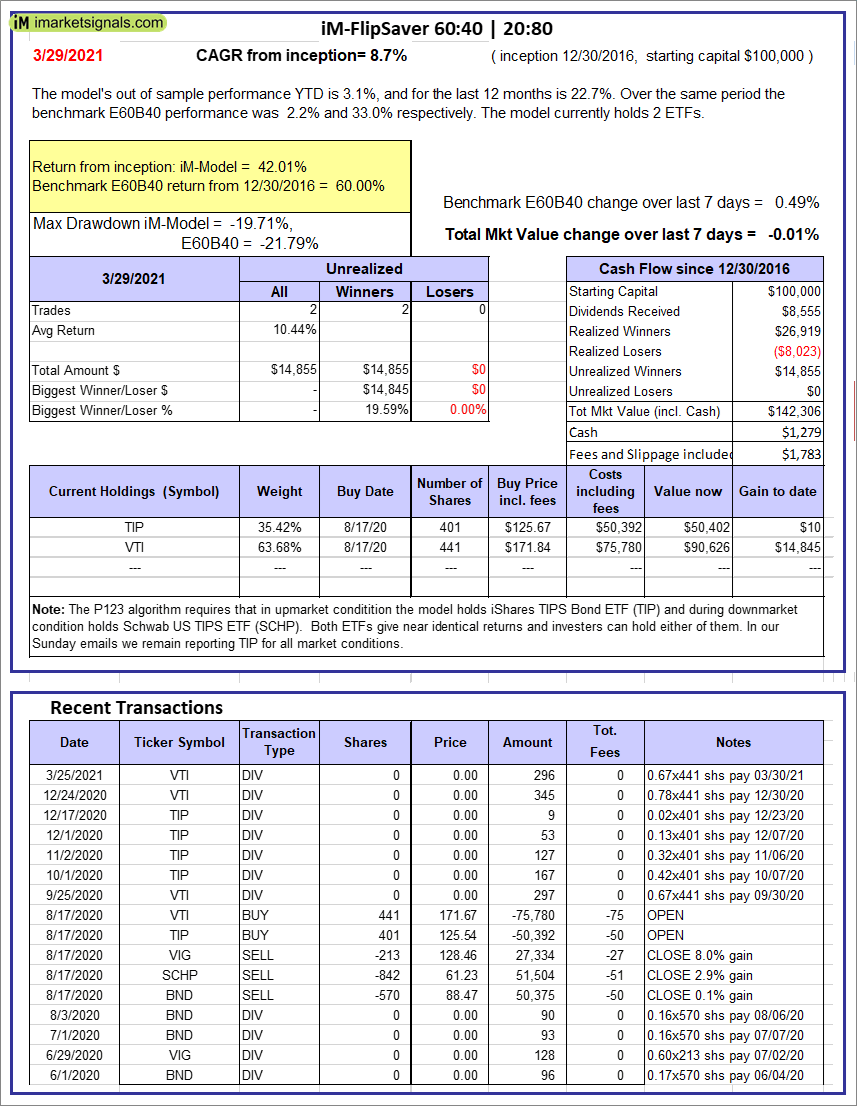 |
iM-FlipSaver 60:40 | 20:80 – 2017: The model’s out of sample performance YTD is 3.1%, and for the last 12 months is 22.7%. Over the same period the benchmark E60B40 performance was 2.2% and 33.0% respectively. Over the previous week the market value of iM-FlipSaver 80:20 | 20:80 gained -0.01% at a time when SPY gained 0.49%. A starting capital of $100,000 at inception on 7/16/2015 would have grown to $142,306 which includes $1,279 cash and excludes $1,783 spent on fees and slippage. |
 |
iM-FlipSaver 70:30 | 20:80 – 2017: The model’s out of sample performance YTD is 3.8%, and for the last 12 months is 25.0%. Over the same period the benchmark E60B40 performance was 2.2% and 33.0% respectively. Over the previous week the market value of iM-FlipSaver 70:30 | 20:80 gained -0.03% at a time when SPY gained 0.49%. A starting capital of $100,000 at inception on 7/15/2015 would have grown to $145,556 which includes $1,228 cash and excludes $1,918 spent on fees and slippage. |
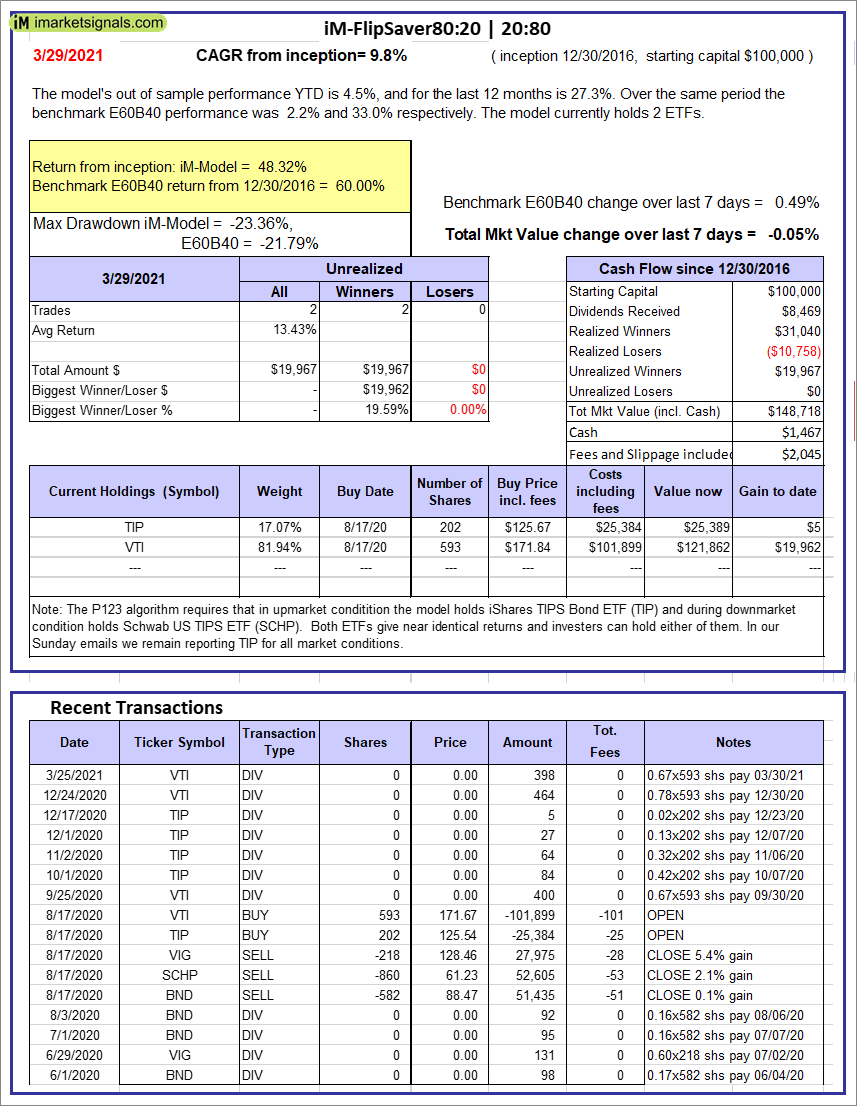 |
iM-FlipSaver 80:20 | 20:80 – 2017: The model’s out of sample performance YTD is 4.5%, and for the last 12 months is 27.3%. Over the same period the benchmark E60B40 performance was 2.2% and 33.0% respectively. Over the previous week the market value of iM-FlipSaver 80:20 | 20:80 gained -0.05% at a time when SPY gained 0.49%. A starting capital of $100,000 at inception on 1/2/2017 would have grown to $148,718 which includes $1,467 cash and excludes $2,045 spent on fees and slippage. |
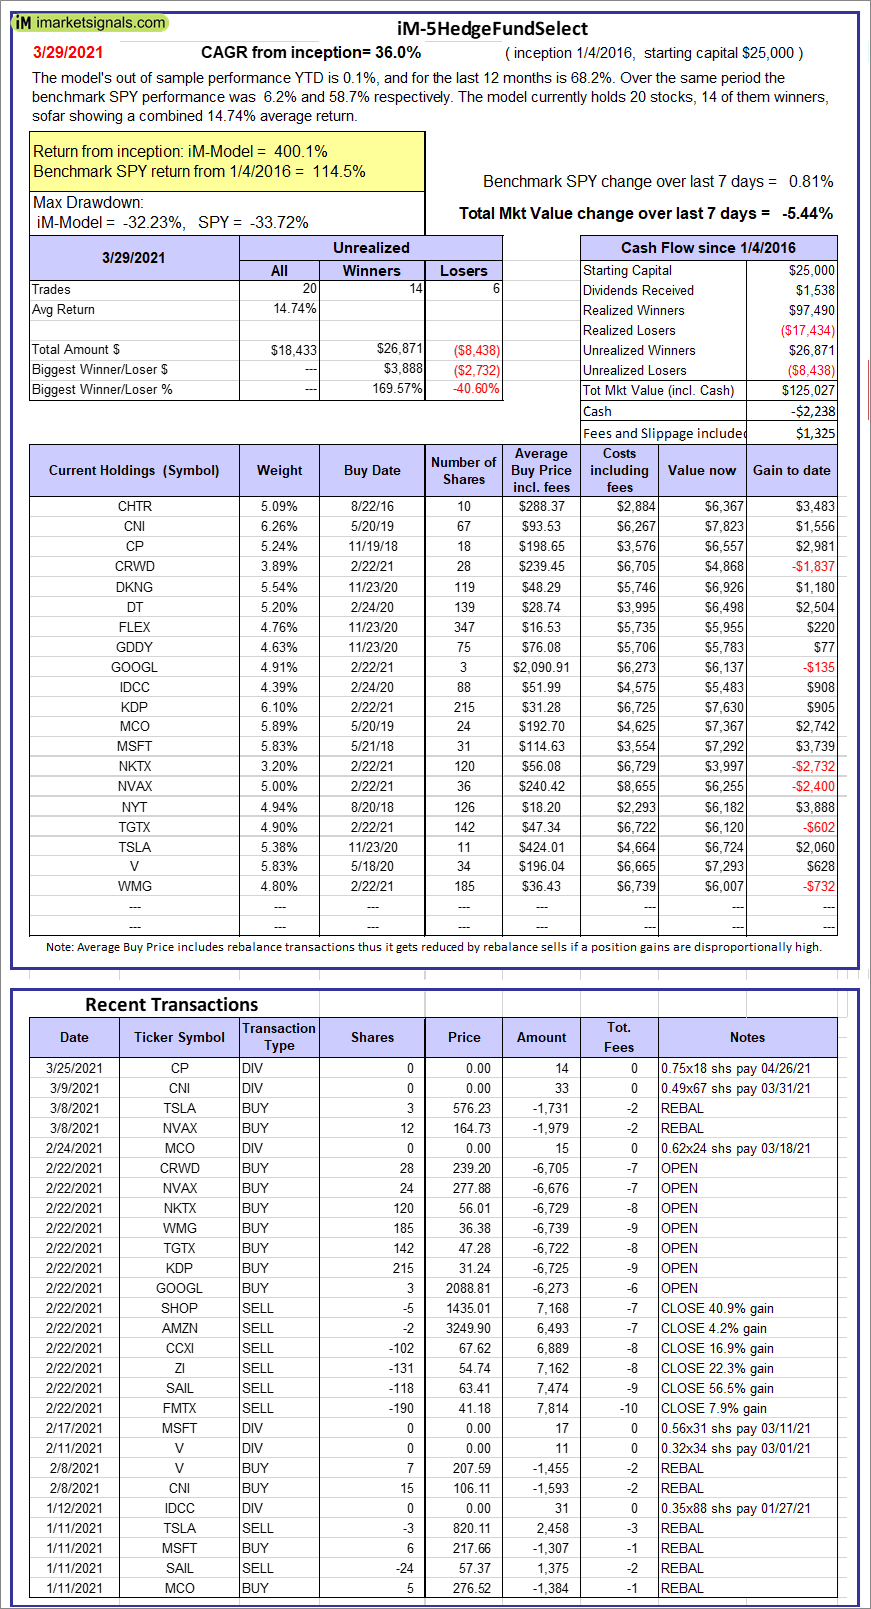 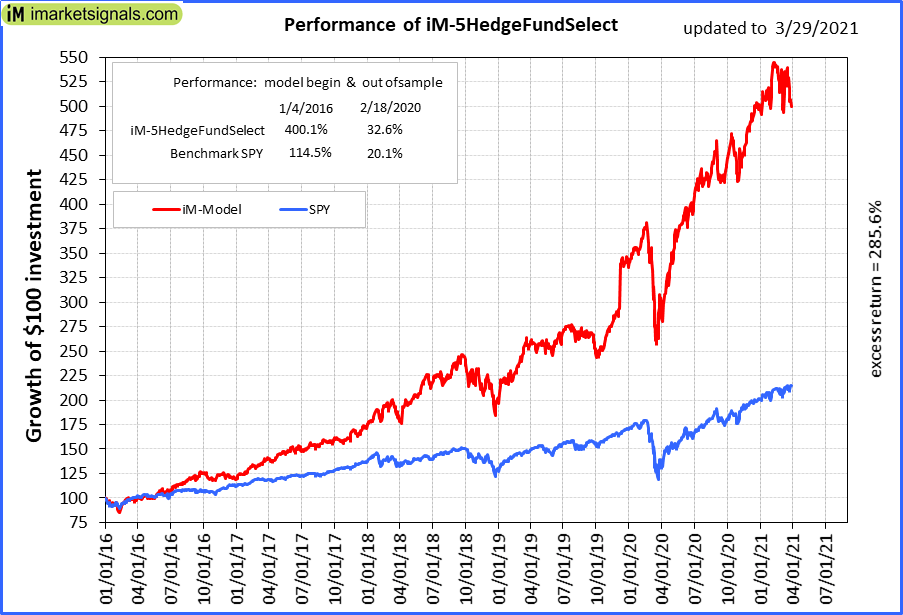 |
iM-5HedgeFundSelect: Since inception, on 1/5/2016, the model gained 400.11% while the benchmark SPY gained 114.52% over the same period. Over the previous week the market value of iM-5HedgeFundSelect gained -5.44% at a time when SPY gained 0.81%. A starting capital of $25,000 at inception on 1/5/2016 would have grown to $125,027 which includes -$2,238 cash and excludes $1,325 spent on fees and slippage. |
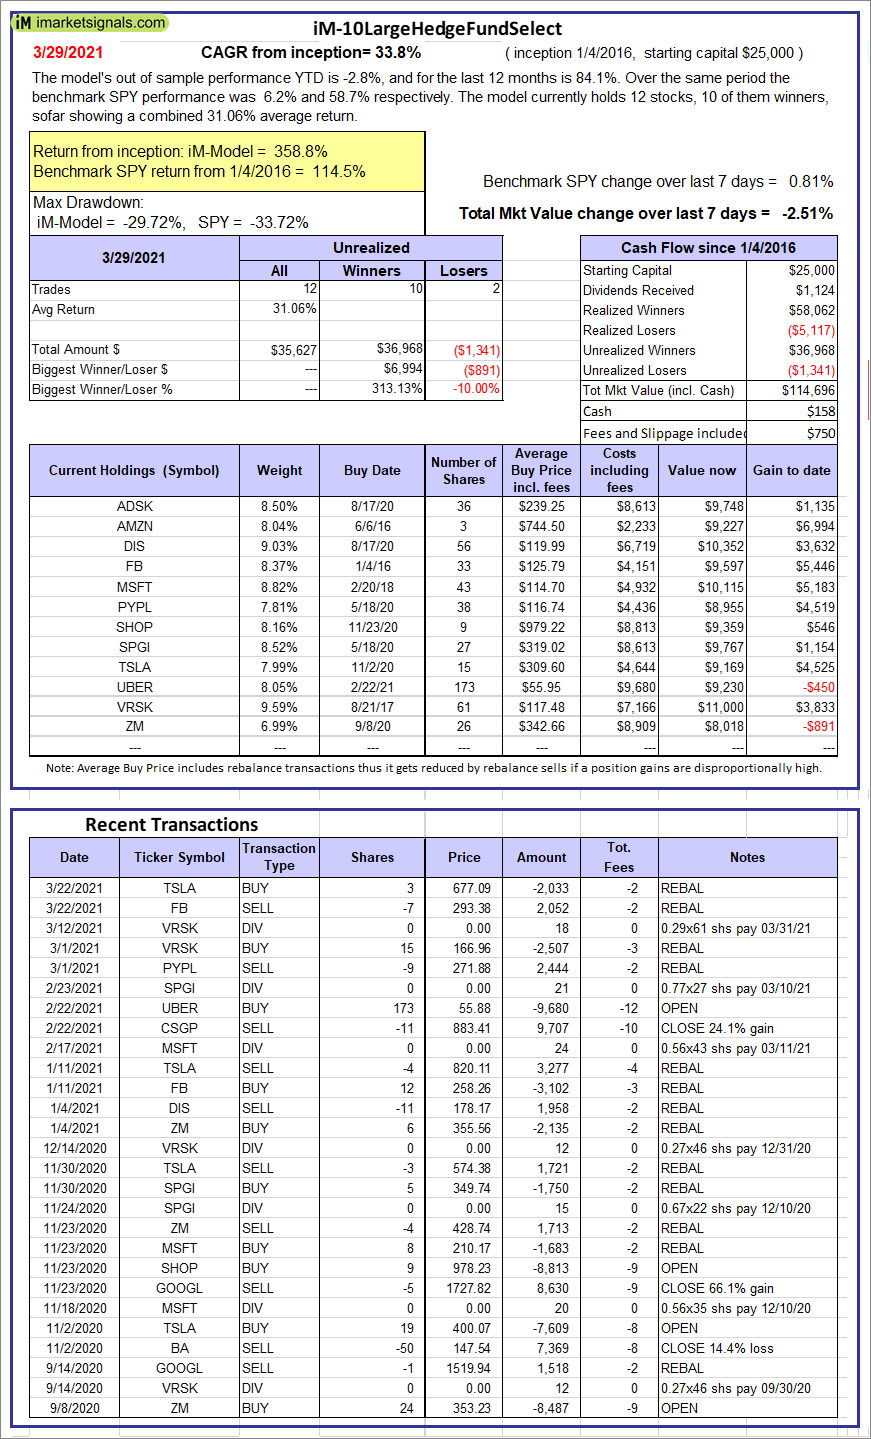  |
iM-10LargeHedgeFundSelect: Since inception, on 1/5/2016, the model gained 358.78% while the benchmark SPY gained 114.52% over the same period. Over the previous week the market value of iM-10LargeHedgeFundSelect gained -2.51% at a time when SPY gained 0.81%. A starting capital of $25,000 at inception on 1/5/2016 would have grown to $114,696 which includes $158 cash and excludes $750 spent on fees and slippage. |
 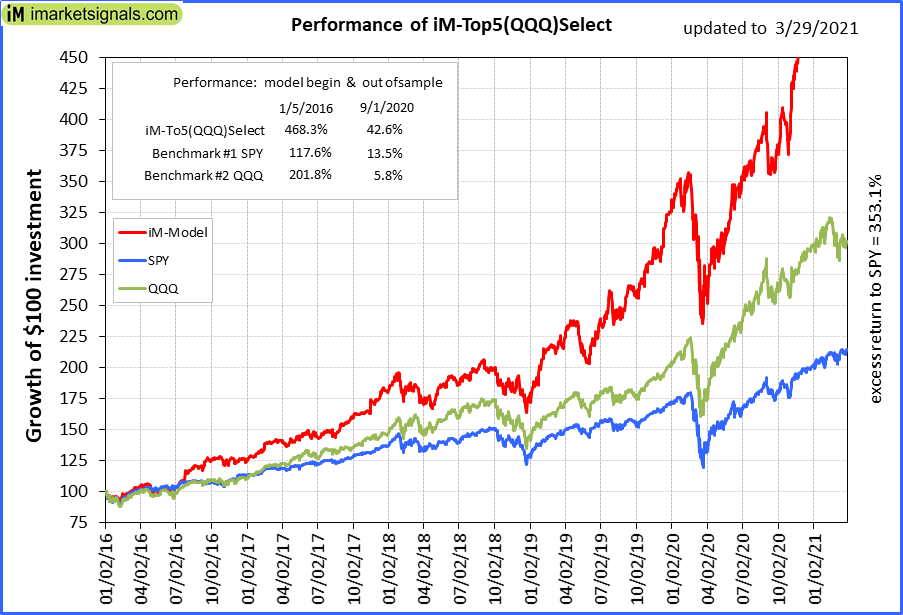 |
iM-Top5(QQQ)Select: Since inception, on 1/5/2016, the model gained 467.63% while the benchmark SPY gained 114.52% over the same period. Over the previous week the market value of iM-Top5(QQQ)Select gained 2.79% at a time when SPY gained 0.81%. A starting capital of $100,000 at inception on 1/5/2016 would have grown to $567,631 which includes $7,992 cash and excludes $6,718 spent on fees and slippage. |
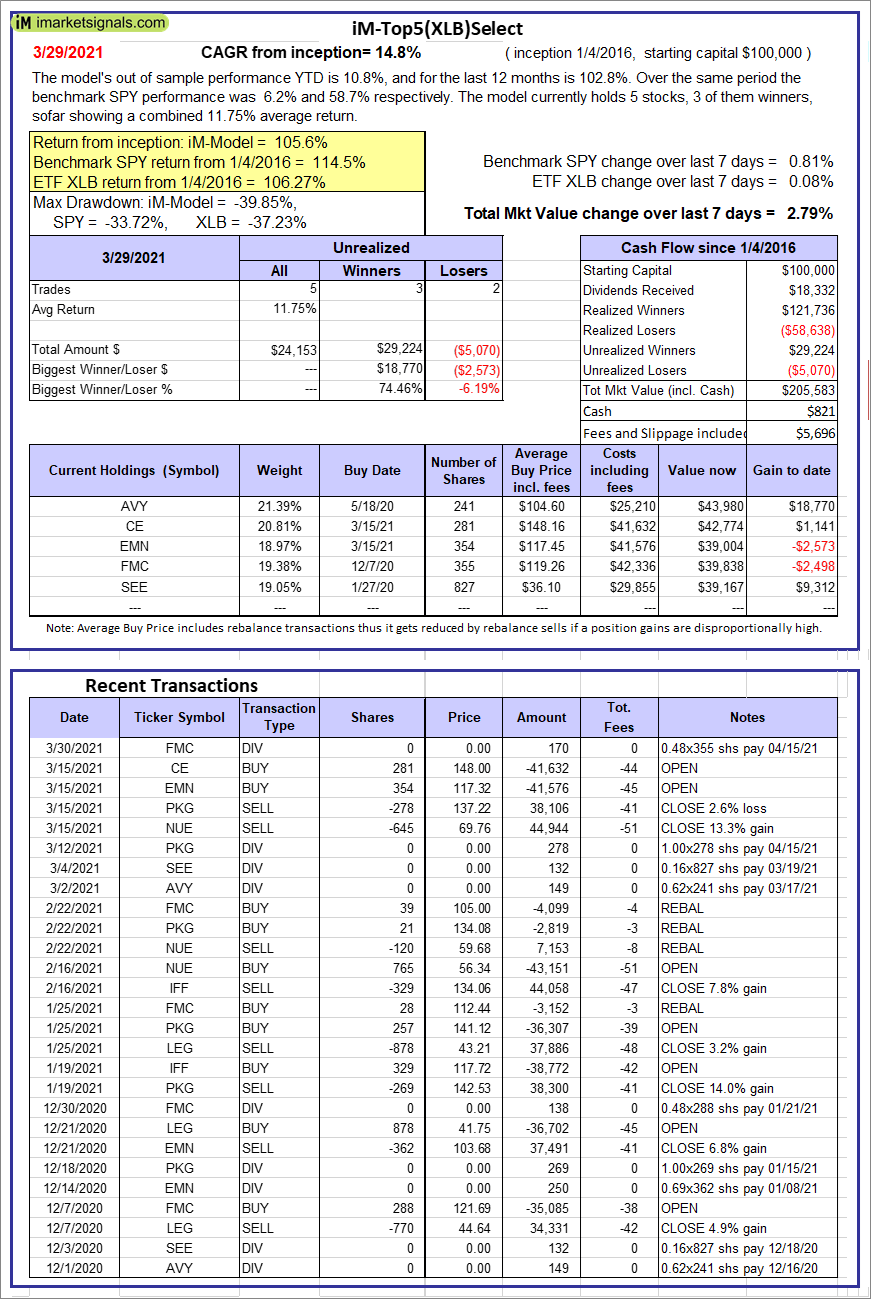 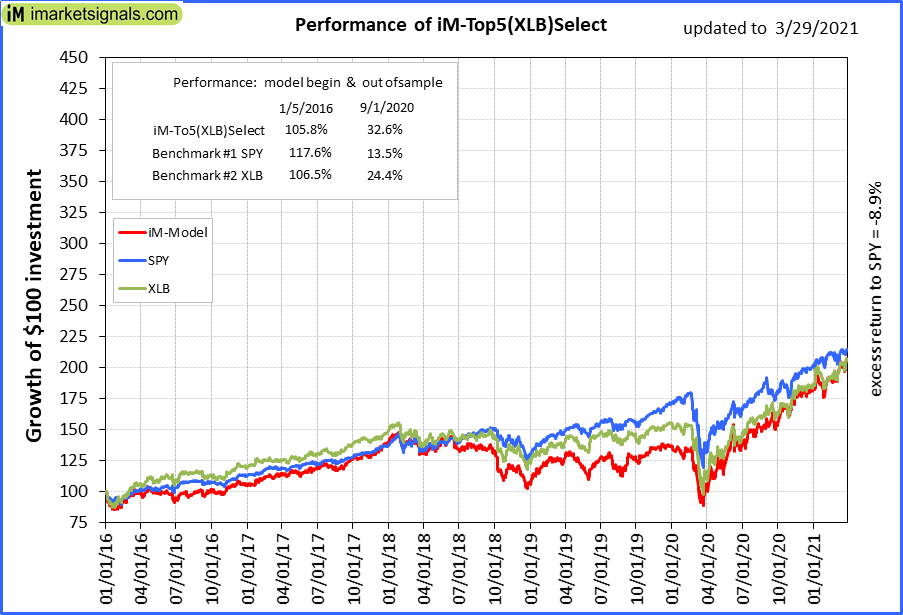 |
iM-Top5(XLB)Select: Since inception, on 1/5/2016, the model gained 105.58% while the benchmark SPY gained 114.52% over the same period. Over the previous week the market value of iM-Top5(XLB)Select gained 2.79% at a time when SPY gained 0.81%. A starting capital of $100,000 at inception on 1/5/2016 would have grown to $205,583 which includes $821 cash and excludes $5,696 spent on fees and slippage. |
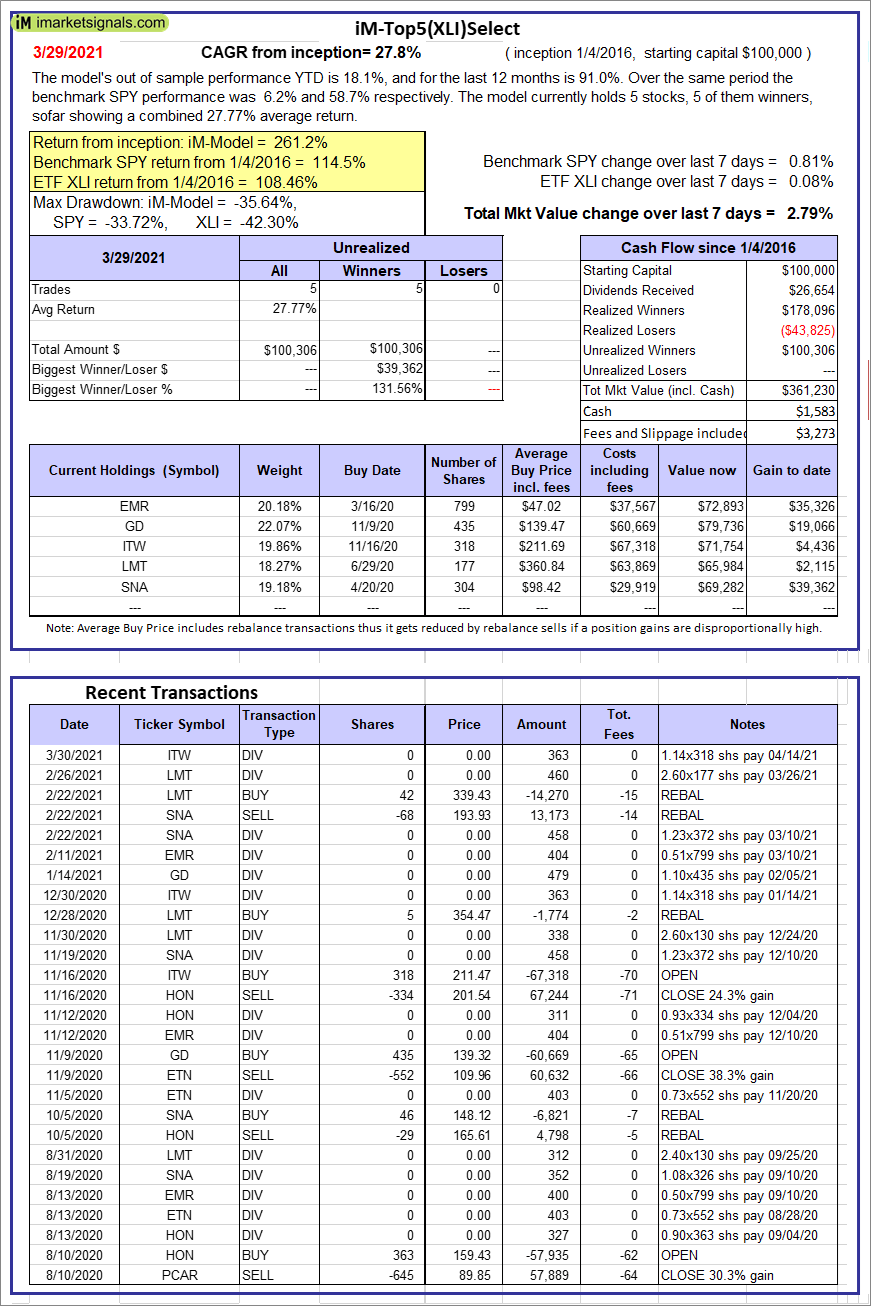 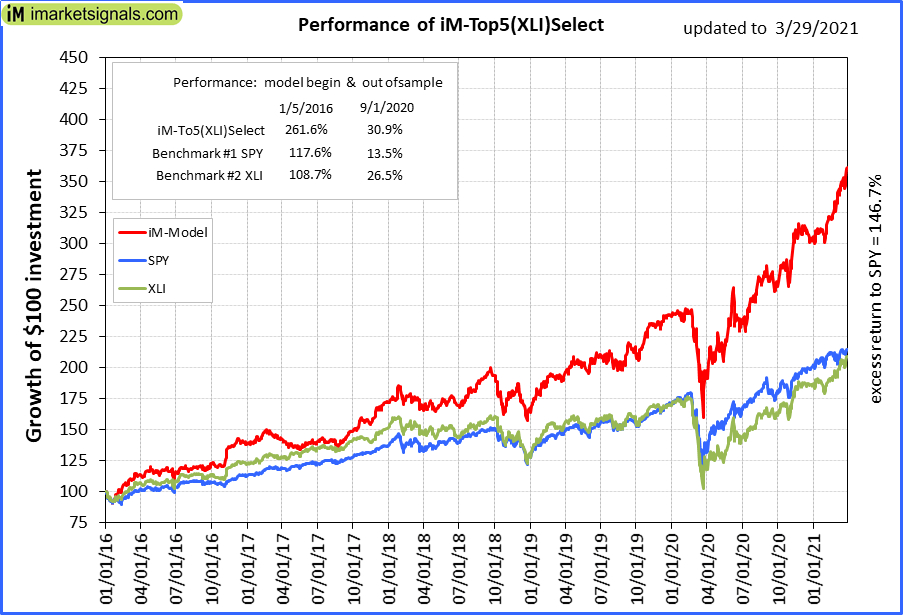 |
iM-Top5(XLI)Select: Since inception, on 1/5/2016, the model gained 261.23% while the benchmark SPY gained 114.52% over the same period. Over the previous week the market value of iM-Top5(XLI)Select gained 2.79% at a time when SPY gained 0.81%. A starting capital of $100,000 at inception on 1/5/2016 would have grown to $361,230 which includes $1,583 cash and excludes $3,273 spent on fees and slippage. |
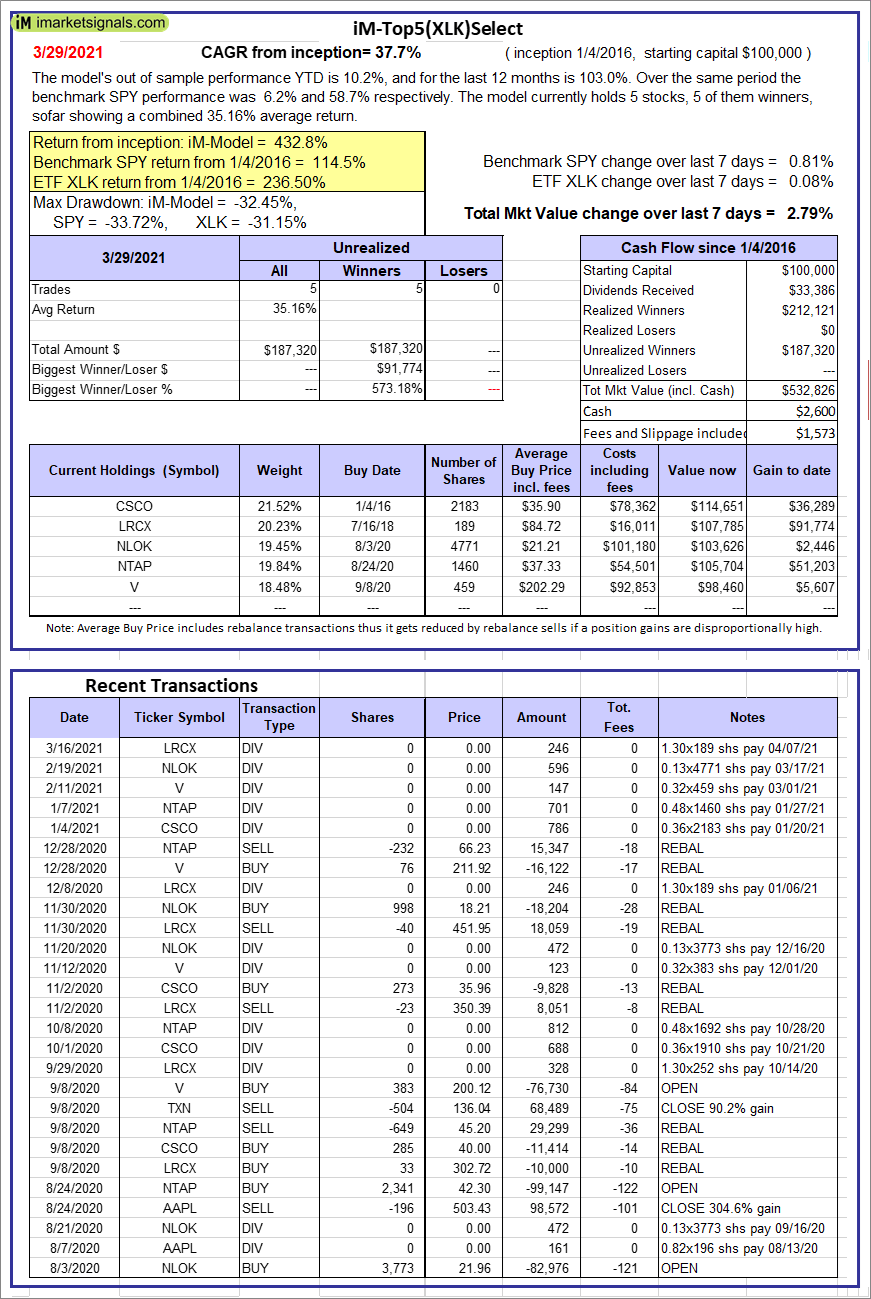 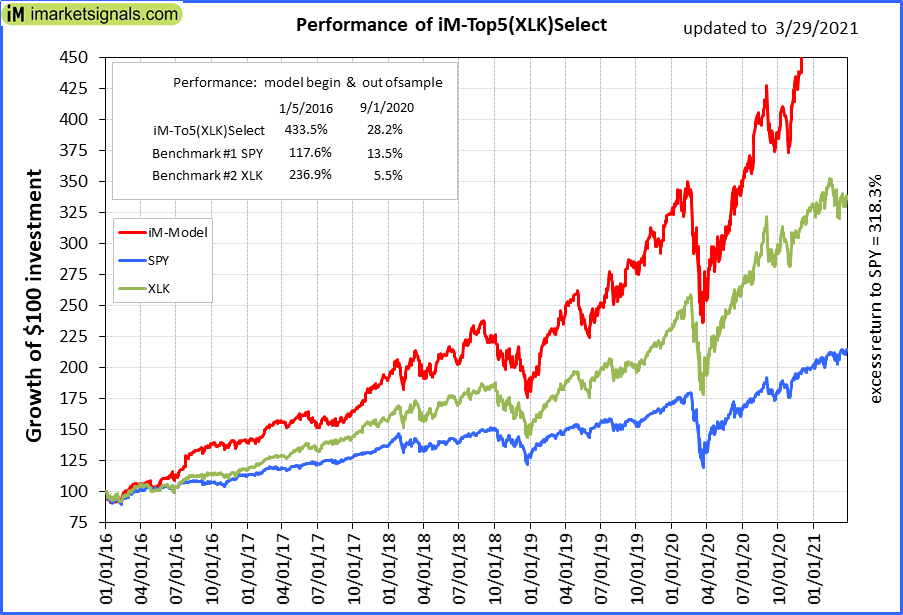 |
iM-Top5(XLK)Select: Since inception, on 1/5/2016, the model gained 432.83% while the benchmark SPY gained 114.52% over the same period. Over the previous week the market value of iM-Top5(XLK)Select gained 2.79% at a time when SPY gained 0.81%. A starting capital of $100,000 at inception on 1/5/2016 would have grown to $532,826 which includes $2,600 cash and excludes $1,573 spent on fees and slippage. |
  |
iM-Top5(XLP)Select: Since inception, on 1/5/2016, the model gained 175.06% while the benchmark SPY gained 114.52% over the same period. Over the previous week the market value of iM-Top5(XLP)Select gained 3.14% at a time when SPY gained 0.81%. A starting capital of $100,000 at inception on 1/5/2016 would have grown to $275,062 which includes $1,196 cash and excludes $1,242 spent on fees and slippage. |
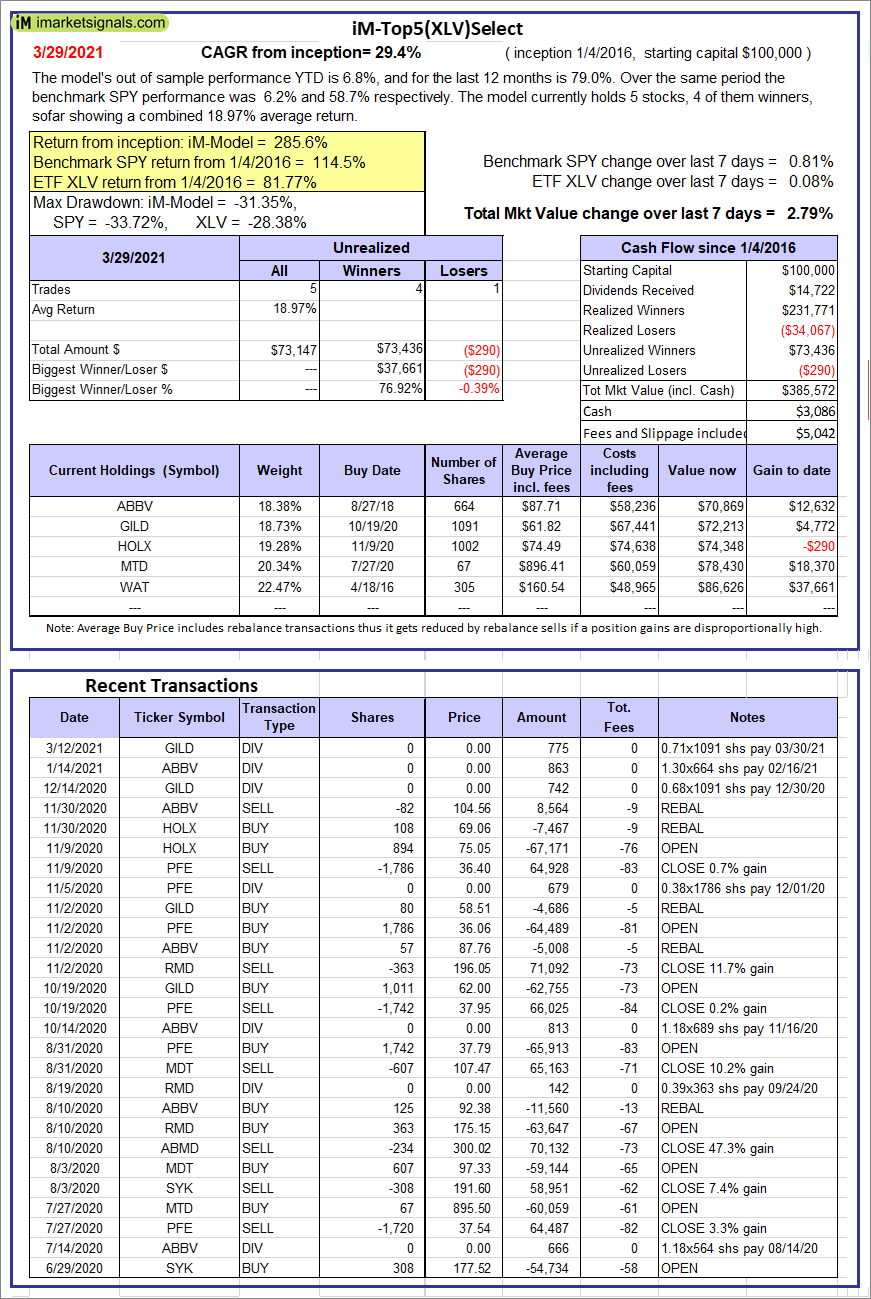 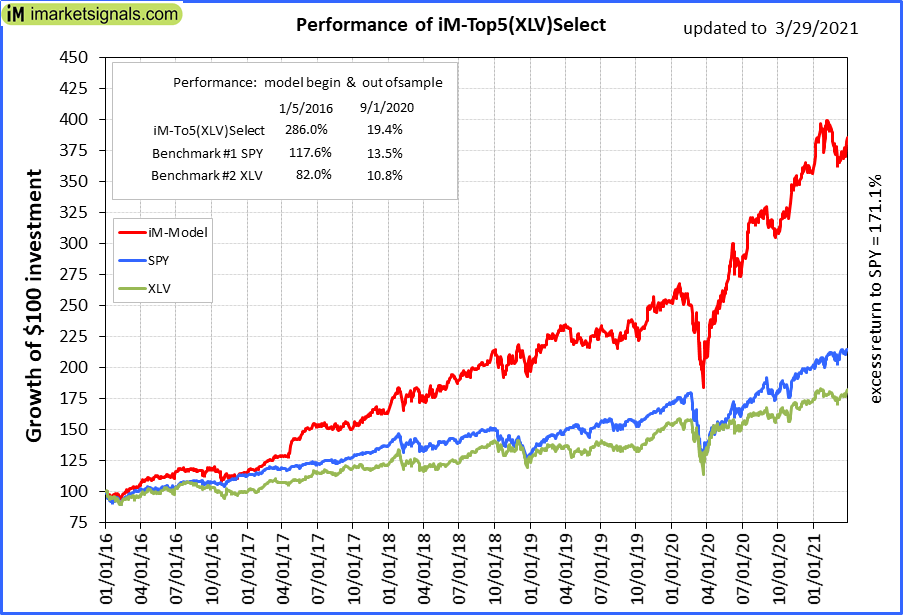 |
iM-Top5(XLV)Select: Since inception, on 1/5/2016, the model gained 285.57% while the benchmark SPY gained 114.52% over the same period. Over the previous week the market value of iM-Top5(XLV)Select gained 2.79% at a time when SPY gained 0.81%. A starting capital of $100,000 at inception on 1/5/2016 would have grown to $385,572 which includes $3,086 cash and excludes $5,042 spent on fees and slippage. |
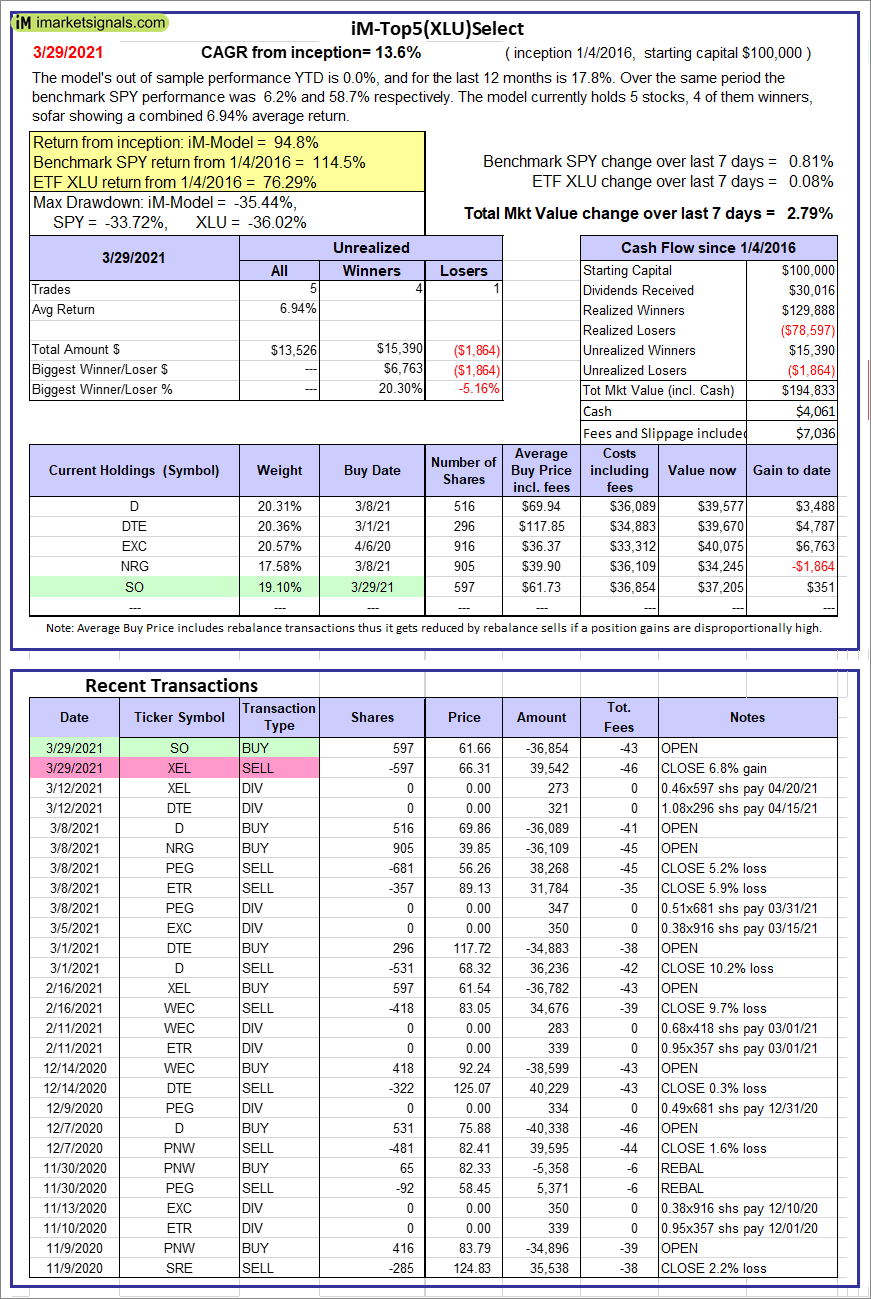 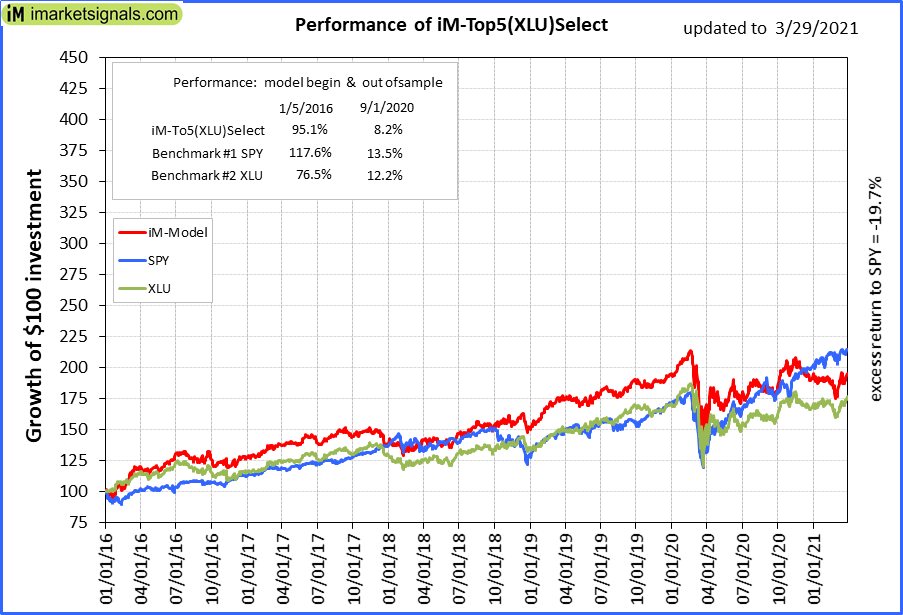 |
iM-Top5(XLU)Select: Since inception, on 1/5/2016, the model gained 94.83% while the benchmark SPY gained 114.52% over the same period. Over the previous week the market value of iM-Top5(XLU)Select gained 2.79% at a time when SPY gained 0.81%. A starting capital of $100,000 at inception on 1/5/2016 would have grown to $194,833 which includes $4,061 cash and excludes $7,036 spent on fees and slippage. |
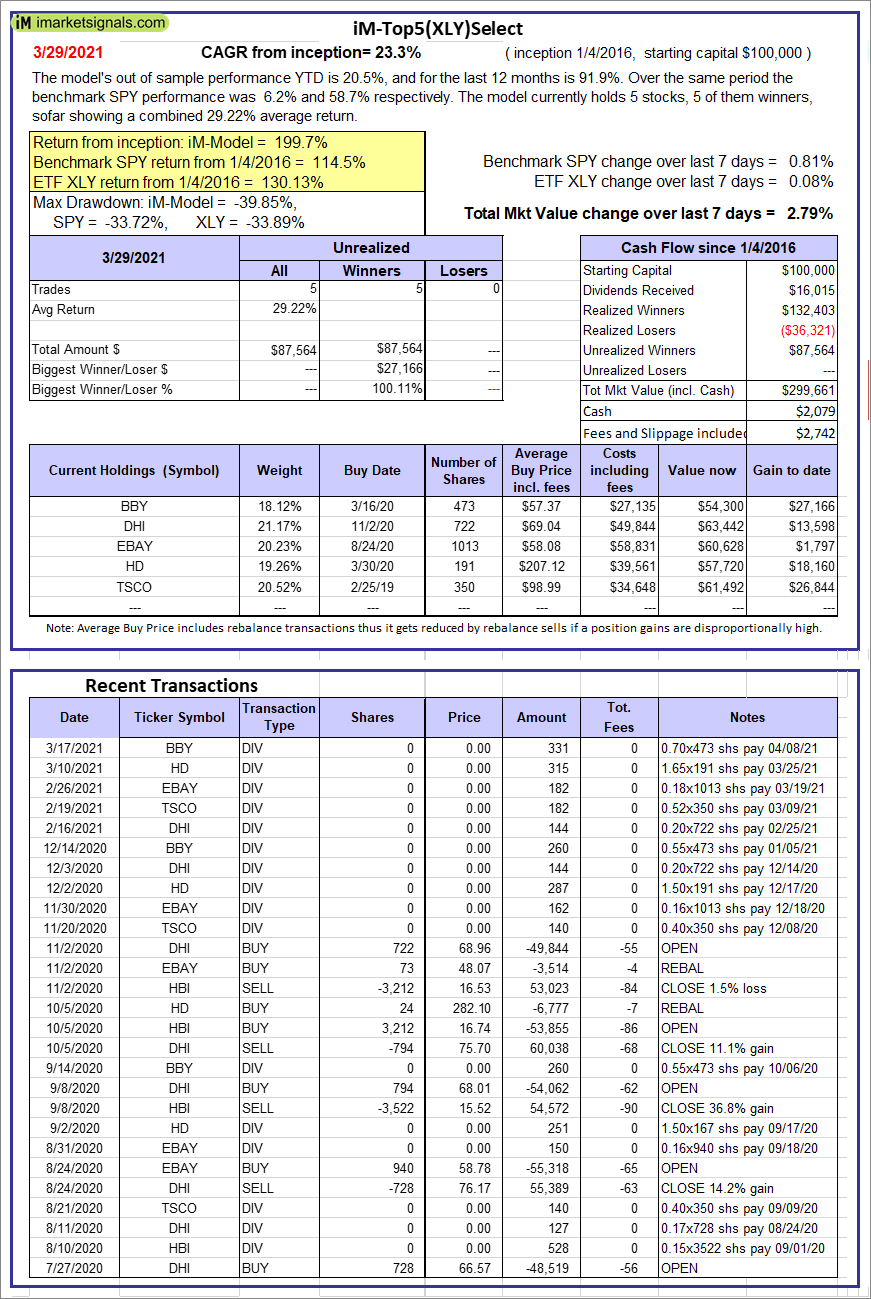 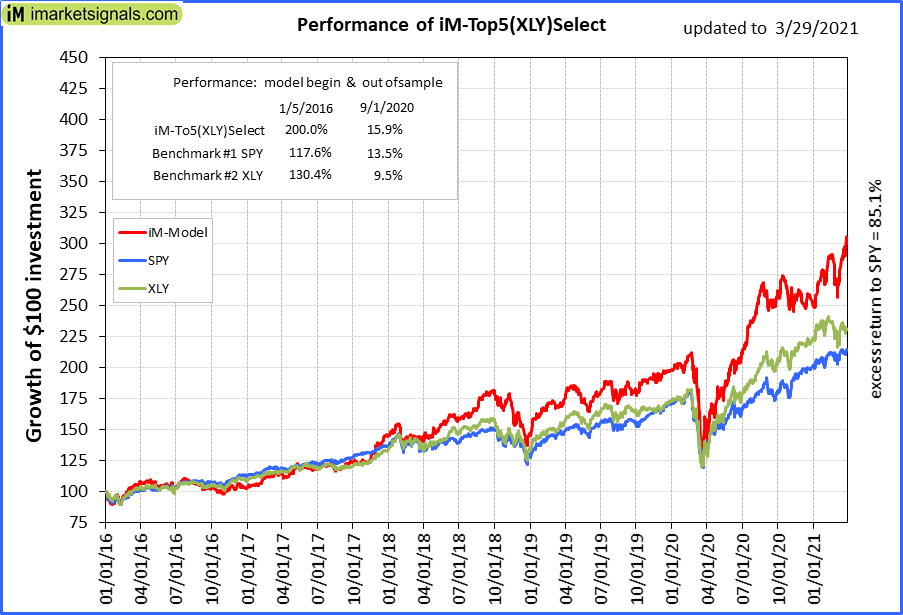 |
iM-Top5(XLY)Select: Since inception, on 1/5/2016, the model gained 199.66% while the benchmark SPY gained 114.52% over the same period. Over the previous week the market value of iM-Top5(XLY)Select gained 2.79% at a time when SPY gained 0.81%. A starting capital of $100,000 at inception on 1/5/2016 would have grown to $299,661 which includes $2,079 cash and excludes $2,742 spent on fees and slippage. |
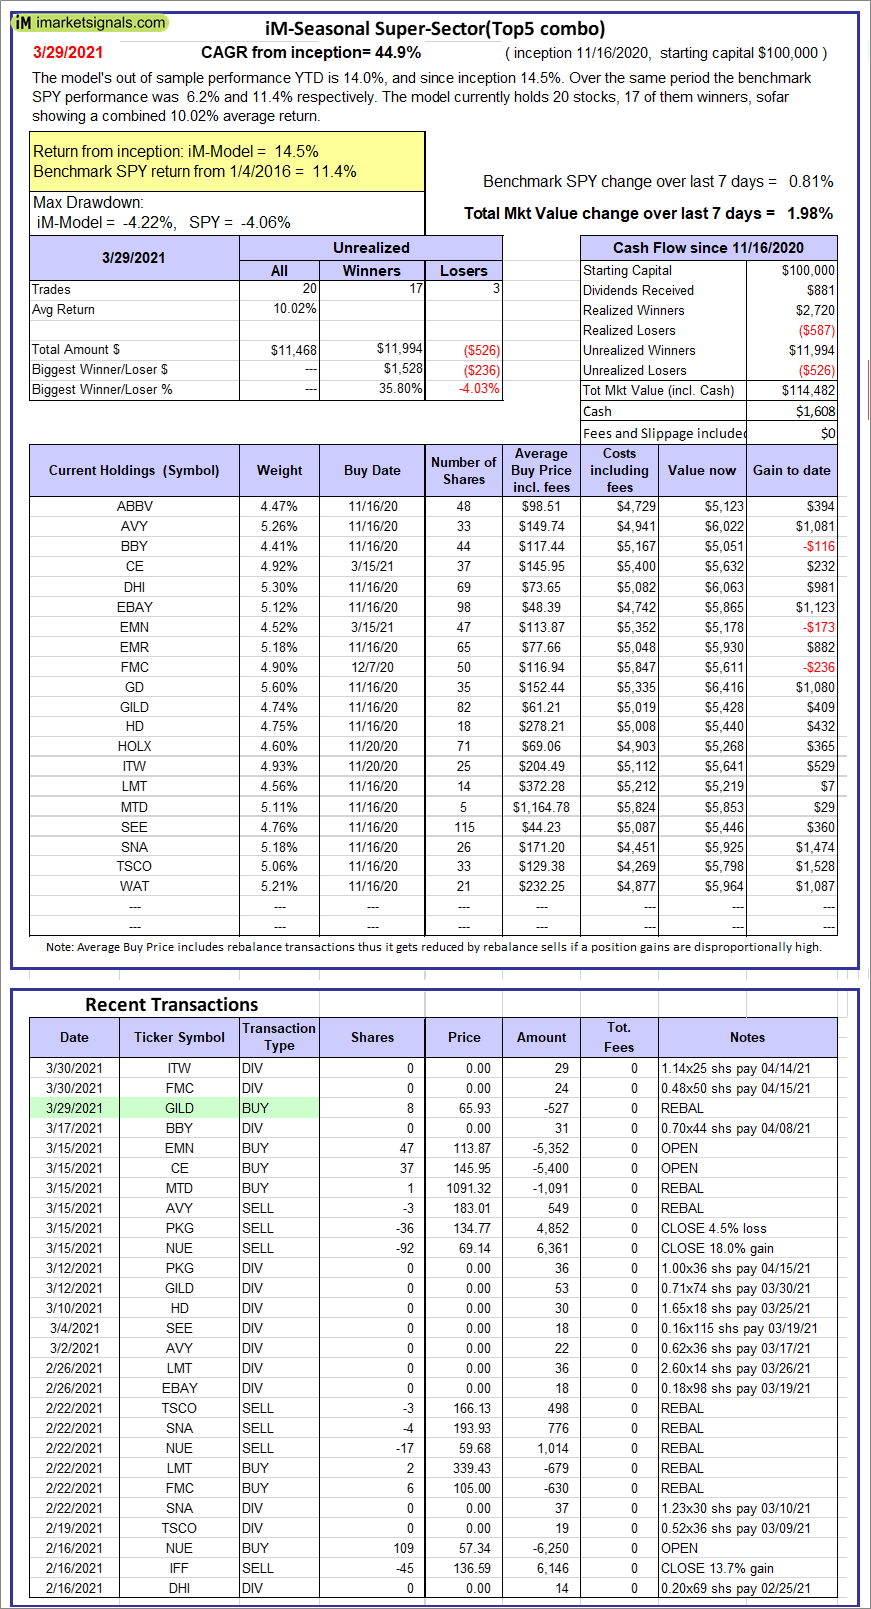 |
iM-Seasonal Super-Sectors (Top5 combo) : Since inception, on 11/17/2020, the model gained 14.48% while the benchmark SPY gained 11.36% over the same period. Over the previous week the market value of iM-Seasonal Super-Sectors (Top5 combo) gained 1.98% at a time when SPY gained 0.81%. A starting capital of $100,000 at inception on 11/17/2020 would have grown to $114,482 which includes $1,608 cash and excludes $00 spent on fees and slippage. |
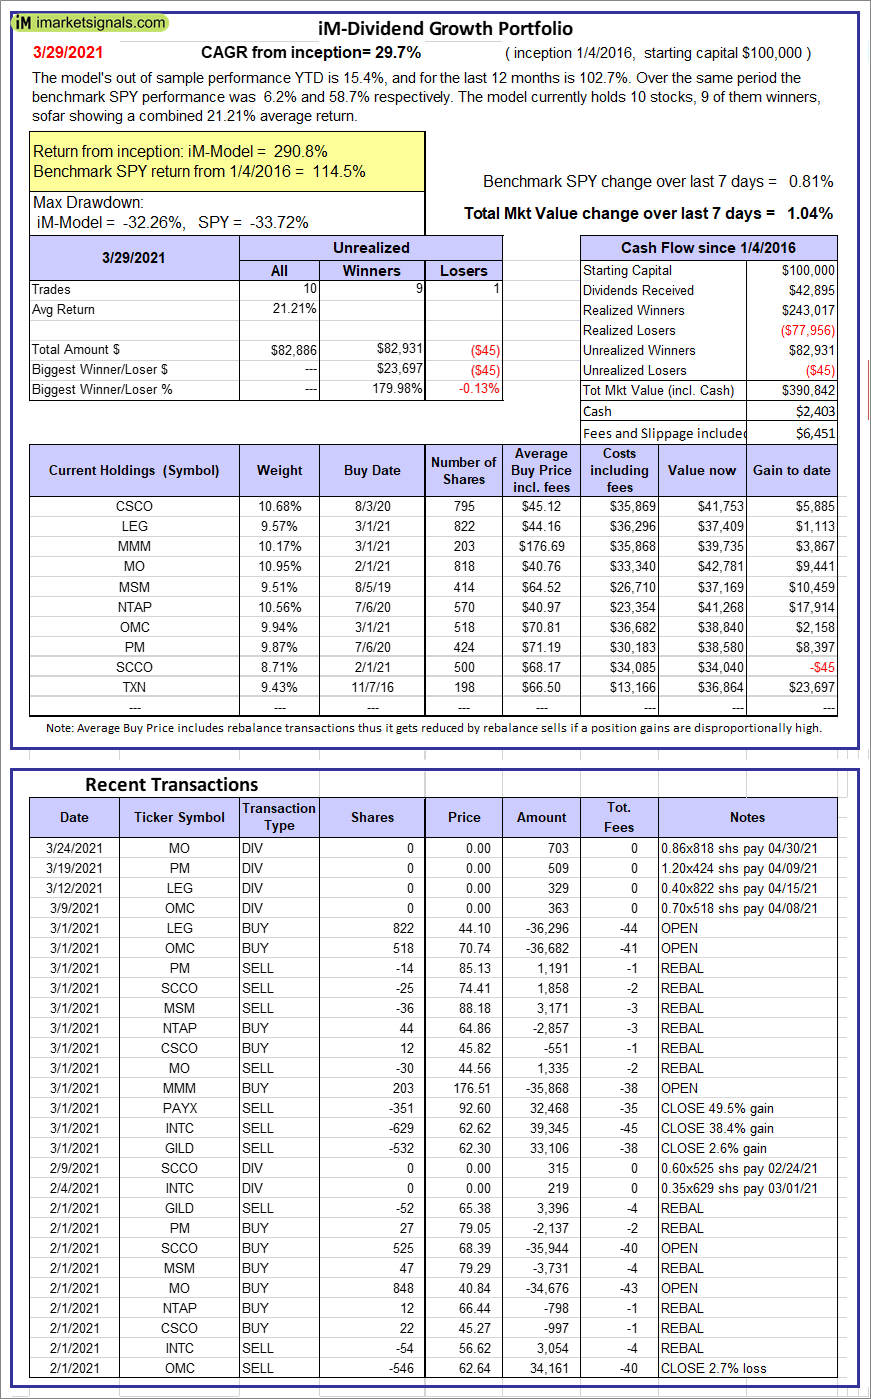 |
iM-Dividend Growth Portfolio: The model’s out of sample performance YTD is 15.4%, and for the last 12 months is 102.7%. Over the same period the benchmark SPY performance was 6.2% and 58.7% respectively. Over the previous week the market value of the iM-Dividend Growth Portfolio gained 1.04% at a time when SPY gained 0.81%. A starting capital of $100,000 at inception on 6/30/2016 would have grown to $390,842 which includes $2,403 cash and excludes $6,451 spent on fees and slippage. |
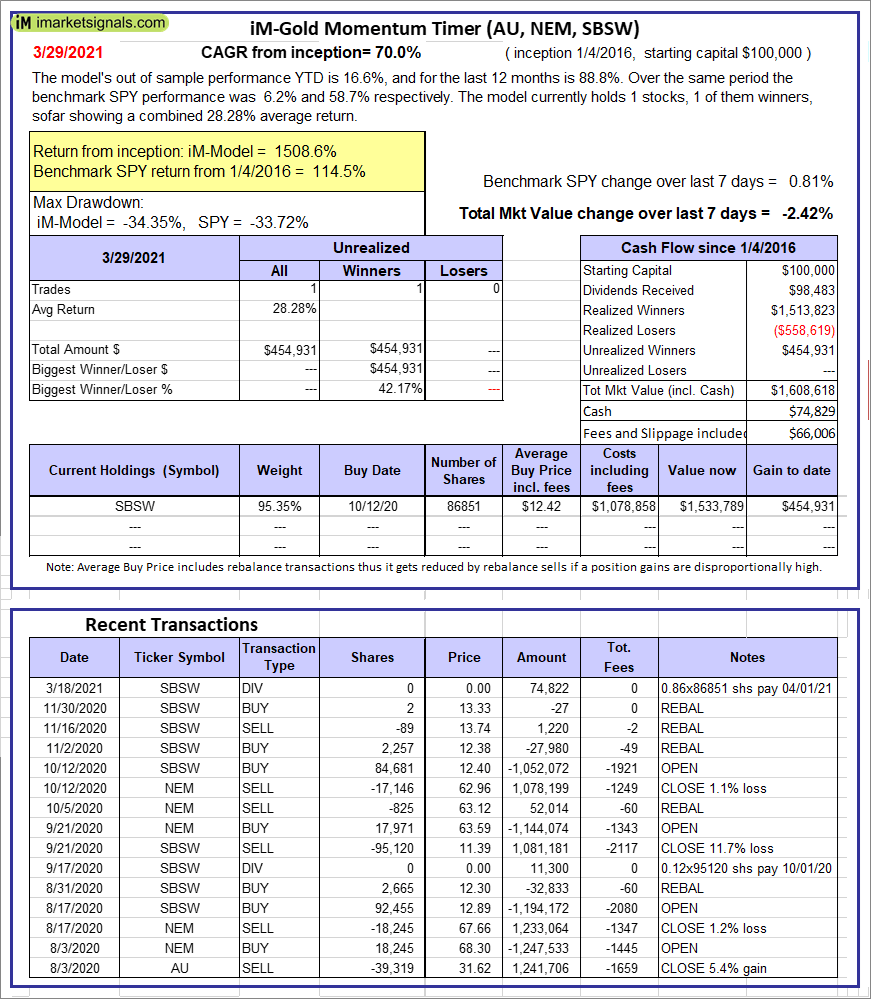 |
iM-Gold Momentum Timer (AU, NEM, SBSW): The model’s out of sample performance YTD is 16.6%, and for the last 12 months is 88.8%. Over the same period the benchmark SPY performance was 6.2% and 58.7% respectively. Over the previous week the market value of iM-Gold Momentum Timer (AU, NEM, SBSW) gained -2.42% at a time when SPY gained 0.81%. A starting capital of $100,000 at inception on 6/30/2016 would have grown to $74,829 which includes $66,006 cash and excludes Gain to date spent on fees and slippage. |
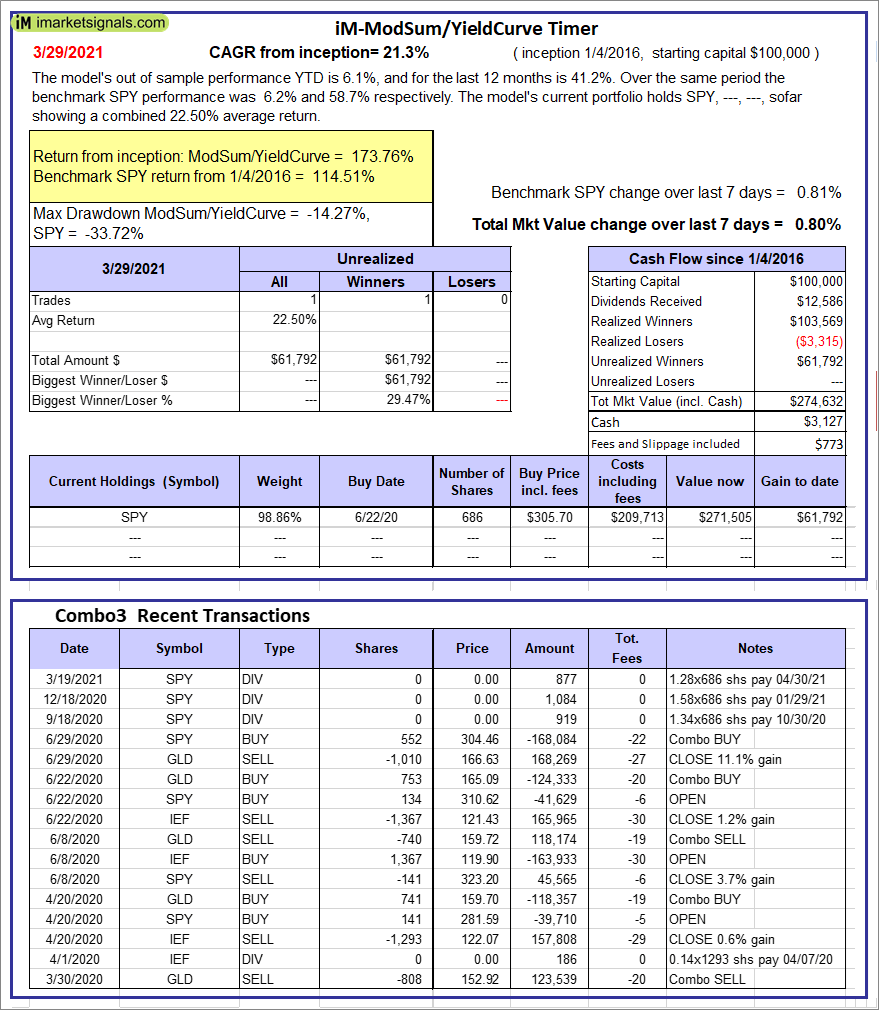 |
iM-ModSum/YieldCurve Timer: The model’s out of sample performance YTD is 6.1%, and for the last 12 months is 41.2%. Over the same period the benchmark SPY performance was 6.2% and 58.7% respectively. Over the previous week the market value of iM-PortSum/YieldCurve Timer gained 0.80% at a time when SPY gained 0.81%. A starting capital of $100,000 at inception on 1/1/2016 would have grown to $274,632 which includes $3,127 cash and excludes $773 spent on fees and slippage. |
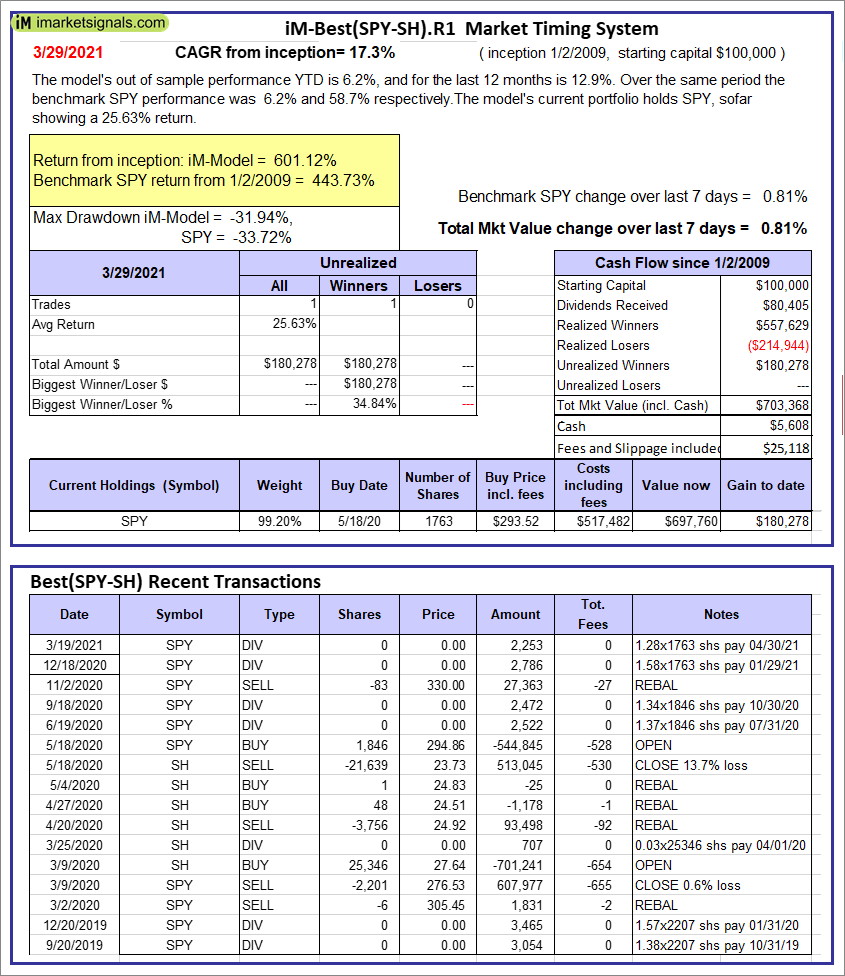 |
iM-Best(SPY-SH).R1: The model’s out of sample performance YTD is 6.2%, and for the last 12 months is 12.9%. Over the same period the benchmark SPY performance was 6.2% and 58.7% respectively. Over the previous week the market value of Best(SPY-SH) gained 0.81% at a time when SPY gained 0.81%. A starting capital of $100,000 at inception on 1/2/2009 would have grown to $703,368 which includes $5,608 cash and excludes $25,118 spent on fees and slippage. |
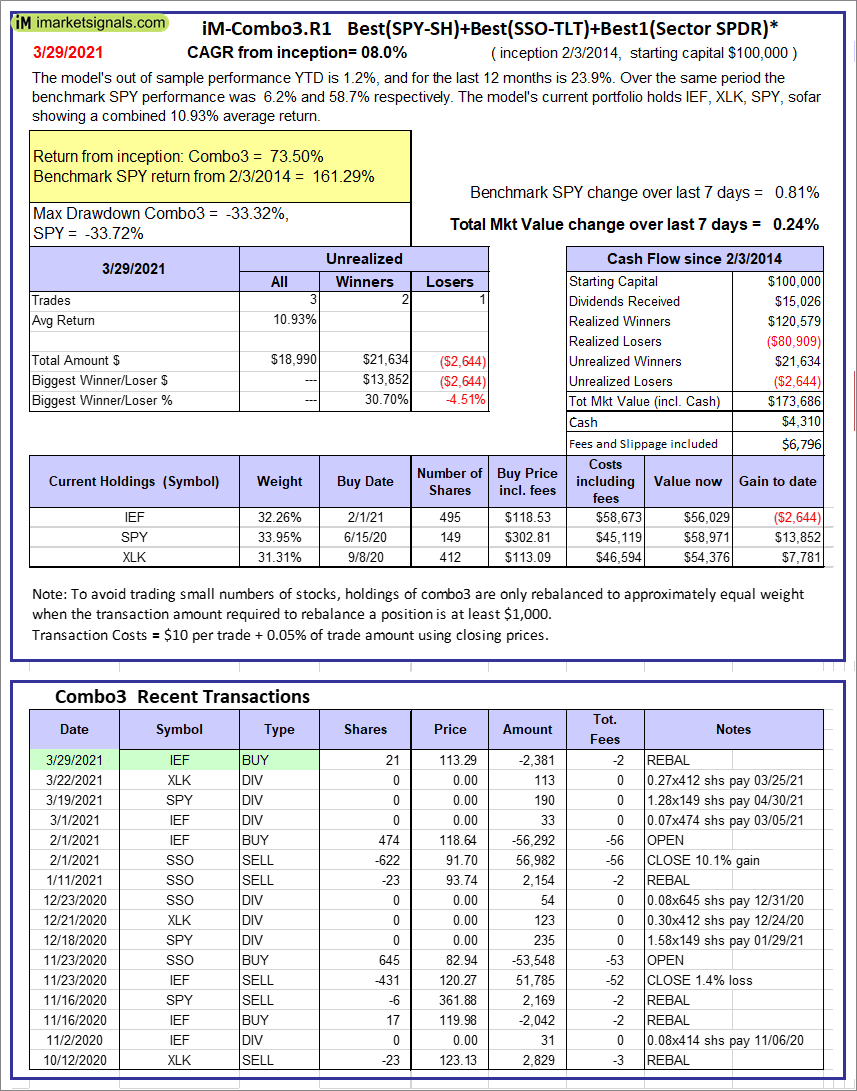 |
iM-Combo3.R1: The model’s out of sample performance YTD is 1.2%, and for the last 12 months is 23.9%. Over the same period the benchmark SPY performance was 6.2% and 58.7% respectively. Over the previous week the market value of iM-Combo3.R1 gained 0.24% at a time when SPY gained 0.81%. A starting capital of $100,000 at inception on 2/3/2014 would have grown to $173,686 which includes $4,310 cash and excludes $6,796 spent on fees and slippage. |
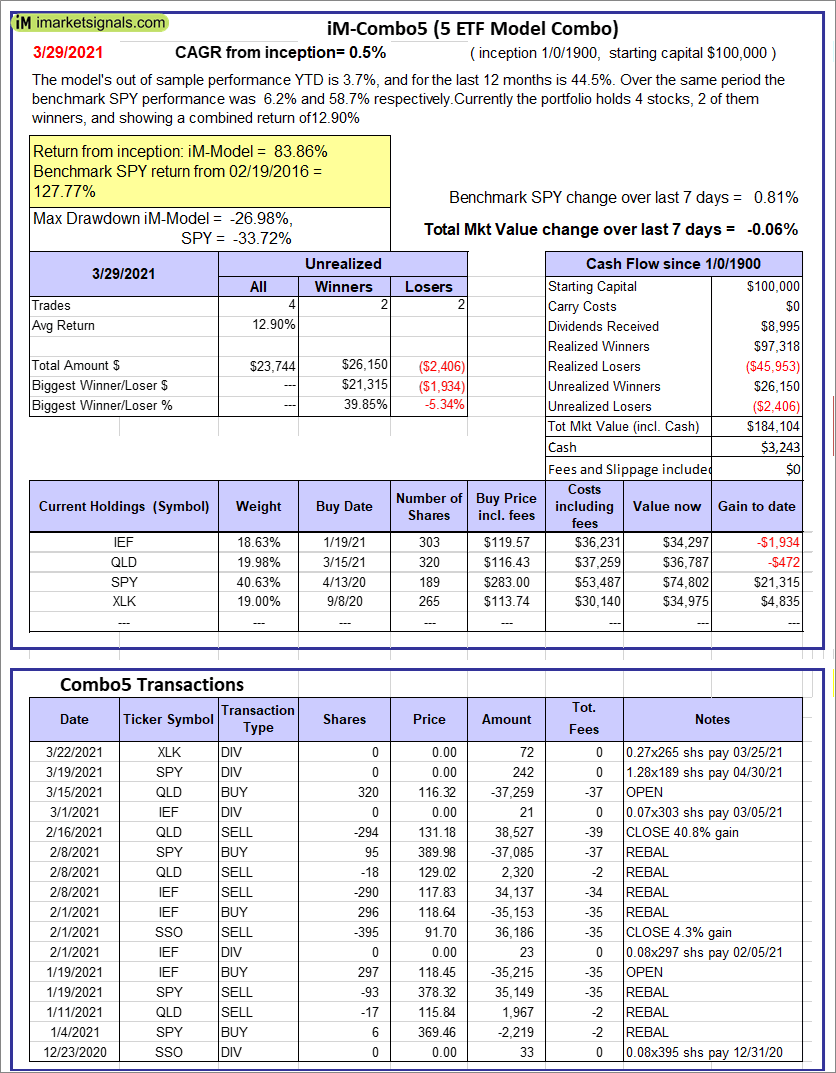 |
iM-Combo5: The model’s out of sample performance YTD is 3.7%, and for the last 12 months is 44.5%. Over the same period the benchmark SPY performance was 6.2% and 58.7% respectively. Over the previous week the market value of iM-Combo5 gained -0.06% at a time when SPY gained 0.81%. A starting capital of $100,000 at inception on 2/22/2016 would have grown to $184,104 which includes $3,243 cash and excludes $0 spent on fees and slippage. |
 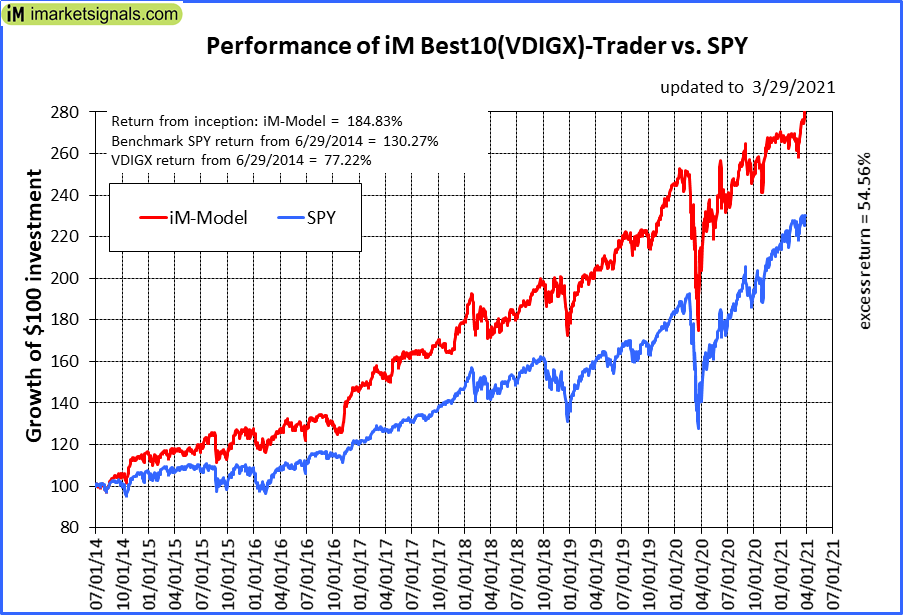 |
iM-Best10(VDIGX)-Trader: The model’s out of sample performance YTD is 5.2%, and for the last 12 months is 37.1%. Over the same period the benchmark SPY performance was 6.2% and 58.7% respectively. Since inception, on 7/1/2014, the model gained 184.83% while the benchmark SPY gained 130.27% and VDIGX gained 77.22% over the same period. Over the previous week the market value of iM-Best10(VDIGX) gained 3.10% at a time when SPY gained 0.81%. A starting capital of $100,000 at inception on 7/1/2014 would have grown to $284,832 which includes $838 cash and excludes $3,880 spent on fees and slippage. |
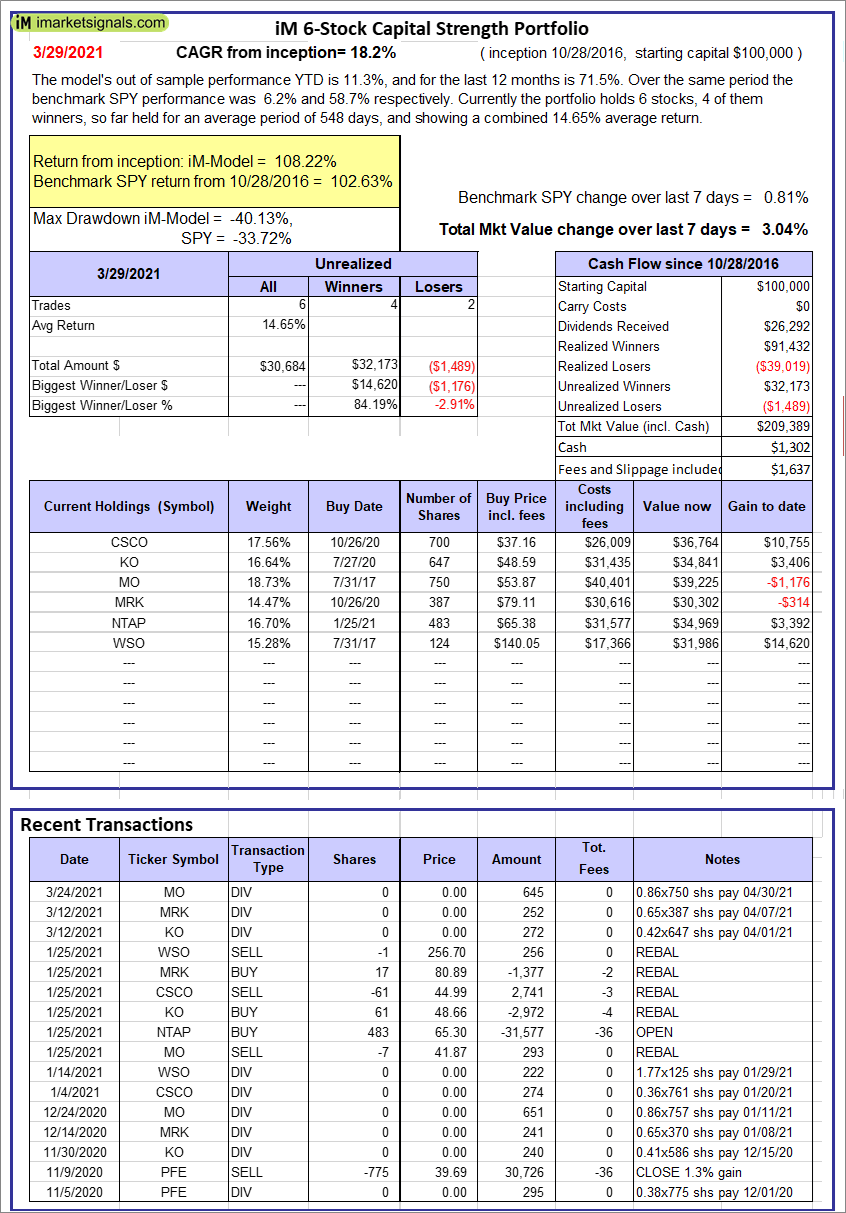 |
iM 6-Stock Capital Strength Portfolio: The model’s out of sample performance YTD is 11.3%, and for the last 12 months is 71.5%. Over the same period the benchmark SPY performance was 6.2% and 58.7% respectively. Over the previous week the market value of the iM 6-Stock Capital Strength Portfolio gained 3.04% at a time when SPY gained 0.81%. A starting capital of $100,000 at inception on 10/28/2016 would have grown to $209,389 which includes $1,302 cash and excludes $1,637 spent on fees and slippage. |
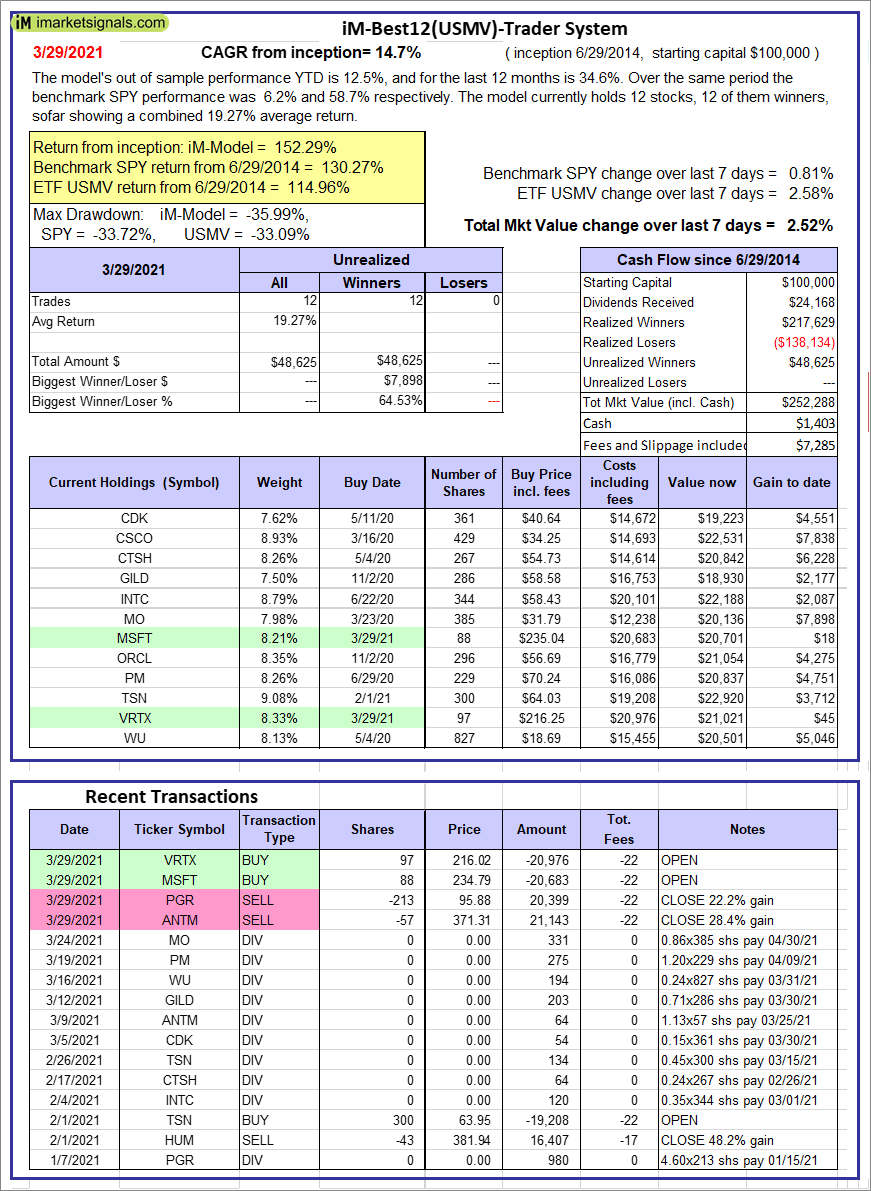 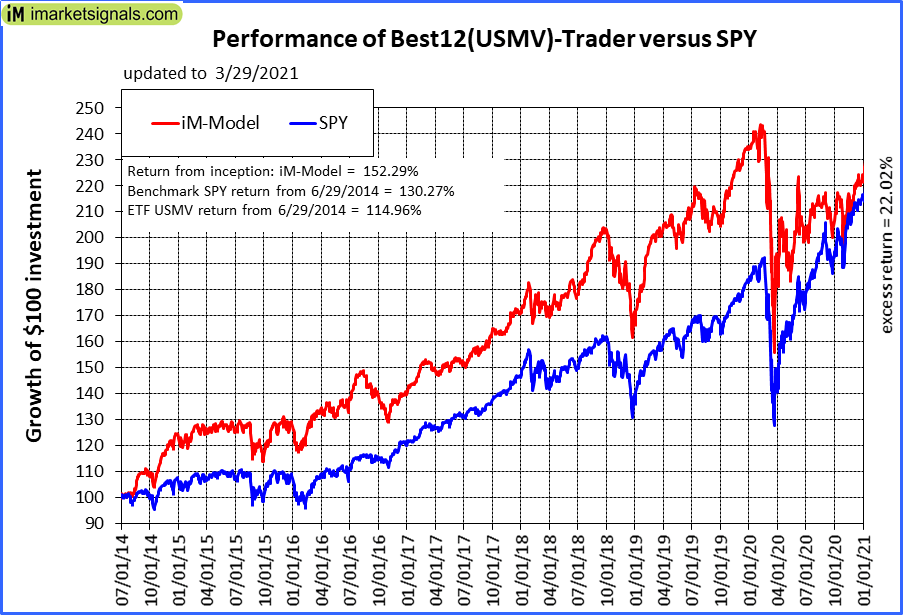 |
iM-Best12(USMV)-Trader: The model’s out of sample performance YTD is 12.5%, and for the last 12 months is 34.6%. Over the same period the benchmark SPY performance was 6.2% and 58.7% respectively. Since inception, on 6/30/2014, the model gained 152.29% while the benchmark SPY gained 130.27% and the ETF USMV gained 114.96% over the same period. Over the previous week the market value of iM-Best12(USMV)-Trader gained 2.52% at a time when SPY gained 0.81%. A starting capital of $100,000 at inception on 6/30/2014 would have grown to $252,288 which includes $1,403 cash and excludes $7,285 spent on fees and slippage. |
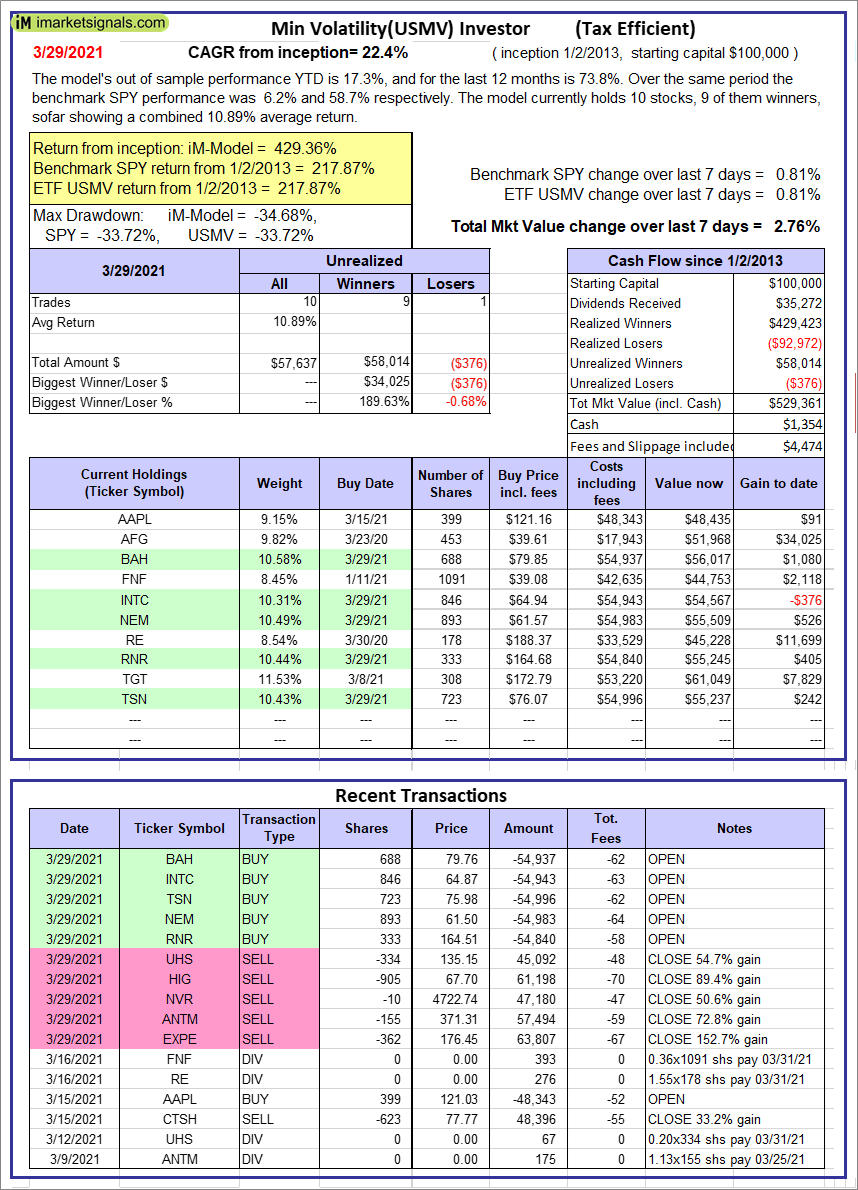 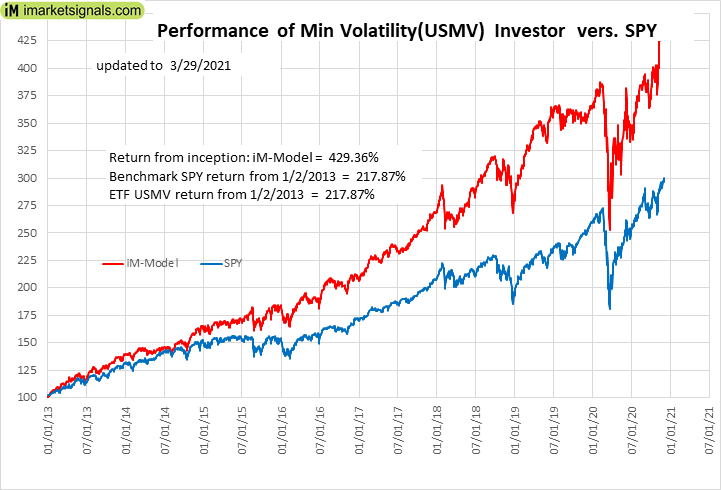 |
iM-Min Volatility(USMV) Investor (Tax Efficient): The model’s out of sample performance YTD is 17.3%, and for the last 12 months is 73.8%. Over the same period the benchmark SPY performance was 6.2% and 58.7% respectively. Since inception, on 1/3/2013, the model gained 429.36% while the benchmark SPY gained 217.87% and the ETF USMV gained 217.87% over the same period. Over the previous week the market value of iM-Best12(USMV)Q1 gained 2.76% at a time when SPY gained 0.81%. A starting capital of $100,000 at inception on 1/3/2013 would have grown to $529,361 which includes $1,354 cash and excludes $4,474 spent on fees and slippage. |
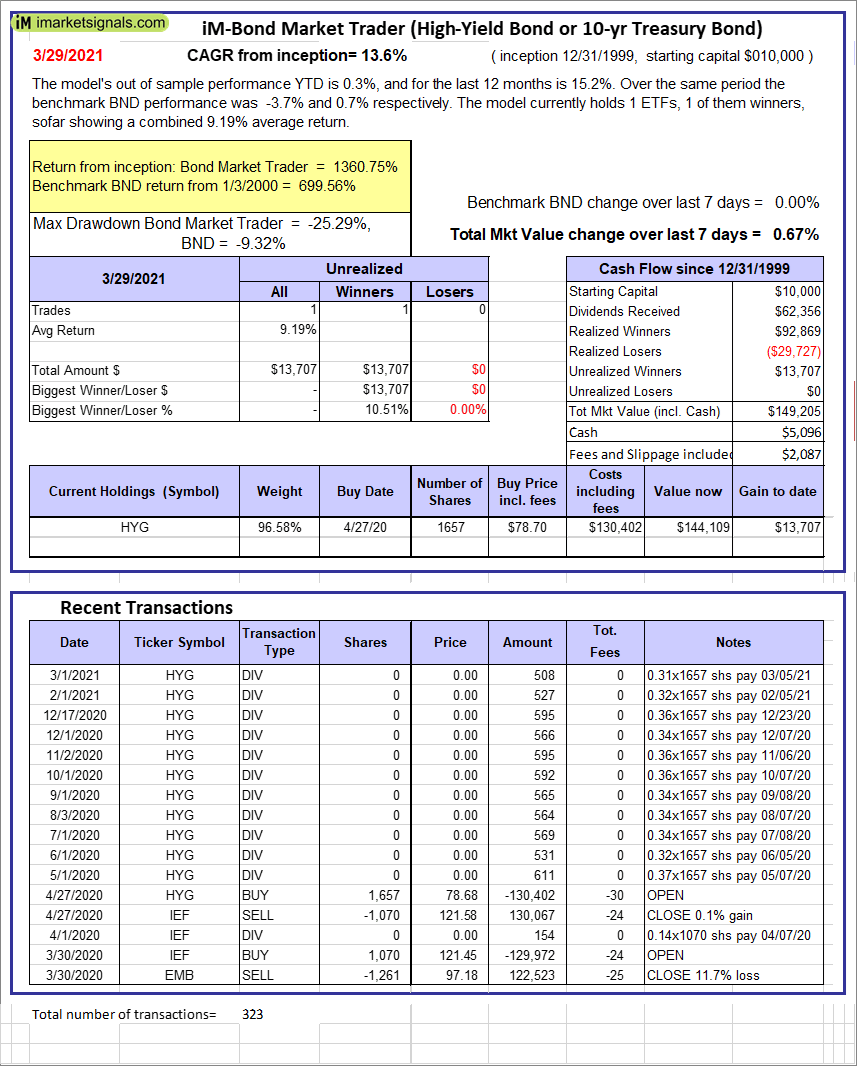 |
iM-Bond Market Trader (High-Yield Bond or 10-yr Treasury Bond): The model’s out of sample performance YTD is 0.3%, and for the last 12 months is 15.2%. Over the same period the benchmark BND performance was -3.7% and 0.7% respectively. Over the previous week the market value of the iM-Bond Market Trader (High-Yield Bond or 10-yr Treasury Bond) gained 0.67% at a time when BND gained 0.00%. A starting capital of $10,000 at inception on 1/3/2000 would have grown to $149,205 which includes $5,096 cash and excludes $2,087 spent on fees and slippage. |
|
|
iM-ModSum/YieldCurve Timer: The model’s out of sample performance YTD is 6.1%, and for the last 12 months is 41.2%. Over the same period the benchmark SPY performance was 6.2% and 58.7% respectively. Over the previous week the market value of iM-PortSum/YieldCurve Timer gained 0.80% at a time when SPY gained 0.81%. A starting capital of $100,000 at inception on 1/1/2016 would have grown to $274,632 which includes $3,127 cash and excludes $773 spent on fees and slippage. |
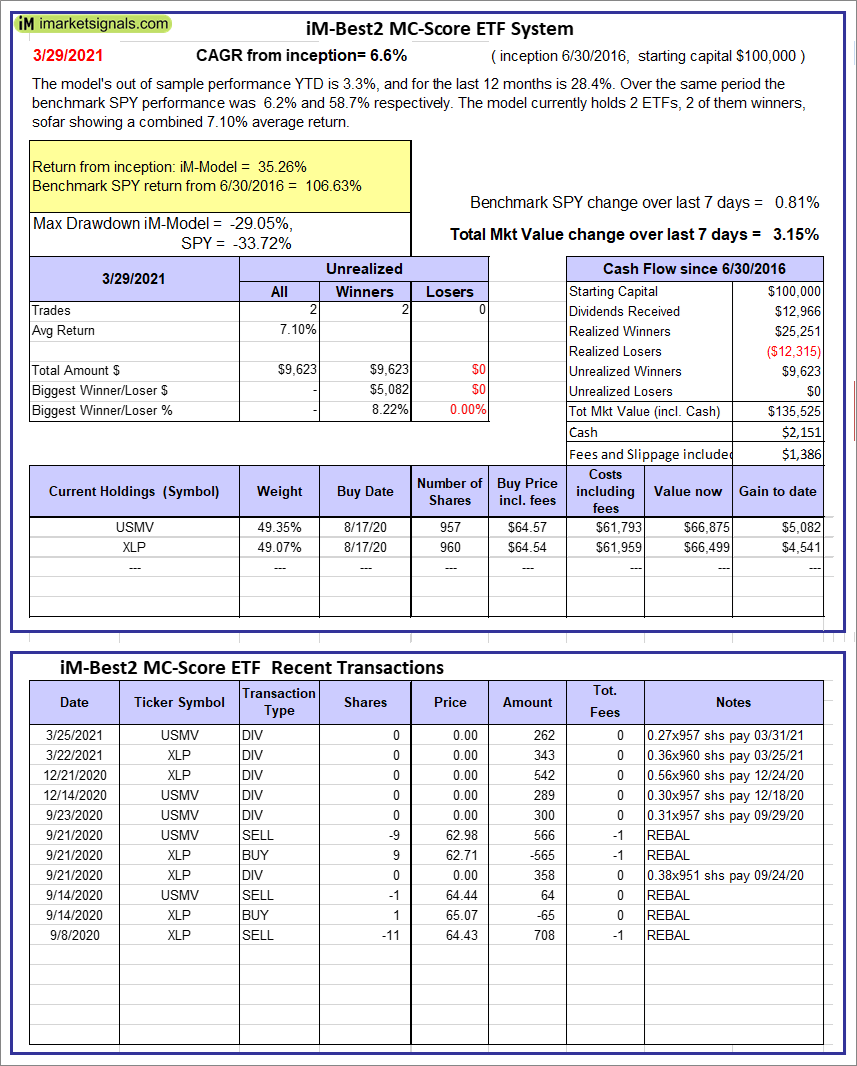 |
iM-Best2 MC-Score ETF System: The model’s out of sample performance YTD is 3.3%, and for the last 12 months is 28.4%. Over the same period the benchmark SPY performance was 6.2% and 58.7% respectively. Over the previous week the market value of the iM-Best2 MC-Score ETF System gained 3.15% at a time when SPY gained 0.81%. A starting capital of $100,000 at inception on 6/30/2016 would have grown to $135,525 which includes $2,151 cash and excludes $1,386 spent on fees and slippage. |
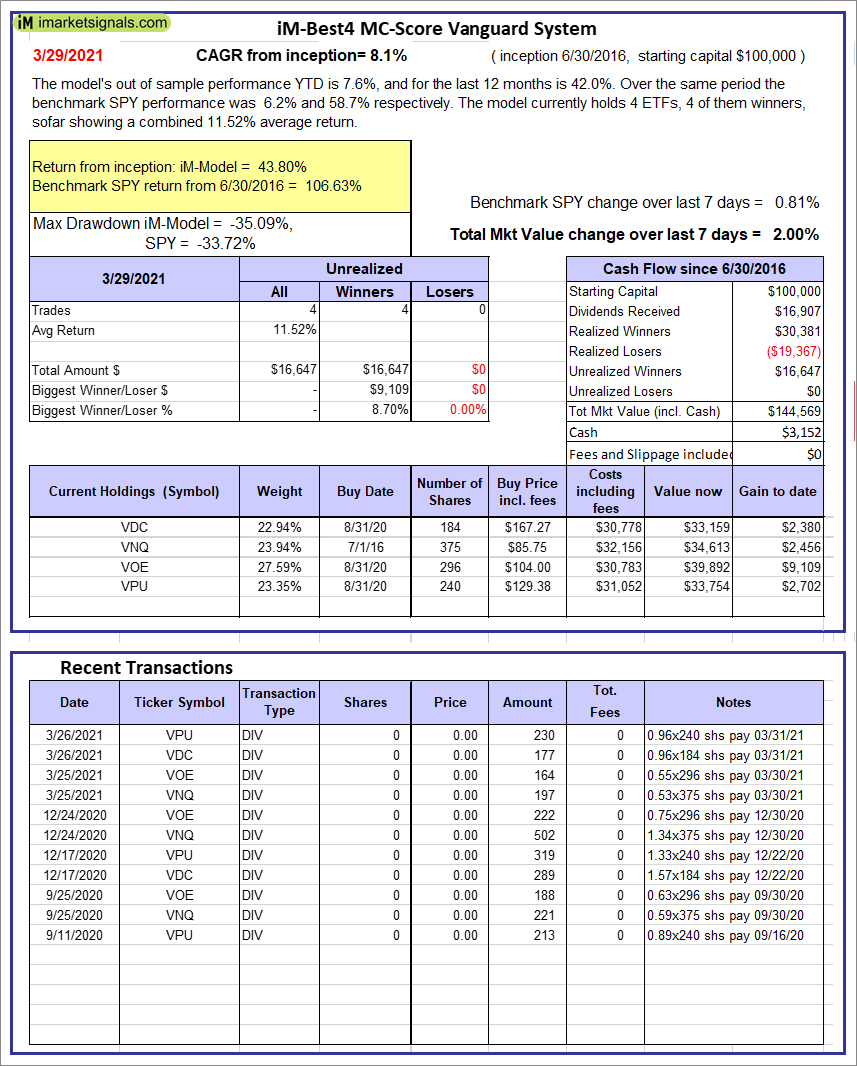 |
iM-Best4 MC-Score Vanguard System: The model’s out of sample performance YTD is 7.6%, and for the last 12 months is 42.0%. Over the same period the benchmark SPY performance was 6.2% and 58.7% respectively. Over the previous week the market value of the iM-Best4 MC-Score Vanguard System gained 2.00% at a time when SPY gained 0.81%. A starting capital of $100,000 at inception on 6/30/2016 would have grown to $144,569 which includes $3,152 cash and excludes $00 spent on fees and slippage. |
 |
iM-Composite (SPY-IEF) Timer: The model’s out of sample performance YTD is 6.2%, and for the last 12 months is 19.6%. Over the same period the benchmark SPY performance was 6.2% and 58.7% respectively. Over the previous week the market value of the iM-Composite (SPY-IEF) Timer gained 0.80% at a time when SPY gained 0.81%. A starting capital of $100,000 at inception on 6/30/2016 would have grown to $166,436 which includes $1,792 cash and excludes $3,984 spent on fees and slippage. |
 |
iM-Composite(Gold-Stocks-Bond) Timer: The model’s out of sample performance YTD is -4.3%, and for the last 12 months is 19.0%. Over the same period the benchmark SPY performance was 6.2% and 58.7% respectively. Over the previous week the market value of the iM-Composite(Gold-Stocks-Bond) Timer gained 0.76% at a time when SPY gained 0.81%. A starting capital of $100,000 at inception on 6/30/2016 would have grown to $159,170 which includes $223 cash and excludes $6,550 spent on fees and slippage. |
iM-Best Reports – 3/30/21
Posted in pmp SPY-SH
Leave a Reply
You must be logged in to post a comment.