
  |
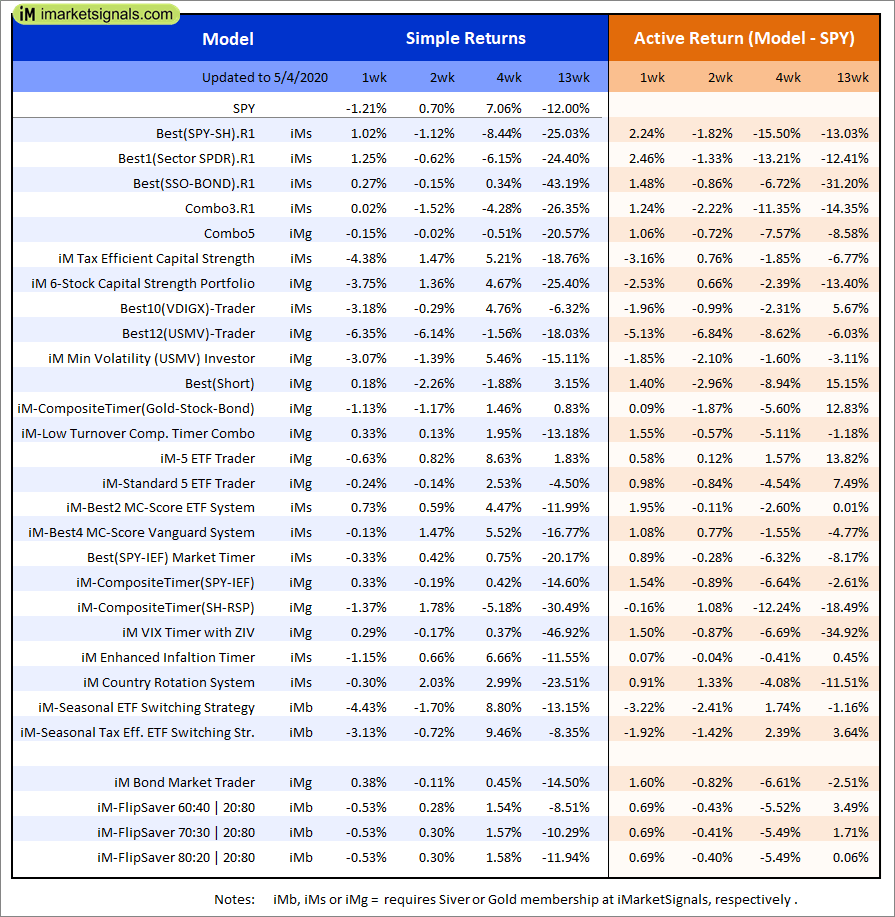
Out of sample performance summary of our models for the past 1, 2, 4 and 13 week periods. The active active return indicates how the models over- or underperformed the benchmark ETF SPY. Also the YTD, and the 1-, 3-, 5- and 10-year annualized returns are shown in the second table |
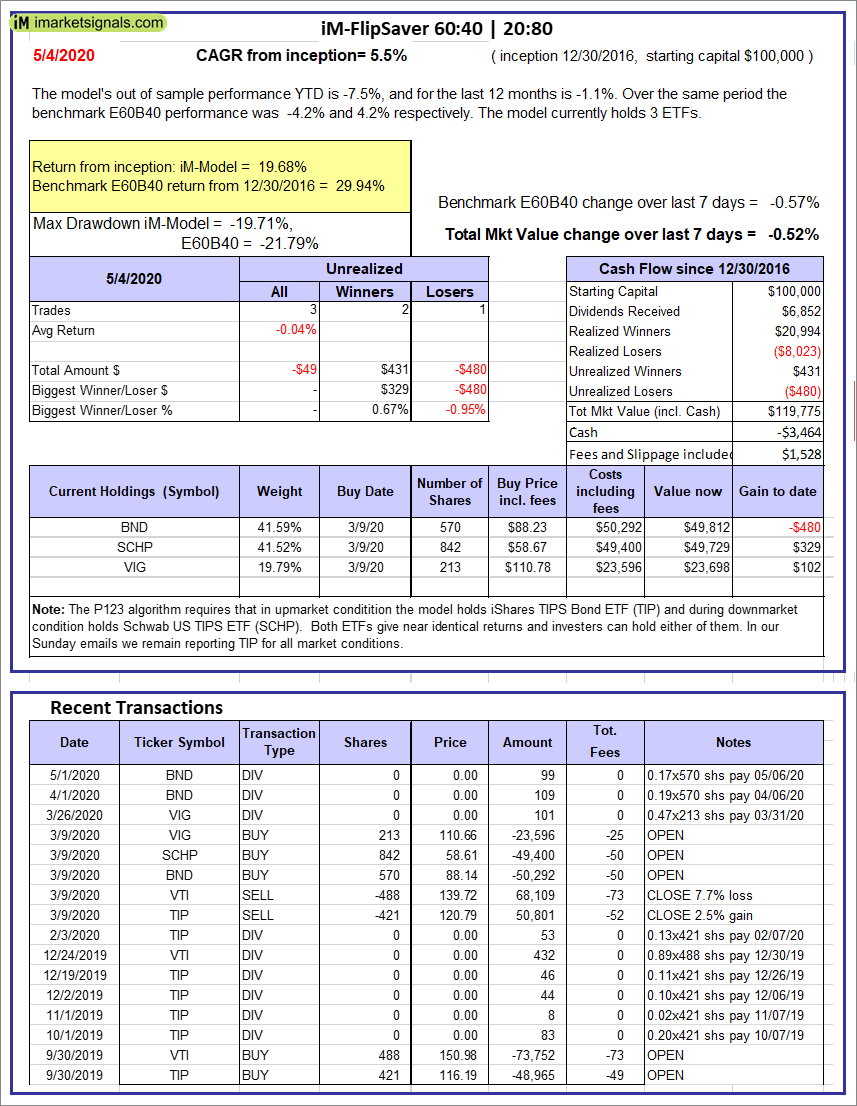 |
iM-FlipSaver 60:40 | 20:80 – 2017: The model’s out of sample performance YTD is -7.5%, and for the last 12 months is -1.1%. Over the same period the benchmark E60B40 performance was -4.2% and 4.2% respectively. Over the previous week the market value of iM-FlipSaver 80:20 | 20:80 gained -0.52% at a time when SPY gained -0.57%. A starting capital of $100,000 at inception on 7/16/2015 would have grown to $119,775 which includes -$3,464 cash and excludes $1,528 spent on fees and slippage. |
 |
iM-FlipSaver 70:30 | 20:80 – 2017: The model’s out of sample performance YTD is -9.3%, and for the last 12 months is -2.9%. Over the same period the benchmark E60B40 performance was -4.2% and 4.2% respectively. Over the previous week the market value of iM-FlipSaver 70:30 | 20:80 gained -0.53% at a time when SPY gained -0.57%. A starting capital of $100,000 at inception on 7/15/2015 would have grown to $120,313 which includes -$4,316 cash and excludes $1,661 spent on fees and slippage. |
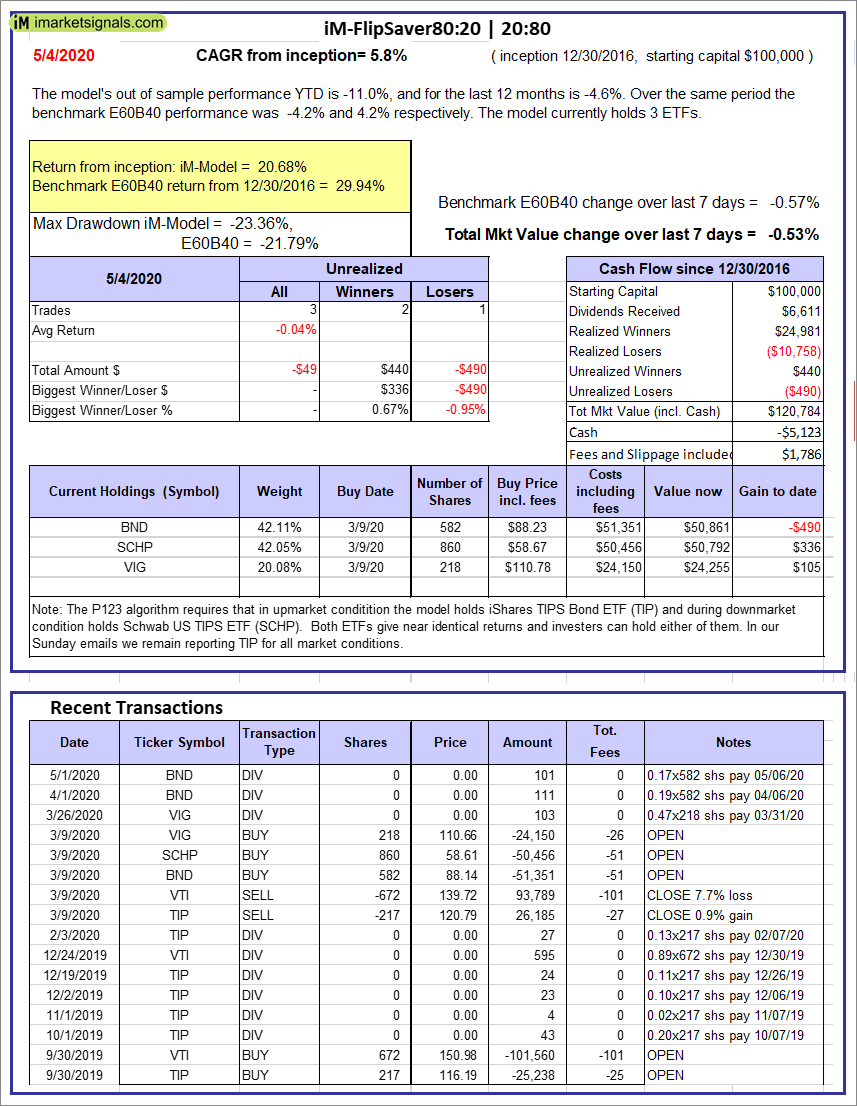 |
iM-FlipSaver 80:20 | 20:80 – 2017: The model’s out of sample performance YTD is -11.0%, and for the last 12 months is -4.6%. Over the same period the benchmark E60B40 performance was -4.2% and 4.2% respectively. Over the previous week the market value of iM-FlipSaver 80:20 | 20:80 gained -0.53% at a time when SPY gained -0.57%. A starting capital of $100,000 at inception on 1/2/2017 would have grown to $120,784 which includes -$5,123 cash and excludes $1,786 spent on fees and slippage. |
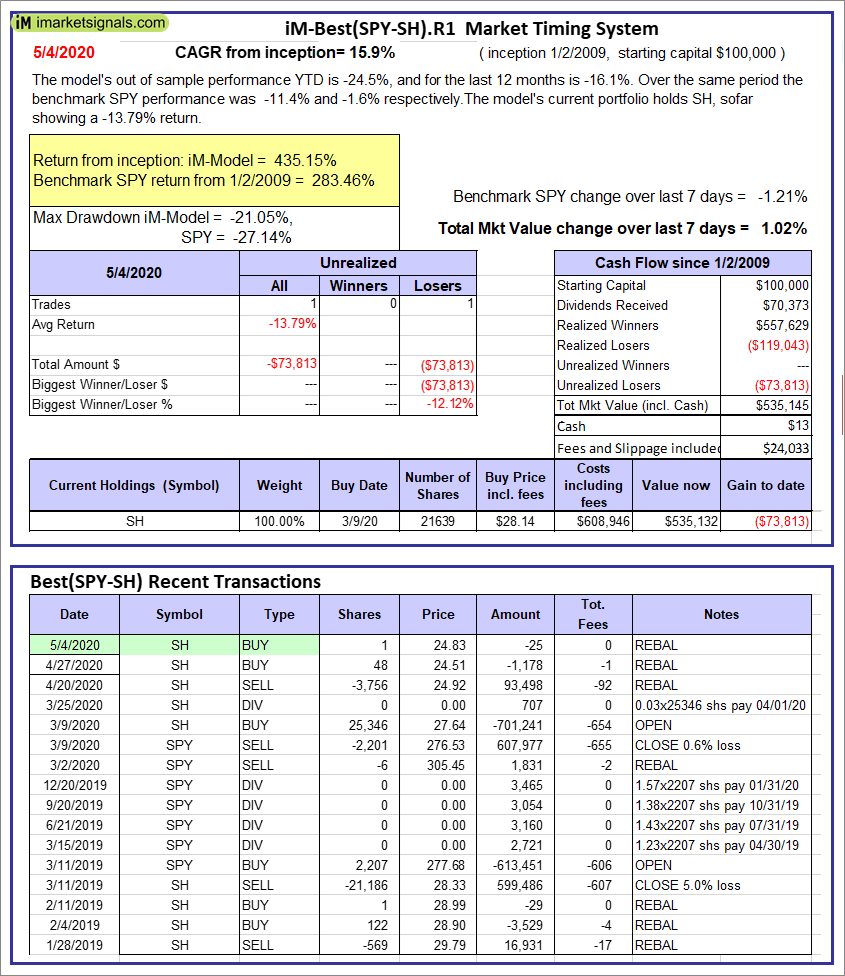 |
iM-Best(SPY-SH).R1: The model’s out of sample performance YTD is -24.5%, and for the last 12 months is -16.1%. Over the same period the benchmark SPY performance was -11.4% and -1.6% respectively. Over the previous week the market value of Best(SPY-SH) gained 1.02% at a time when SPY gained -1.21%. A starting capital of $100,000 at inception on 1/2/2009 would have grown to $535,145 which includes $13 cash and excludes $24,033 spent on fees and slippage. |
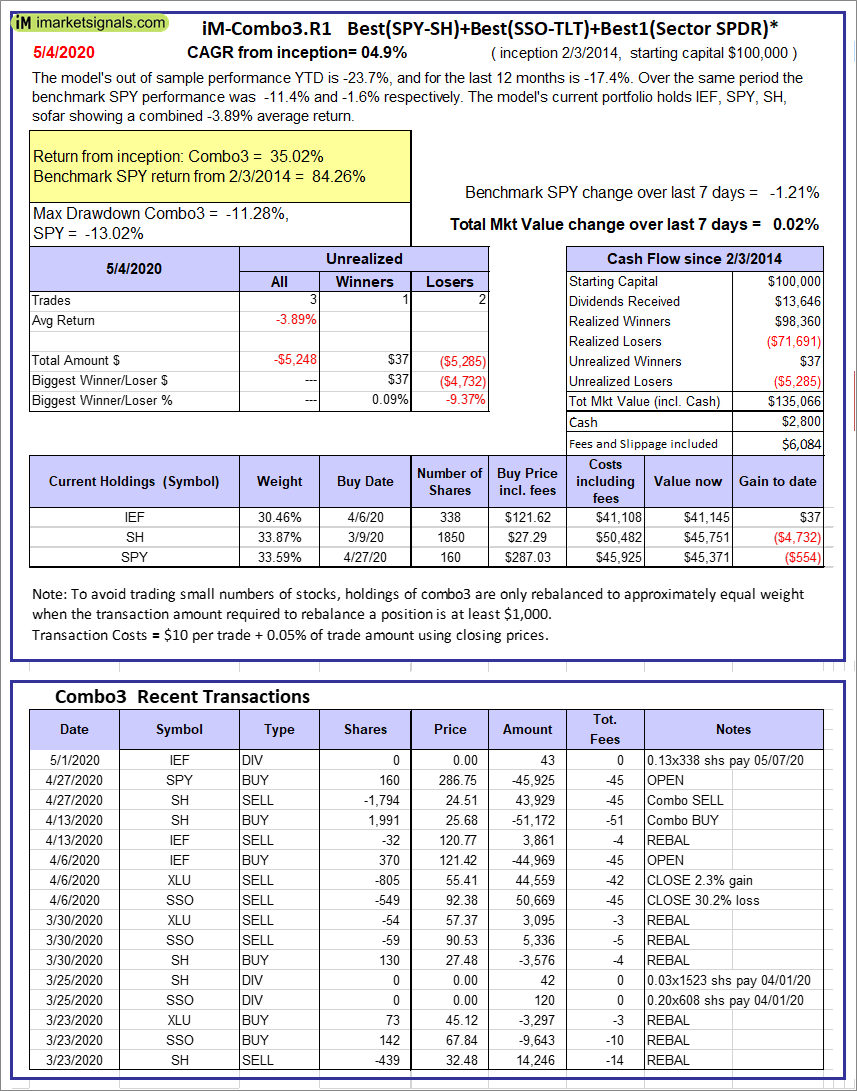 |
iM-Combo3.R1: The model’s out of sample performance YTD is -23.7%, and for the last 12 months is -17.4%. Over the same period the benchmark SPY performance was -11.4% and -1.6% respectively. Over the previous week the market value of iM-Combo3.R1 gained 0.02% at a time when SPY gained -1.21%. A starting capital of $100,000 at inception on 2/3/2014 would have grown to $135,066 which includes $2,800 cash and excludes $6,084 spent on fees and slippage. |
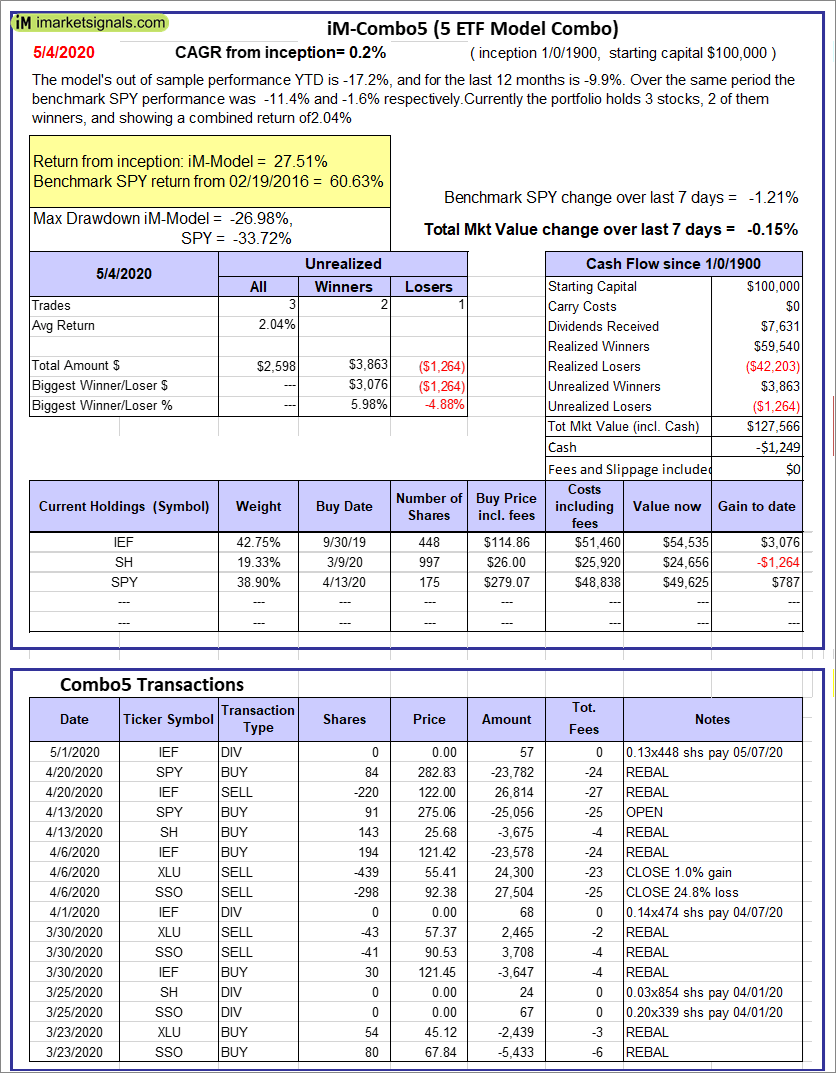 |
iM-Combo5: The model’s out of sample performance YTD is -17.2%, and for the last 12 months is -9.9%. Over the same period the benchmark SPY performance was -11.4% and -1.6% respectively. Over the previous week the market value of iM-Combo5 gained -0.15% at a time when SPY gained -1.21%. A starting capital of $100,000 at inception on 2/22/2016 would have grown to $127,566 which includes -$1,249 cash and excludes $0 spent on fees and slippage. |
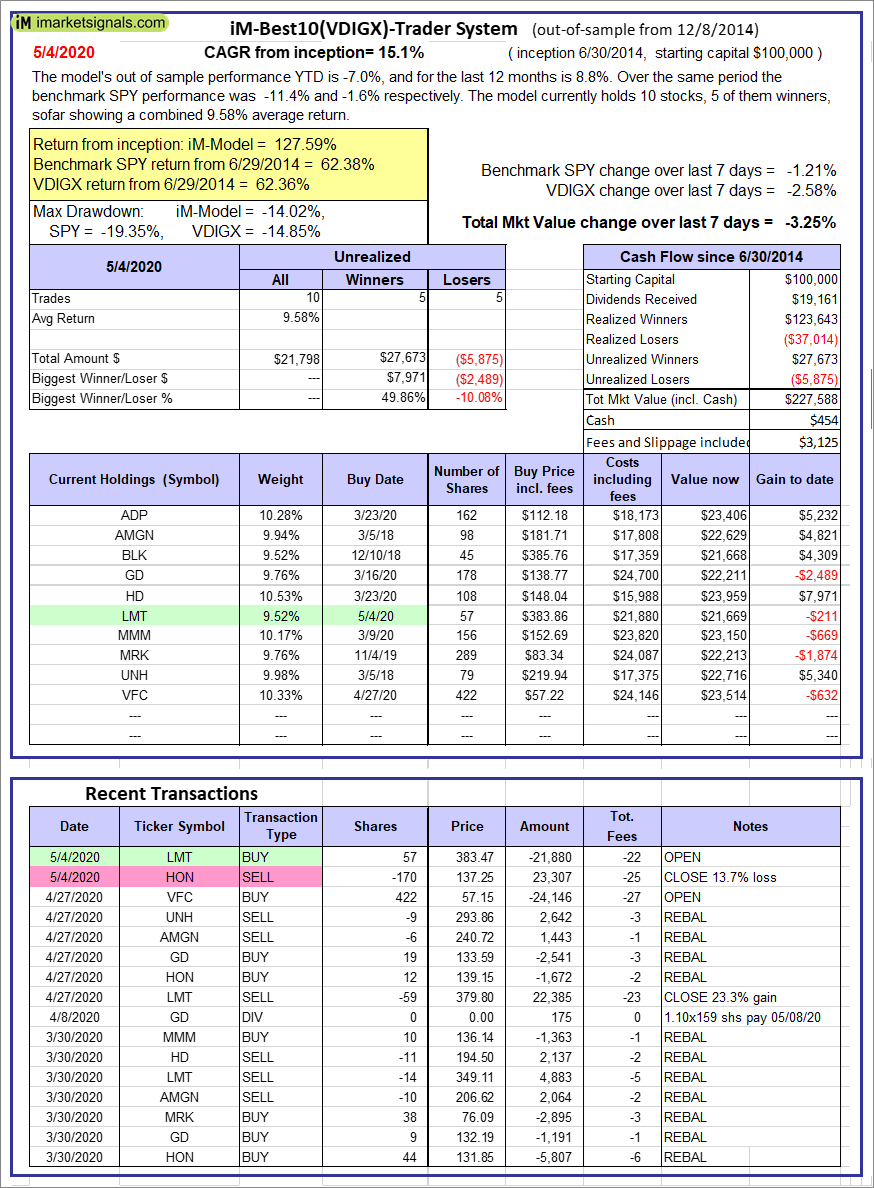 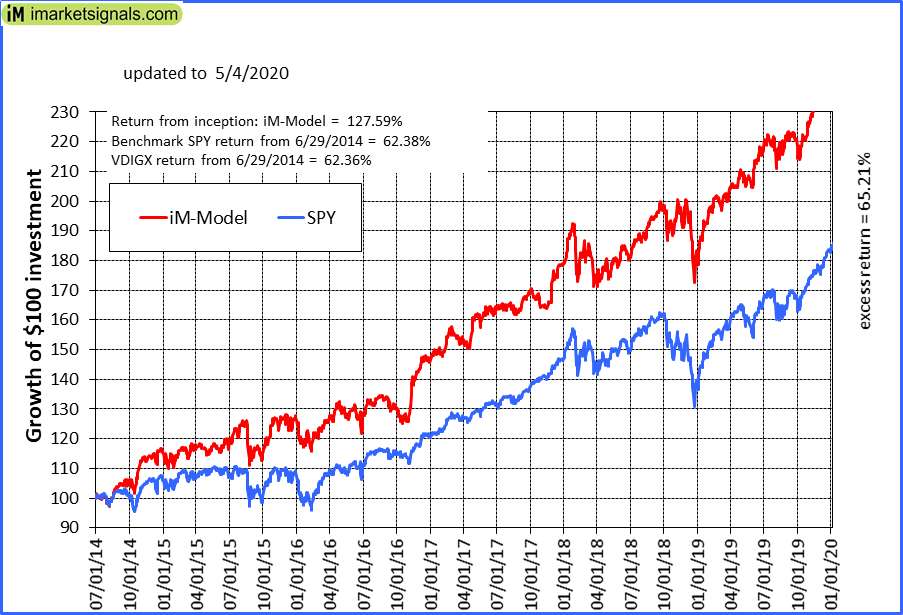 |
iM-Best10(VDIGX)-Trader: The model’s out of sample performance YTD is -7.0%, and for the last 12 months is 8.8%. Over the same period the benchmark SPY performance was -11.4% and -1.6% respectively. Since inception, on 7/1/2014, the model gained 127.59% while the benchmark SPY gained 62.38% and VDIGX gained 62.36% over the same period. Over the previous week the market value of iM-Best10(VDIGX) gained -3.25% at a time when SPY gained -1.21%. A starting capital of $100,000 at inception on 7/1/2014 would have grown to $227,588 which includes $454 cash and excludes $3,125 spent on fees and slippage. |
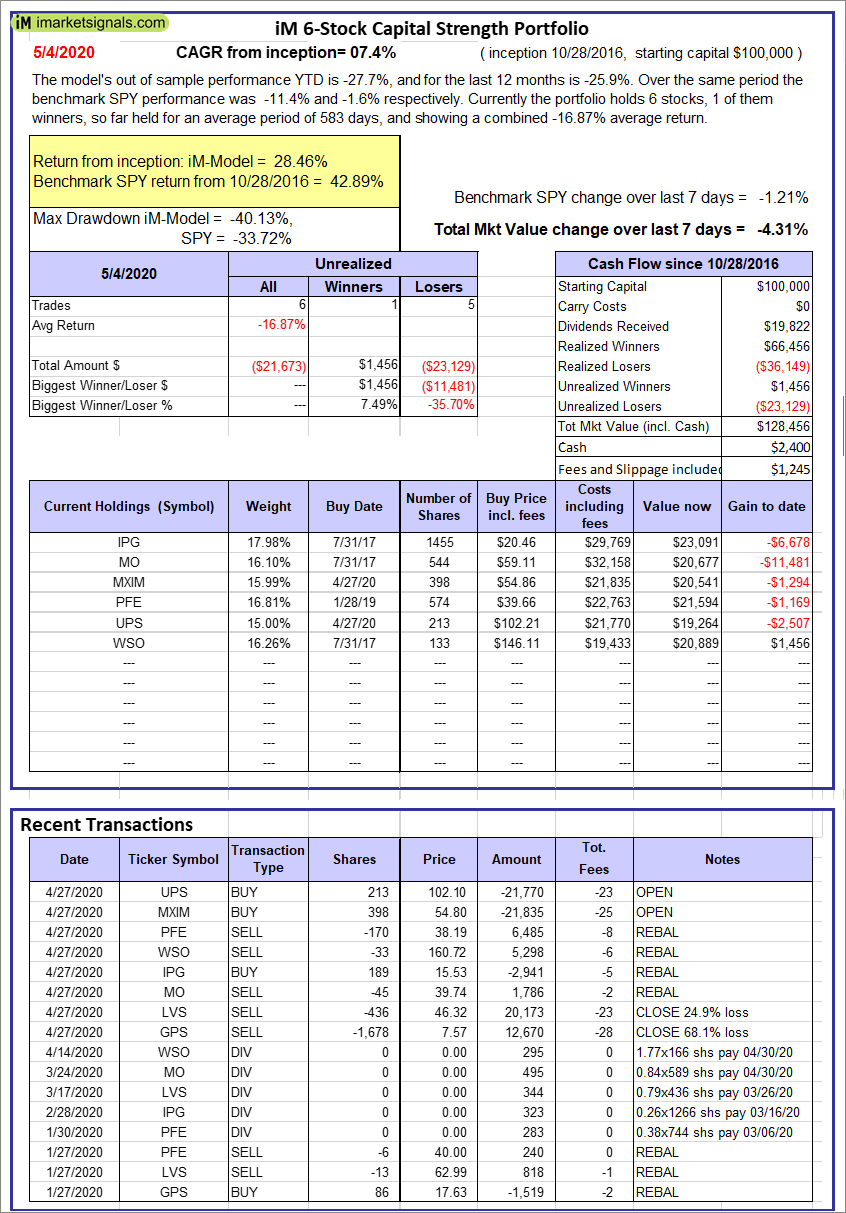 |
iM 6-Stock Capital Strength Portfolio: The model’s out of sample performance YTD is -27.7%, and for the last 12 months is -25.9%. Over the same period the benchmark SPY performance was -11.4% and -1.6% respectively. Over the previous week the market value of the iM 6-Stock Capital Strength Portfolio gained -4.31% at a time when SPY gained -1.21%. A starting capital of $100,000 at inception on 10/28/2016 would have grown to $128,456 which includes $2,400 cash and excludes $1,245 spent on fees and slippage. |
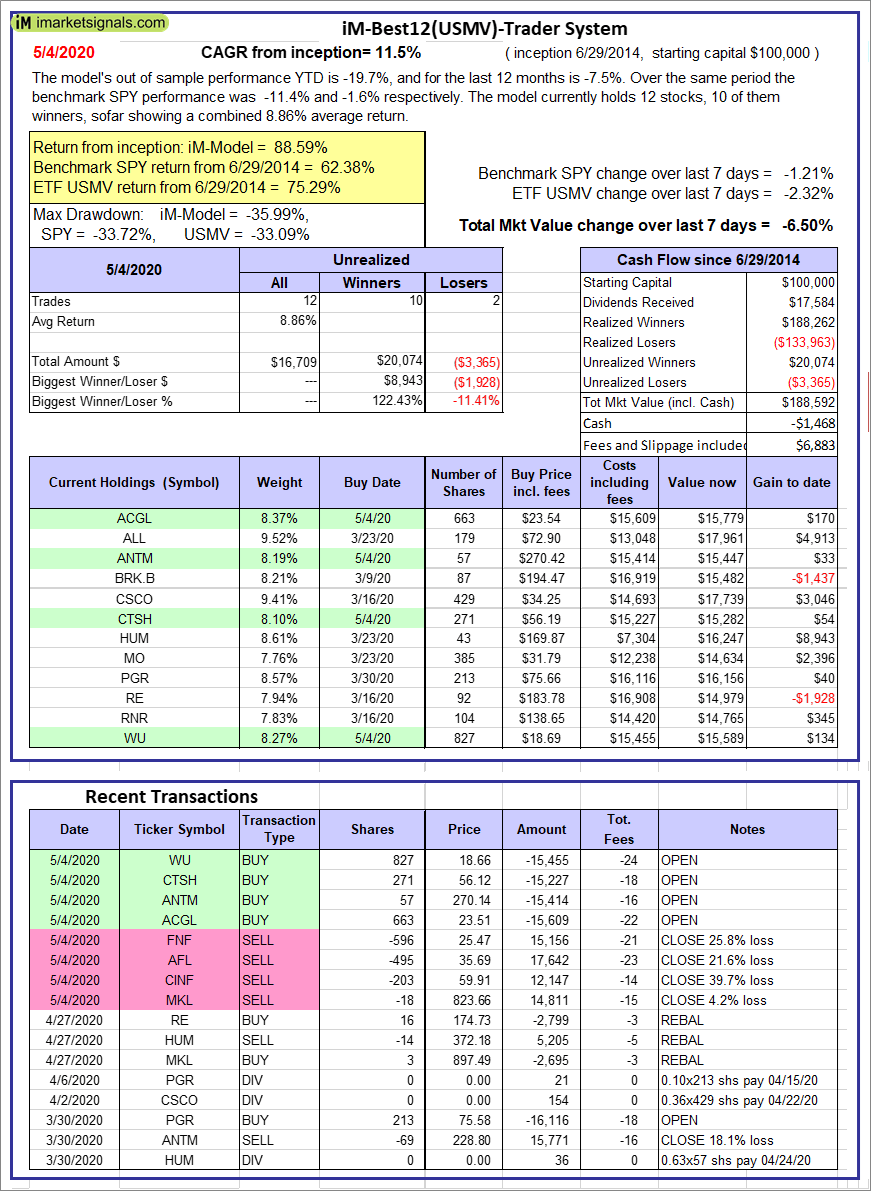 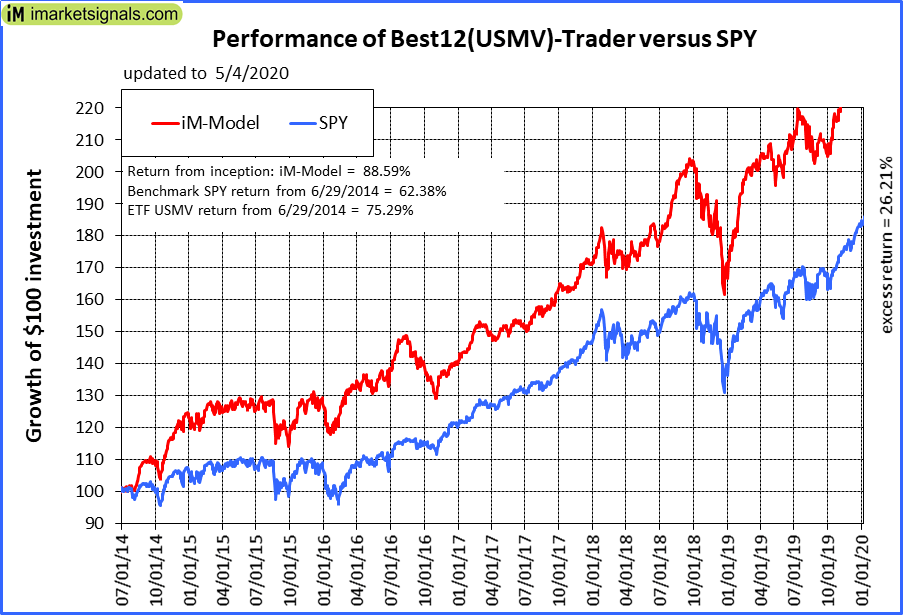 |
iM-Best12(USMV)-Trader: The model’s out of sample performance YTD is -19.7%, and for the last 12 months is -7.5%. Over the same period the benchmark SPY performance was -11.4% and -1.6% respectively. Since inception, on 6/30/2014, the model gained 88.59% while the benchmark SPY gained 62.38% and the ETF USMV gained 75.29% over the same period. Over the previous week the market value of iM-Best12(USMV)-Trader gained -6.50% at a time when SPY gained -1.21%. A starting capital of $100,000 at inception on 6/30/2014 would have grown to $188,592 which includes -$1,468 cash and excludes $6,883 spent on fees and slippage. |
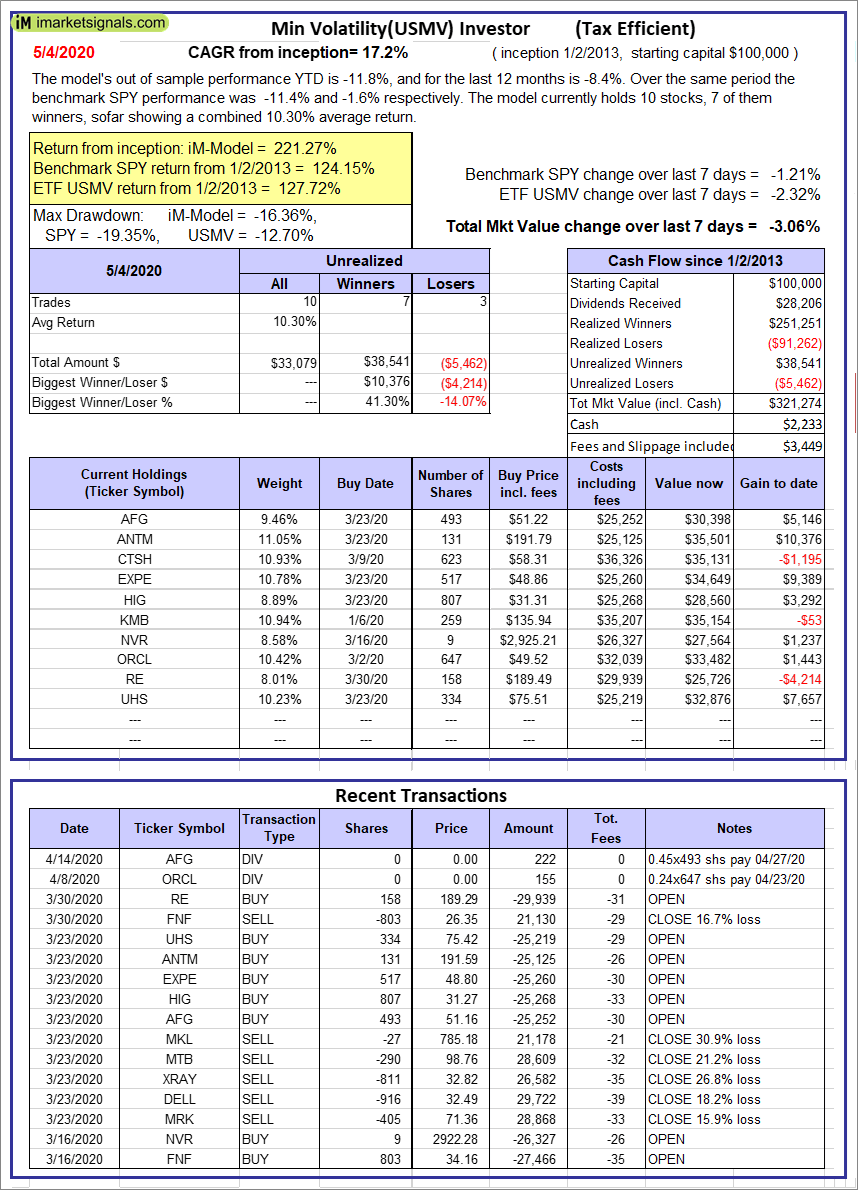 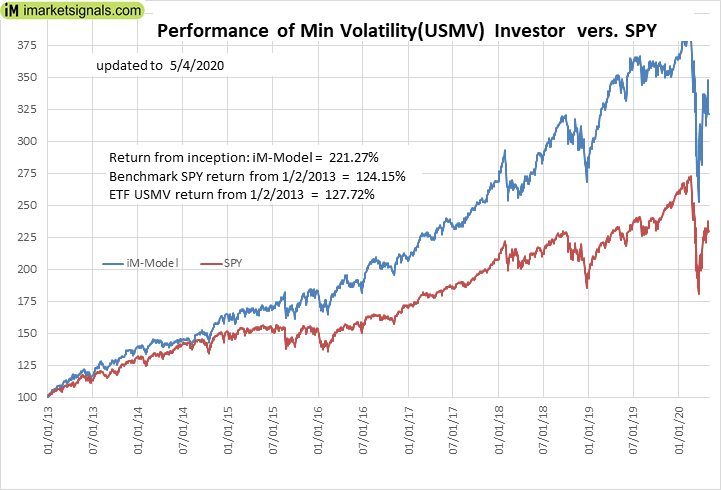 |
iM-Min Volatility(USMV) Investor (Tax Efficient): The model’s out of sample performance YTD is -11.8%, and for the last 12 months is -8.4%. Over the same period the benchmark SPY performance was -11.4% and -1.6% respectively. Since inception, on 1/3/2013, the model gained 221.27% while the benchmark SPY gained 124.15% and the ETF USMV gained 127.72% over the same period. Over the previous week the market value of iM-Best12(USMV)Q1 gained -3.06% at a time when SPY gained -1.21%. A starting capital of $100,000 at inception on 1/3/2013 would have grown to $321,274 which includes $2,233 cash and excludes $3,449 spent on fees and slippage. |
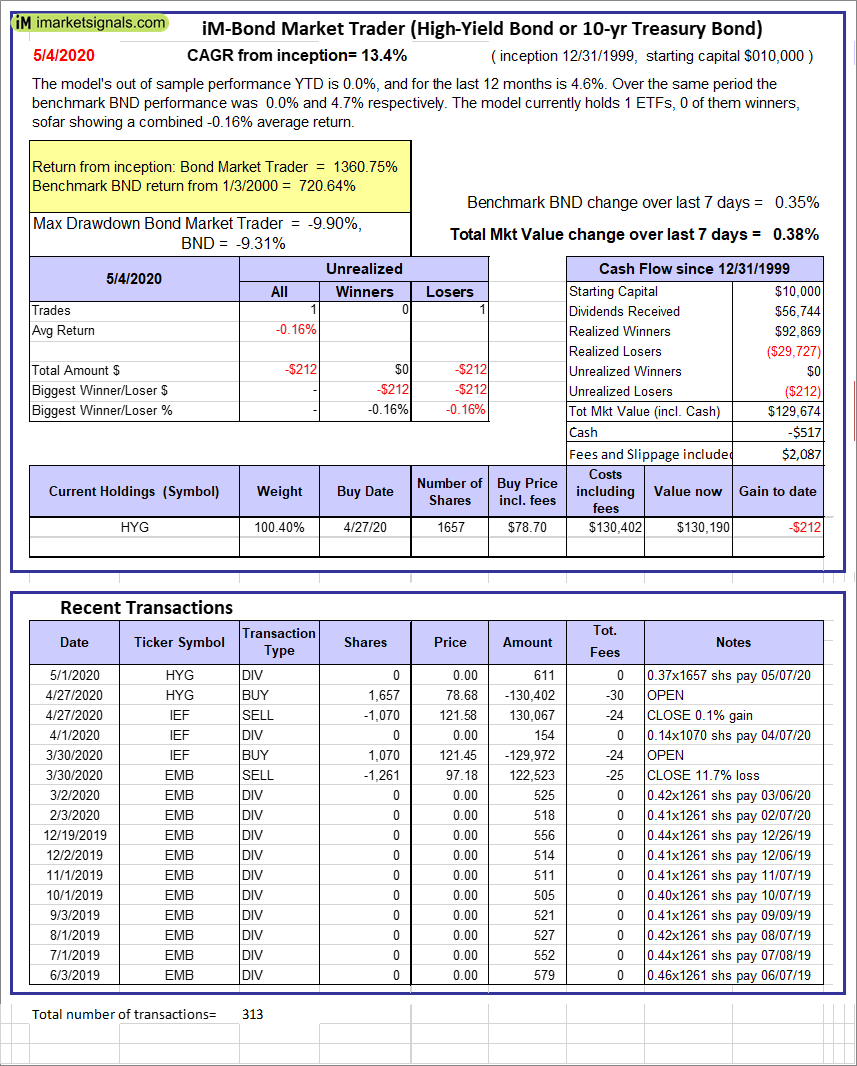 |
iM-Bond Market Trader (High-Yield Bond or 10-yr Treasury Bond): The model’s out of sample performance YTD is -31.7%, and for the last 12 months is -32.1%. Over the same period the benchmark SPY performance was -11.4% and -1.6% respectively. Over the previous week the market value of the iM-Bond Market Trader (High-Yield Bond or 10-yr Treasury Bond) gained 0.38% at a time when BND gained 0.35%. A starting capital of $100,000 at inception on 10/30/2016 would have grown to $129,674 which includes -$517 cash and excludes $2,087 spent on fees and slippage. |
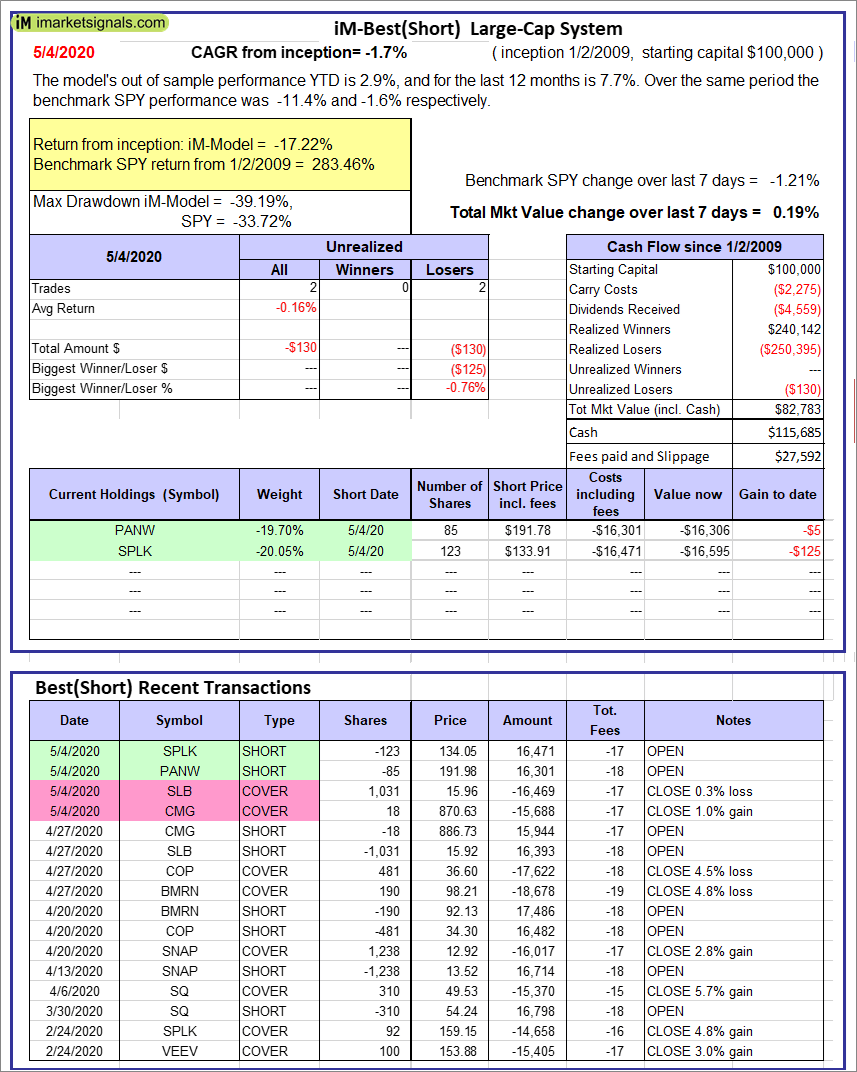 |
iM-Best(Short): The model’s out of sample performance YTD is 2.9%, and for the last 12 months is 7.7%. Over the same period the benchmark SPY performance was -11.4% and -1.6% respectively. Over the previous week the market value of iM-Best(Short) gained 0.19% at a time when SPY gained -1.21%. Over the period 1/2/2009 to 5/4/2020 the starting capital of $100,000 would have grown to $82,783 which includes $115,685 cash and excludes $27,592 spent on fees and slippage. |
 |
iM-Best2 MC-Score ETF System: The model’s out of sample performance YTD is -10.6%, and for the last 12 months is 0.0%. Over the same period the benchmark SPY performance was -11.4% and -1.6% respectively. Over the previous week the market value of the iM-Best2 MC-Score ETF System gained 0.73% at a time when SPY gained -1.21%. A starting capital of $100,000 at inception on 6/30/2016 would have grown to $112,428 which includes $296 cash and excludes $1,012 spent on fees and slippage. |
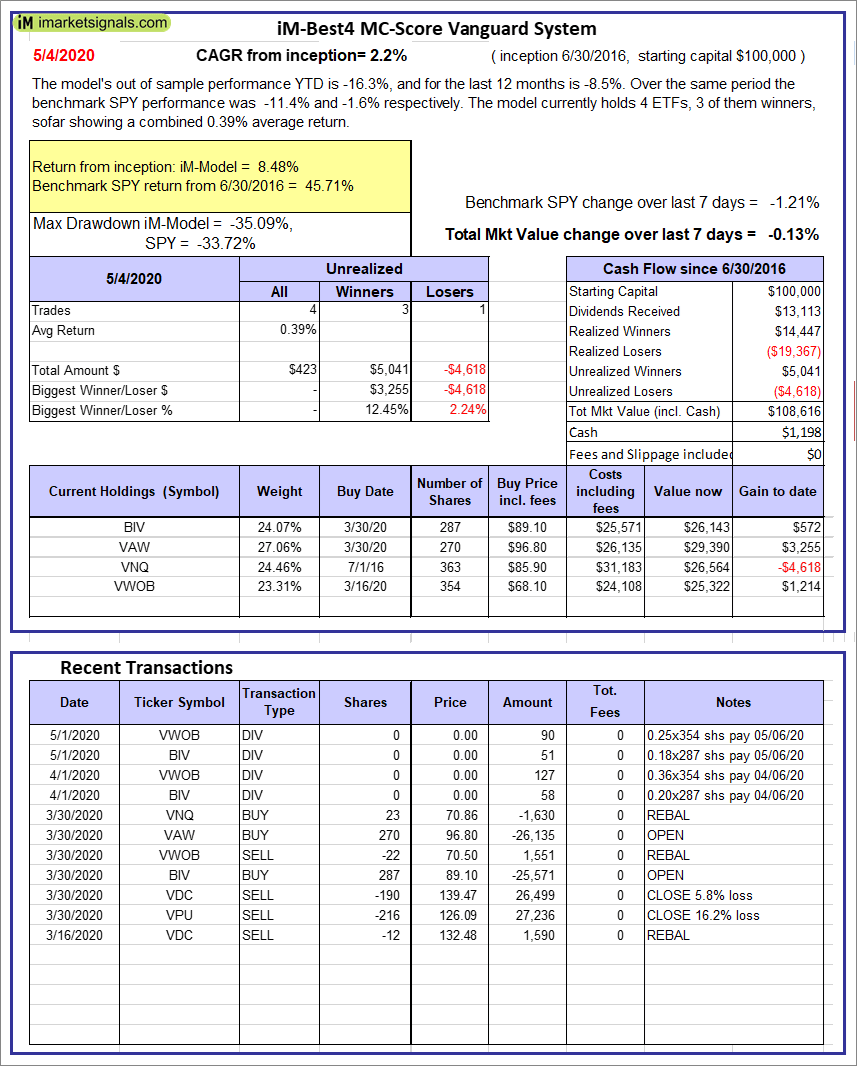 |
iM-Best4 MC-Score Vanguard System: The model’s out of sample performance YTD is -16.3%, and for the last 12 months is -8.5%. Over the same period the benchmark SPY performance was -11.4% and -1.6% respectively. Over the previous week the market value of the iM-Best4 MC-Score Vanguard System gained -0.13% at a time when SPY gained -1.21%. A starting capital of $100,000 at inception on 6/30/2016 would have grown to $108,616 which includes $1,198 cash and excludes $00 spent on fees and slippage. |
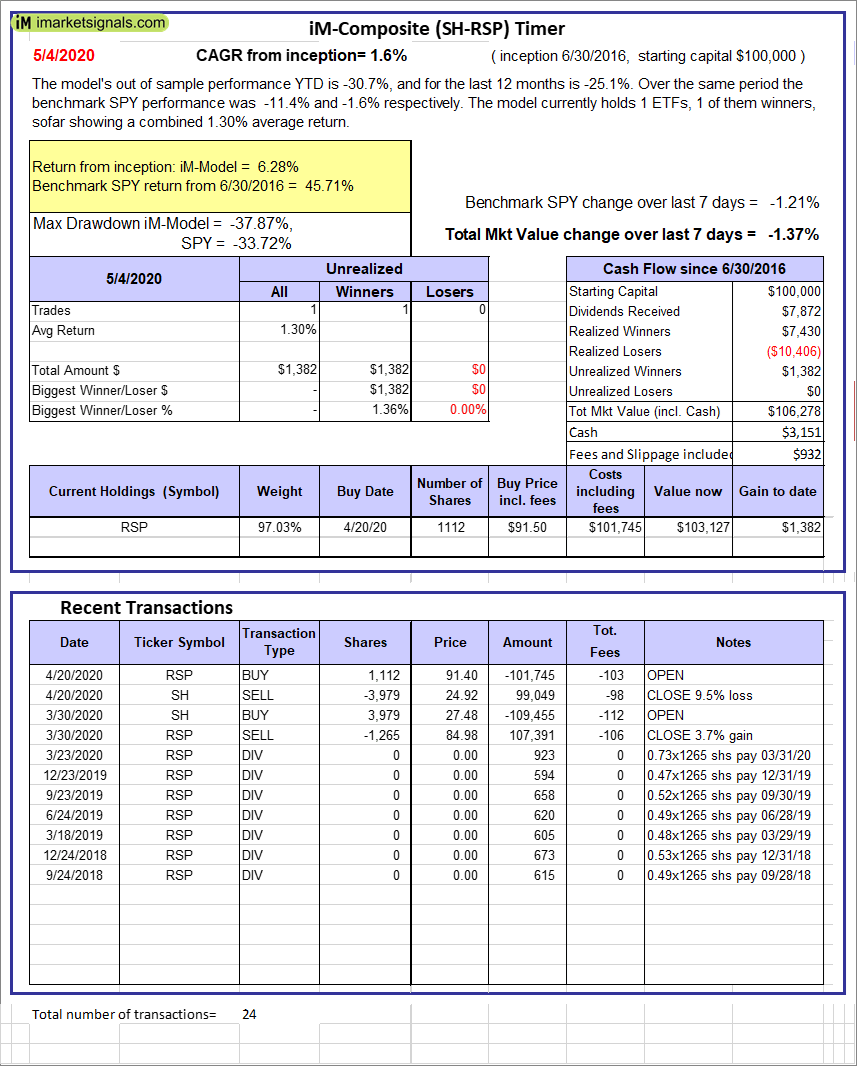 |
iM-Composite (SH-RSP) Timer: The model’s out of sample performance YTD is -30.7%, and for the last 12 months is -25.1%. Over the same period the benchmark SPY performance was -11.4% and -1.6% respectively. Over the previous week the market value of the iM-Composite (SH-RSP) Timer gained -1.37% at a time when SPY gained -1.21%. A starting capital of $100,000 at inception on 6/30/2016 would have grown to $106,278 which includes $3,151 cash and excludes $932 spent on fees and slippage. |
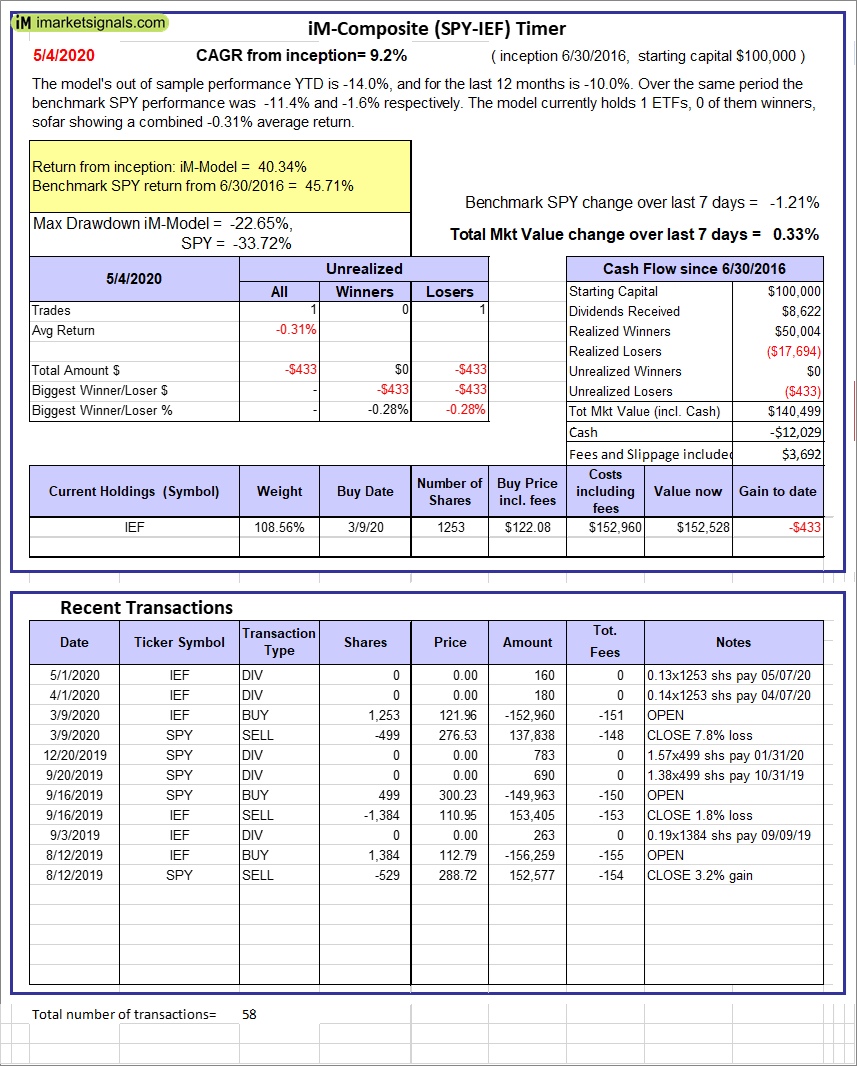 |
iM-Composite (SPY-IEF) Timer: The model’s out of sample performance YTD is -14.0%, and for the last 12 months is -10.0%. Over the same period the benchmark SPY performance was -11.4% and -1.6% respectively. Over the previous week the market value of the iM-Composite (SPY-IEF) Timer gained 0.33% at a time when SPY gained -1.21%. A starting capital of $100,000 at inception on 6/30/2016 would have grown to $140,499 which includes -$12,029 cash and excludes $3,692 spent on fees and slippage. |
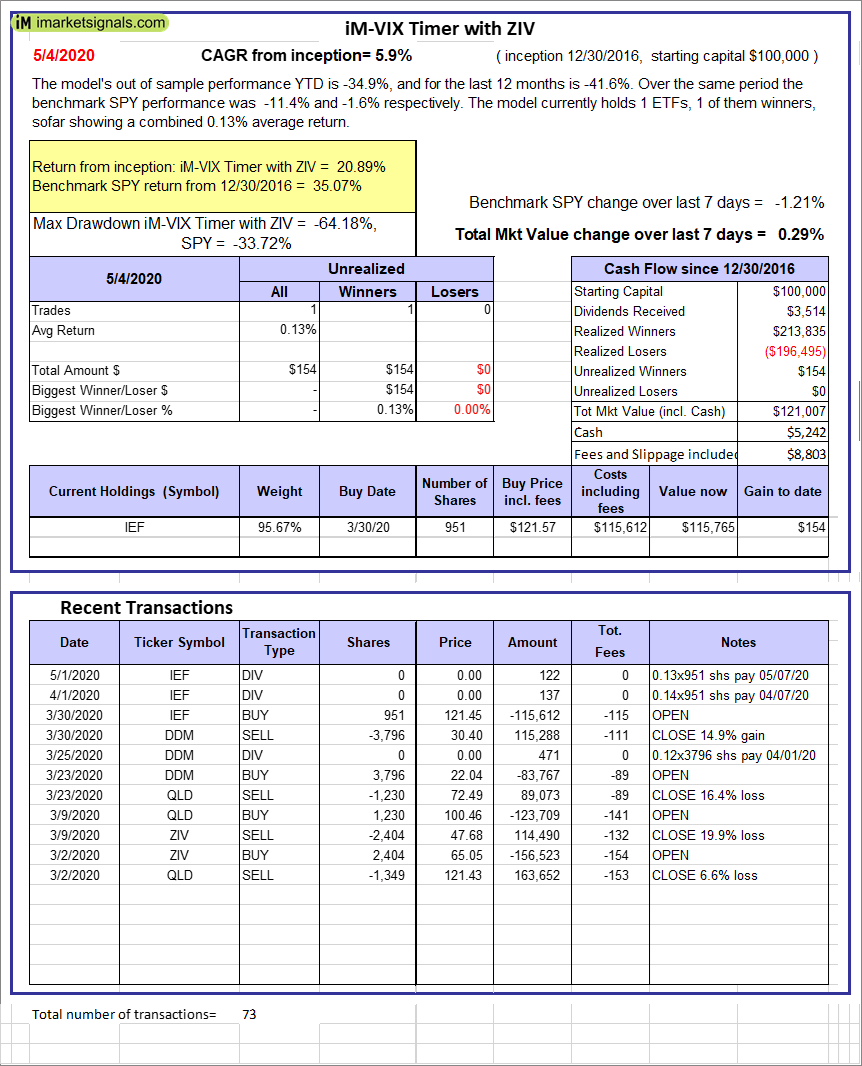 |
iM-VIX Timer with ZIV: The model’s out of sample performance YTD is -34.9%, and for the last 12 months is -41.6%. Over the same period the benchmark SPY performance was -11.4% and -1.6% respectively. Over the previous week the market value of the iM-VIX Timer with ZIV gained 0.29% at a time when SPY gained -1.21%. A starting capital of $100,000 at inception on 6/30/2016 would have grown to $121,007 which includes $5,242 cash and excludes $8,803 spent on fees and slippage. |
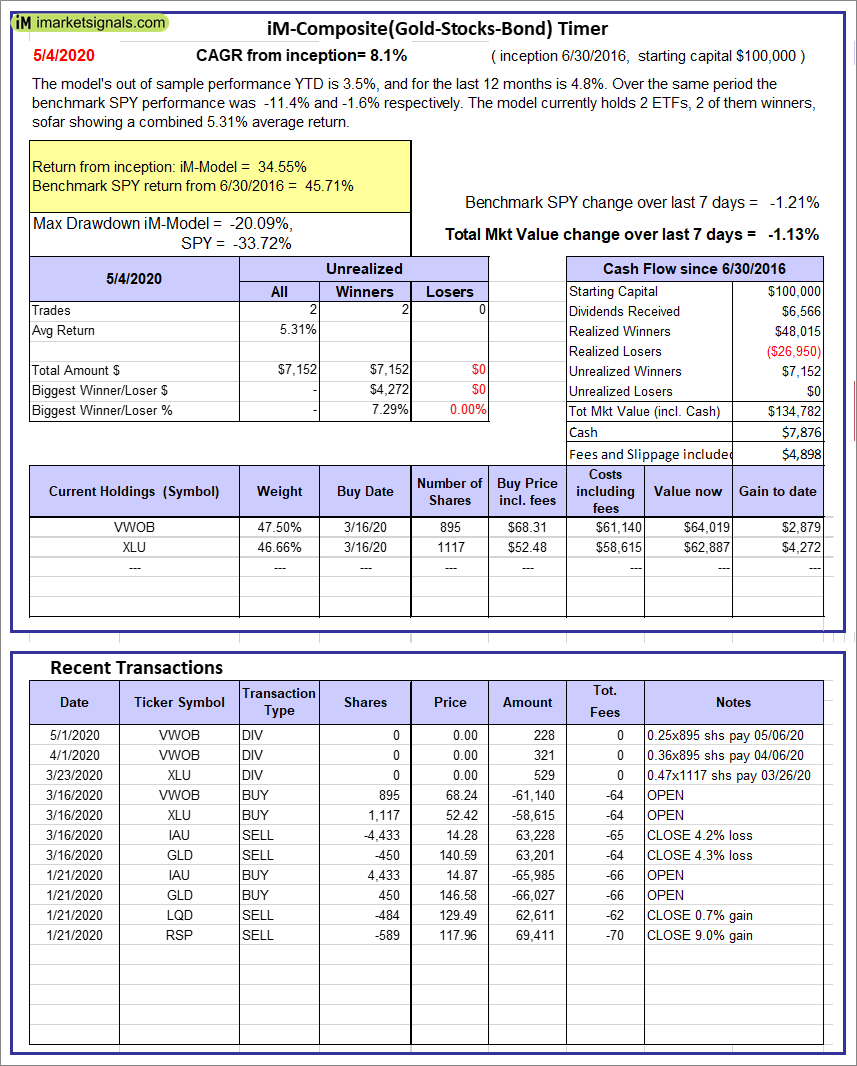 |
iM-Composite(Gold-Stocks-Bond) Timer: The model’s out of sample performance YTD is 3.5%, and for the last 12 months is 4.8%. Over the same period the benchmark SPY performance was -11.4% and -1.6% respectively. Over the previous week the market value of the iM-Composite(Gold-Stocks-Bond) Timer gained -1.13% at a time when SPY gained -1.21%. A starting capital of $100,000 at inception on 6/30/2016 would have grown to $134,782 which includes $7,876 cash and excludes $4,898 spent on fees and slippage. |
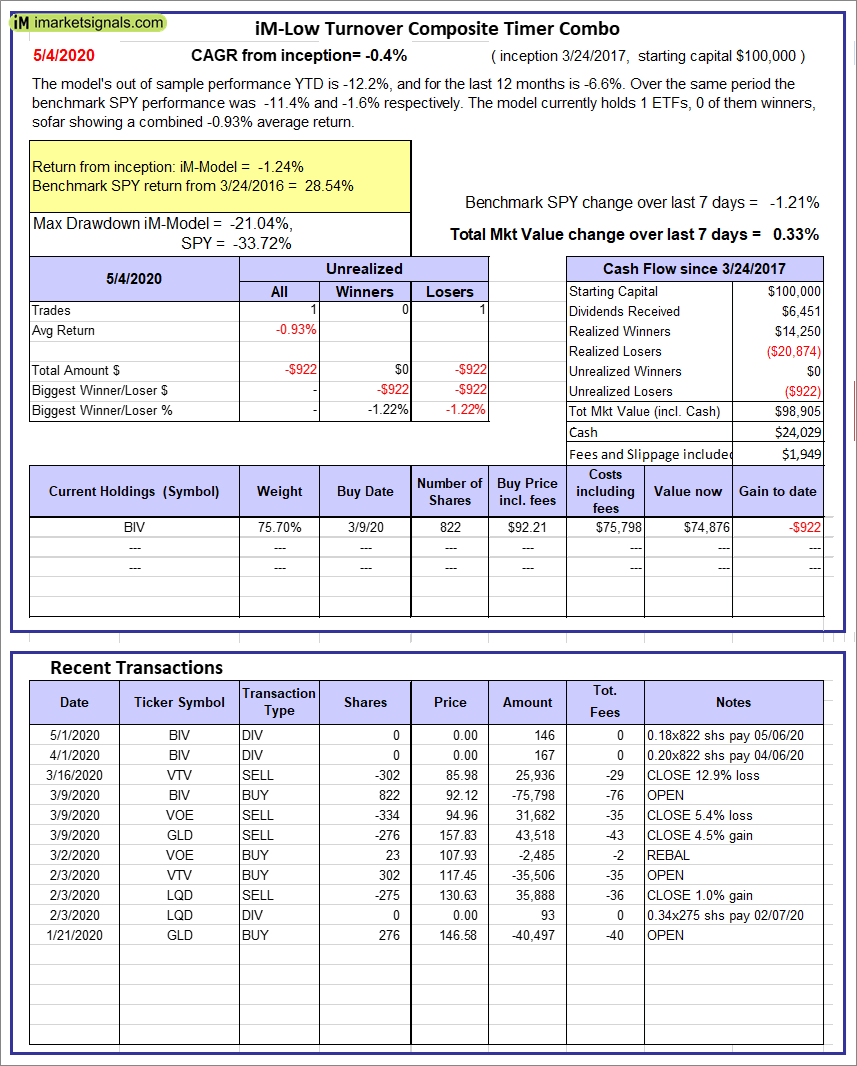 |
iM-Low Turnover Composite Timer Combo: The model’s out of sample performance YTD is -12.2%, and for the last 12 months is -6.6%. Over the same period the benchmark SPY performance was -11.4% and -1.6% respectively. Over the previous week the market value of the iM-Low Turnover Composite Timer Combo gained 0.33% at a time when SPY gained -1.21%. A starting capital of $100,000 at inception on 3/24/27 would have grown to $98,905 which includes $24,029 cash and excludes $1,949 spent on fees and slippage. |
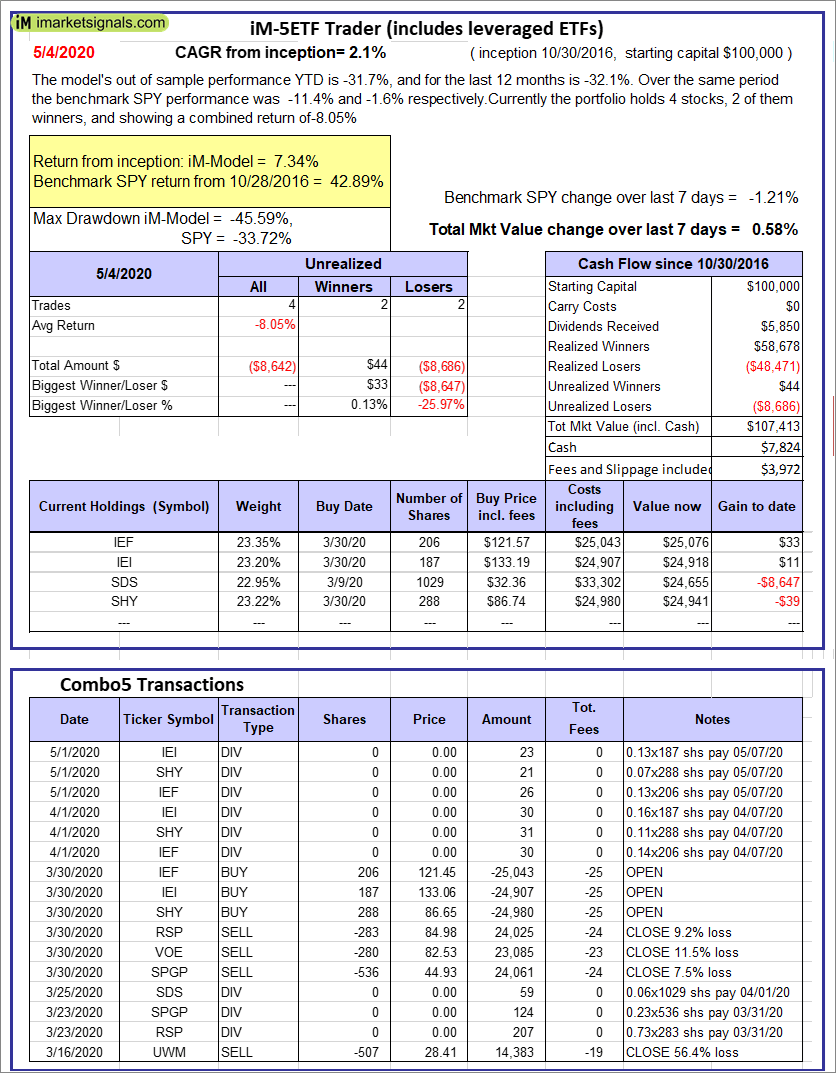 |
iM-5ETF Trader (includes leveraged ETFs): The model’s out of sample performance YTD is -31.7%, and for the last 12 months is -32.1%. Over the same period the benchmark SPY performance was -11.4% and -1.6% respectively. Over the previous week the market value of the iM-5ETF Trader (includes leveraged ETFs) gained 0.58% at a time when SPY gained -1.21%. A starting capital of $100,000 at inception on 10/30/2016 would have grown to $107,413 which includes $7,824 cash and excludes $3,972 spent on fees and slippage. |
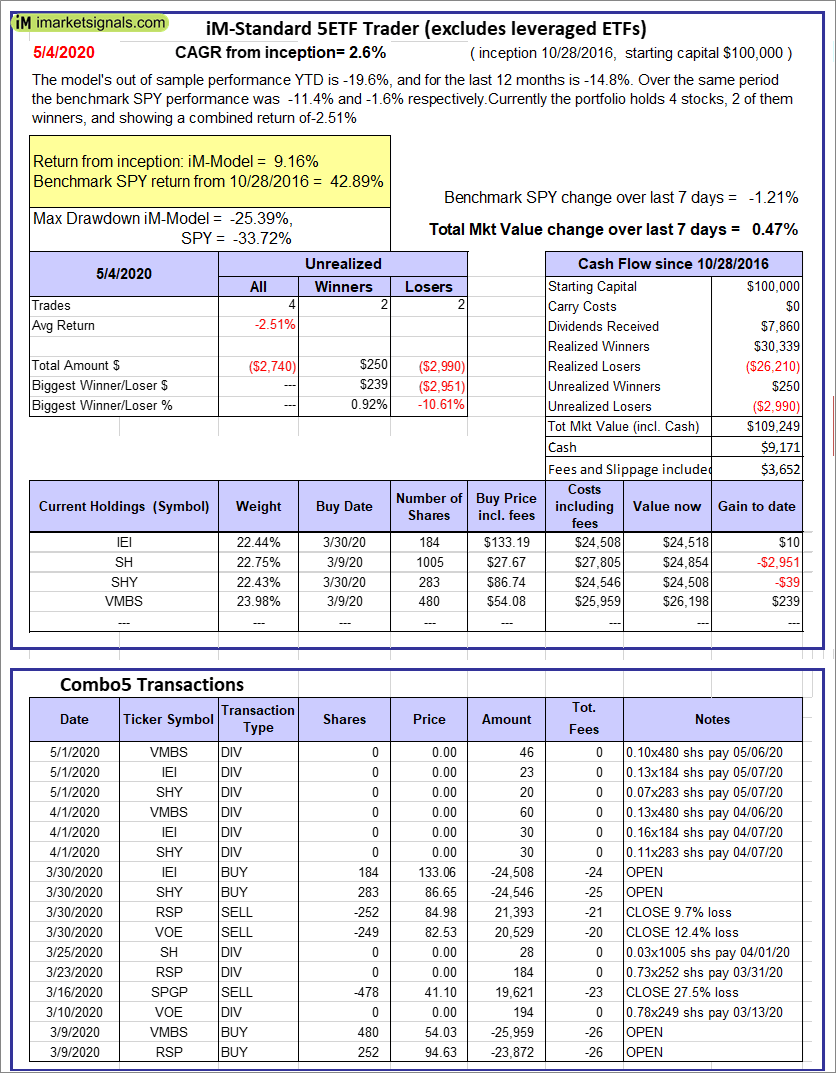 |
iM-Standard 5ETF Trader (excludes leveraged ETFs): The model’s out of sample performance YTD is -19.6%, and for the last 12 months is -14.8%. Over the same period the benchmark SPY performance was -11.4% and -1.6% respectively. Over the previous week the market value of the iM-Standard 5ETF Trader (excludes leveraged ETFs) gained 0.47% at a time when SPY gained -1.21%. A starting capital of $100,000 at inception on 10/30/2016 would have grown to $109,249 which includes $9,171 cash and excludes $3,652 spent on fees and slippage. |
iM-Best Reports – 5/4/2020
Posted in pmp SPY-SH
Leave a Reply
You must be logged in to post a comment.