
  |
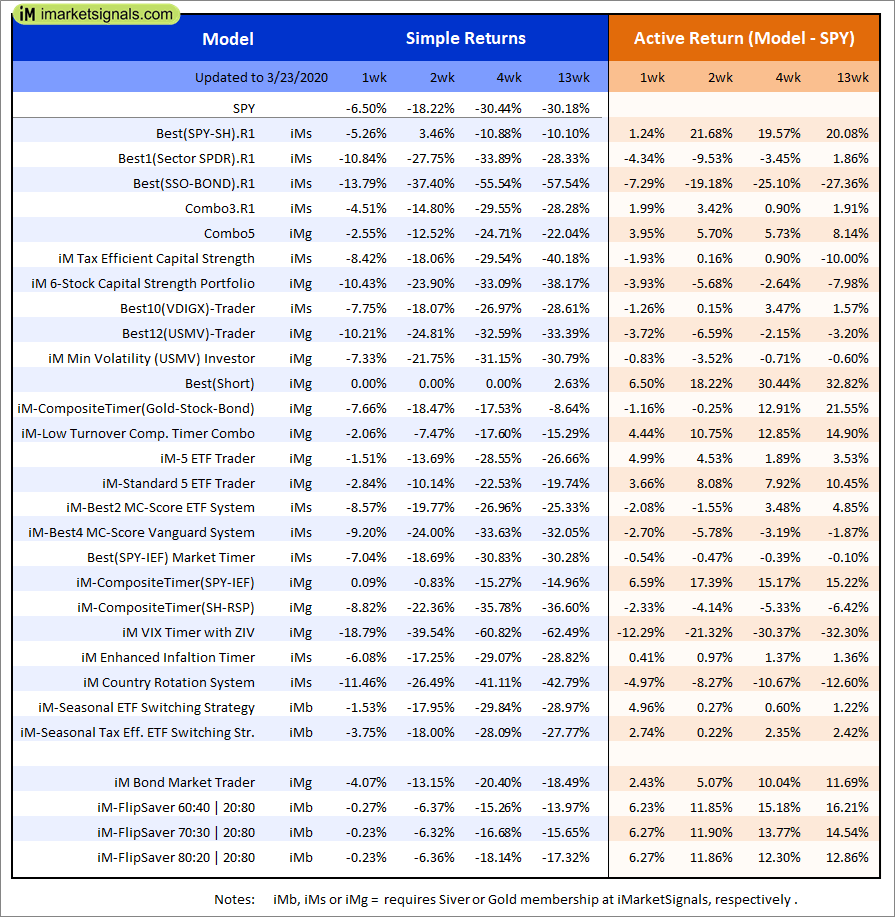
Out of sample performance summary of our models for the past 1, 2, 4 and 13 week periods. The active active return indicates how the models over- or underperformed the benchmark ETF SPY. Also the YTD, and the 1-, 3-, 5- and 10-year annualized returns are shown in the second table |
 |
iM-FlipSaver 60:40 | 20:80 – 2017: The model’s out of sample performance YTD is -14.0%, and for the last 12 months is -6.9%. Over the same period the benchmark E60B40 performance was -18.7% and -8.7% respectively. Over the previous week the market value of iM-FlipSaver 80:20 | 20:80 gained 0.58% at a time when SPY gained -6.34%. A starting capital of $100,000 at inception on 7/16/2015 would have grown to $111,289 which includes -$3,773 cash and excludes $1,528 spent on fees and slippage. |
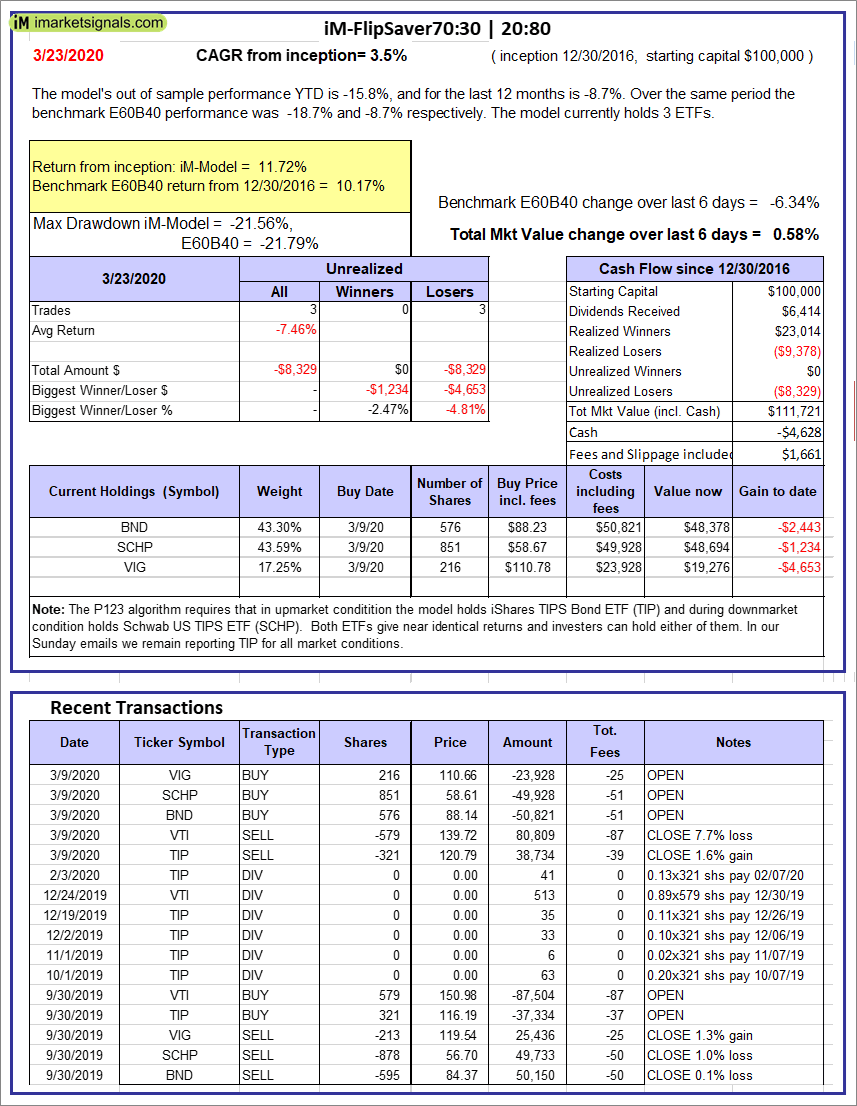 |
iM-FlipSaver 70:30 | 20:80 – 2017: The model’s out of sample performance YTD is -15.8%, and for the last 12 months is -8.7%. Over the same period the benchmark E60B40 performance was -18.7% and -8.7% respectively. Over the previous week the market value of iM-FlipSaver 70:30 | 20:80 gained 0.58% at a time when SPY gained -6.34%. A starting capital of $100,000 at inception on 7/15/2015 would have grown to $111,721 which includes -$4,628 cash and excludes $1,661 spent on fees and slippage. |
 |
iM-FlipSaver 80:20 | 20:80 – 2017: The model’s out of sample performance YTD is -17.4%, and for the last 12 months is -10.4%. Over the same period the benchmark E60B40 performance was -18.7% and -8.7% respectively. Over the previous week the market value of iM-FlipSaver 80:20 | 20:80 gained 0.59% at a time when SPY gained -6.34%. A starting capital of $100,000 at inception on 1/2/2017 would have grown to $112,107 which includes -$5,438 cash and excludes $1,786 spent on fees and slippage. |
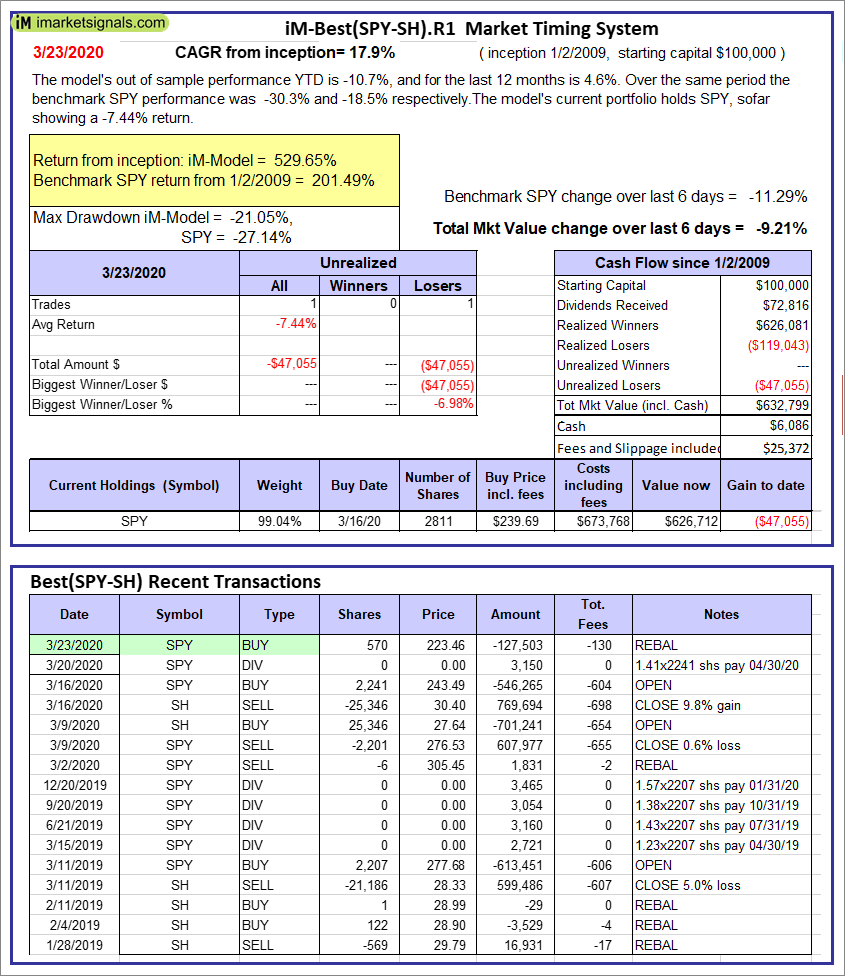 |
iM-Best(SPY-SH).R1: The model’s out of sample performance YTD is -10.7%, and for the last 12 months is 4.6%. Over the same period the benchmark SPY performance was -30.3% and -18.5% respectively. Over the previous week the market value of Best(SPY-SH) gained -9.21% at a time when SPY gained -11.29%. A starting capital of $100,000 at inception on 1/2/2009 would have grown to $632,799 which includes $6,086 cash and excludes $25,372 spent on fees and slippage. |
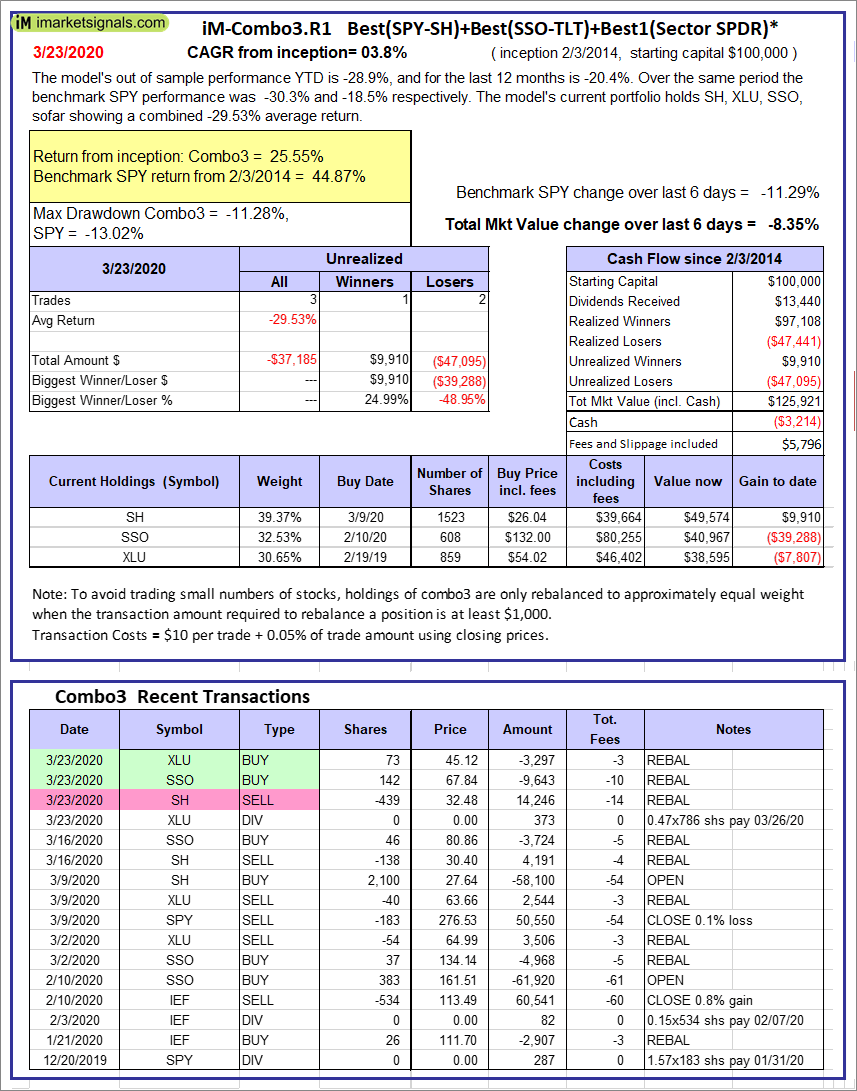 |
iM-Combo3.R1: The model’s out of sample performance YTD is -28.9%, and for the last 12 months is -20.4%. Over the same period the benchmark SPY performance was -30.3% and -18.5% respectively. Over the previous week the market value of iM-Combo3.R1 gained -8.35% at a time when SPY gained -11.29%. A starting capital of $100,000 at inception on 2/3/2014 would have grown to $125,921 which includes -$3,214 cash and excludes $5,796 spent on fees and slippage. |
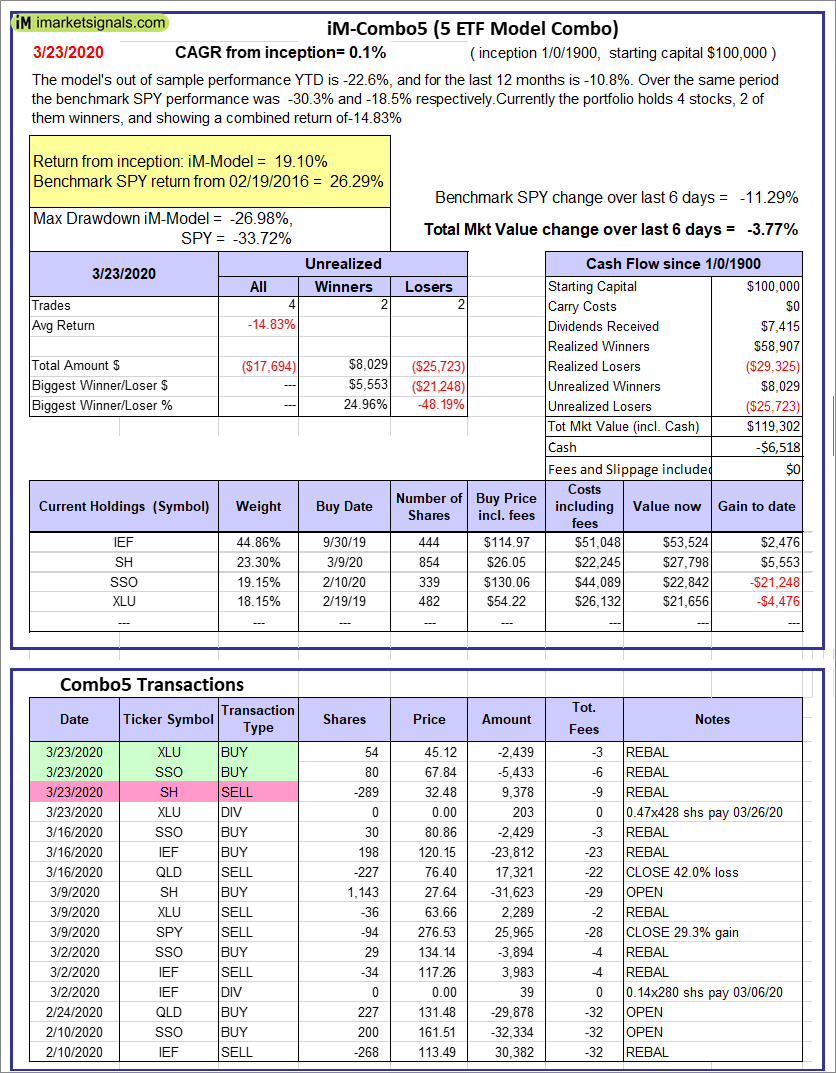 |
iM-Combo5: The model’s out of sample performance YTD is -22.6%, and for the last 12 months is -10.8%. Over the same period the benchmark SPY performance was -30.3% and -18.5% respectively. Over the previous week the market value of iM-Combo5 gained -3.77% at a time when SPY gained -11.29%. A starting capital of $100,000 at inception on 2/22/2016 would have grown to $119,302 which includes -$6,518 cash and excludes $0 spent on fees and slippage. |
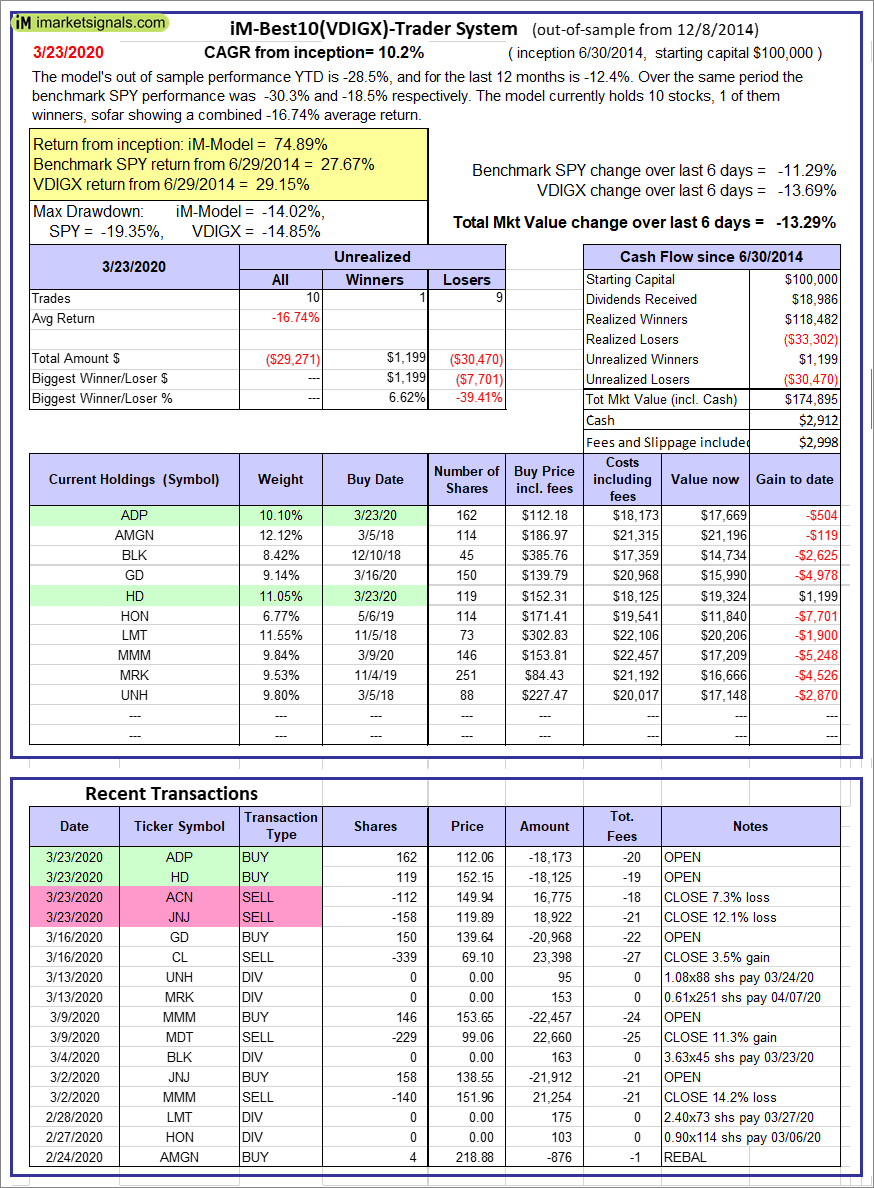 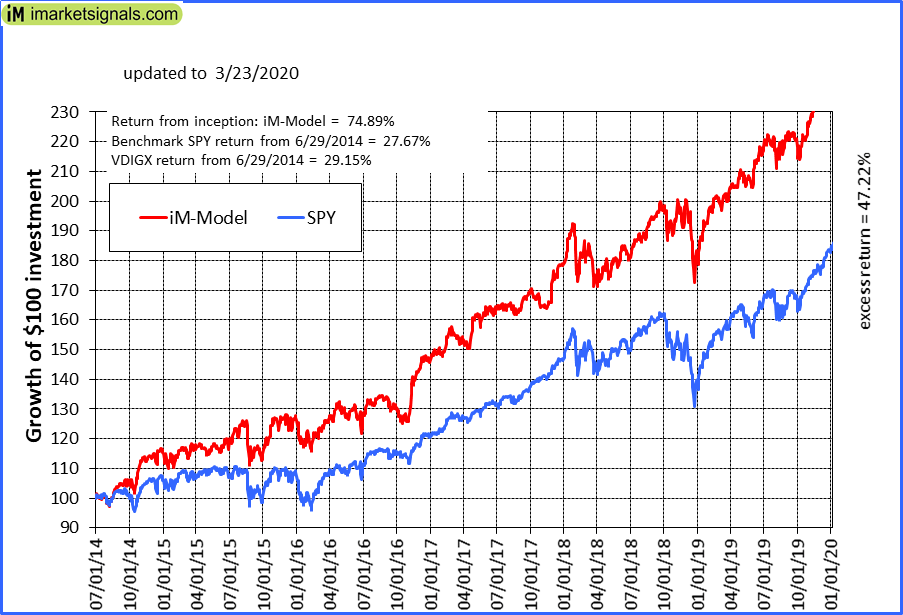 |
iM-Best10(VDIGX)-Trader: The model’s out of sample performance YTD is -28.5%, and for the last 12 months is -12.4%. Over the same period the benchmark SPY performance was -30.3% and -18.5% respectively. Since inception, on 7/1/2014, the model gained 74.89% while the benchmark SPY gained 27.67% and VDIGX gained 29.15% over the same period. Over the previous week the market value of iM-Best10(VDIGX) gained -13.29% at a time when SPY gained -11.29%. A starting capital of $100,000 at inception on 7/1/2014 would have grown to $174,895 which includes $2,912 cash and excludes $2,998 spent on fees and slippage. |
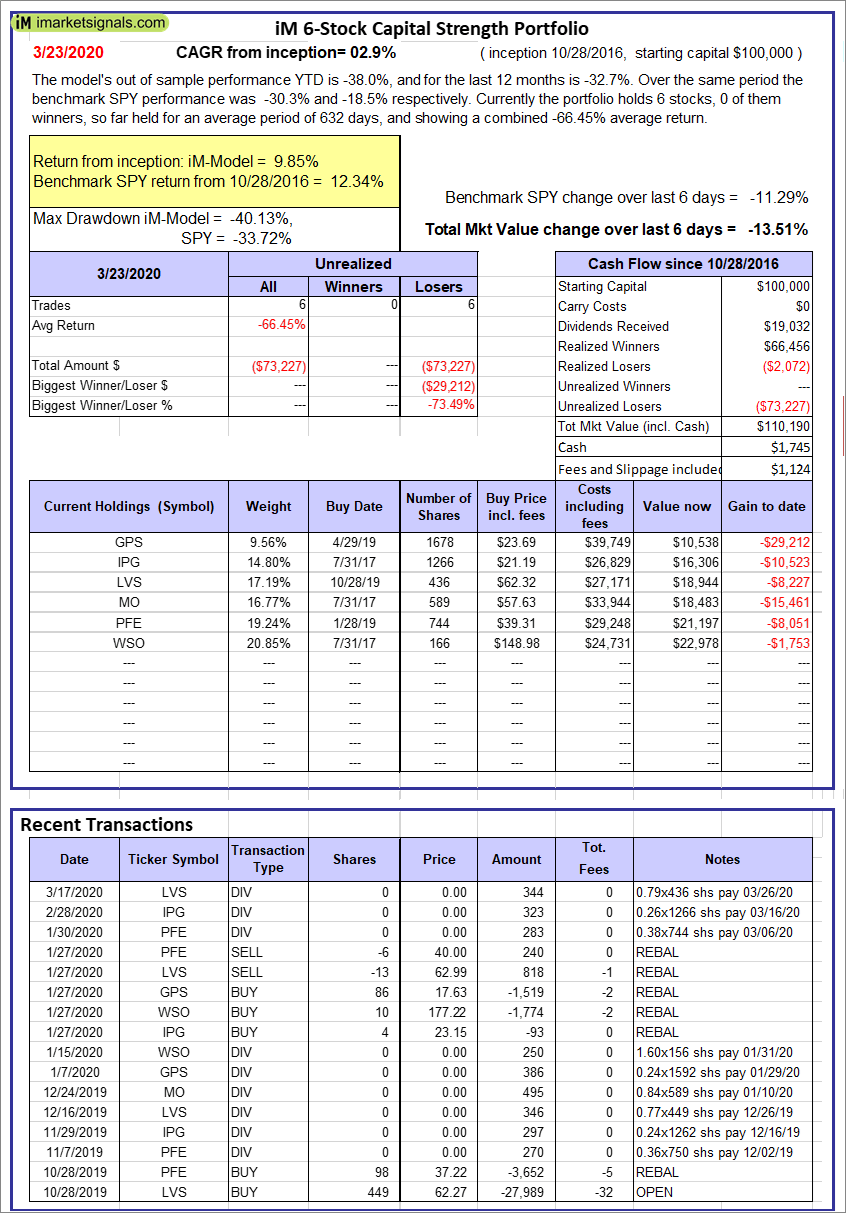 |
iM 6-Stock Capital Strength Portfolio: The model’s out of sample performance YTD is -38.0%, and for the last 12 months is -32.7%. Over the same period the benchmark SPY performance was -30.3% and -18.5% respectively. Over the previous week the market value of the iM 6-Stock Capital Strength Portfolio gained -13.51% at a time when SPY gained -11.29%. A starting capital of $100,000 at inception on 10/28/2016 would have grown to $110,190 which includes $1,745 cash and excludes $1,124 spent on fees and slippage. |
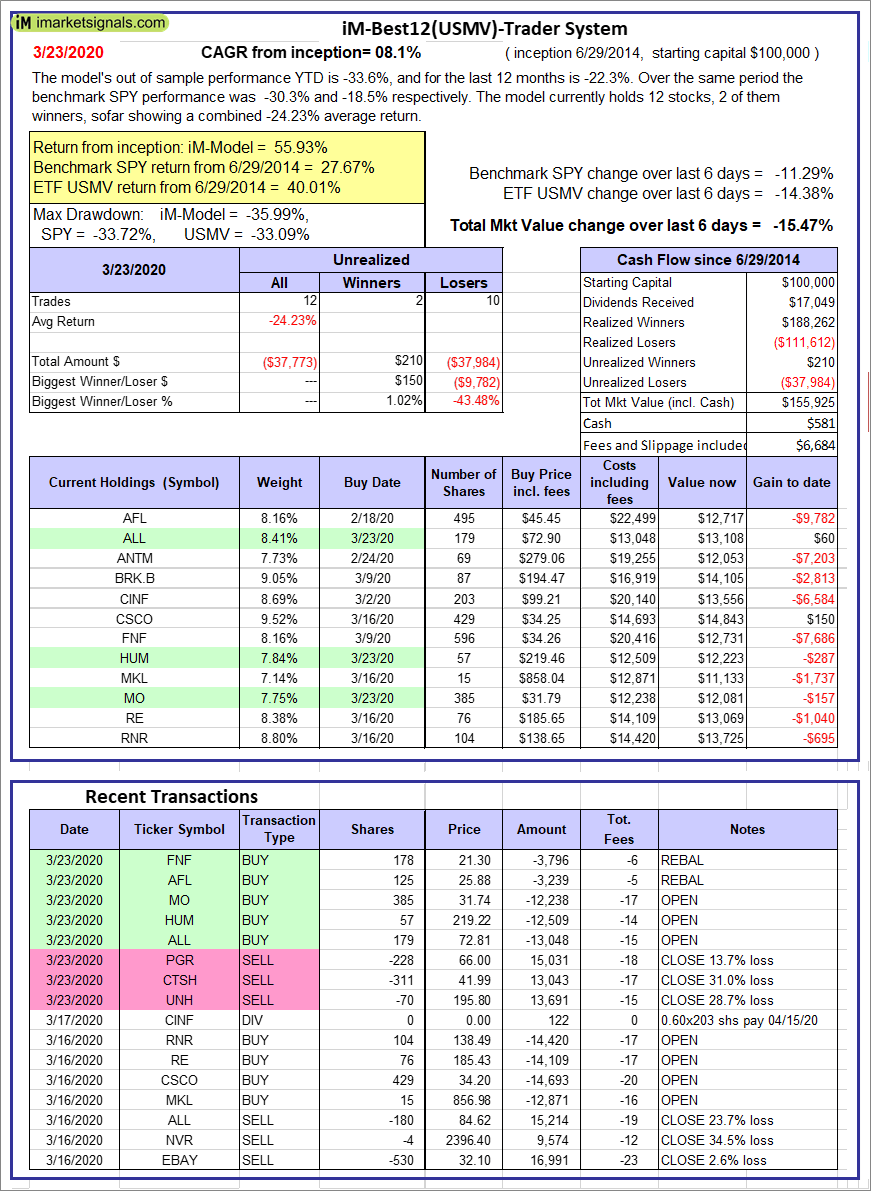 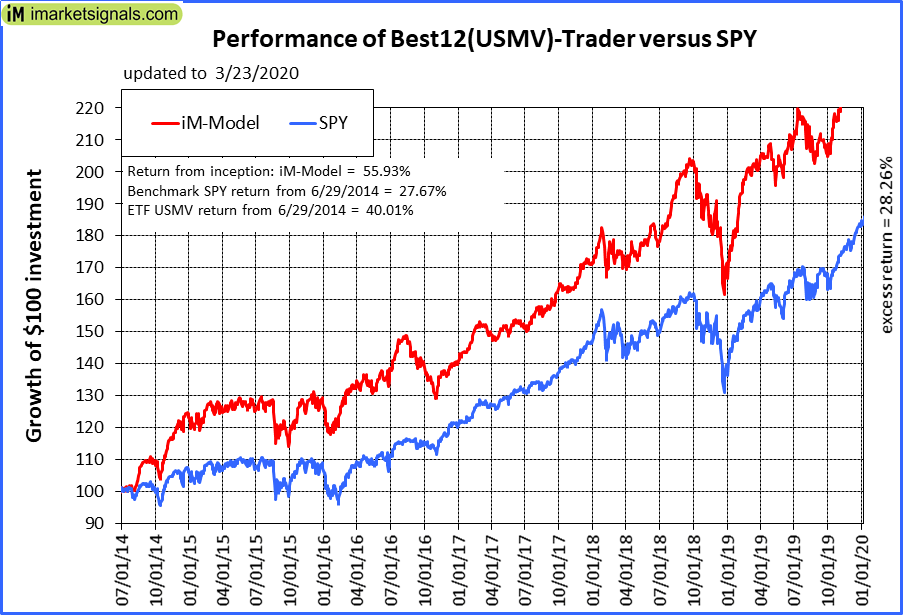 |
iM-Best12(USMV)-Trader: The model’s out of sample performance YTD is -33.6%, and for the last 12 months is -22.3%. Over the same period the benchmark SPY performance was -30.3% and -18.5% respectively. Since inception, on 6/30/2014, the model gained 55.93% while the benchmark SPY gained 27.67% and the ETF USMV gained 40.01% over the same period. Over the previous week the market value of iM-Best12(USMV)-Trader gained -15.47% at a time when SPY gained -11.29%. A starting capital of $100,000 at inception on 6/30/2014 would have grown to $155,925 which includes $581 cash and excludes $6,684 spent on fees and slippage. |
 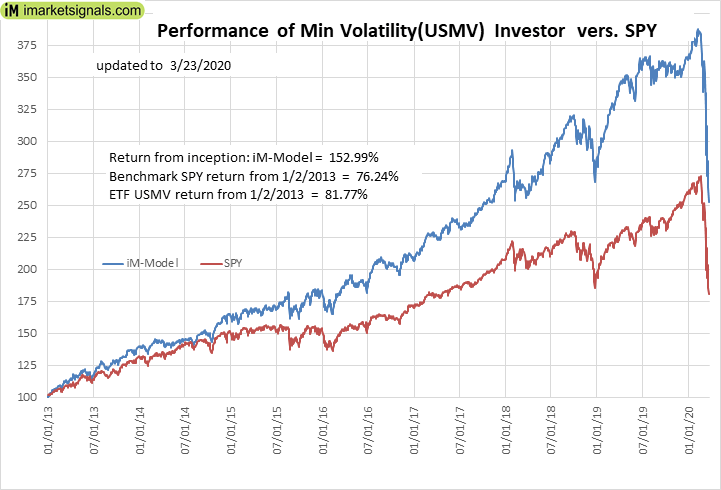 |
iM-Min Volatility(USMV) Investor (Tax Efficient): The model’s out of sample performance YTD is -30.5%, and for the last 12 months is -24.5%. Over the same period the benchmark SPY performance was -30.3% and -18.5% respectively. Since inception, on 1/3/2013, the model gained 152.99% while the benchmark SPY gained 76.24% and the ETF USMV gained 81.77% over the same period. Over the previous week the market value of iM-Best12(USMV)Q1 gained -11.11% at a time when SPY gained -11.29%. A starting capital of $100,000 at inception on 1/3/2013 would have grown to $252,986 which includes $10,666 cash and excludes $3,389 spent on fees and slippage. |
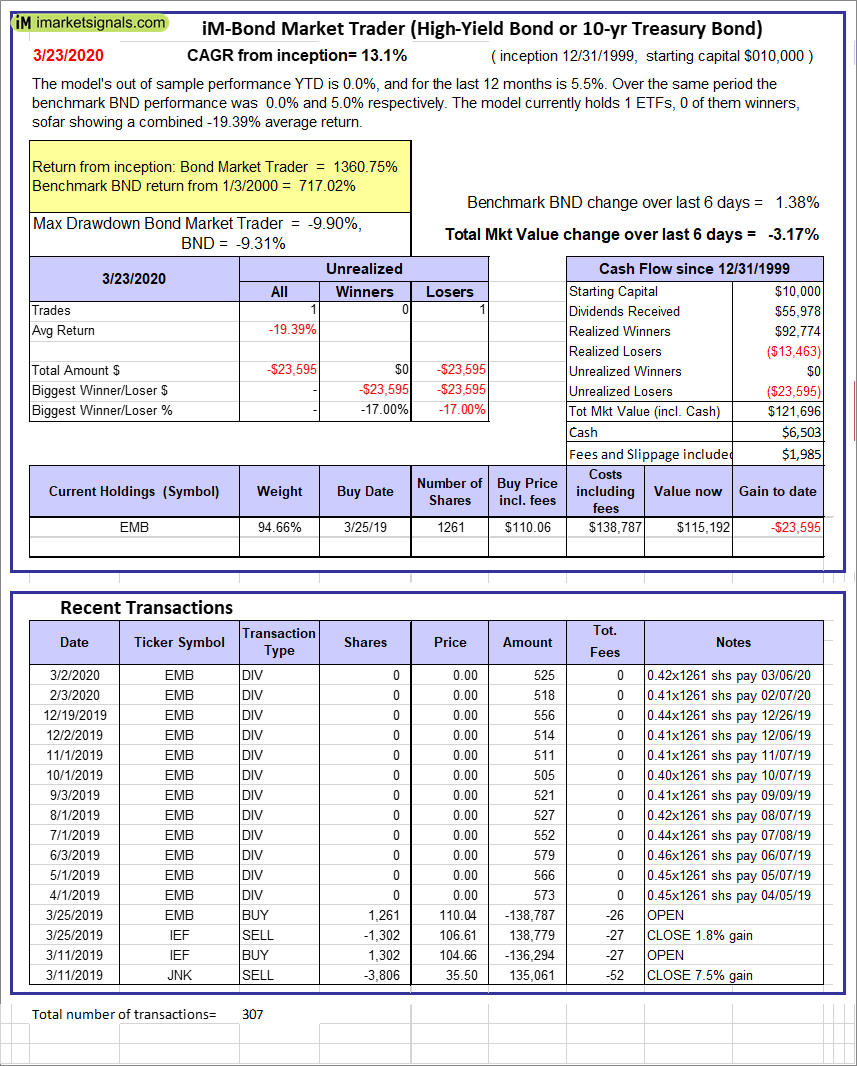 |
iM-Bond Market Trader (High-Yield Bond or 10-yr Treasury Bond): The model’s out of sample performance YTD is -27.0%, and for the last 12 months is -19.7%. Over the same period the benchmark SPY performance was -30.3% and -18.5% respectively. Over the previous week the market value of the iM-Bond Market Trader (High-Yield Bond or 10-yr Treasury Bond) gained -3.17% at a time when BND gained 1.38%. A starting capital of $100,000 at inception on 10/30/2016 would have grown to $121,696 which includes $6,503 cash and excludes $1,985 spent on fees and slippage. |
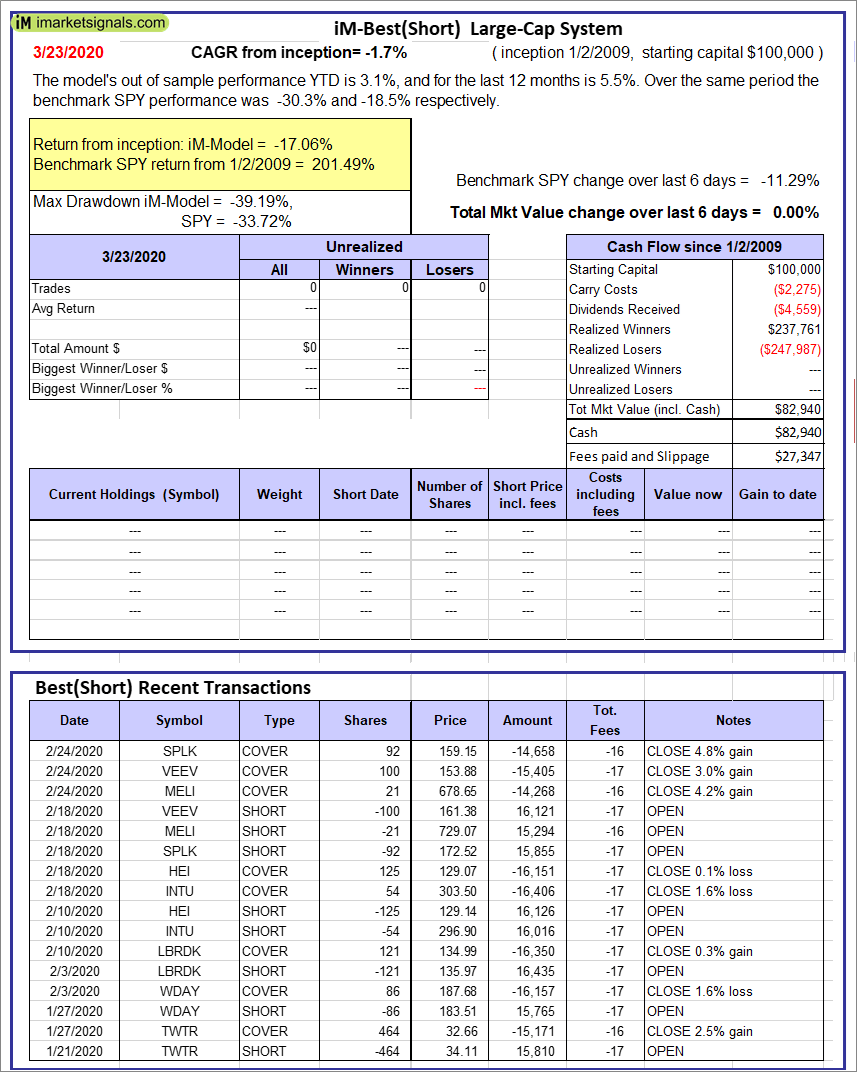 |
iM-Best(Short): The model’s out of sample performance YTD is 3.1%, and for the last 12 months is 5.5%. Over the same period the benchmark SPY performance was -30.3% and -18.5% respectively. Over the previous week the market value of iM-Best(Short) gained 0.00% at a time when SPY gained -11.29%. Over the period 1/2/2009 to 3/23/2020 the starting capital of $100,000 would have grown to $82,940 which includes $82,940 cash and excludes $27,347 spent on fees and slippage. |
 |
iM-Best2 MC-Score ETF System: The model’s out of sample performance YTD is -25.6%, and for the last 12 months is -16.6%. Over the same period the benchmark SPY performance was -30.3% and -18.5% respectively. Over the previous week the market value of the iM-Best2 MC-Score ETF System gained -14.44% at a time when SPY gained -11.29%. A starting capital of $100,000 at inception on 6/30/2016 would have grown to $93,536 which includes $337 cash and excludes $683 spent on fees and slippage. |
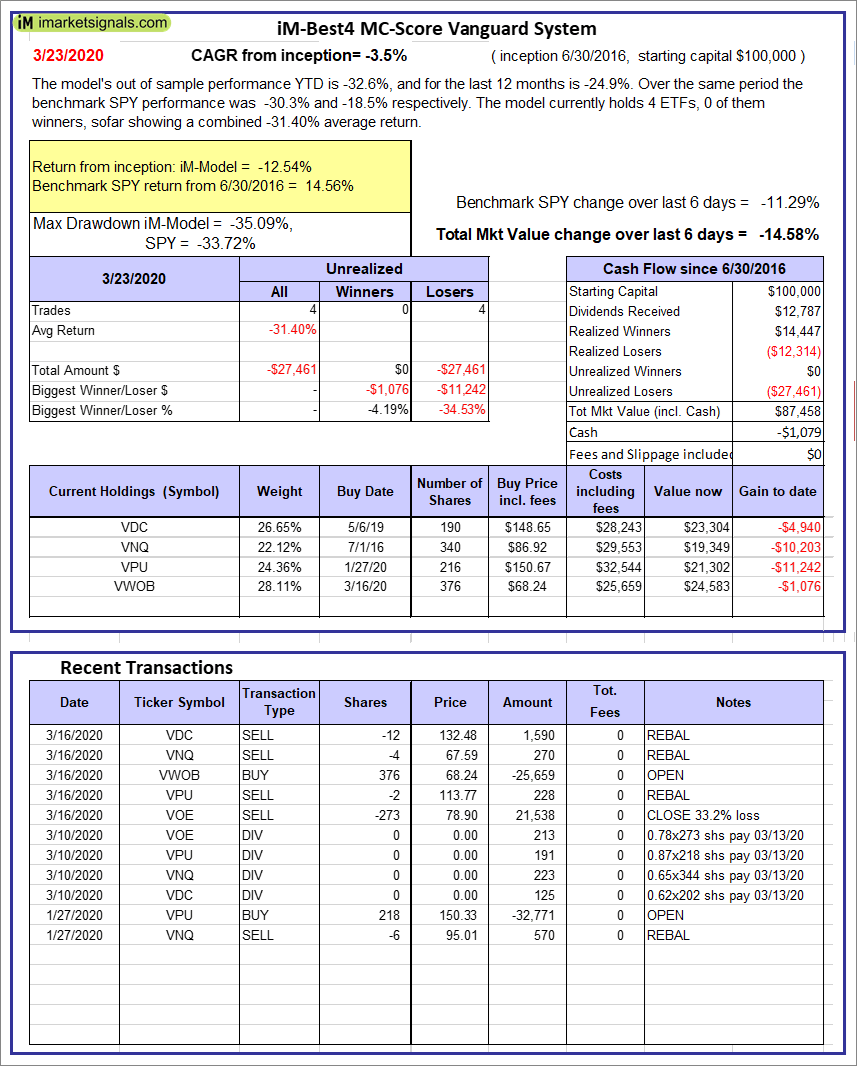 |
iM-Best4 MC-Score Vanguard System: The model’s out of sample performance YTD is -32.6%, and for the last 12 months is -24.9%. Over the same period the benchmark SPY performance was -30.3% and -18.5% respectively. Over the previous week the market value of the iM-Best4 MC-Score Vanguard System gained -14.58% at a time when SPY gained -11.29%. A starting capital of $100,000 at inception on 6/30/2016 would have grown to $87,458 which includes -$1,079 cash and excludes $00 spent on fees and slippage. |
 |
iM-Composite (SH-RSP) Timer: The model’s out of sample performance YTD is -35.7%, and for the last 12 months is -27.0%. Over the same period the benchmark SPY performance was -30.3% and -18.5% respectively. Over the previous week the market value of the iM-Composite (SH-RSP) Timer gained -13.09% at a time when SPY gained -11.29%. A starting capital of $100,000 at inception on 6/30/2016 would have grown to $98,562 which includes $7,912 cash and excludes $513 spent on fees and slippage. |
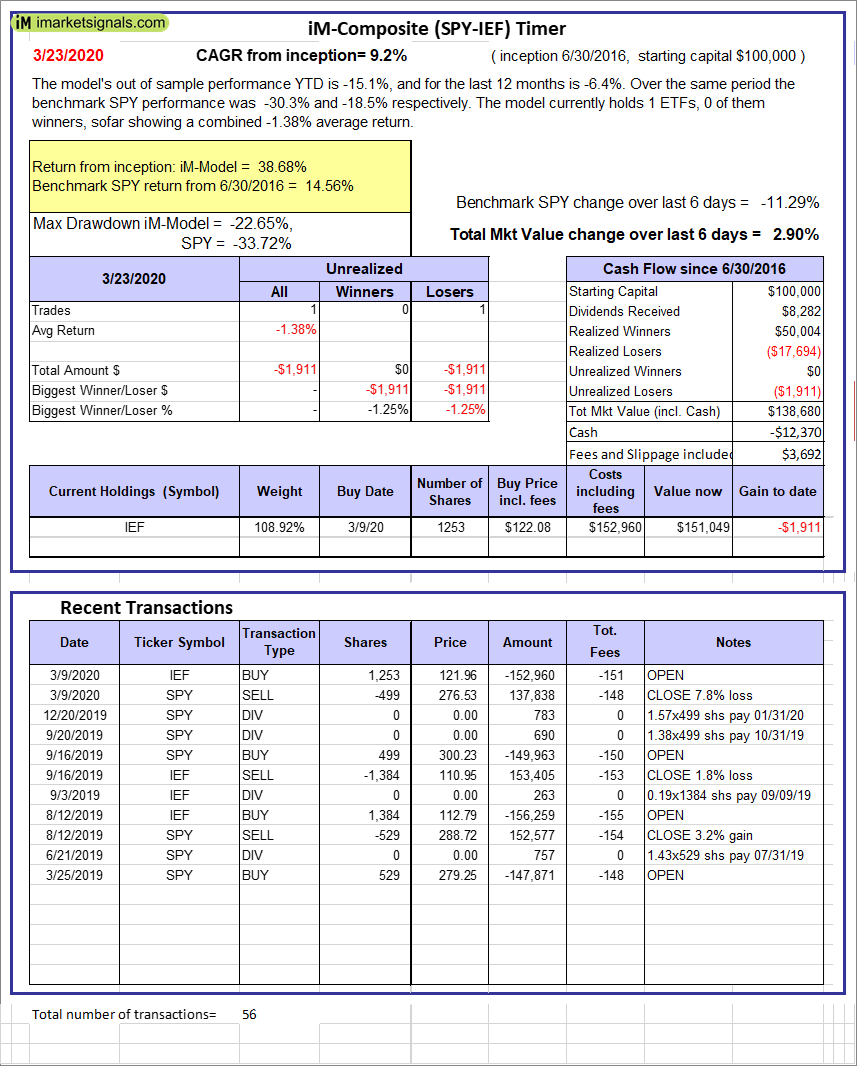 |
iM-Composite (SPY-IEF) Timer: The model’s out of sample performance YTD is -15.1%, and for the last 12 months is -6.4%. Over the same period the benchmark SPY performance was -30.3% and -18.5% respectively. Over the previous week the market value of the iM-Composite (SPY-IEF) Timer gained 2.90% at a time when SPY gained -11.29%. A starting capital of $100,000 at inception on 6/30/2016 would have grown to $138,680 which includes -$12,370 cash and excludes $3,692 spent on fees and slippage. |
 |
iM-VIX Timer with ZIV: The model’s out of sample performance YTD is -52.6%, and for the last 12 months is -54.2%. Over the same period the benchmark SPY performance was -30.3% and -18.5% respectively. Over the previous week the market value of the iM-VIX Timer with ZIV gained -13.31% at a time when SPY gained -11.29%. A starting capital of $100,000 at inception on 6/30/2016 would have grown to $88,158 which includes $4,836 cash and excludes $8,577 spent on fees and slippage. |
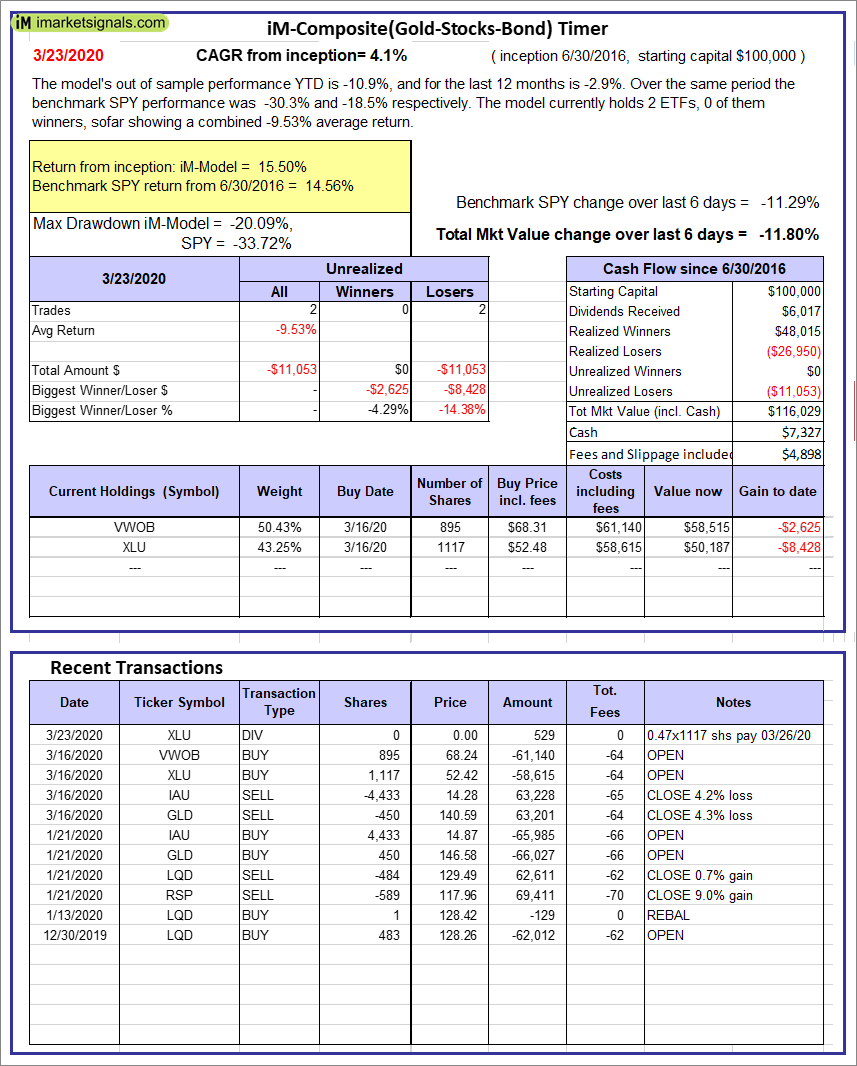 |
iM-Composite(Gold-Stocks-Bond) Timer: The model’s out of sample performance YTD is -10.9%, and for the last 12 months is -2.9%. Over the same period the benchmark SPY performance was -30.3% and -18.5% respectively. Over the previous week the market value of the iM-Composite(Gold-Stocks-Bond) Timer gained -11.80% at a time when SPY gained -11.29%. A starting capital of $100,000 at inception on 6/30/2016 would have grown to $116,029 which includes $7,327 cash and excludes $4,898 spent on fees and slippage. |
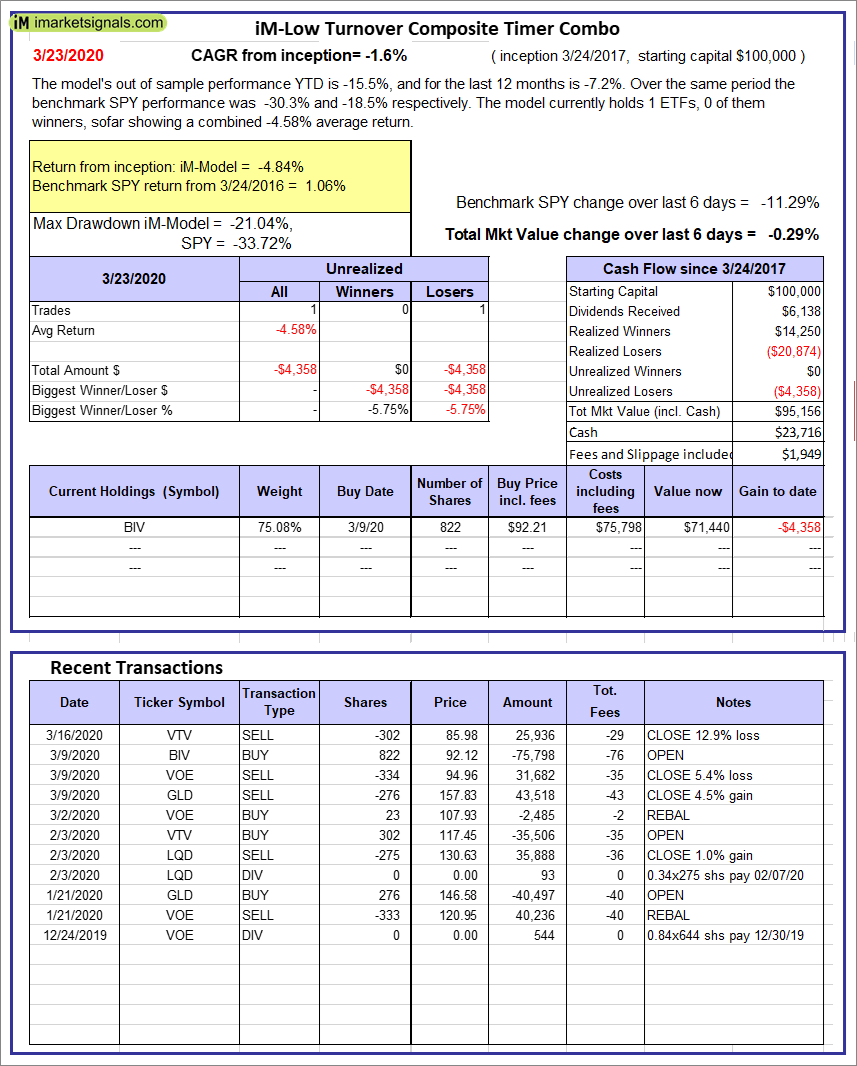 |
iM-Low Turnover Composite Timer Combo: The model’s out of sample performance YTD is -15.5%, and for the last 12 months is -7.2%. Over the same period the benchmark SPY performance was -30.3% and -18.5% respectively. Over the previous week the market value of the iM-Low Turnover Composite Timer Combo gained -0.29% at a time when SPY gained -11.29%. A starting capital of $100,000 at inception on 3/24/27 would have grown to $95,156 which includes $23,716 cash and excludes $1,949 spent on fees and slippage. |
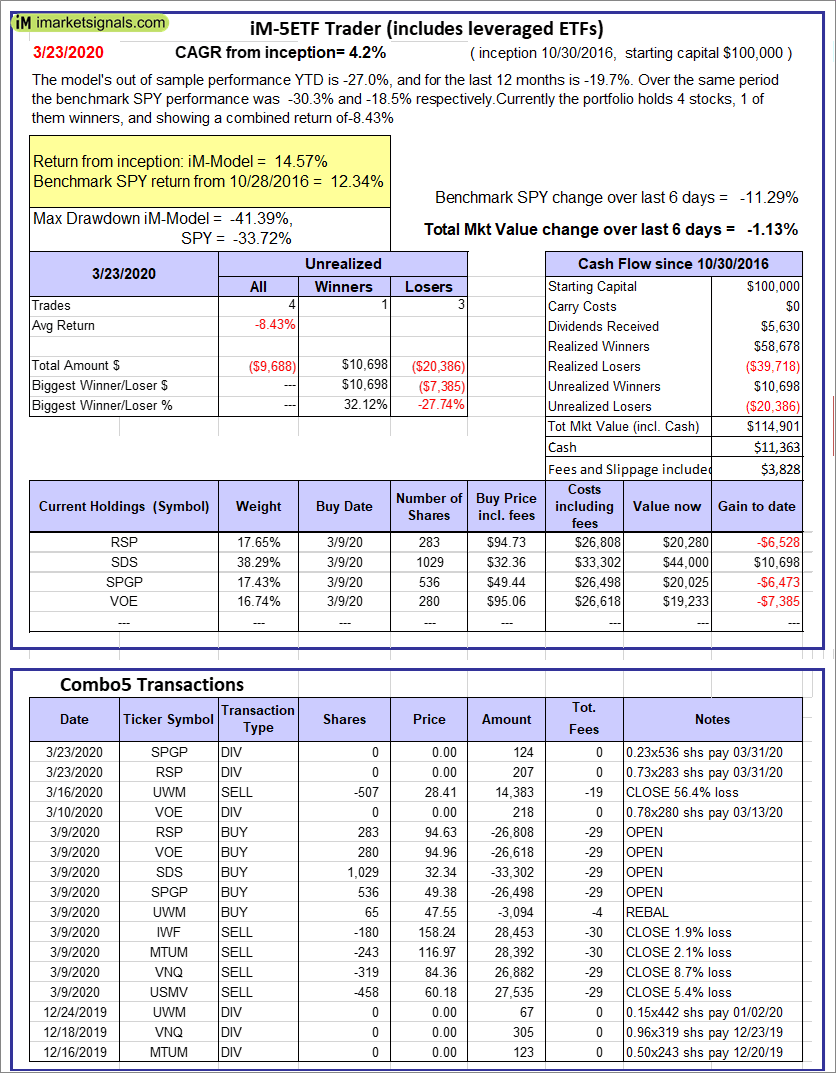 |
iM-5ETF Trader (includes leveraged ETFs): The model’s out of sample performance YTD is -27.0%, and for the last 12 months is -19.7%. Over the same period the benchmark SPY performance was -30.3% and -18.5% respectively. Over the previous week the market value of the iM-5ETF Trader (includes leveraged ETFs) gained -1.13% at a time when SPY gained -11.29%. A starting capital of $100,000 at inception on 10/30/2016 would have grown to $114,901 which includes $11,363 cash and excludes $3,828 spent on fees and slippage. |
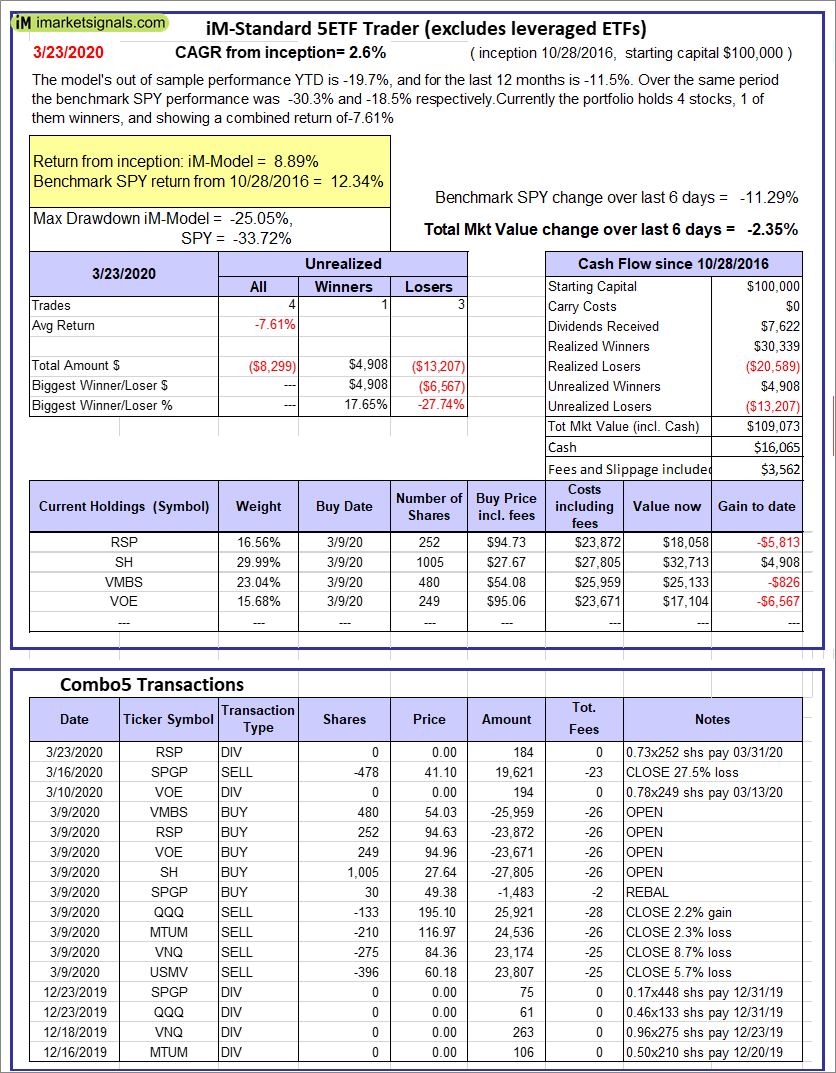 |
iM-Standard 5ETF Trader (excludes leveraged ETFs): The model’s out of sample performance YTD is -19.7%, and for the last 12 months is -11.5%. Over the same period the benchmark SPY performance was -30.3% and -18.5% respectively. Over the previous week the market value of the iM-Standard 5ETF Trader (excludes leveraged ETFs) gained -2.35% at a time when SPY gained -11.29%. A starting capital of $100,000 at inception on 10/30/2016 would have grown to $109,073 which includes $16,065 cash and excludes $3,562 spent on fees and slippage. |
iM-Best Reports – 3/23/2020
Posted in pmp SPY-SH
Leave a Reply
You must be logged in to post a comment.