
  |
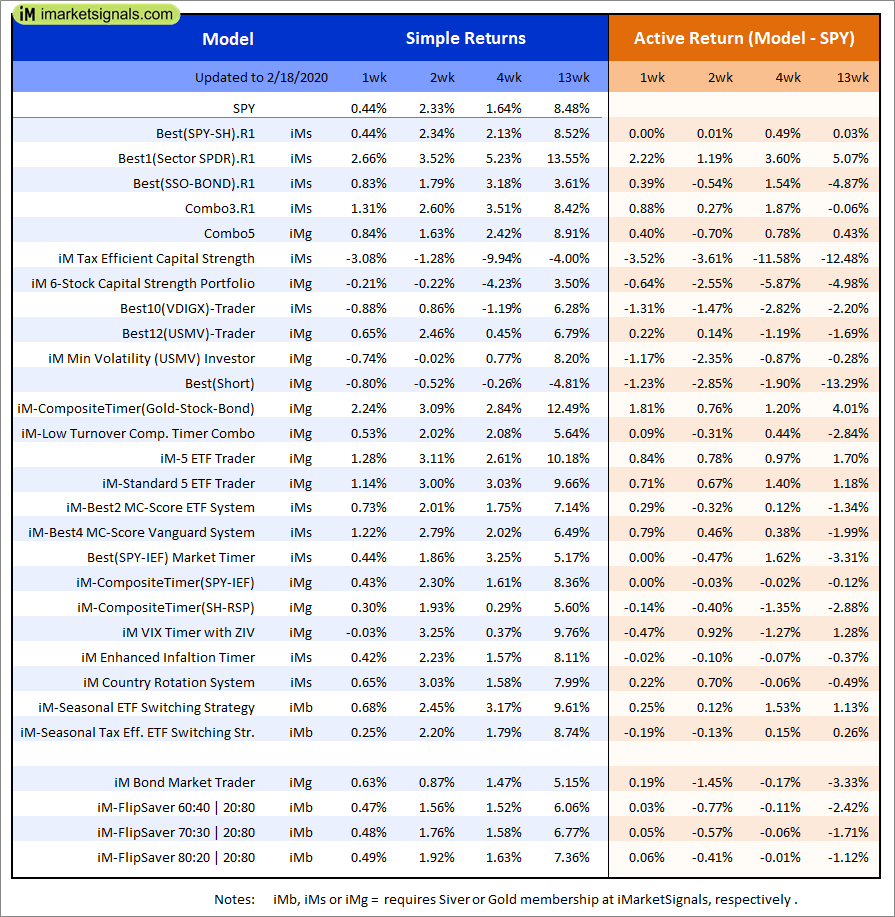
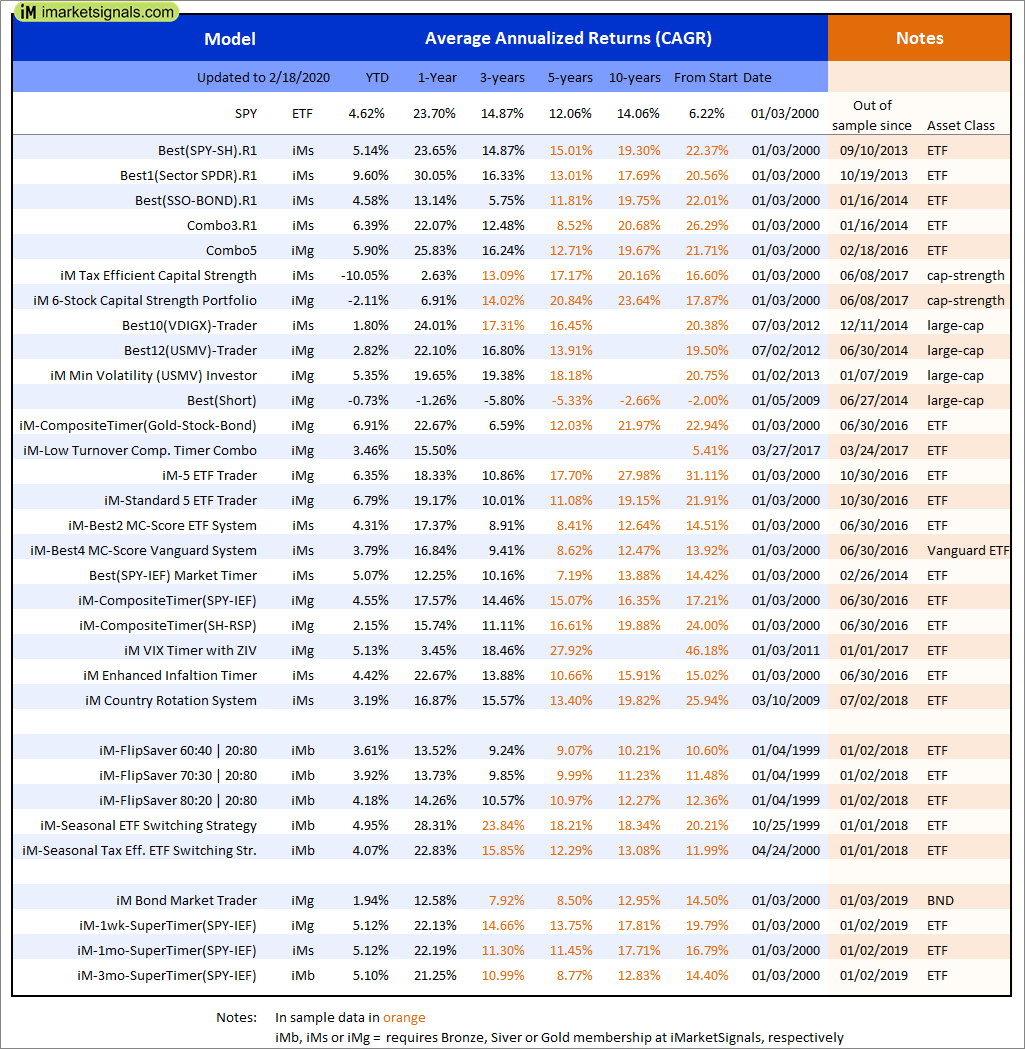
Out of sample performance summary of our models for the past 1, 2, 4 and 13 week periods. The active active return indicates how the models over- or underperformed the benchmark ETF SPY. Also the YTD, and the 1-, 3-, 5- and 10-year annualized returns are shown in the second table |
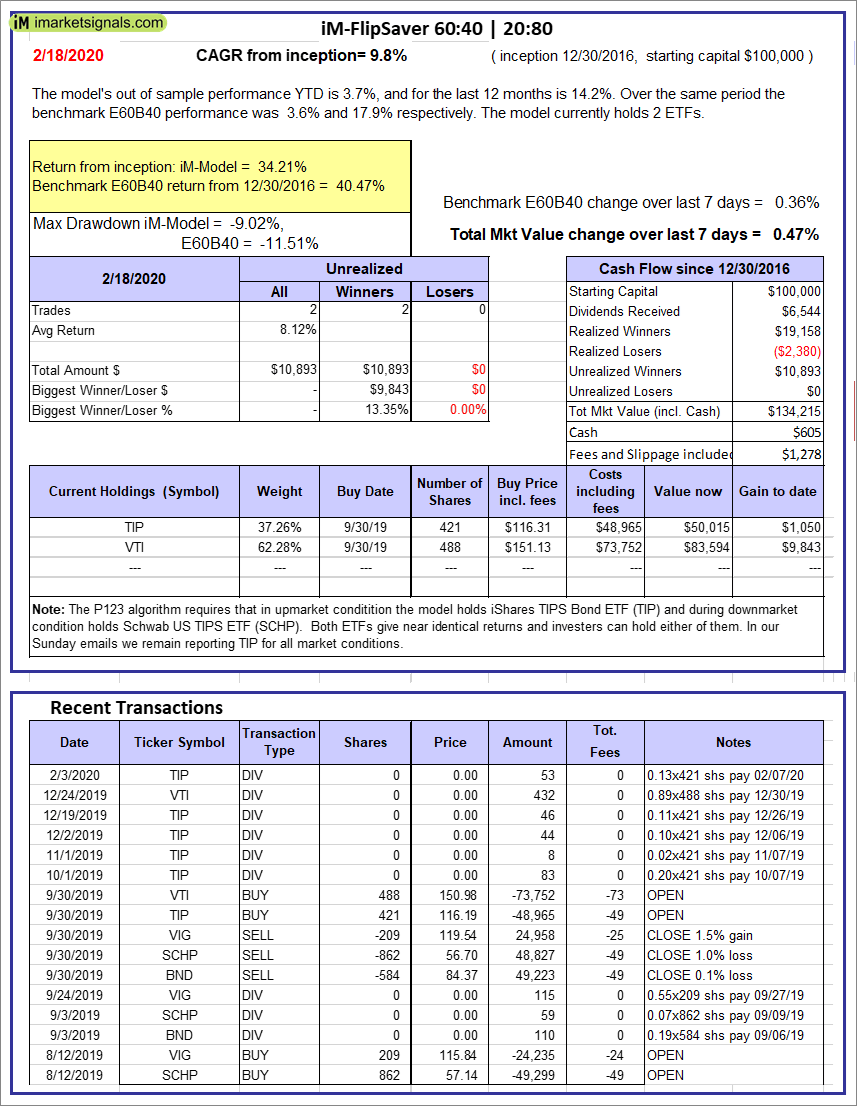 |
iM-FlipSaver 60:40 | 20:80 – 2017: The model’s out of sample performance YTD is 3.7%, and for the last 12 months is 14.2%. Over the same period the benchmark E60B40 performance was 3.6% and 17.9% respectively. Over the previous week the market value of iM-FlipSaver 80:20 | 20:80 gained 0.47% at a time when SPY gained 0.36%. A starting capital of $100,000 at inception on 7/16/2015 would have grown to $134,215 which includes $605 cash and excludes $1,278 spent on fees and slippage. |
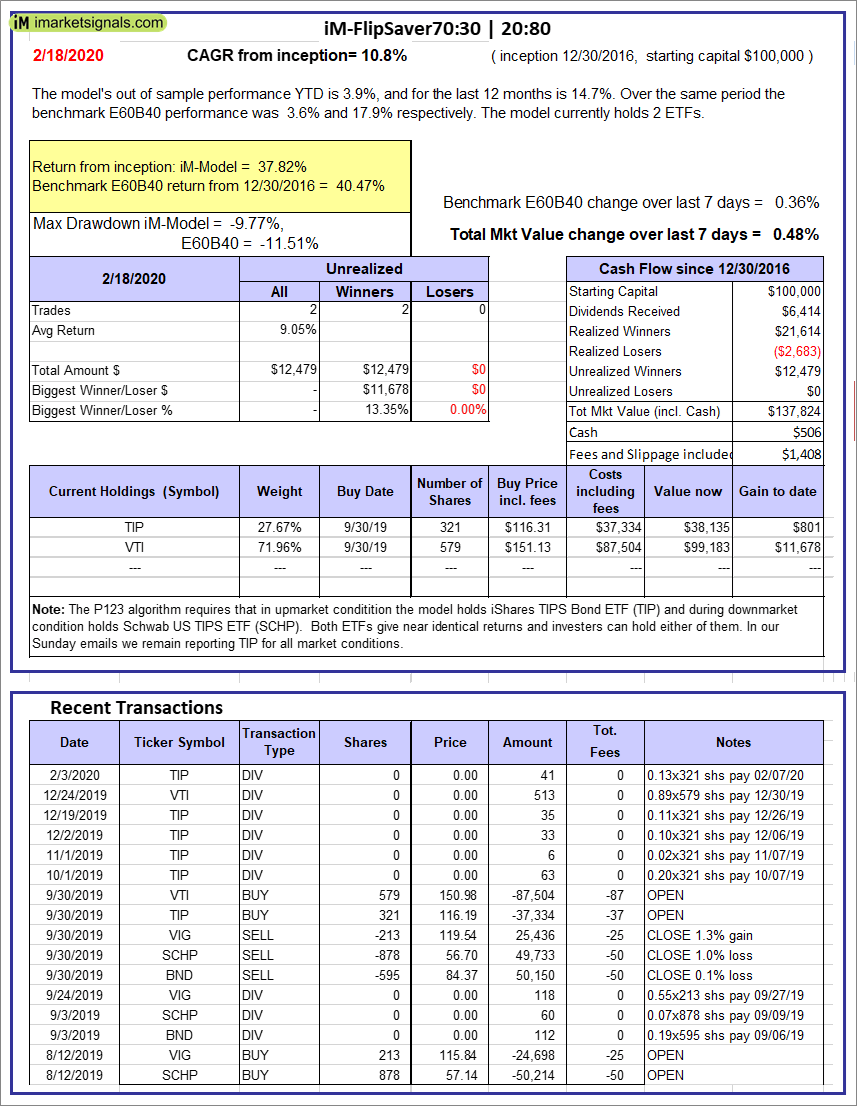 |
iM-FlipSaver 70:30 | 20:80 – 2017: The model’s out of sample performance YTD is 3.9%, and for the last 12 months is 14.7%. Over the same period the benchmark E60B40 performance was 3.6% and 17.9% respectively. Over the previous week the market value of iM-FlipSaver 70:30 | 20:80 gained 0.48% at a time when SPY gained 0.36%. A starting capital of $100,000 at inception on 7/15/2015 would have grown to $137,824 which includes $506 cash and excludes $1,408 spent on fees and slippage. |
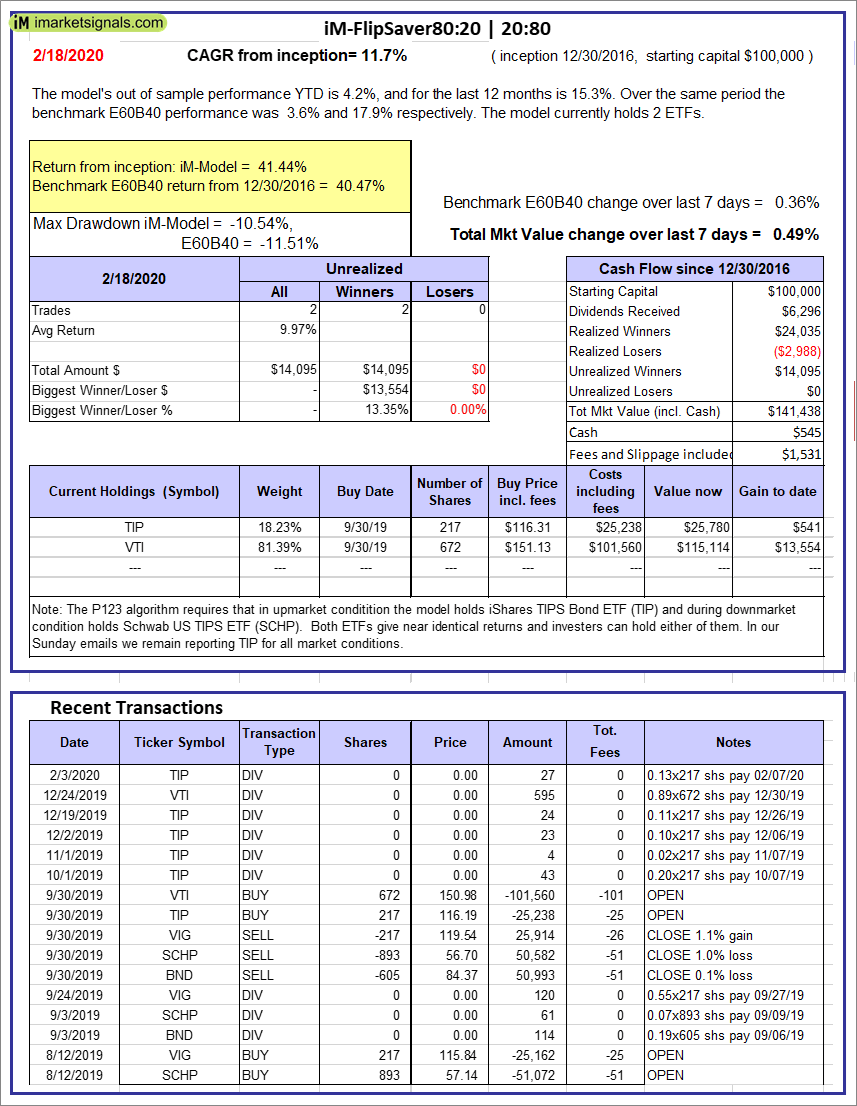 |
iM-FlipSaver 80:20 | 20:80 – 2017: The model’s out of sample performance YTD is 4.2%, and for the last 12 months is 15.3%. Over the same period the benchmark E60B40 performance was 3.6% and 17.9% respectively. Over the previous week the market value of iM-FlipSaver 80:20 | 20:80 gained 0.49% at a time when SPY gained 0.36%. A starting capital of $100,000 at inception on 1/2/2017 would have grown to $141,438 which includes $545 cash and excludes $1,531 spent on fees and slippage. |
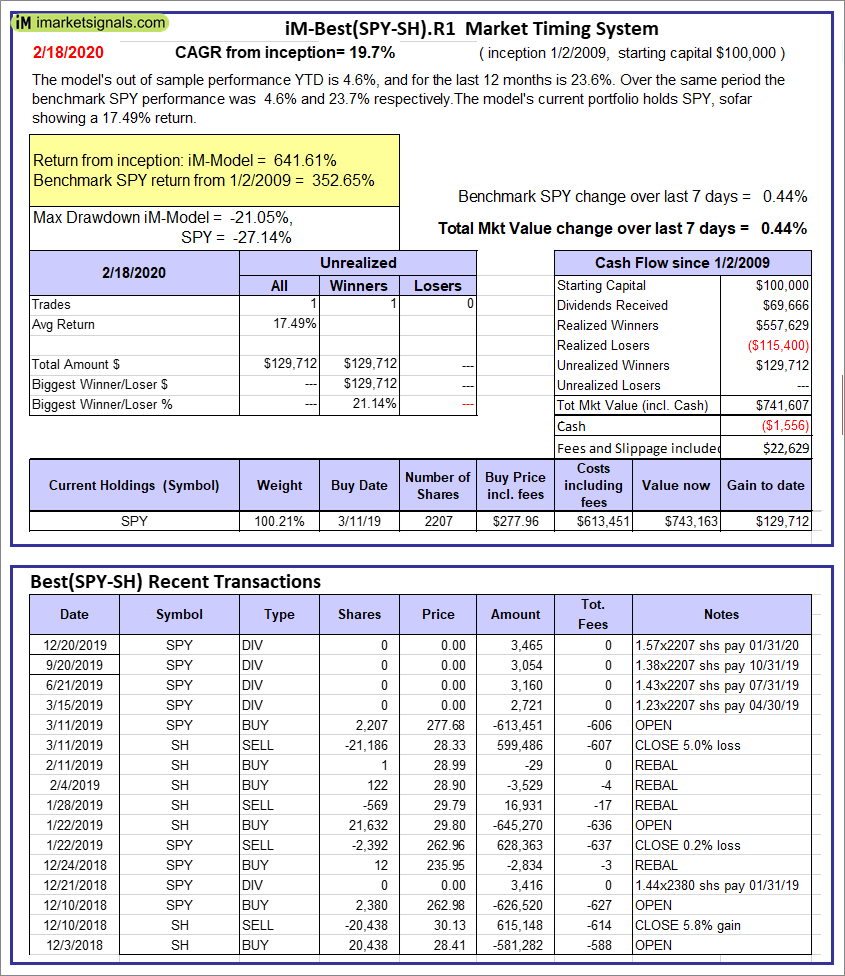 |
iM-Best(SPY-SH).R1: The model’s out of sample performance YTD is 4.6%, and for the last 12 months is 23.6%. Over the same period the benchmark SPY performance was 4.6% and 23.7% respectively. Over the previous week the market value of Best(SPY-SH) gained 0.44% at a time when SPY gained 0.44%. A starting capital of $100,000 at inception on 1/2/2009 would have grown to $741,607 which includes -$1,556 cash and excludes $22,629 spent on fees and slippage. |
 |
iM-Combo3.R1: The model’s out of sample performance YTD is 6.2%, and for the last 12 months is 22.1%. Over the same period the benchmark SPY performance was 4.6% and 23.7% respectively. Over the previous week the market value of iM-Combo3.R1 gained 1.31% at a time when SPY gained 0.44%. A starting capital of $100,000 at inception on 2/3/2014 would have grown to $188,083 which includes $1,110 cash and excludes $5,641 spent on fees and slippage. |
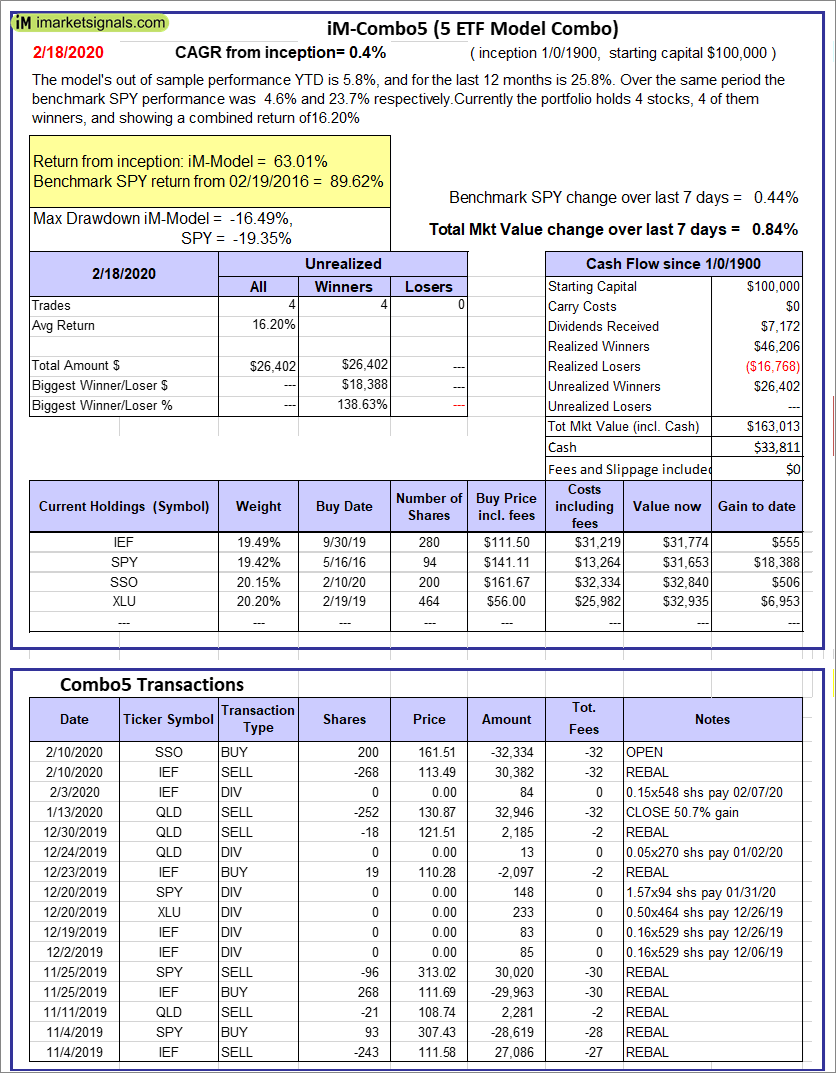 |
iM-Combo5: The model’s out of sample performance YTD is 5.8%, and for the last 12 months is 25.8%. Over the same period the benchmark SPY performance was 4.6% and 23.7% respectively. Over the previous week the market value of iM-Combo5 gained 0.84% at a time when SPY gained 0.44%. A starting capital of $100,000 at inception on 2/22/2016 would have grown to $163,013 which includes $33,811 cash and excludes $0 spent on fees and slippage. |
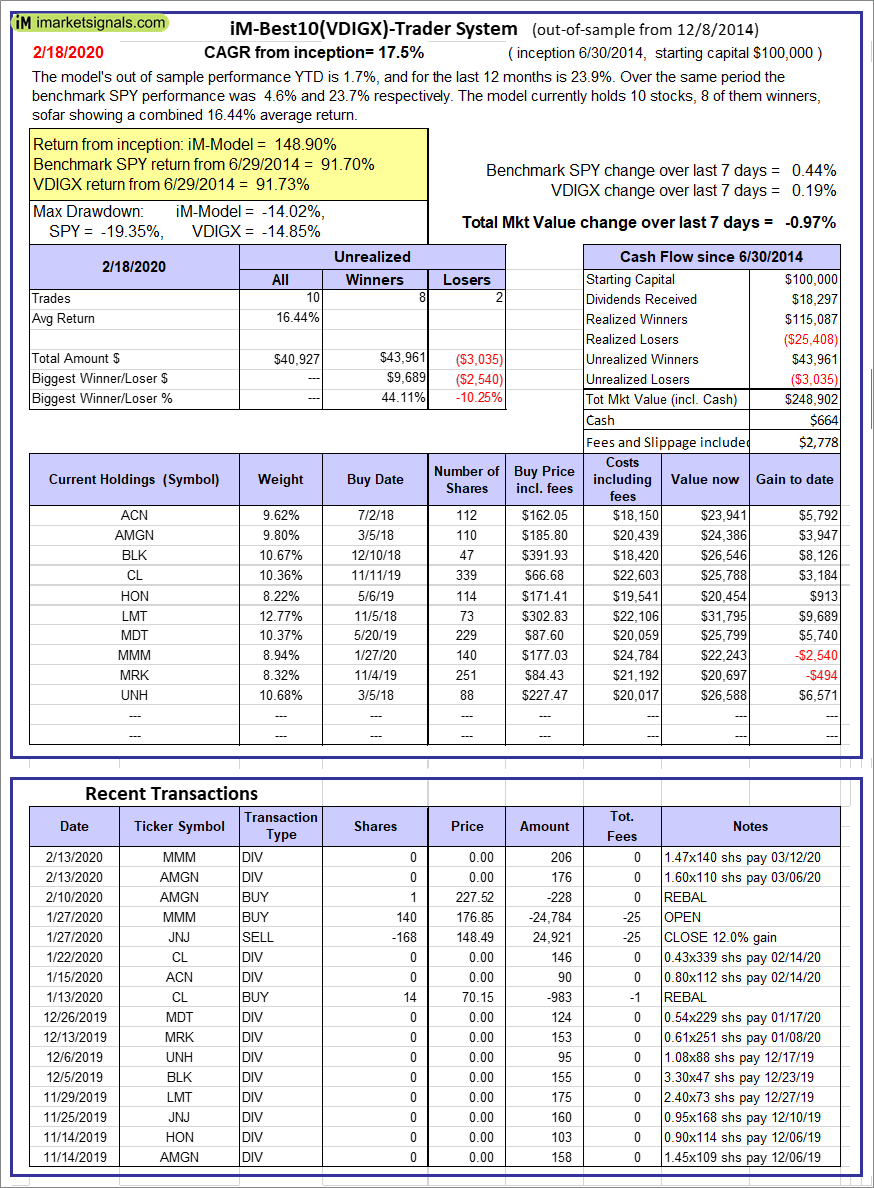 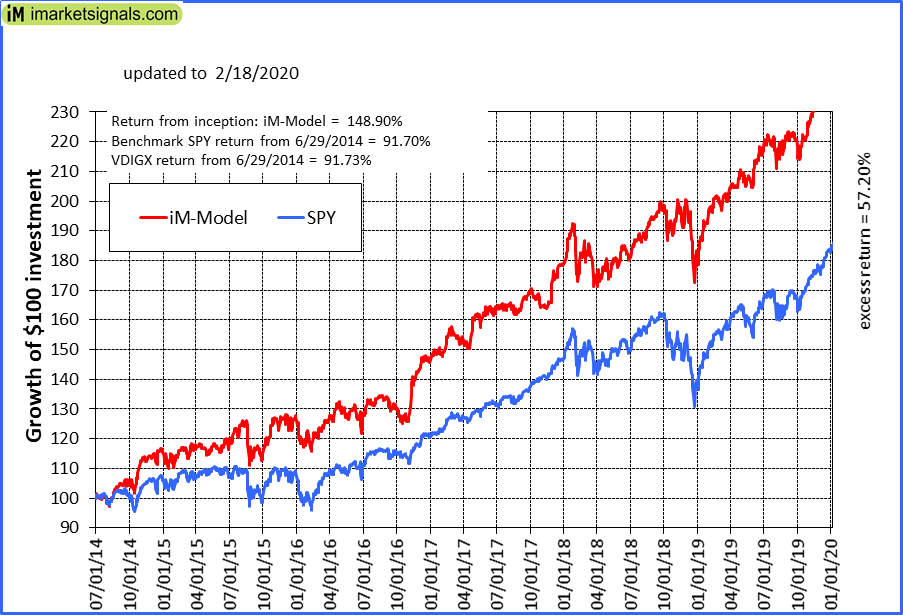 |
iM-Best10(VDIGX)-Trader: The model’s out of sample performance YTD is 1.7%, and for the last 12 months is 23.9%. Over the same period the benchmark SPY performance was 4.6% and 23.7% respectively. Since inception, on 7/1/2014, the model gained 148.90% while the benchmark SPY gained 91.70% and VDIGX gained 91.73% over the same period. Over the previous week the market value of iM-Best10(VDIGX) gained -0.97% at a time when SPY gained 0.44%. A starting capital of $100,000 at inception on 7/1/2014 would have grown to $248,902 which includes $664 cash and excludes $2,778 spent on fees and slippage. |
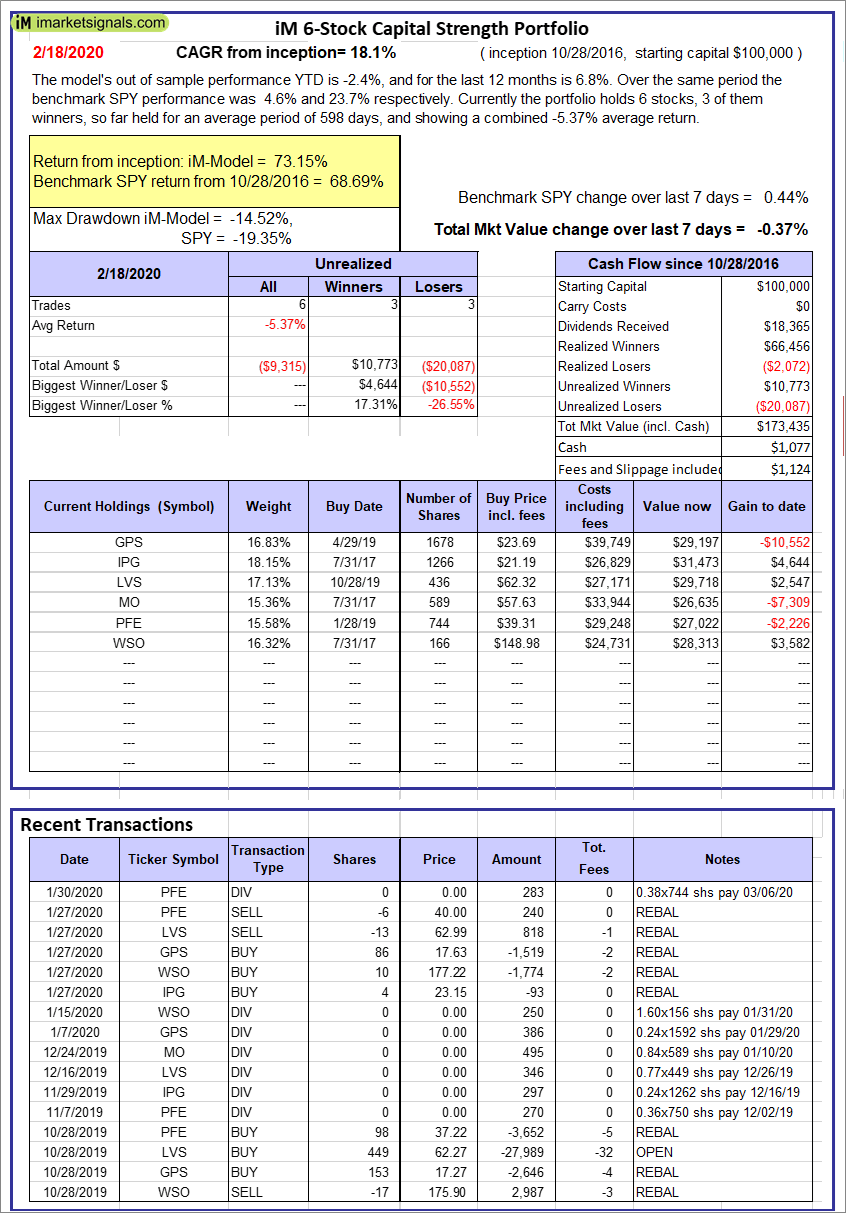 |
iM 6-Stock Capital Strength Portfolio: The model’s out of sample performance YTD is -2.4%, and for the last 12 months is 6.8%. Over the same period the benchmark SPY performance was 4.6% and 23.7% respectively. Over the previous week the market value of the iM 6-Stock Capital Strength Portfolio gained -0.37% at a time when SPY gained 0.44%. A starting capital of $100,000 at inception on 10/28/2016 would have grown to $173,435 which includes $1,077 cash and excludes $1,124 spent on fees and slippage. |
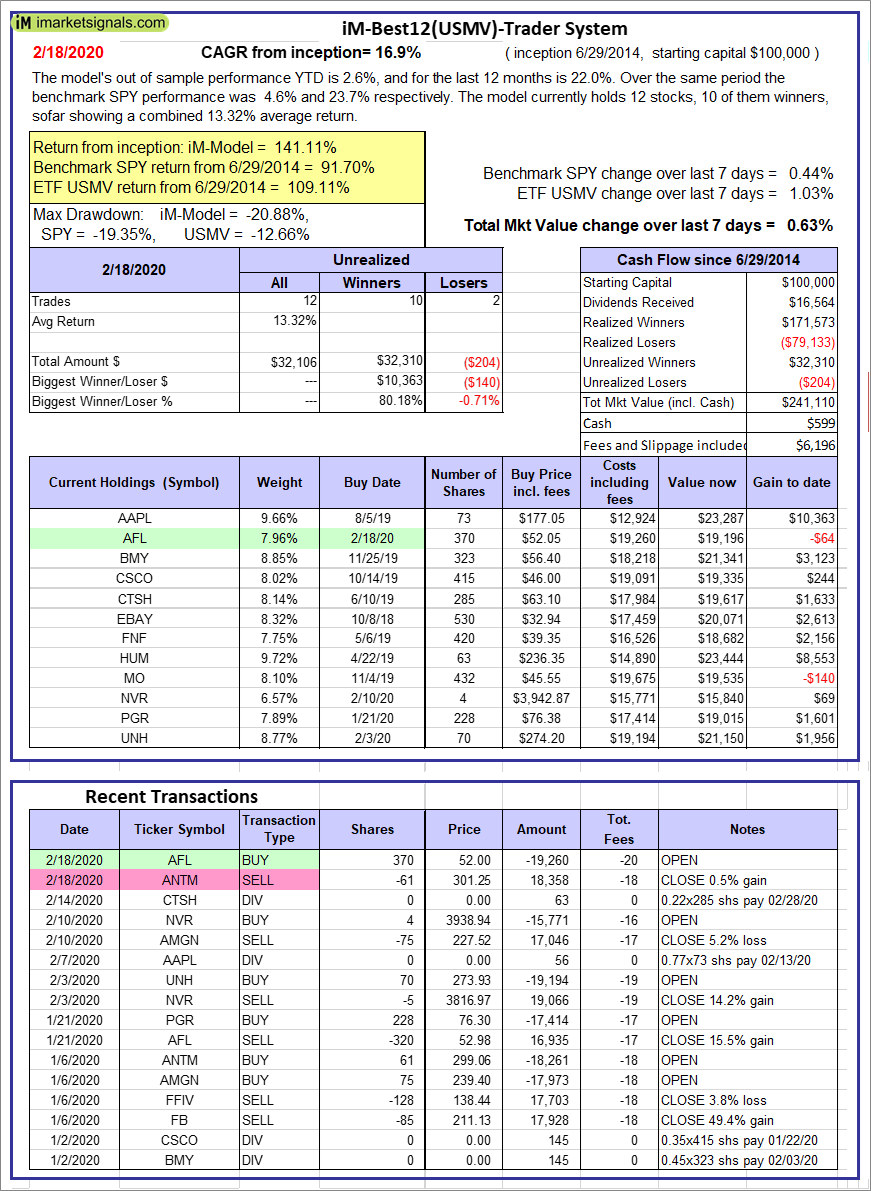 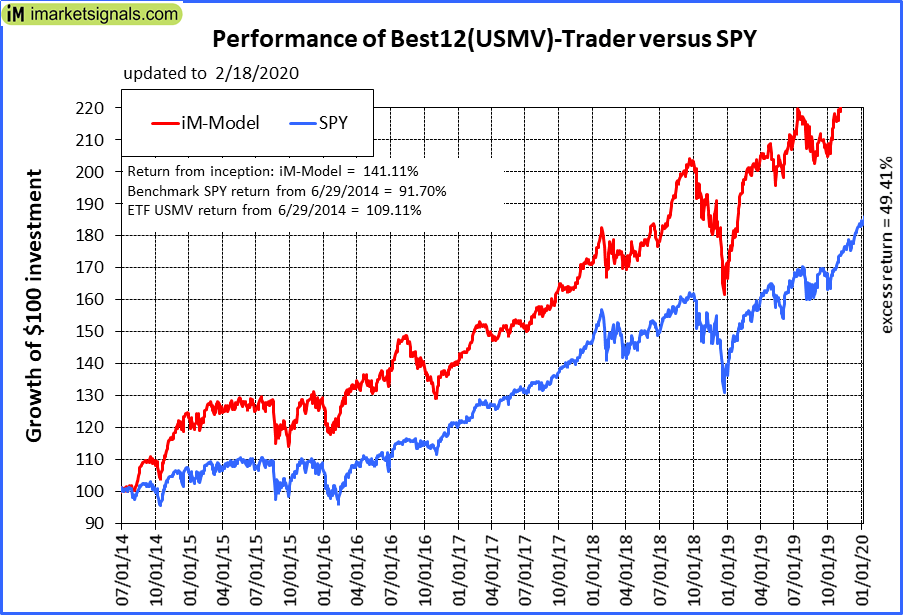 |
iM-Best12(USMV)-Trader: The model’s out of sample performance YTD is 2.6%, and for the last 12 months is 22.0%. Over the same period the benchmark SPY performance was 4.6% and 23.7% respectively. Since inception, on 6/30/2014, the model gained 141.11% while the benchmark SPY gained 91.70% and the ETF USMV gained 109.11% over the same period. Over the previous week the market value of iM-Best12(USMV)-Trader gained 0.63% at a time when SPY gained 0.44%. A starting capital of $100,000 at inception on 6/30/2014 would have grown to $241,110 which includes $599 cash and excludes $6,196 spent on fees and slippage. |
 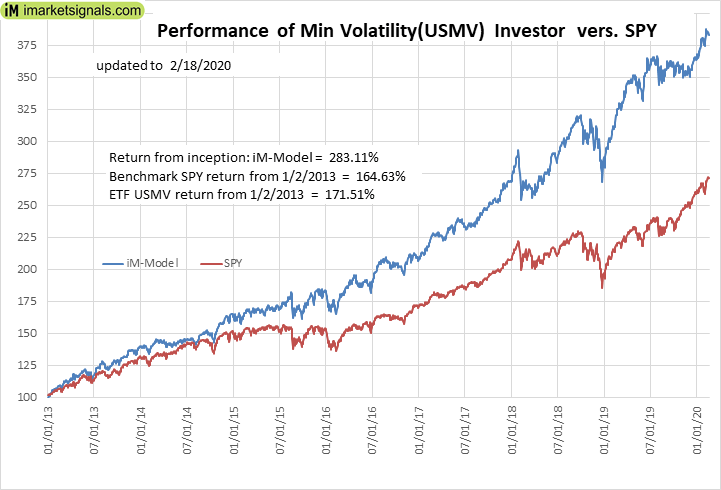 |
iM-Min Volatility(USMV) Investor (Tax Efficient): The model’s out of sample performance YTD is 5.2%, and for the last 12 months is 19.5%. Over the same period the benchmark SPY performance was 4.6% and 23.7% respectively. Since inception, on 1/3/2013, the model gained 283.11% while the benchmark SPY gained 164.63% and the ETF USMV gained 171.51% over the same period. Over the previous week the market value of iM-Best12(USMV)Q1 gained -0.74% at a time when SPY gained 0.44%. A starting capital of $100,000 at inception on 1/3/2013 would have grown to $383,108 which includes $5,283 cash and excludes $2,399 spent on fees and slippage. |
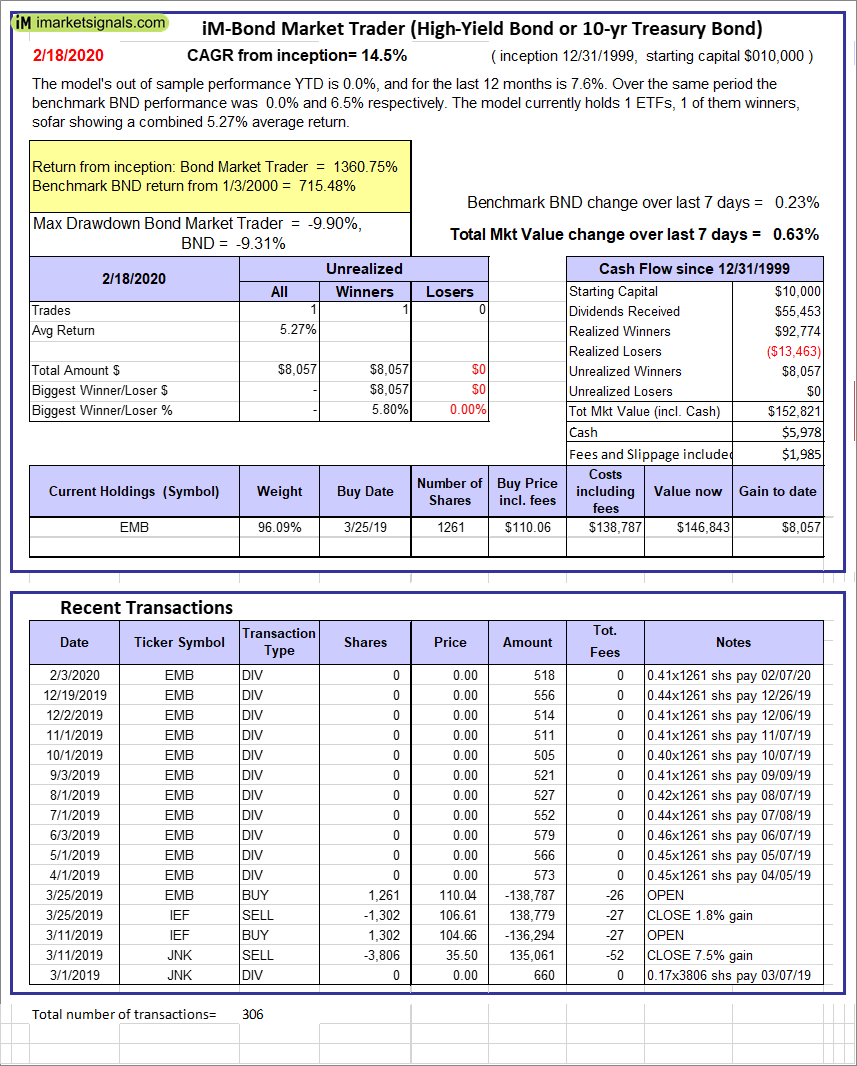 |
iM-Bond Market Trader (High-Yield Bond or 10-yr Treasury Bond): The model’s out of sample performance YTD is 6.3%, and for the last 12 months is 18.0%. Over the same period the benchmark SPY performance was 4.6% and 23.7% respectively. Over the previous week the market value of the iM-Bond Market Trader (High-Yield Bond or 10-yr Treasury Bond) gained 0.63% at a time when BND gained 0.23%. A starting capital of $100,000 at inception on 10/30/2016 would have grown to $152,821 which includes $5,978 cash and excludes $1,985 spent on fees and slippage. |
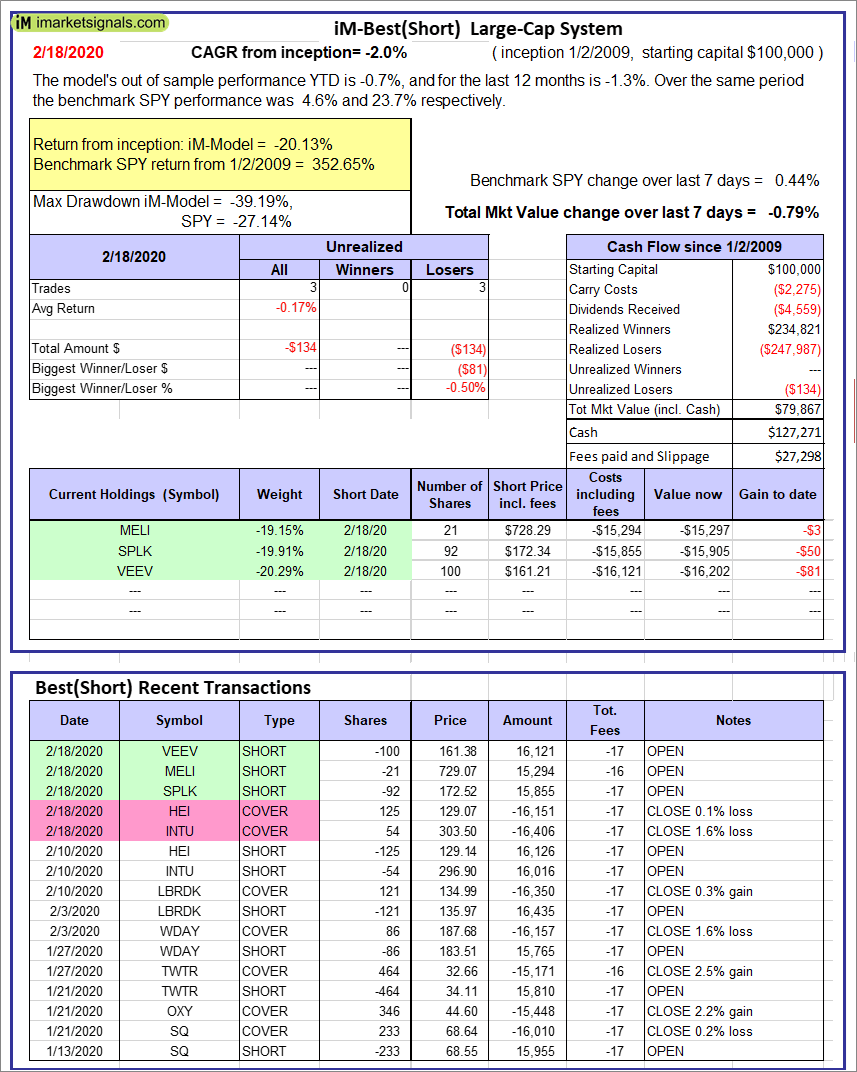 |
iM-Best(Short): The model’s out of sample performance YTD is -0.7%, and for the last 12 months is -1.3%. Over the same period the benchmark SPY performance was 4.6% and 23.7% respectively. Over the previous week the market value of iM-Best(Short) gained -0.79% at a time when SPY gained 0.44%. Over the period 1/2/2009 to 2/18/2020 the starting capital of $100,000 would have grown to $79,867 which includes $127,271 cash and excludes $27,298 spent on fees and slippage. |
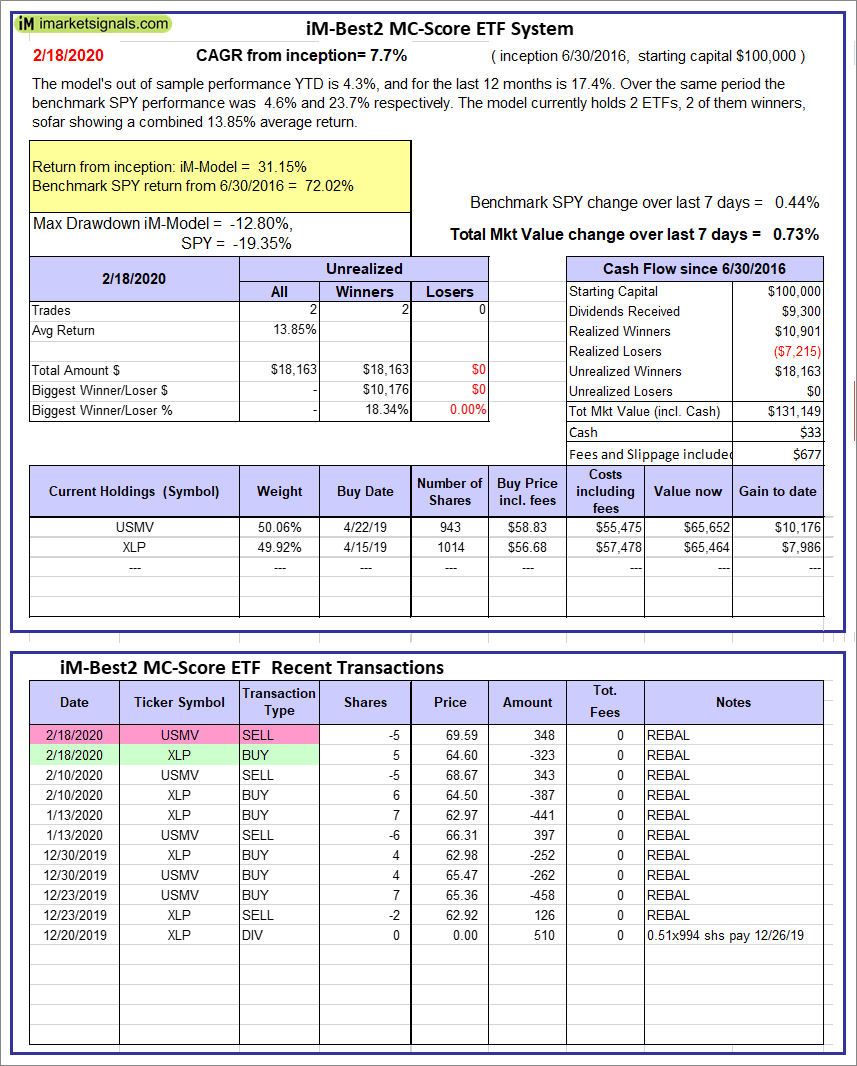 |
iM-Best2 MC-Score ETF System: The model’s out of sample performance YTD is 4.3%, and for the last 12 months is 17.4%. Over the same period the benchmark SPY performance was 4.6% and 23.7% respectively. Over the previous week the market value of the iM-Best2 MC-Score ETF System gained 0.73% at a time when SPY gained 0.44%. A starting capital of $100,000 at inception on 6/30/2016 would have grown to $131,149 which includes $33 cash and excludes $677 spent on fees and slippage. |
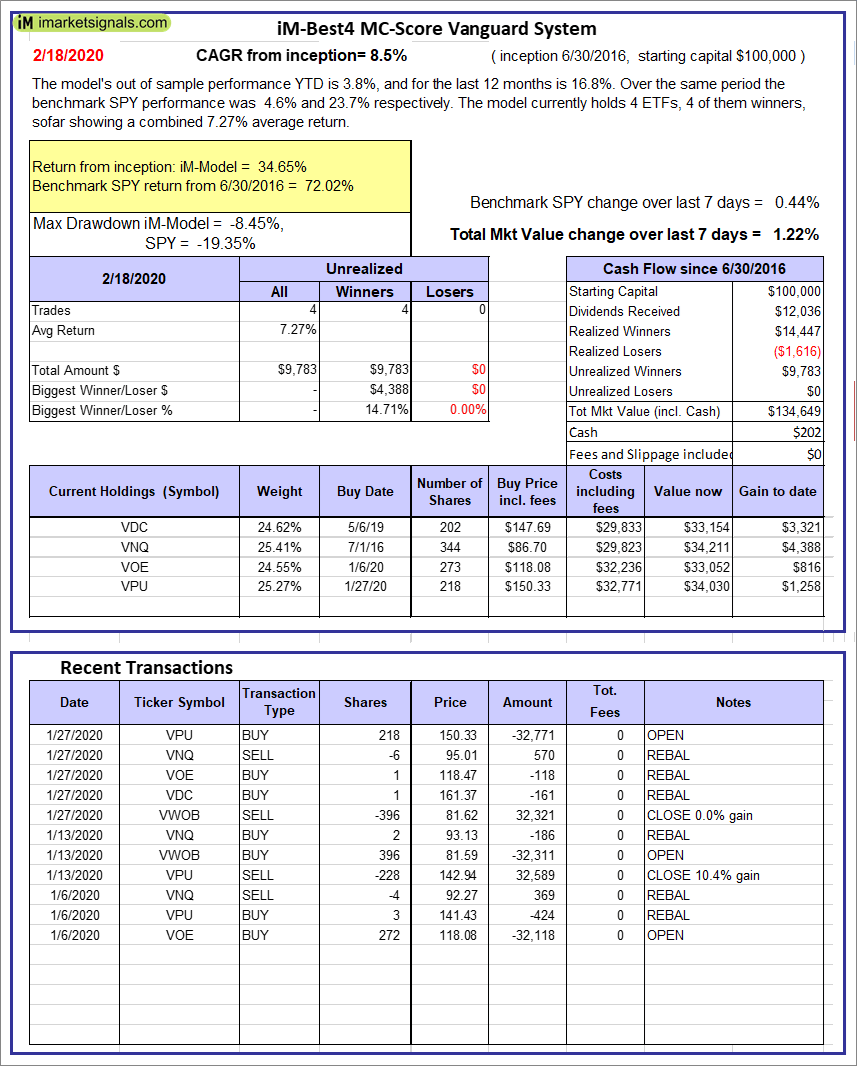 |
iM-Best4 MC-Score Vanguard System: The model’s out of sample performance YTD is 3.8%, and for the last 12 months is 16.8%. Over the same period the benchmark SPY performance was 4.6% and 23.7% respectively. Over the previous week the market value of the iM-Best4 MC-Score Vanguard System gained 1.22% at a time when SPY gained 0.44%. A starting capital of $100,000 at inception on 6/30/2016 would have grown to $134,649 which includes $202 cash and excludes $00 spent on fees and slippage. |
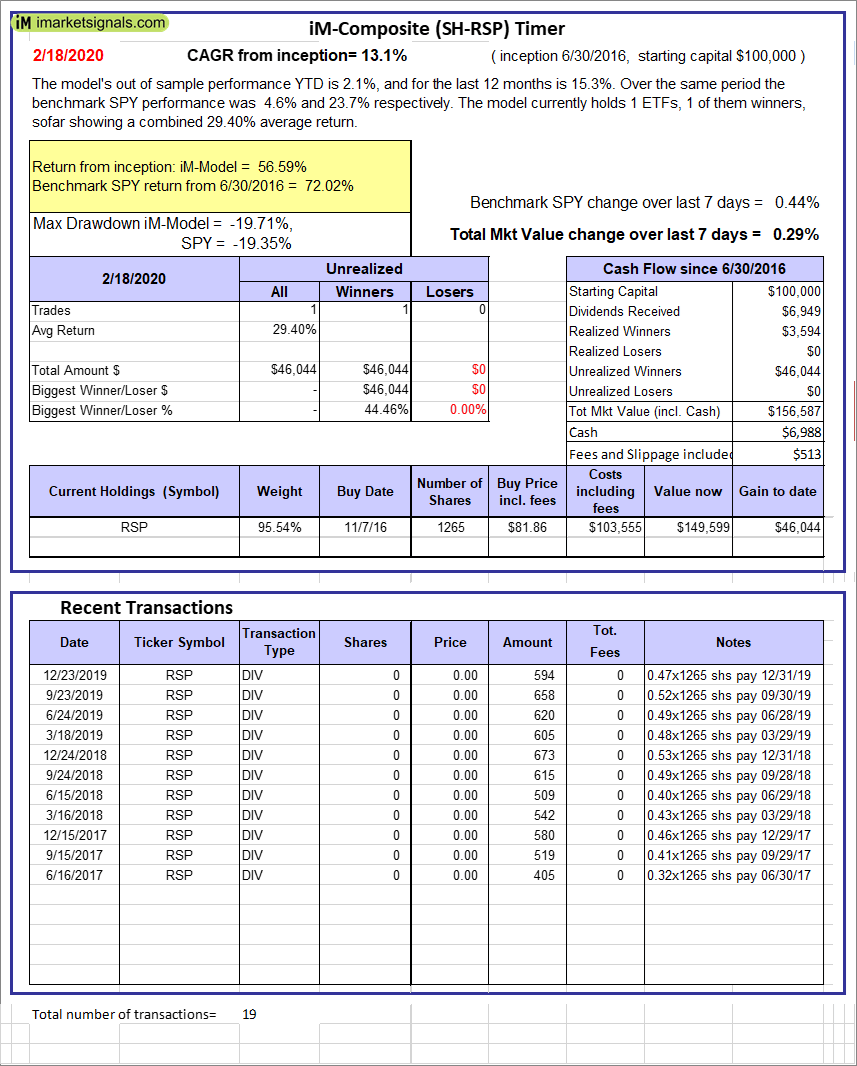 |
iM-Composite (SH-RSP) Timer: The model’s out of sample performance YTD is 2.1%, and for the last 12 months is 15.3%. Over the same period the benchmark SPY performance was 4.6% and 23.7% respectively. Over the previous week the market value of the iM-Composite (SH-RSP) Timer gained 0.29% at a time when SPY gained 0.44%. A starting capital of $100,000 at inception on 6/30/2016 would have grown to $156,587 which includes $6,988 cash and excludes $513 spent on fees and slippage. |
 |
iM-Composite (SPY-IEF) Timer: The model’s out of sample performance YTD is 4.5%, and for the last 12 months is 17.6%. Over the same period the benchmark SPY performance was 4.6% and 23.7% respectively. Over the previous week the market value of the iM-Composite (SPY-IEF) Timer gained 0.43% at a time when SPY gained 0.44%. A starting capital of $100,000 at inception on 6/30/2016 would have grown to $170,782 which includes $2,753 cash and excludes $3,393 spent on fees and slippage. |
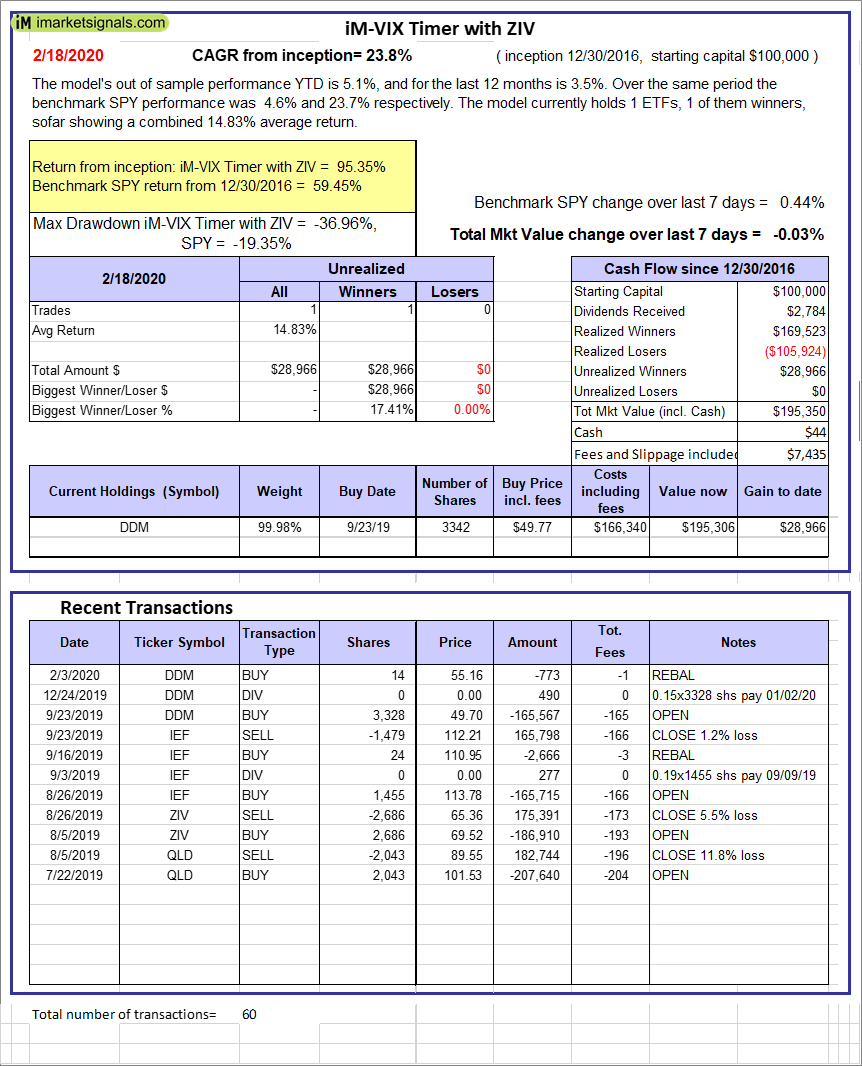 |
iM-VIX Timer with ZIV: The model’s out of sample performance YTD is 5.1%, and for the last 12 months is 3.5%. Over the same period the benchmark SPY performance was 4.6% and 23.7% respectively. Over the previous week the market value of the iM-VIX Timer with ZIV gained -0.03% at a time when SPY gained 0.44%. A starting capital of $100,000 at inception on 6/30/2016 would have grown to $195,350 which includes $44 cash and excludes $7,435 spent on fees and slippage. |
 |
iM-Composite(Gold-Stocks-Bond) Timer: The model’s out of sample performance YTD is 4.4%, and for the last 12 months is 18.4%. Over the same period the benchmark SPY performance was 4.6% and 23.7% respectively. Over the previous week the market value of the iM-Composite(Gold-Stocks-Bond) Timer gained 2.23% at a time when SPY gained 0.44%. A starting capital of $100,000 at inception on 6/30/2016 would have grown to $135,947 which includes $124 cash and excludes $4,640 spent on fees and slippage. |
 |
iM-Low Turnover Composite Timer Combo: The model’s out of sample performance YTD is 3.5%, and for the last 12 months is 15.5%. Over the same period the benchmark SPY performance was 4.6% and 23.7% respectively. Over the previous week the market value of the iM-Low Turnover Composite Timer Combo gained 0.52% at a time when SPY gained 0.44%. A starting capital of $100,000 at inception on 3/24/27 would have grown to $116,498 which includes $863 cash and excludes $1,764 spent on fees and slippage. |
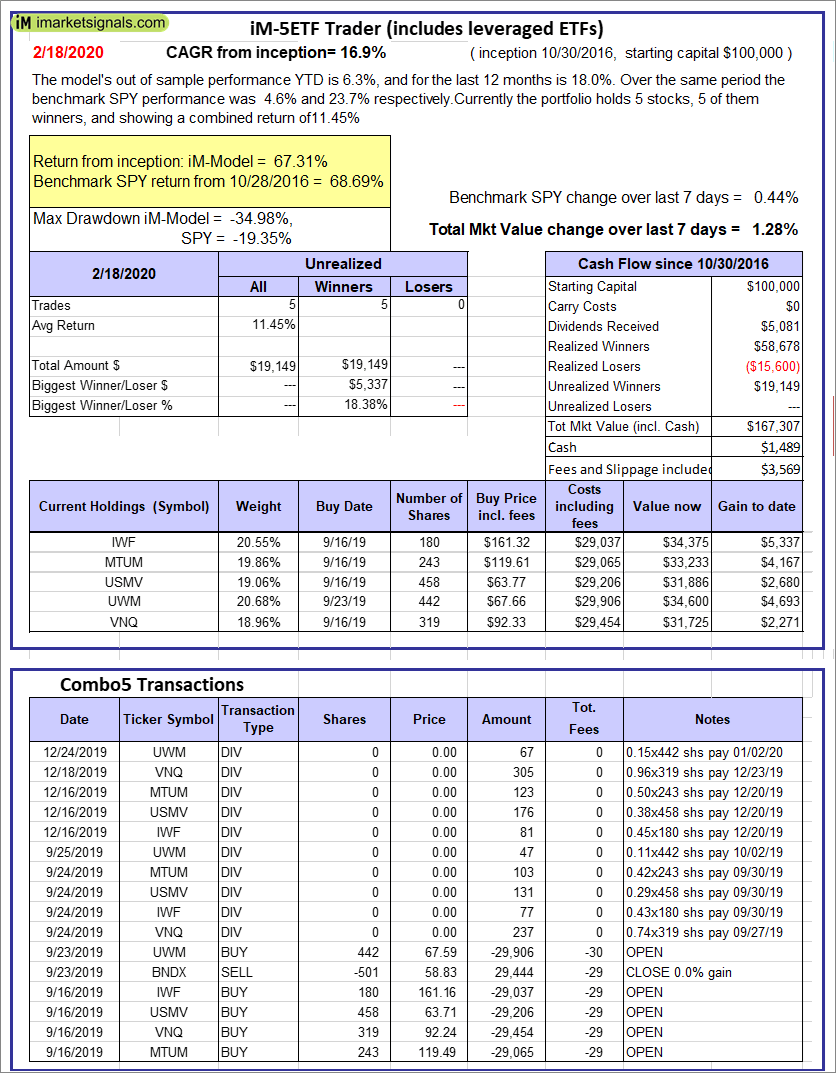 |
iM-5ETF Trader (includes leveraged ETFs): The model’s out of sample performance YTD is 6.3%, and for the last 12 months is 18.0%. Over the same period the benchmark SPY performance was 4.6% and 23.7% respectively. Over the previous week the market value of the iM-5ETF Trader (includes leveraged ETFs) gained 1.28% at a time when SPY gained 0.44%. A starting capital of $100,000 at inception on 10/30/2016 would have grown to $167,307 which includes $1,489 cash and excludes $3,569 spent on fees and slippage. |
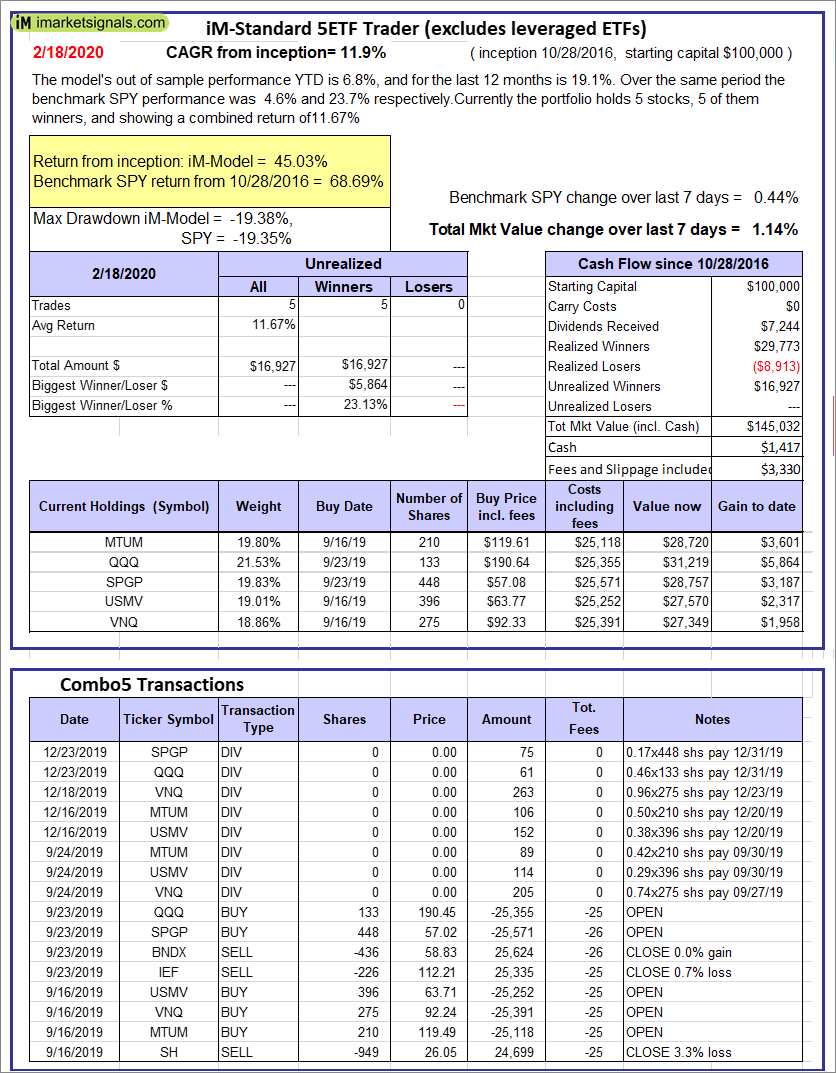 |
iM-Standard 5ETF Trader (excludes leveraged ETFs): The model’s out of sample performance YTD is 6.8%, and for the last 12 months is 19.1%. Over the same period the benchmark SPY performance was 4.6% and 23.7% respectively. Over the previous week the market value of the iM-Standard 5ETF Trader (excludes leveraged ETFs) gained 1.14% at a time when SPY gained 0.44%. A starting capital of $100,000 at inception on 10/30/2016 would have grown to $145,032 which includes $1,417 cash and excludes $3,330 spent on fees and slippage. |
iM-Best Reports – 2/18/2020
Posted in pmp SPY-SH
Leave a Reply
You must be logged in to post a comment.