
  |
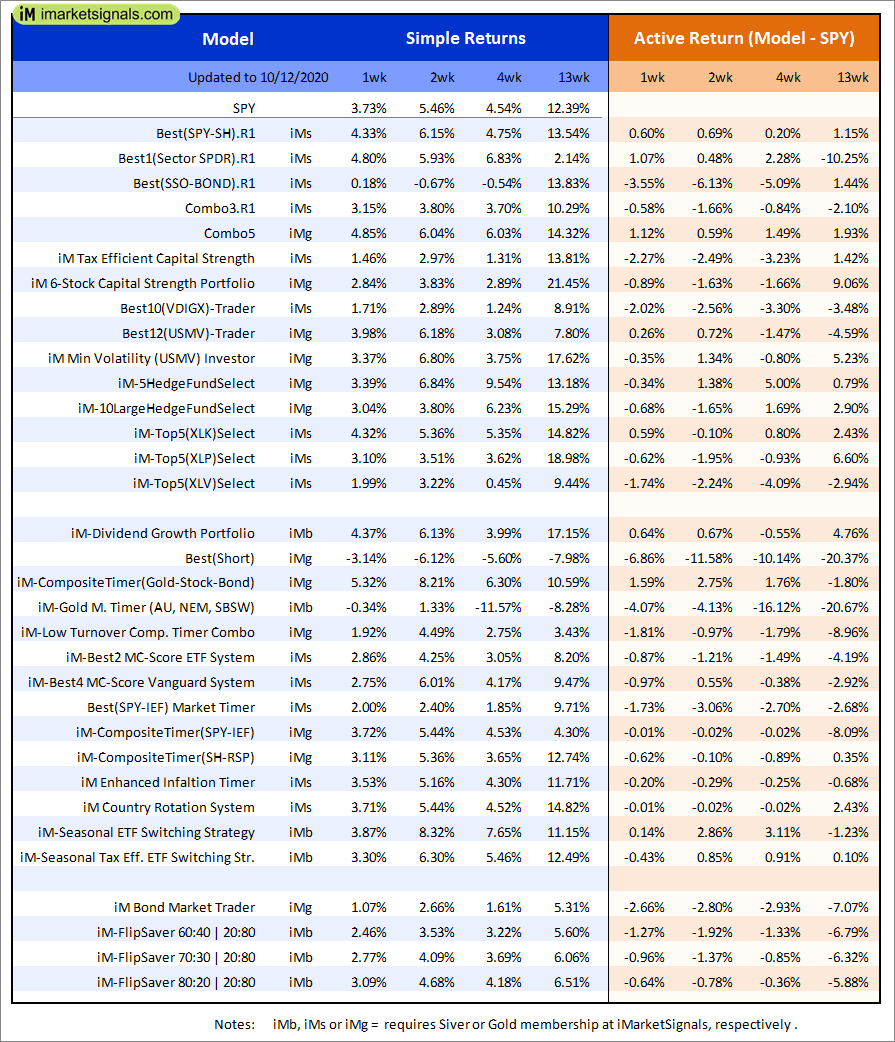
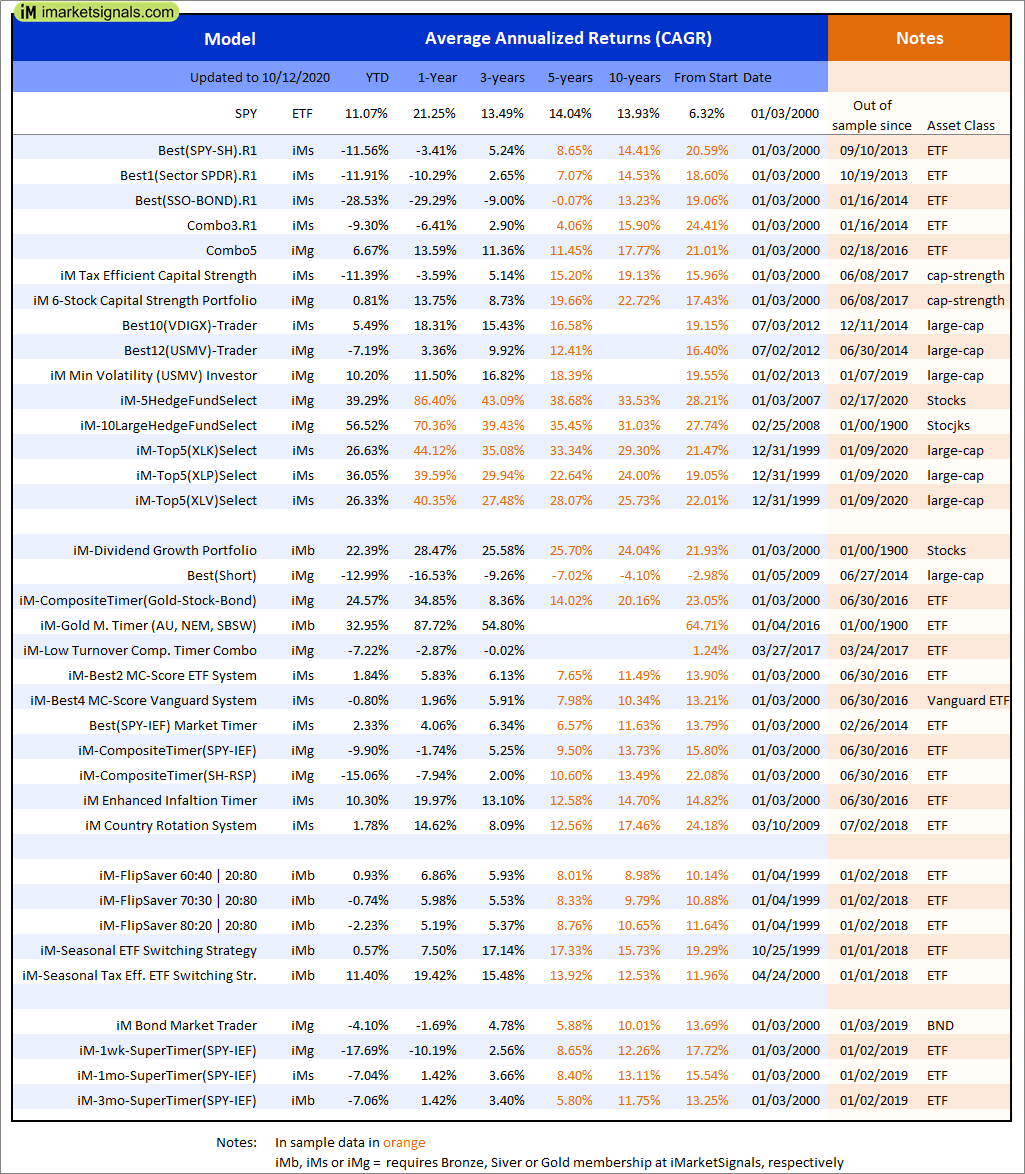
Out of sample performance summary of our models for the past 1, 2, 4 and 13 week periods. The active active return indicates how the models over- or underperformed the benchmark ETF SPY. Also the YTD, and the 1-, 3-, 5- and 10-year annualized returns are shown in the second table |
 |
iM-FlipSaver 60:40 | 20:80 – 2017: The model’s out of sample performance YTD is 0.8%, and for the last 12 months is 6.7%. Over the same period the benchmark E60B40 performance was 10.7% and 16.6% respectively. Over the previous week the market value of iM-FlipSaver 80:20 | 20:80 gained 2.45% at a time when SPY gained 2.37%. A starting capital of $100,000 at inception on 7/16/2015 would have grown to $130,464 which includes $448 cash and excludes $1,783 spent on fees and slippage. |
 |
iM-FlipSaver 70:30 | 20:80 – 2017: The model’s out of sample performance YTD is -0.7%, and for the last 12 months is 6.0%. Over the same period the benchmark E60B40 performance was 10.7% and 16.6% respectively. Over the previous week the market value of iM-FlipSaver 70:30 | 20:80 gained 2.77% at a time when SPY gained 2.37%. A starting capital of $100,000 at inception on 7/15/2015 would have grown to $131,645 which includes $333 cash and excludes $1,918 spent on fees and slippage. |
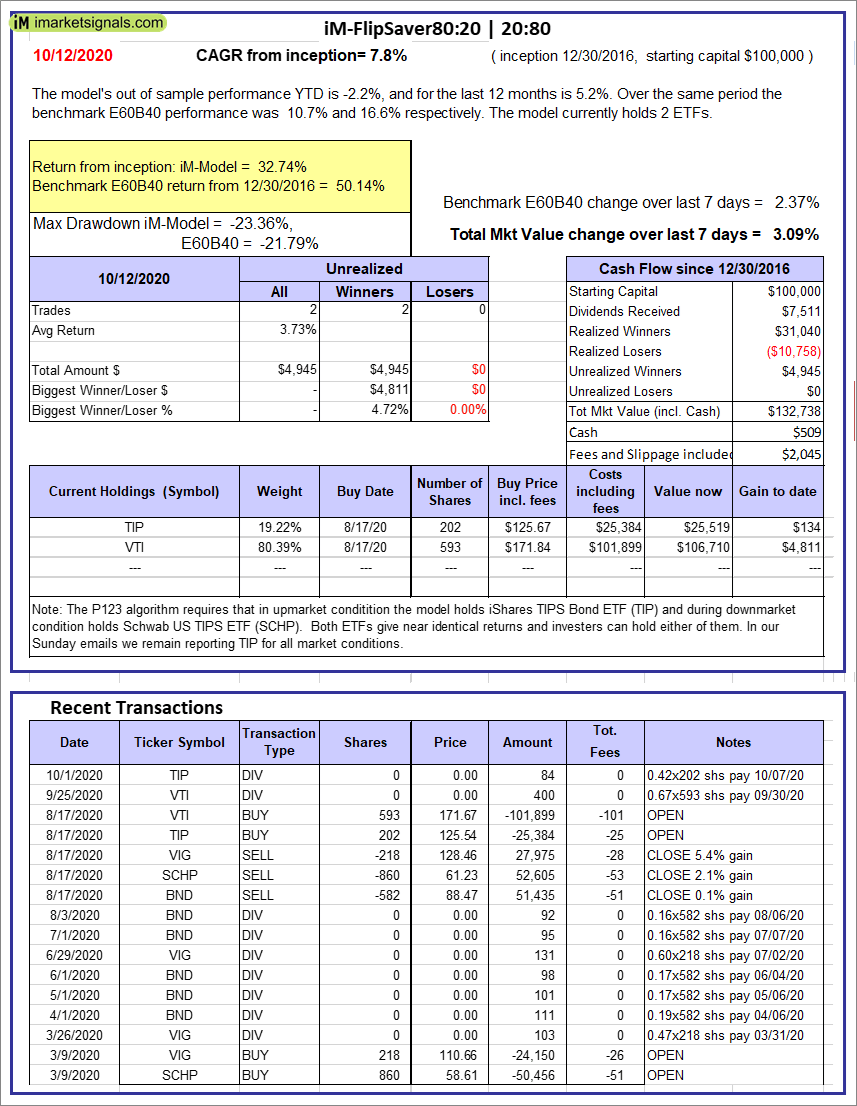 |
iM-FlipSaver 80:20 | 20:80 – 2017: The model’s out of sample performance YTD is -2.2%, and for the last 12 months is 5.2%. Over the same period the benchmark E60B40 performance was 10.7% and 16.6% respectively. Over the previous week the market value of iM-FlipSaver 80:20 | 20:80 gained 3.09% at a time when SPY gained 2.37%. A starting capital of $100,000 at inception on 1/2/2017 would have grown to $132,738 which includes $509 cash and excludes $2,045 spent on fees and slippage. |
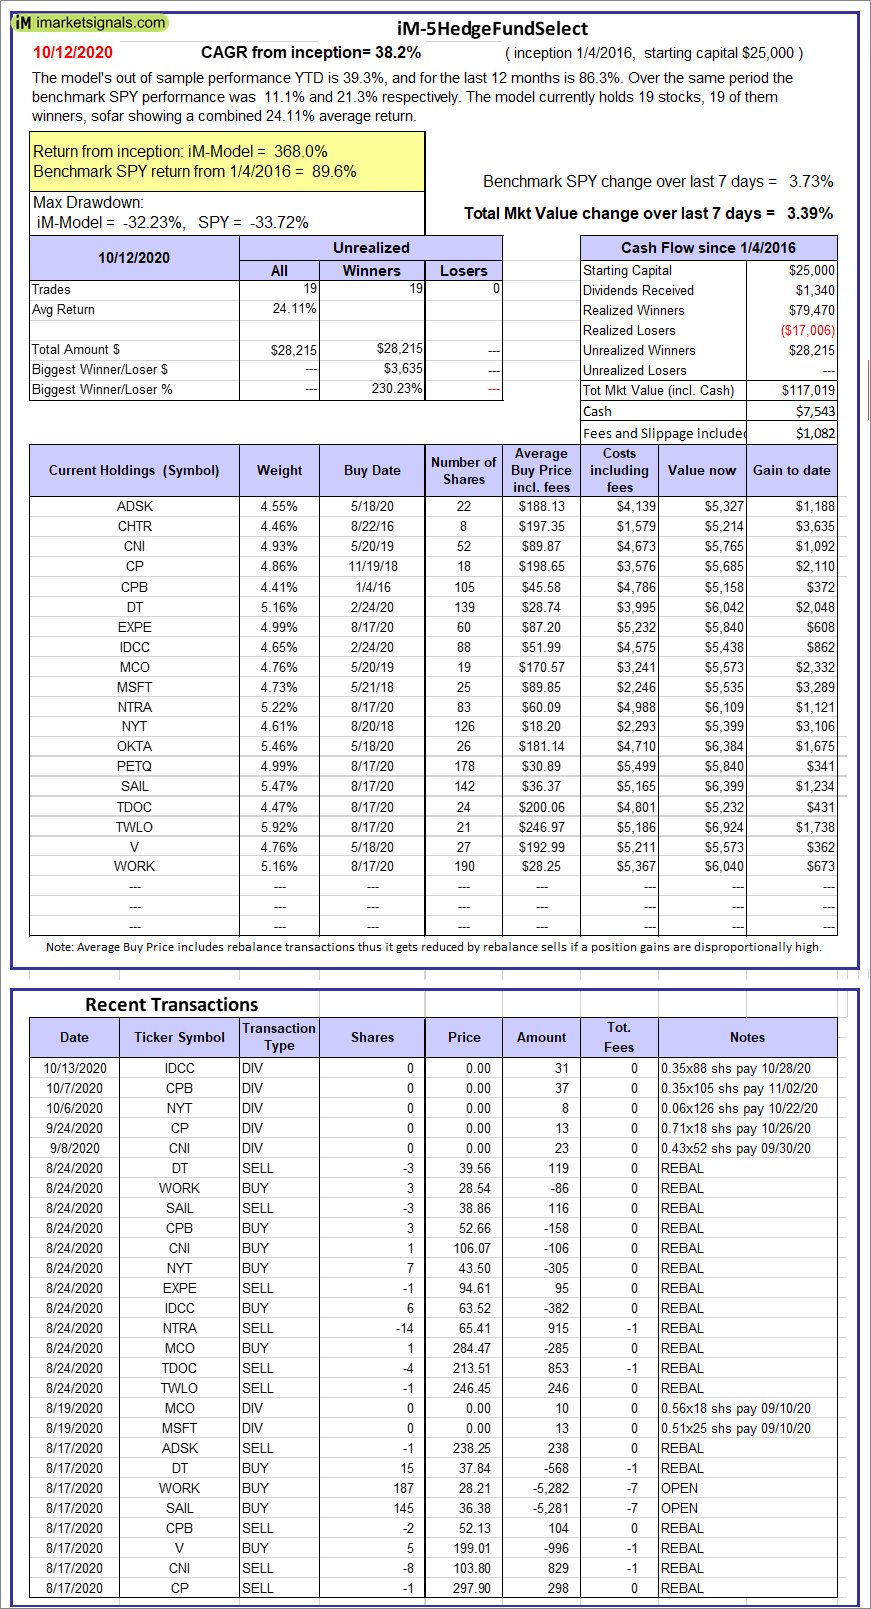 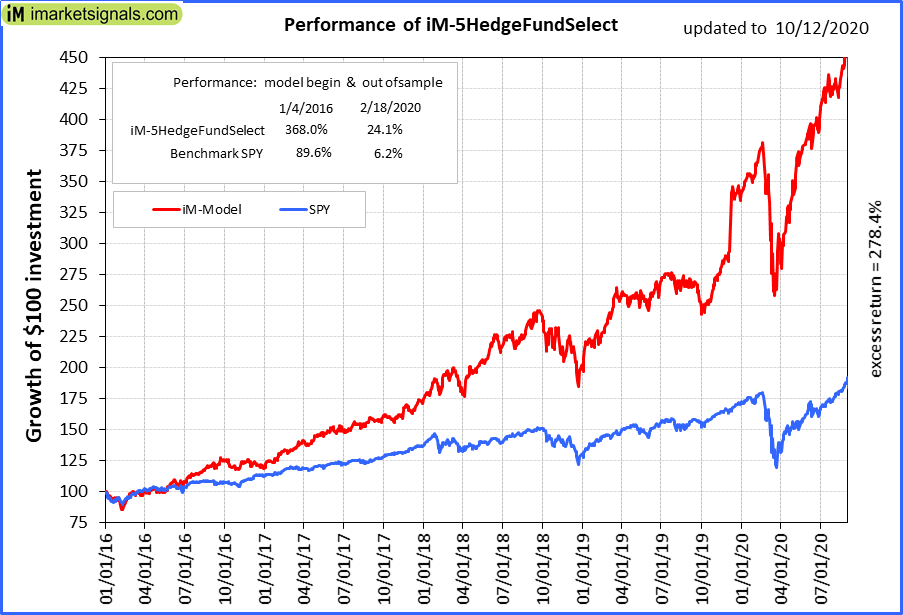 |
iM-5HedgeFundSelect: Since inception, on 1/5/2016, the model gained 367.95% while the benchmark SPY gained 89.59% over the same period. Over the previous week the market value of iM-5HedgeFundSelect gained 3.39% at a time when SPY gained 3.73%. A starting capital of $25,000 at inception on 1/5/2016 would have grown to $117,019 which includes $7,543 cash and excludes $1,082 spent on fees and slippage. |
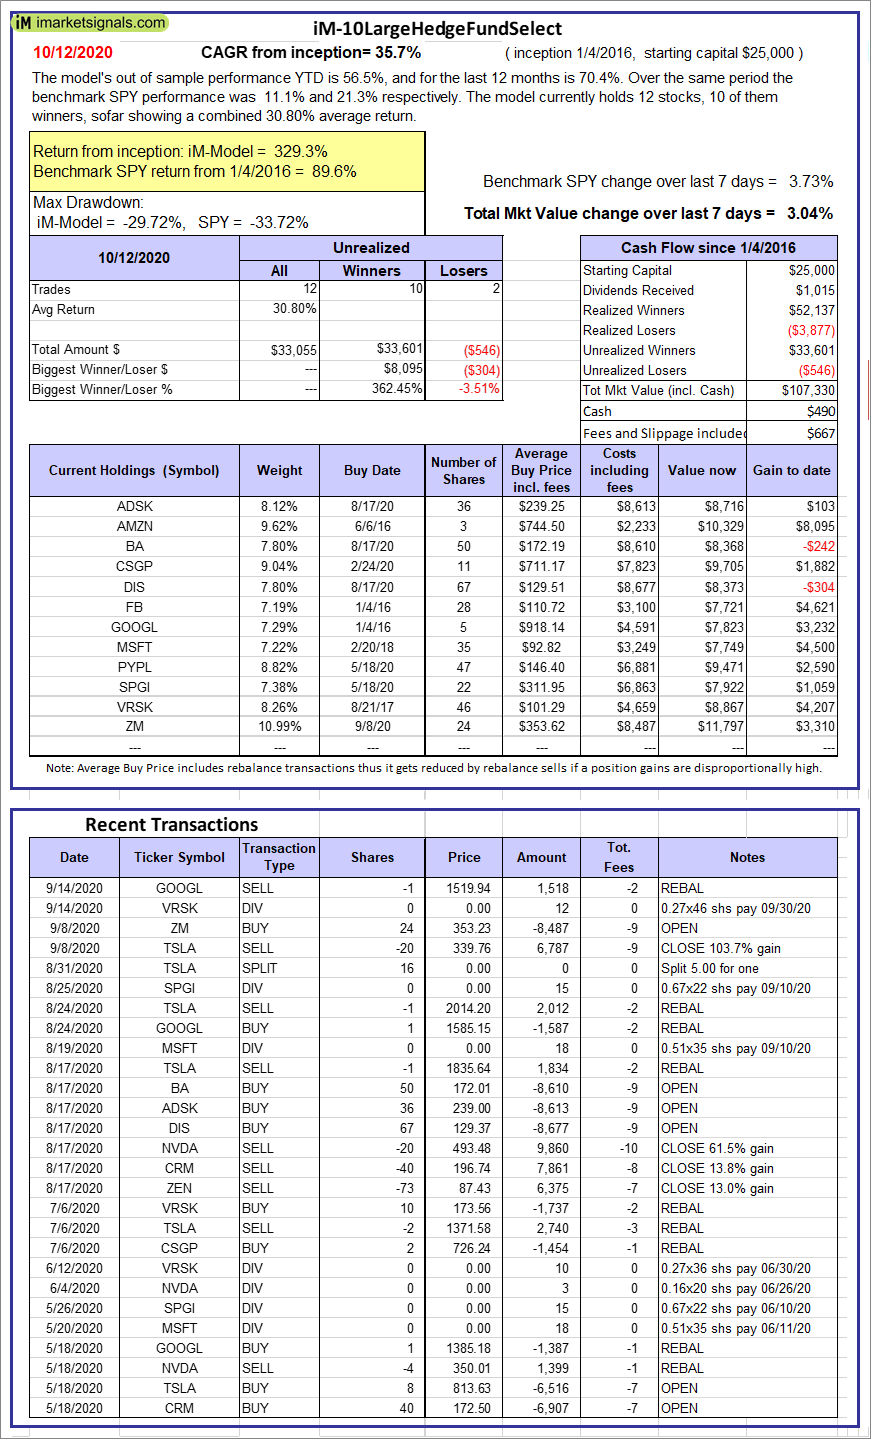 |
iM-10LargeHedgeFundSelect: Since inception, on 1/5/2016, the model gained 329.32% while the benchmark SPY gained 89.59% over the same period. Over the previous week the market value of iM-10LargeHedgeFundSelect gained 3.04% at a time when SPY gained 3.73%. A starting capital of $25,000 at inception on 1/5/2016 would have grown to $107,330 which includes $490 cash and excludes $667 spent on fees and slippage. |
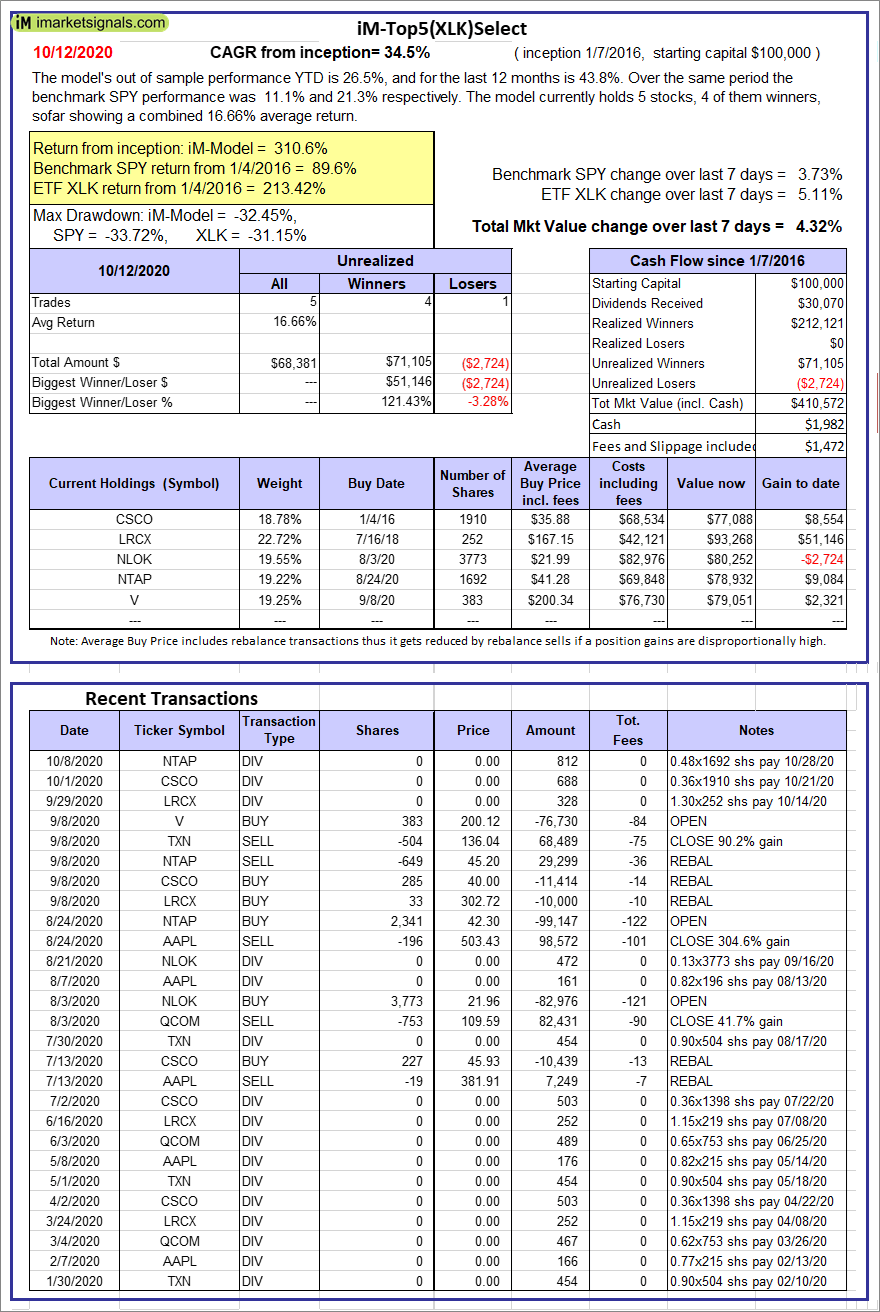 |
iM-Top5(XLK)Select: Since inception, on 1/8/2016, the model gained 310.57% while the benchmark SPY gained 89.59% over the same period. Over the previous week the market value of iM-Top5(XLK)Select gained 4.32% at a time when SPY gained 3.73%. A starting capital of $100,000 at inception on 1/8/2016 would have grown to $410,572 which includes $1,982 cash and excludes $1,472 spent on fees and slippage. |
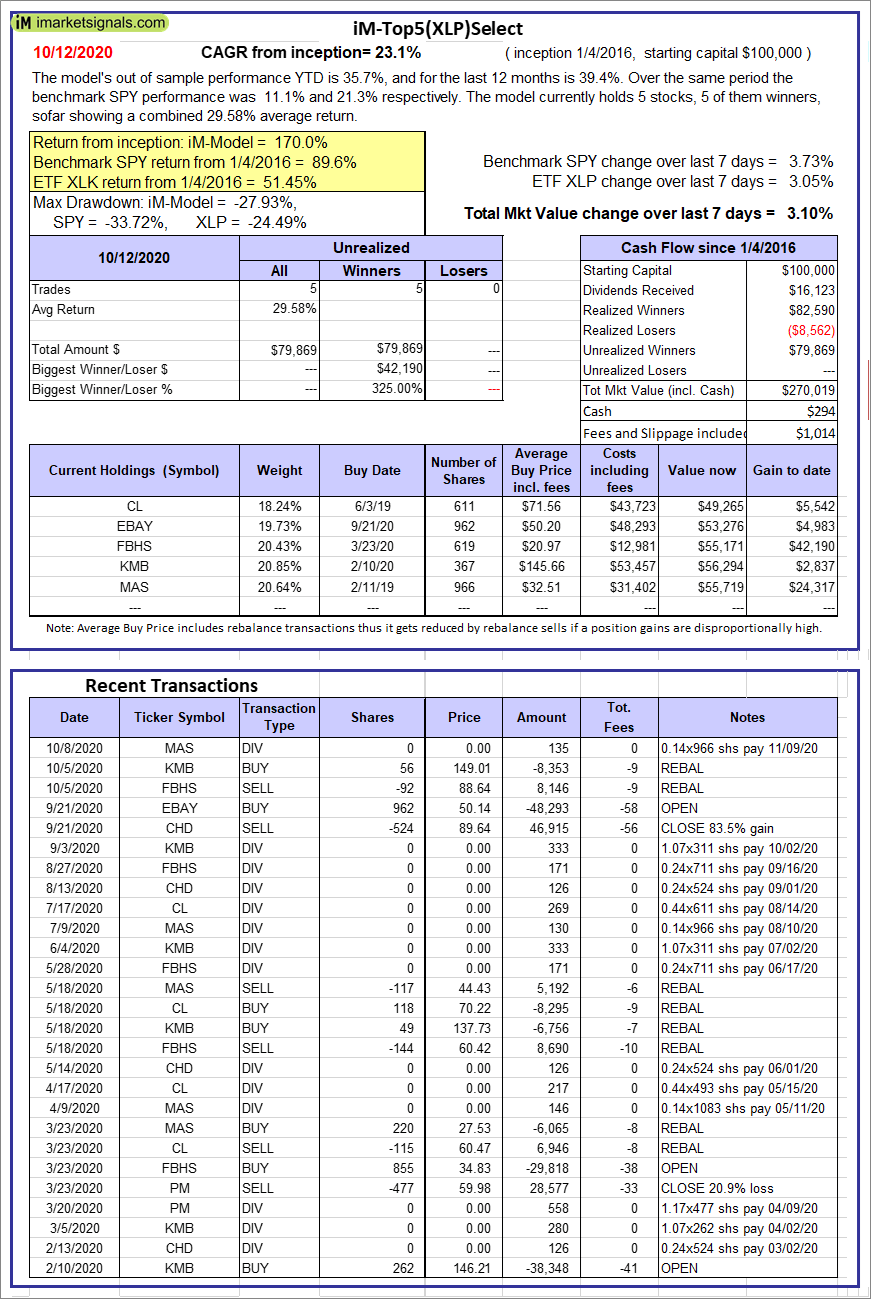 |
iM-Top5(XLP)Select: Since inception, on 1/5/2016, the model gained 170.02% while the benchmark SPY gained 89.59% over the same period. Over the previous week the market value of iM-Top5(XLP)Select gained 3.10% at a time when SPY gained 3.73%. A starting capital of $100,000 at inception on 1/5/2016 would have grown to $270,019 which includes $294 cash and excludes $1,014 spent on fees and slippage. |
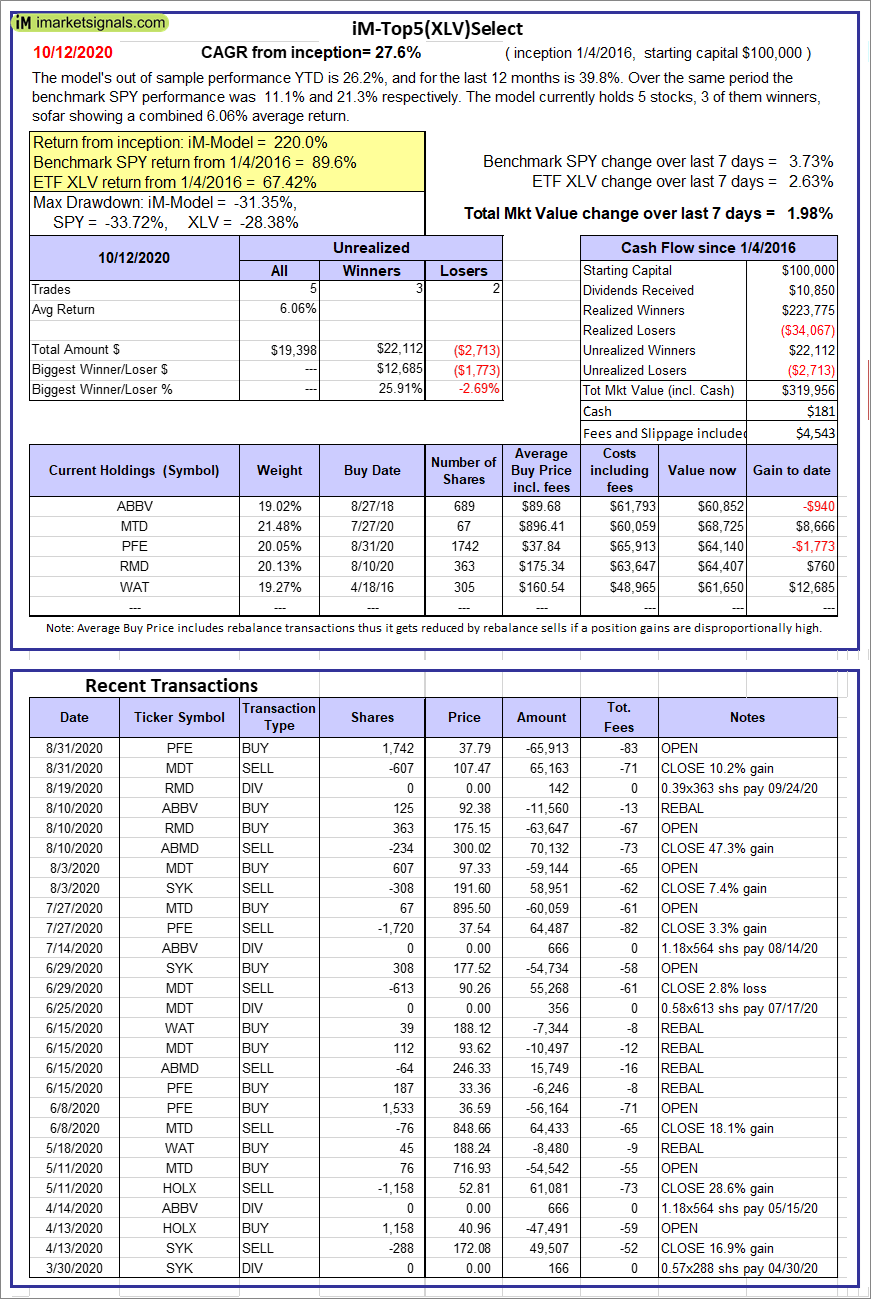 |
iM-Top5(XLV)Select: Since inception, on 1/5/2016, the model gained 219.96% while the benchmark SPY gained 89.59% over the same period. Over the previous week the market value of iM-Top5(XLV)Select gained 1.98% at a time when SPY gained 3.73%. A starting capital of $100,000 at inception on 1/5/2016 would have grown to $319,956 which includes $181 cash and excludes $4,543 spent on fees and slippage. |
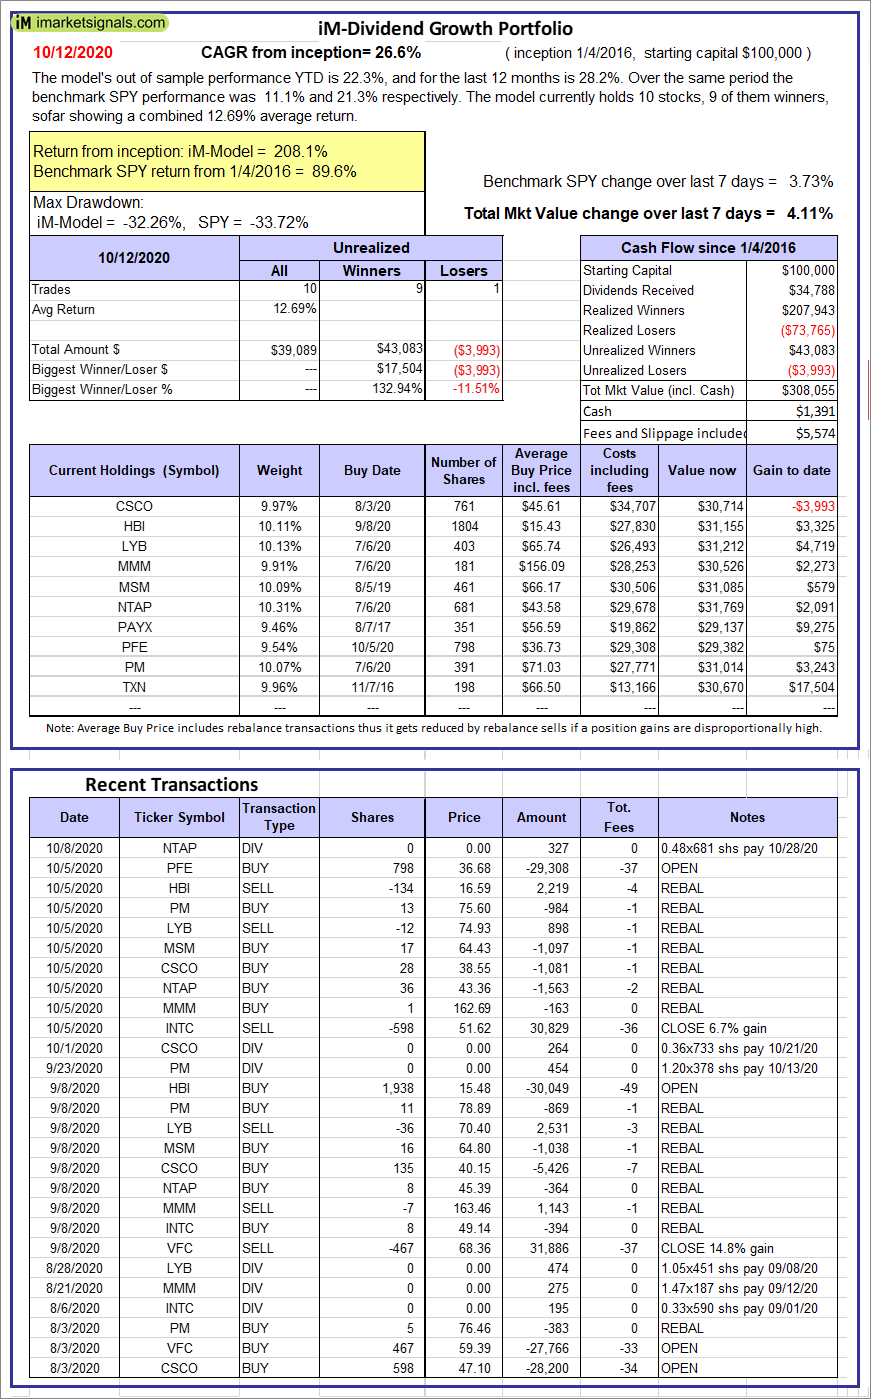 |
iM-Dividend Growth Portfolio: The model’s out of sample performance YTD is 22.3%, and for the last 12 months is 28.2%. Over the same period the benchmark SPY performance was 11.1% and 21.3% respectively. Over the previous week the market value of the iM-Dividend Growth Portfolio gained 4.11% at a time when SPY gained 3.73%. A starting capital of $100,000 at inception on 6/30/2016 would have grown to $308,055 which includes $1,391 cash and excludes $5,574 spent on fees and slippage. |
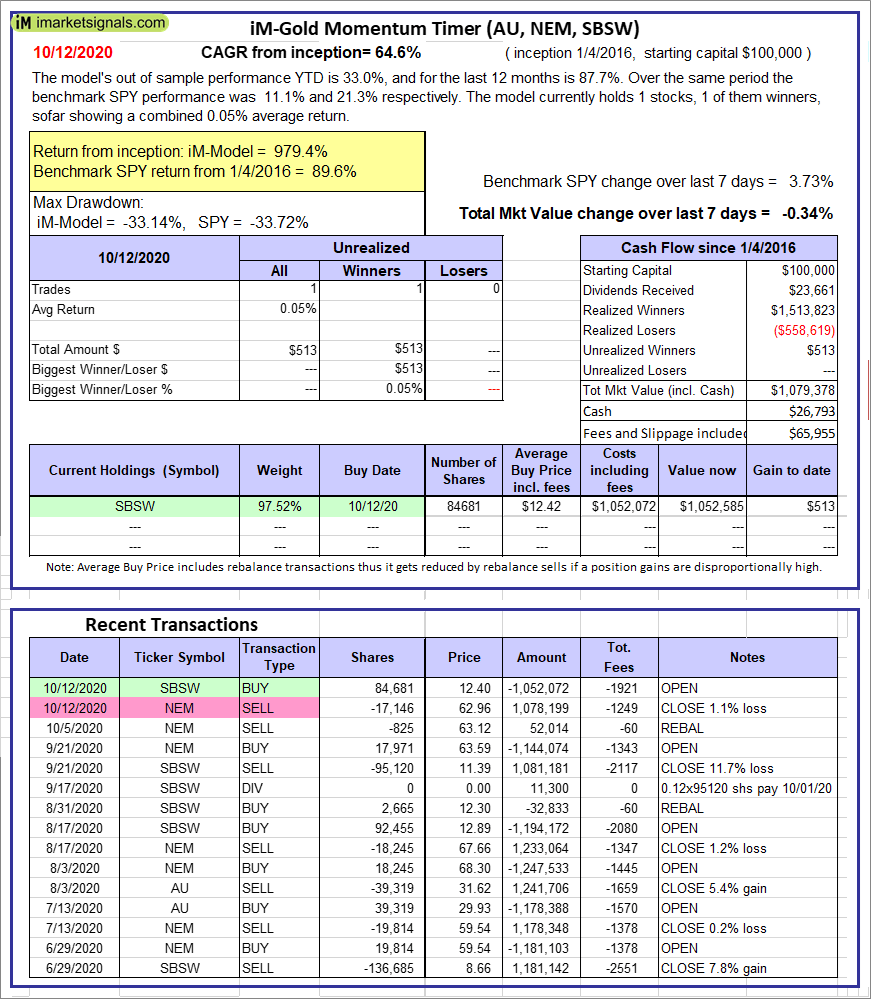 |
iM-Gold Momentum Timer (AU, NEM, SBSW): The model’s out of sample performance YTD is 33.0%, and for the last 12 months is 87.7%. Over the same period the benchmark SPY performance was 11.1% and 21.3% respectively. Over the previous week the market value of iM-Gold Momentum Timer (AU, NEM, SBSW) gained -0.34% at a time when SPY gained 3.73%. A starting capital of $100,000 at inception on 6/30/2016 would have grown to $26,793 which includes $65,955 cash and excludes Gain to date spent on fees and slippage. |
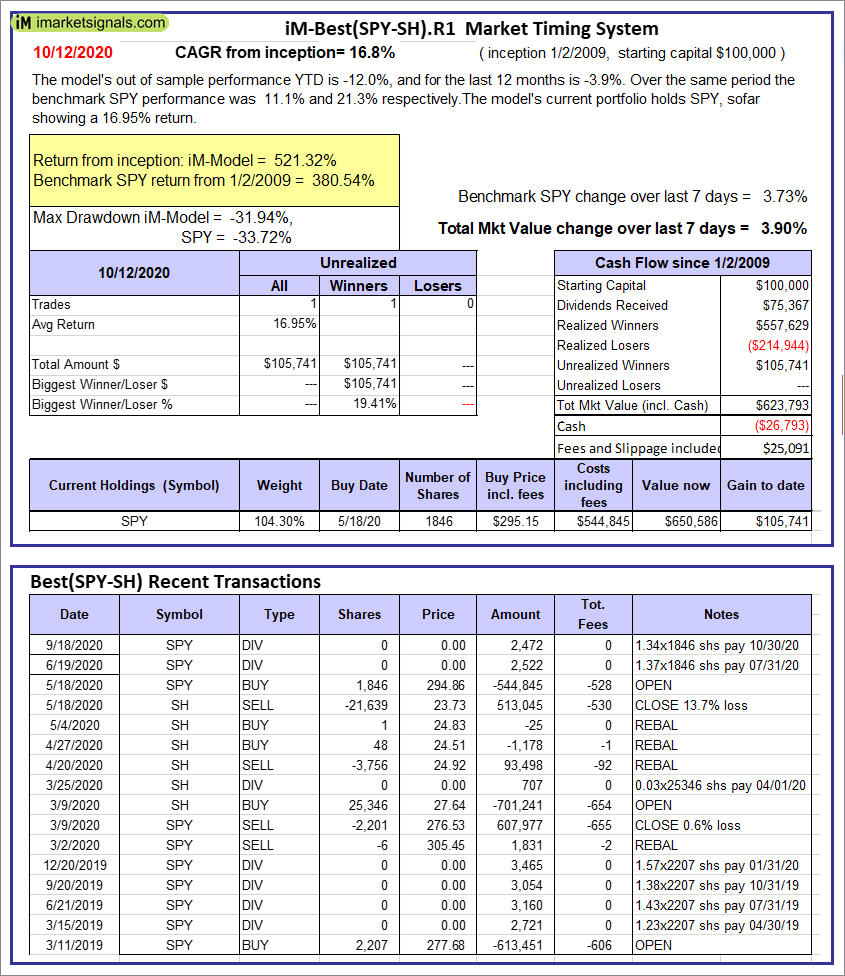 |
iM-Best(SPY-SH).R1: The model’s out of sample performance YTD is -12.0%, and for the last 12 months is -3.9%. Over the same period the benchmark SPY performance was 11.1% and 21.3% respectively. Over the previous week the market value of Best(SPY-SH) gained 3.90% at a time when SPY gained 3.73%. A starting capital of $100,000 at inception on 1/2/2009 would have grown to $623,793 which includes -$26,793 cash and excludes $25,091 spent on fees and slippage. |
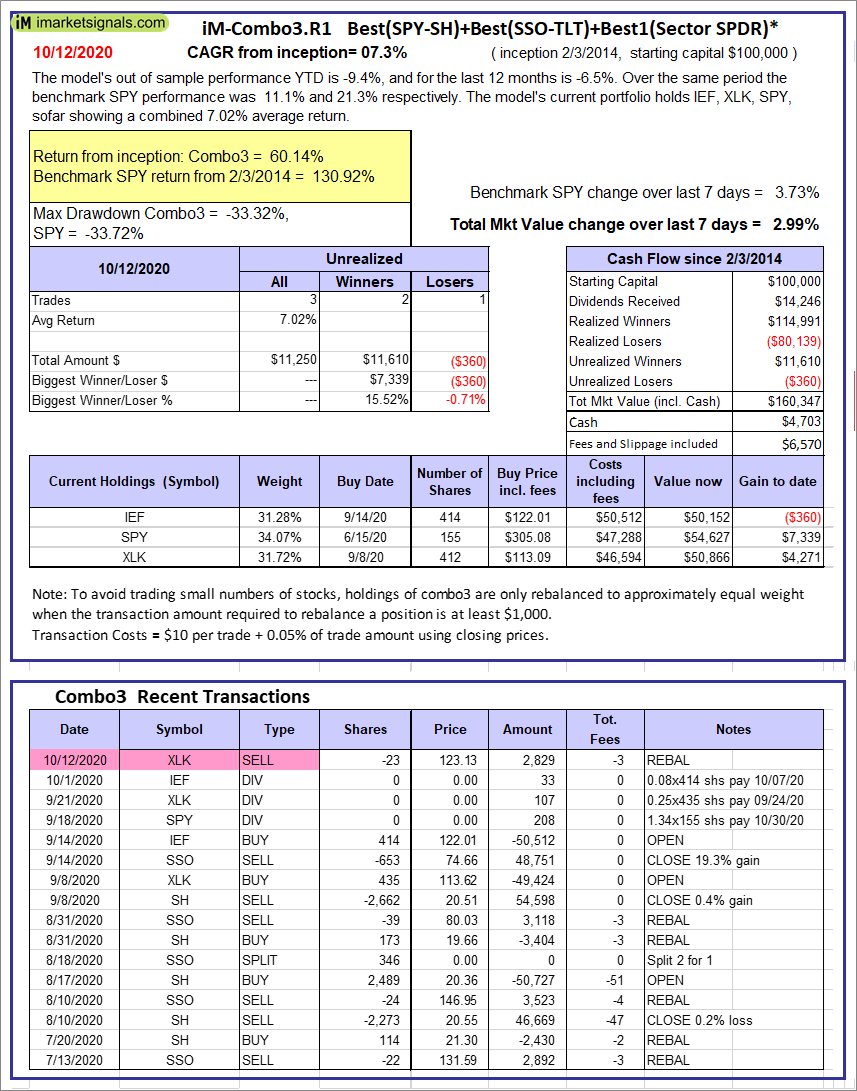 |
iM-Combo3.R1: The model’s out of sample performance YTD is -9.4%, and for the last 12 months is -6.5%. Over the same period the benchmark SPY performance was 11.1% and 21.3% respectively. Over the previous week the market value of iM-Combo3.R1 gained 2.99% at a time when SPY gained 3.73%. A starting capital of $100,000 at inception on 2/3/2014 would have grown to $160,347 which includes $4,703 cash and excludes $6,570 spent on fees and slippage. |
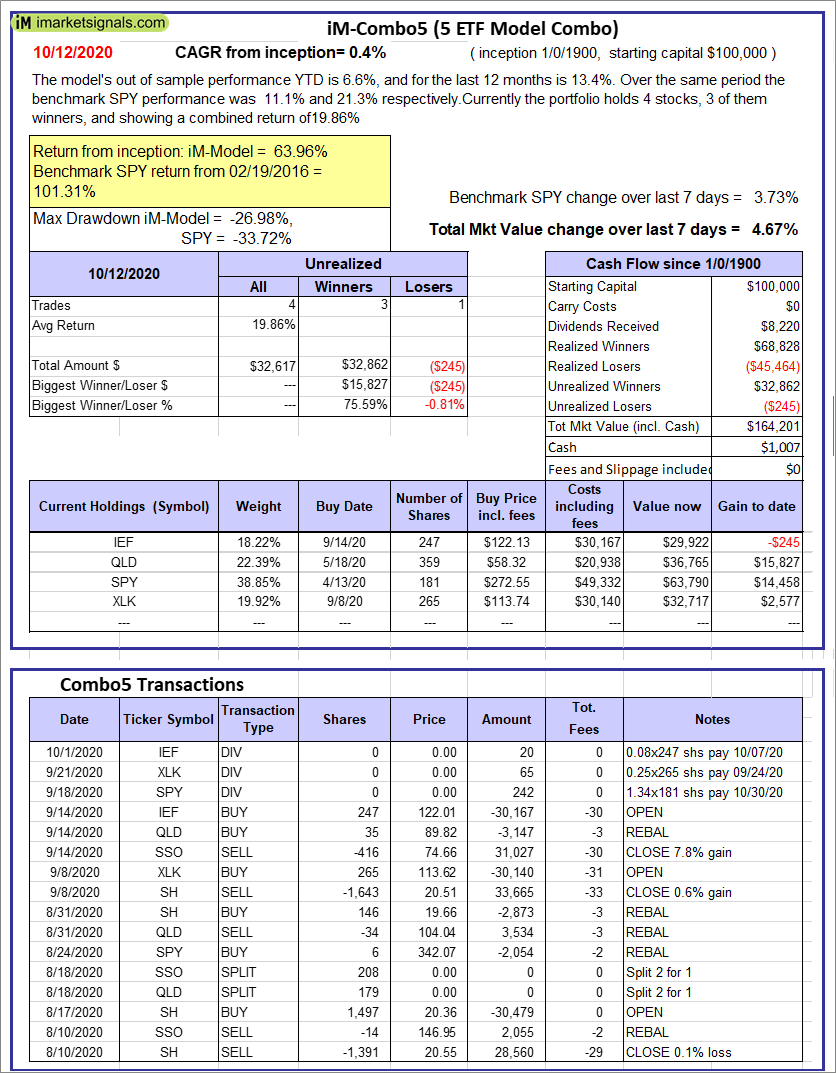 |
iM-Combo5: The model’s out of sample performance YTD is 6.6%, and for the last 12 months is 13.4%. Over the same period the benchmark SPY performance was 11.1% and 21.3% respectively. Over the previous week the market value of iM-Combo5 gained 4.67% at a time when SPY gained 3.73%. A starting capital of $100,000 at inception on 2/22/2016 would have grown to $164,201 which includes $1,007 cash and excludes $0 spent on fees and slippage. |
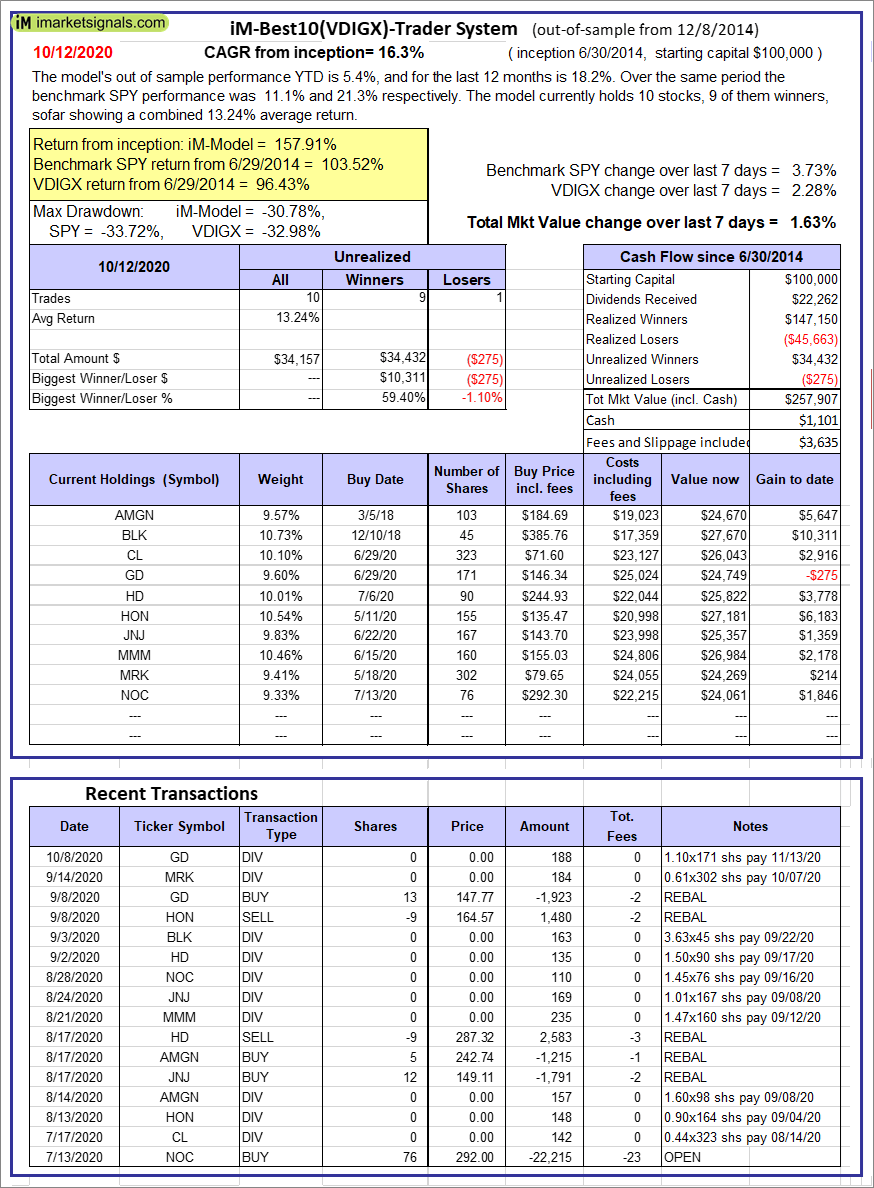 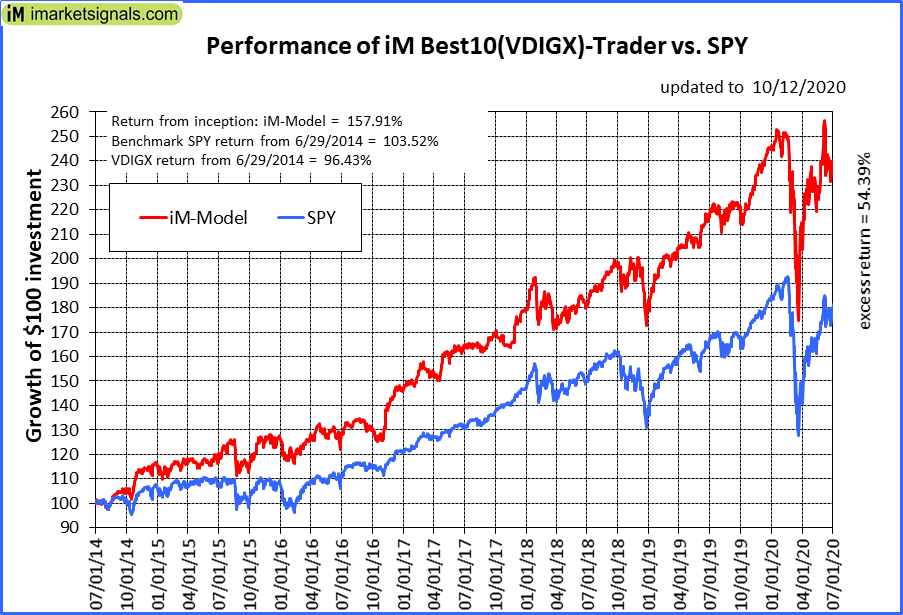 |
iM-Best10(VDIGX)-Trader: The model’s out of sample performance YTD is 5.4%, and for the last 12 months is 18.2%. Over the same period the benchmark SPY performance was 11.1% and 21.3% respectively. Since inception, on 7/1/2014, the model gained 157.91% while the benchmark SPY gained 103.52% and VDIGX gained 96.43% over the same period. Over the previous week the market value of iM-Best10(VDIGX) gained 1.63% at a time when SPY gained 3.73%. A starting capital of $100,000 at inception on 7/1/2014 would have grown to $257,907 which includes $1,101 cash and excludes $3,635 spent on fees and slippage. |
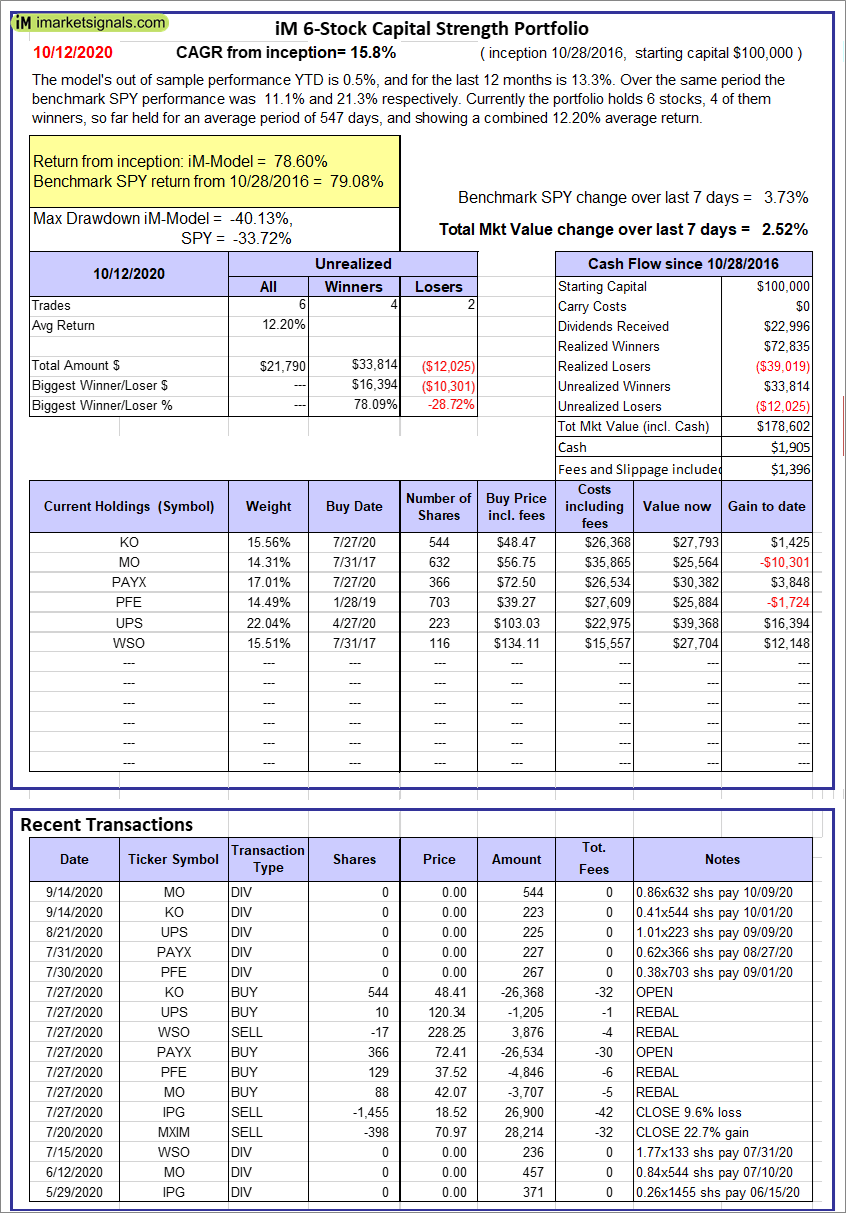 |
iM 6-Stock Capital Strength Portfolio: The model’s out of sample performance YTD is 0.5%, and for the last 12 months is 13.3%. Over the same period the benchmark SPY performance was 11.1% and 21.3% respectively. Over the previous week the market value of the iM 6-Stock Capital Strength Portfolio gained 2.52% at a time when SPY gained 3.73%. A starting capital of $100,000 at inception on 10/28/2016 would have grown to $178,602 which includes $1,905 cash and excludes $1,396 spent on fees and slippage. |
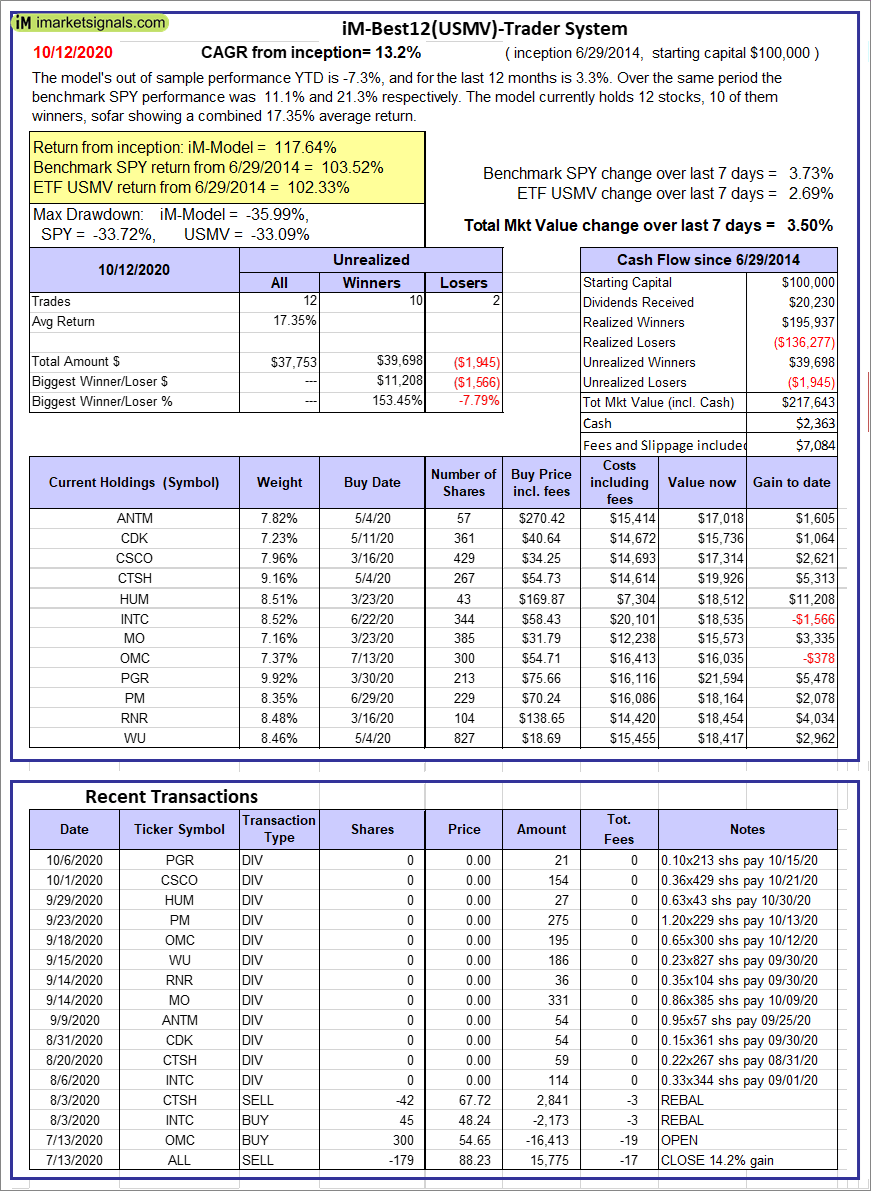 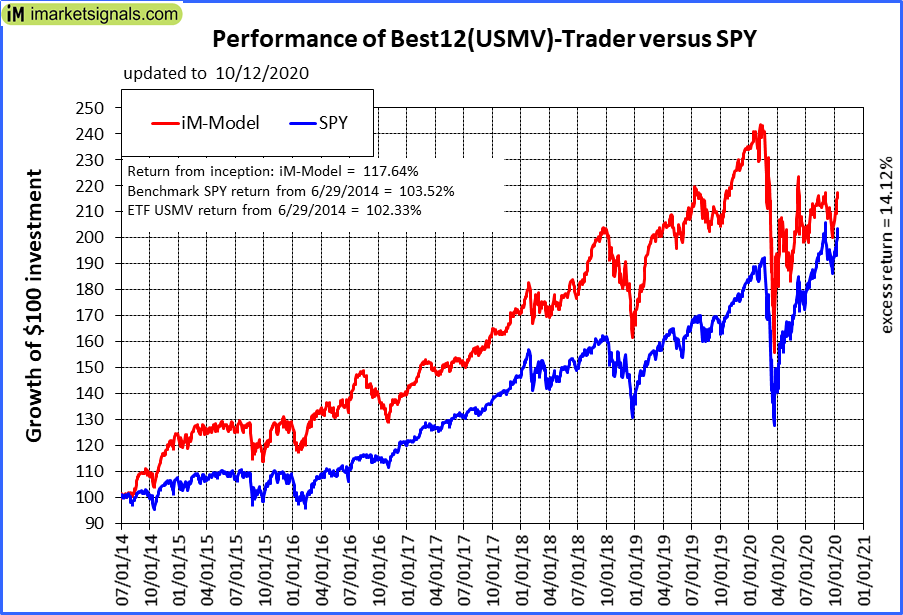 |
iM-Best12(USMV)-Trader: The model’s out of sample performance YTD is -7.3%, and for the last 12 months is 3.3%. Over the same period the benchmark SPY performance was 11.1% and 21.3% respectively. Since inception, on 6/30/2014, the model gained 117.64% while the benchmark SPY gained 103.52% and the ETF USMV gained 102.33% over the same period. Over the previous week the market value of iM-Best12(USMV)-Trader gained 3.50% at a time when SPY gained 3.73%. A starting capital of $100,000 at inception on 6/30/2014 would have grown to $217,643 which includes $2,363 cash and excludes $7,084 spent on fees and slippage. |
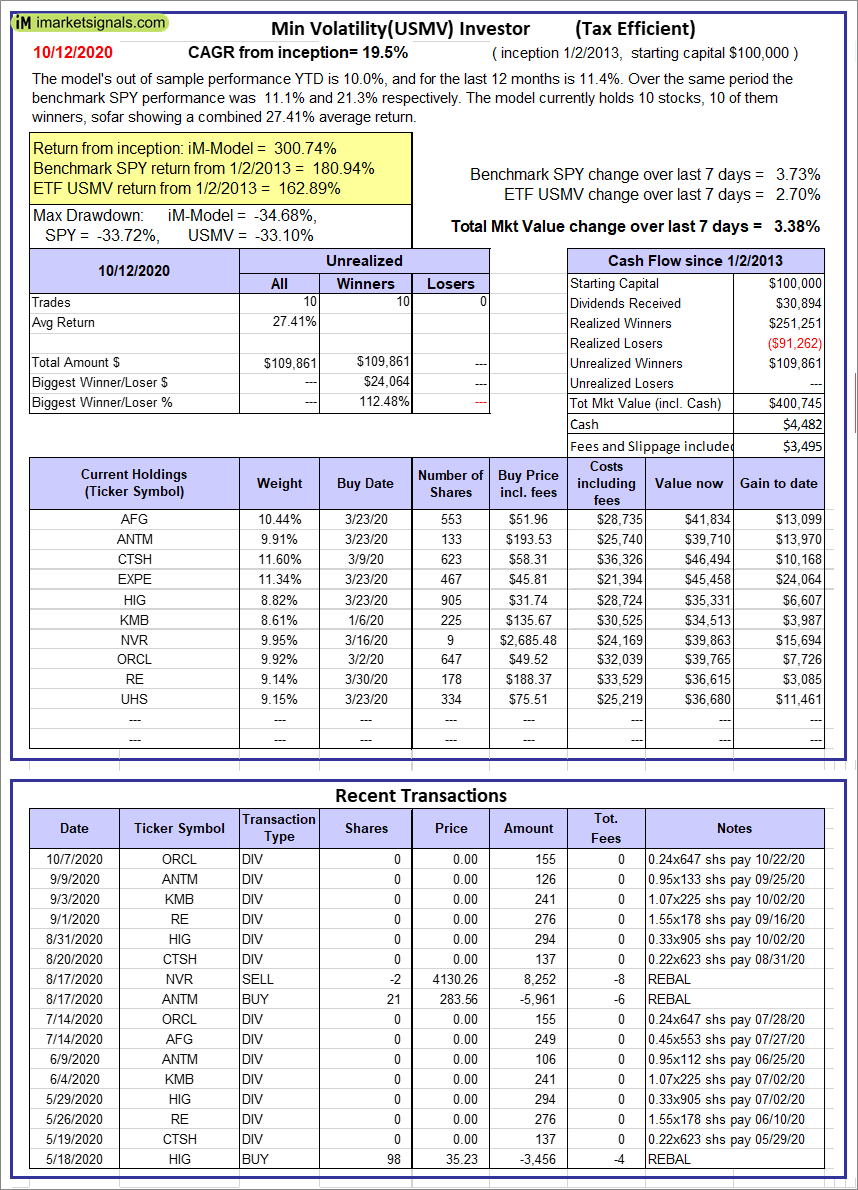 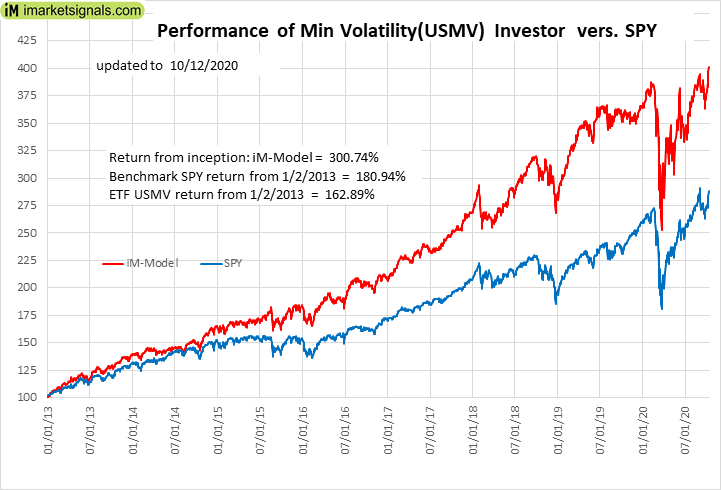 |
iM-Min Volatility(USMV) Investor (Tax Efficient): The model’s out of sample performance YTD is 10.0%, and for the last 12 months is 11.4%. Over the same period the benchmark SPY performance was 11.1% and 21.3% respectively. Since inception, on 1/3/2013, the model gained 300.74% while the benchmark SPY gained 180.94% and the ETF USMV gained 162.89% over the same period. Over the previous week the market value of iM-Best12(USMV)Q1 gained 3.38% at a time when SPY gained 3.73%. A starting capital of $100,000 at inception on 1/3/2013 would have grown to $400,745 which includes $4,482 cash and excludes $3,495 spent on fees and slippage. |
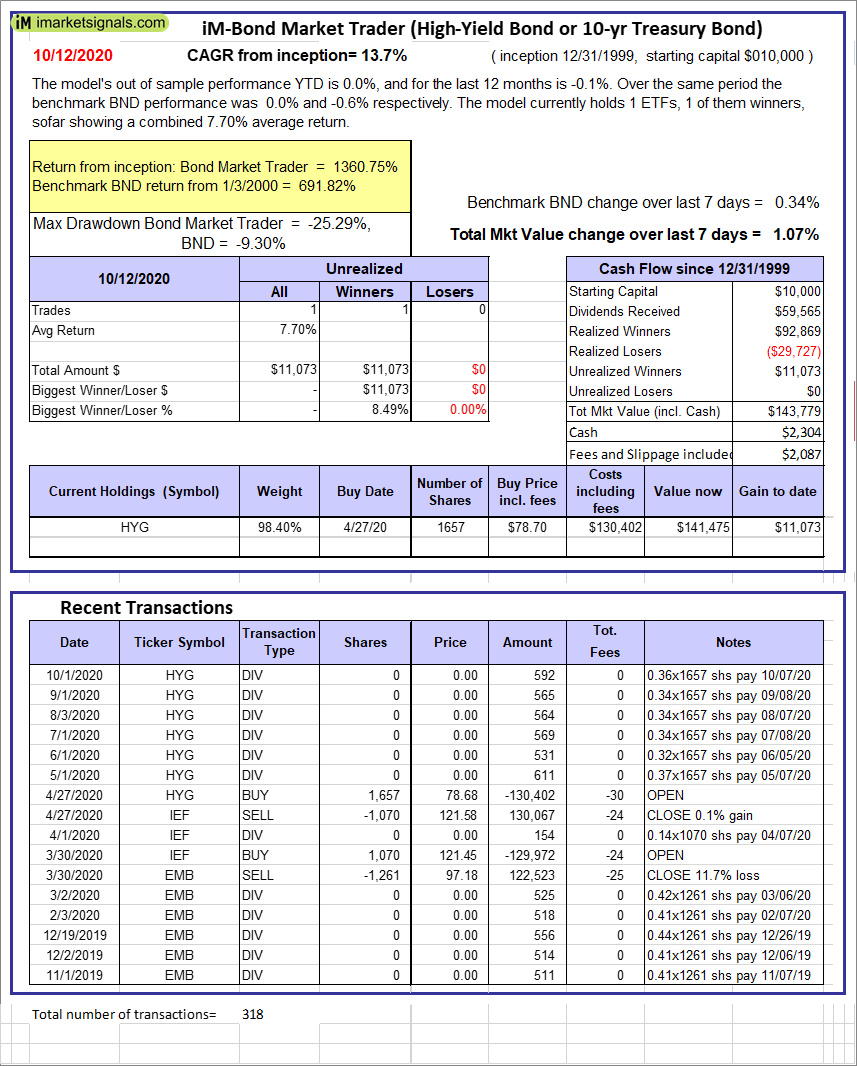 |
iM-Bond Market Trader (High-Yield Bond or 10-yr Treasury Bond): The model’s out of sample performance YTD is -36.6%, and for the last 12 months is -32.3%. Over the same period the benchmark SPY performance was 3.0% and 11.7% respectively. Over the previous week the market value of the iM-Bond Market Trader (High-Yield Bond or 10-yr Treasury Bond) gained 1.07% at a time when BND gained 0.34%. A starting capital of $100,000 at inception on 10/30/2016 would have grown to $143,779 which includes $2,304 cash and excludes $2,087 spent on fees and slippage. |
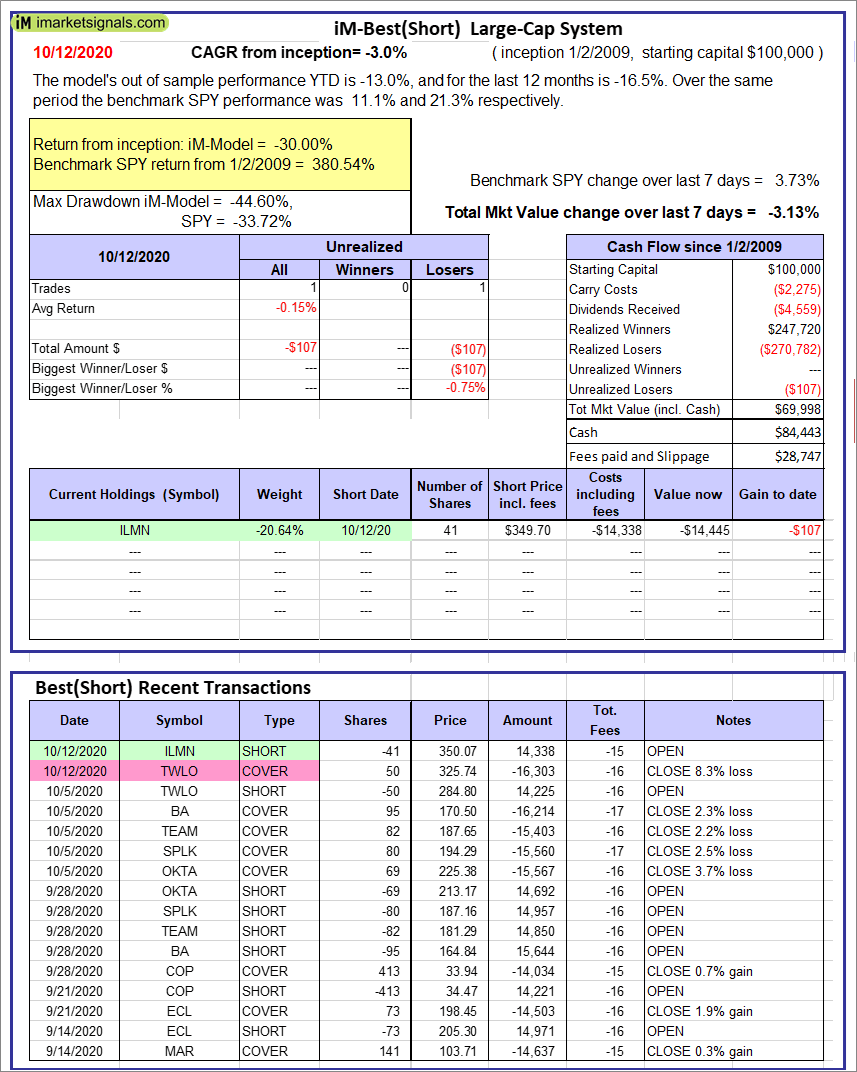 |
iM-Best(Short): The model’s out of sample performance YTD is -13.0%, and for the last 12 months is -16.5%. Over the same period the benchmark SPY performance was 11.1% and 21.3% respectively. Over the previous week the market value of iM-Best(Short) gained -3.13% at a time when SPY gained 3.73%. Over the period 1/2/2009 to 10/12/2020 the starting capital of $100,000 would have grown to $69,998 which includes $84,443 cash and excludes $28,747 spent on fees and slippage. |
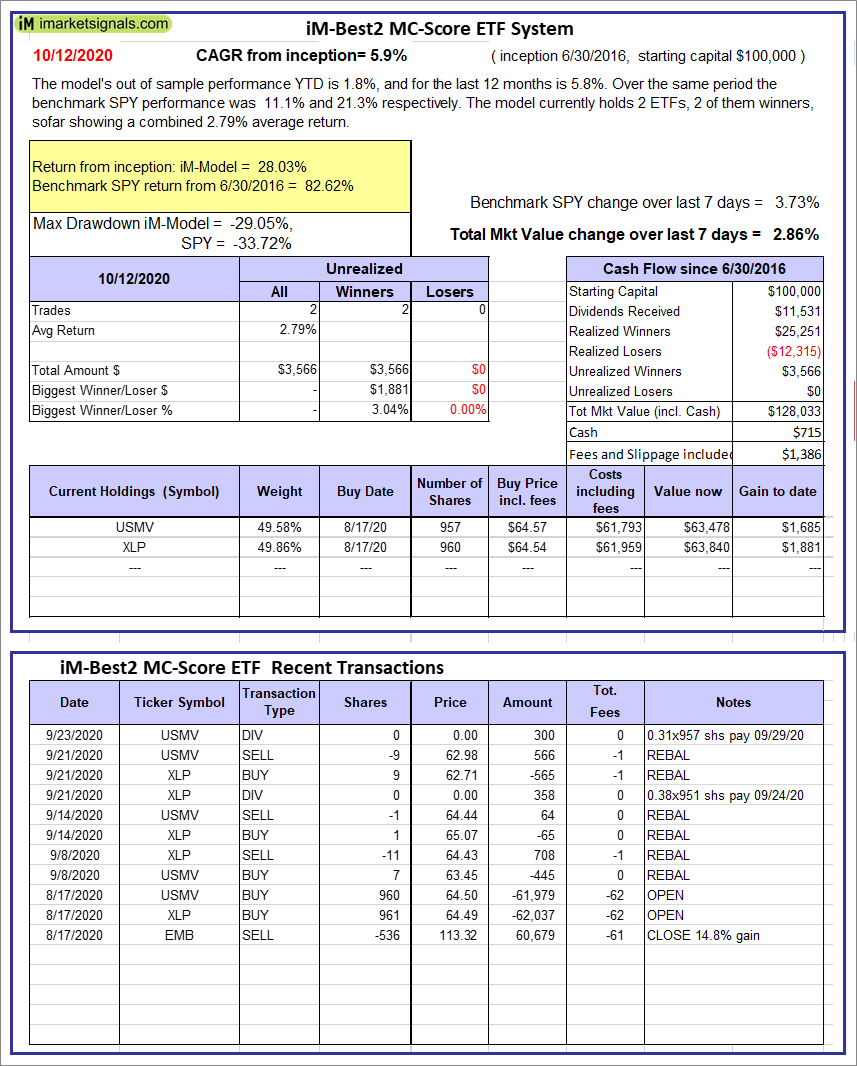 |
iM-Best2 MC-Score ETF System: The model’s out of sample performance YTD is 1.8%, and for the last 12 months is 5.8%. Over the same period the benchmark SPY performance was 11.1% and 21.3% respectively. Over the previous week the market value of the iM-Best2 MC-Score ETF System gained 2.86% at a time when SPY gained 3.73%. A starting capital of $100,000 at inception on 6/30/2016 would have grown to $128,033 which includes $715 cash and excludes $1,386 spent on fees and slippage. |
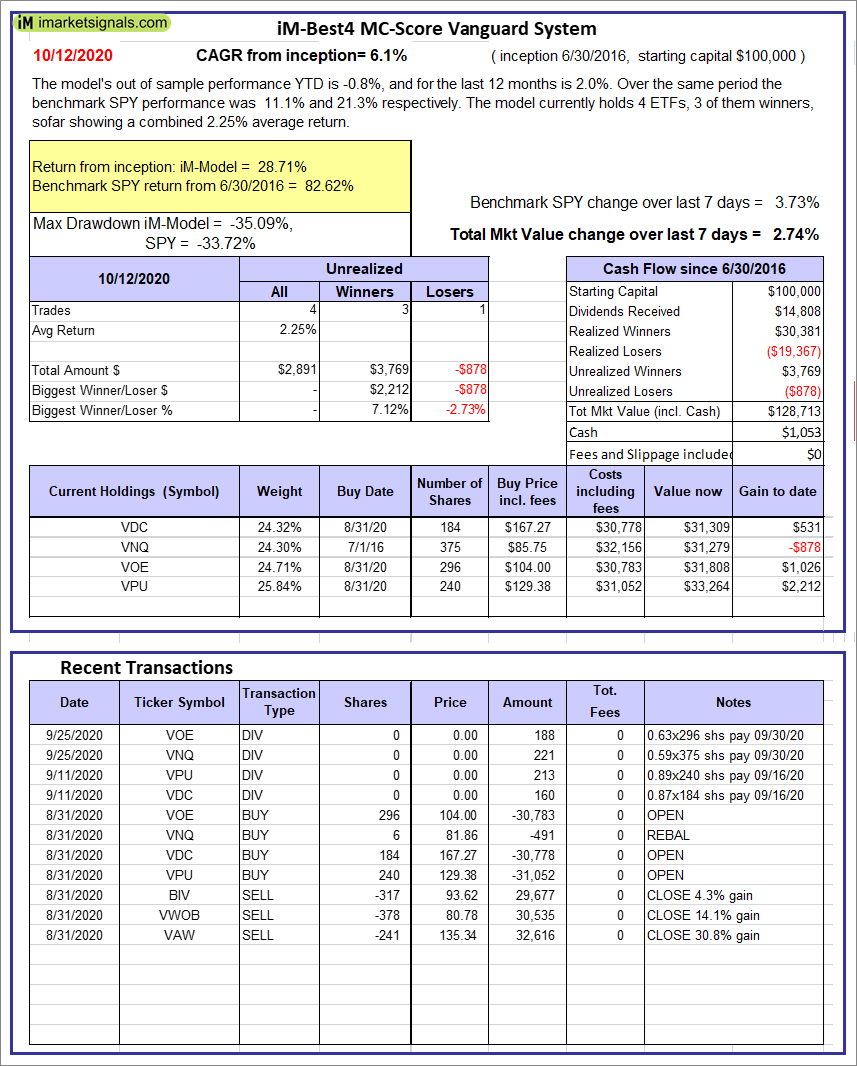 |
iM-Best4 MC-Score Vanguard System: The model’s out of sample performance YTD is -0.8%, and for the last 12 months is 2.0%. Over the same period the benchmark SPY performance was 11.1% and 21.3% respectively. Over the previous week the market value of the iM-Best4 MC-Score Vanguard System gained 2.74% at a time when SPY gained 3.73%. A starting capital of $100,000 at inception on 6/30/2016 would have grown to $128,713 which includes $1,053 cash and excludes $00 spent on fees and slippage. |
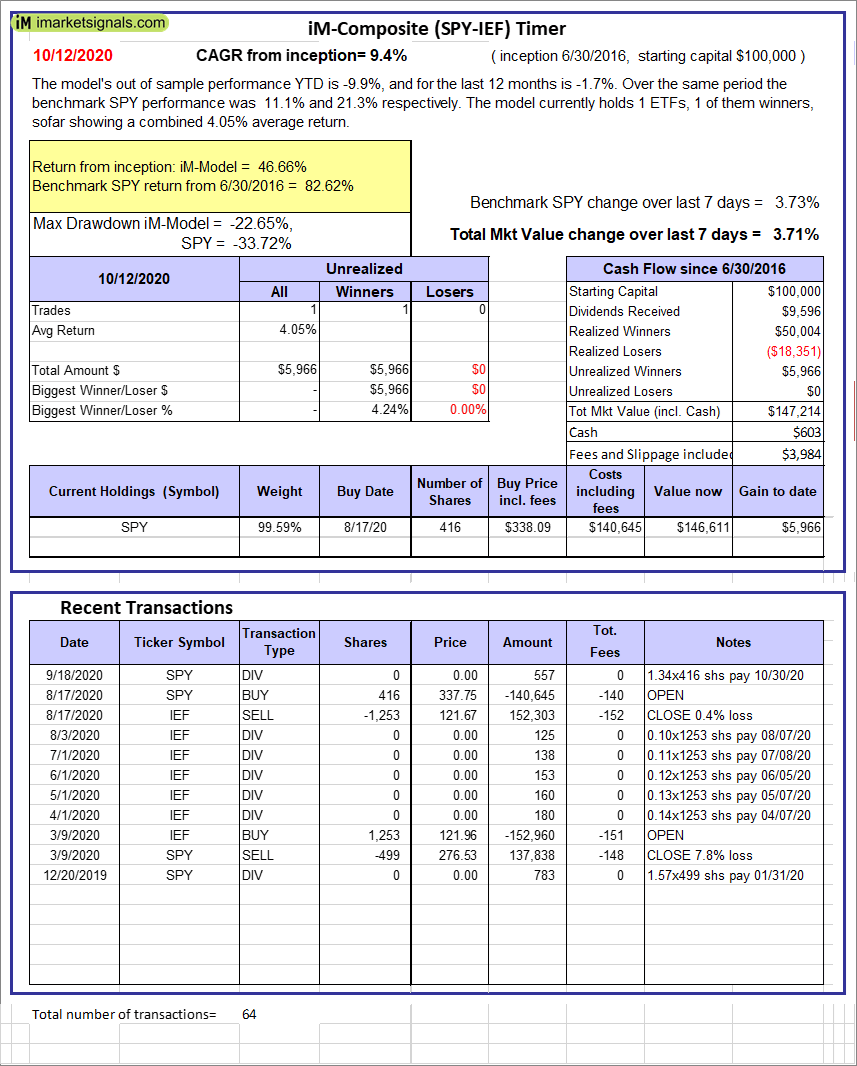 |
iM-Composite (SPY-IEF) Timer: The model’s out of sample performance YTD is -9.9%, and for the last 12 months is -1.7%. Over the same period the benchmark SPY performance was 11.1% and 21.3% respectively. Over the previous week the market value of the iM-Composite (SPY-IEF) Timer gained 3.71% at a time when SPY gained 3.73%. A starting capital of $100,000 at inception on 6/30/2016 would have grown to $147,214 which includes $603 cash and excludes $3,984 spent on fees and slippage. |
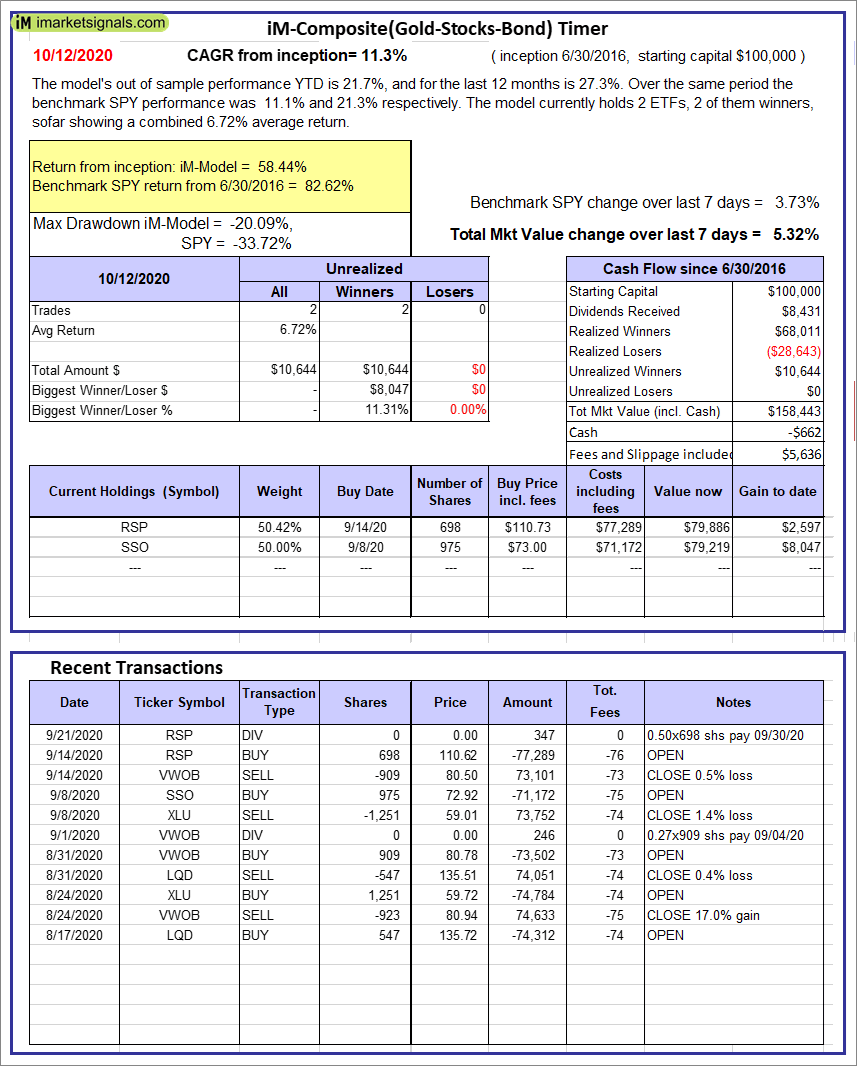 |
iM-Composite(Gold-Stocks-Bond) Timer: The model’s out of sample performance YTD is 21.7%, and for the last 12 months is 27.3%. Over the same period the benchmark SPY performance was 11.1% and 21.3% respectively. Over the previous week the market value of the iM-Composite(Gold-Stocks-Bond) Timer gained 5.32% at a time when SPY gained 3.73%. A starting capital of $100,000 at inception on 6/30/2016 would have grown to $158,443 which includes -$662 cash and excludes $5,636 spent on fees and slippage. |
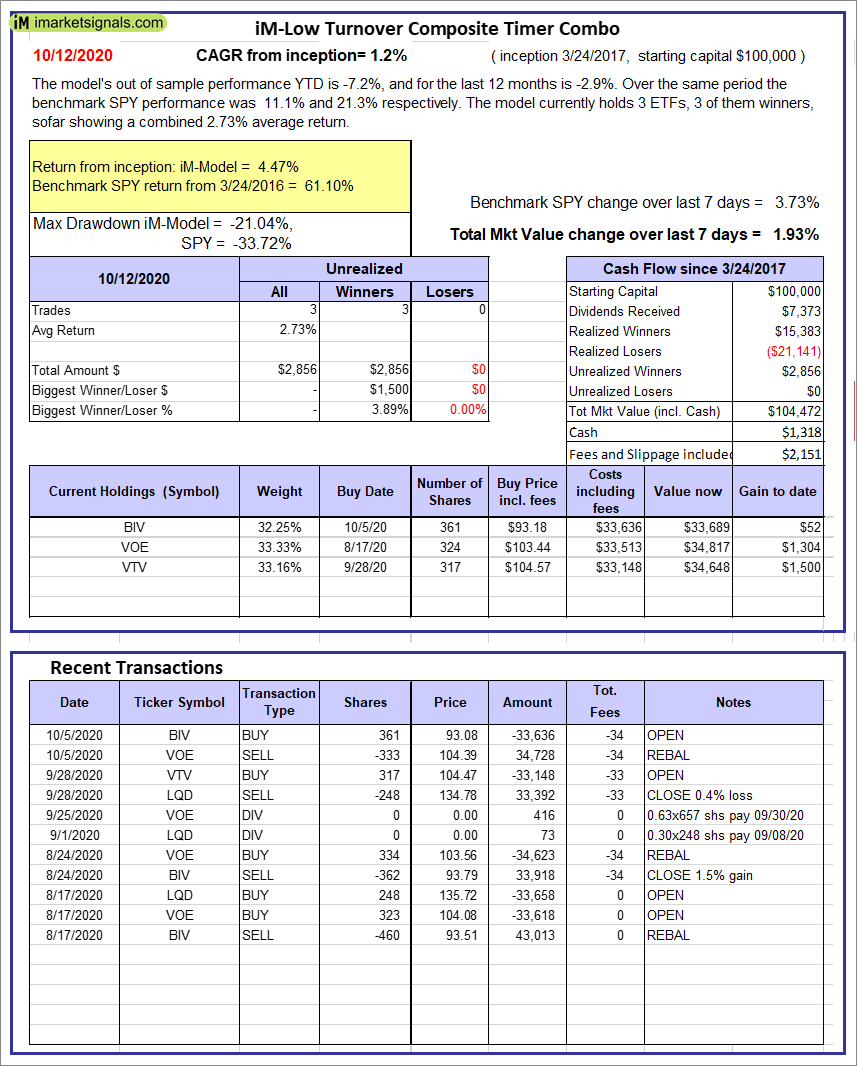 |
iM-Low Turnover Composite Timer Combo: The model’s out of sample performance YTD is -7.2%, and for the last 12 months is -2.9%. Over the same period the benchmark SPY performance was 11.1% and 21.3% respectively. Over the previous week the market value of the iM-Low Turnover Composite Timer Combo gained 1.93% at a time when SPY gained 3.73%. A starting capital of $100,000 at inception on 3/24/2017 would have grown to $104,472 which includes $1,318 cash and excludes $2,151 spent on fees and slippage. |
iM-Best Reports – 10/12/2020
Posted in pmp SPY-SH
Leave a Reply
You must be logged in to post a comment.