- In February 2018 Vanguard released a set of five actively managed sector ETF’s and one multi-factor ETF. Here we report on the performance of the Momentum Factor ETF (VFMO).
- Shortly after the inception of VFMO we published this article “Why Not To Invest In Vanguard’s New U.S. Momentum Factor ETF” which demonstrated that Vanguard’s selection criteria was flawed.
- In the referenced article we stated that it was unlikely that VFMO will show a higher return than the SPDR S&P 500 ETF (SPY) over the year following inception.
Vanguard’s selection strategy
The investment strategy described in VFMO’s prospectus is to target primarily U.S. common stocks (from the Russell 3000 Index) with strong recent performance, which have tended to earn a higher return than those with weak recent performance.
There was no evidence given why stocks with strong recent performance will earn a higher return going forward than those with a weaker recent performance.
The opposite applies: Bob Farrell’s rule 1 states: “Markets tend to return to the mean over time. When stocks go too far in one direction, they come back.”
Testing Vanguard’s selection strategy
In the above referenced article we showed why Vanguard’s rule based strategy would not work by testing the historic performance of hypothetical models whose holdings were selected according to rules similar to that of Vanguard. Our conclusion then did not support Vanguard’s unsubstantiated claim that stocks with strong recent performance have tended to earn a higher return than those with weak recent performance.
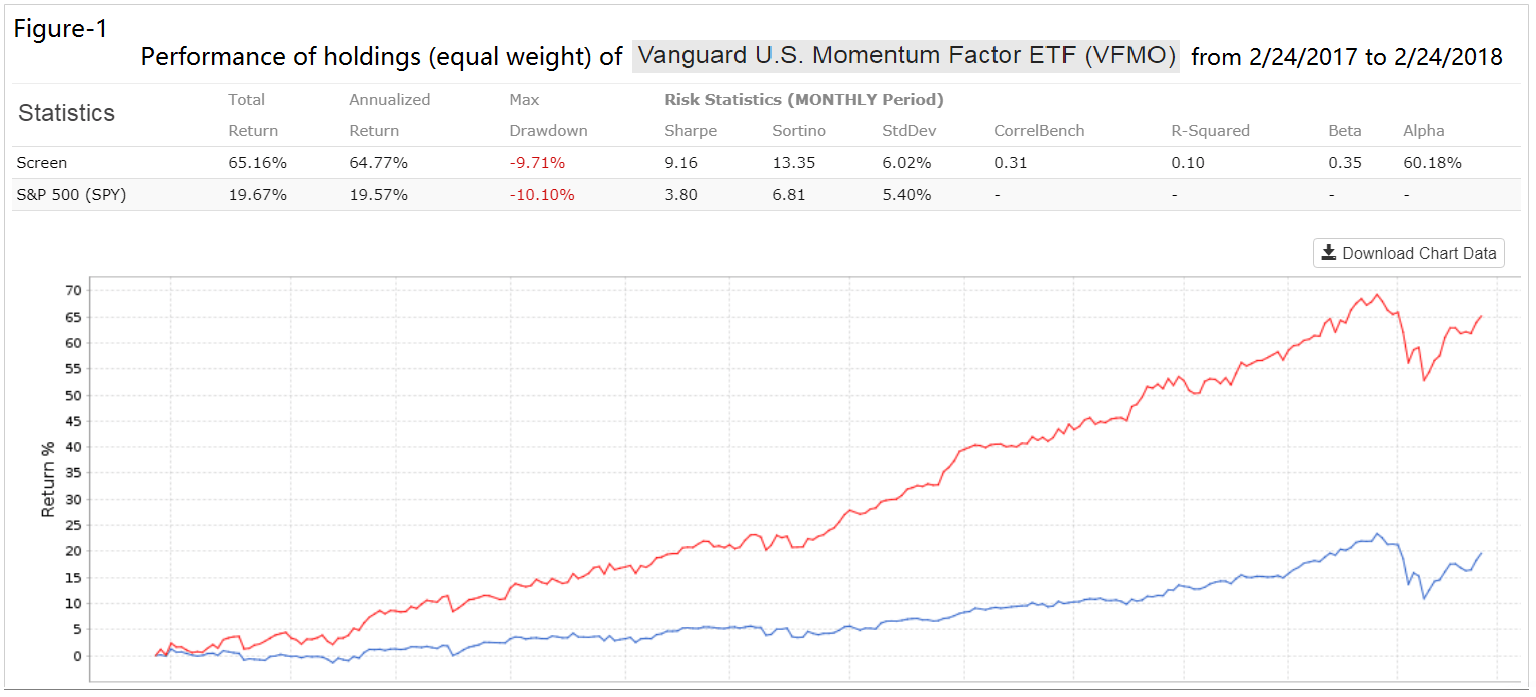
Figure-1 shows the performance of VFMO’s holdings at inception over the preceding year, from 2/24/2017 to 2/24/2018. The historic data comes from Portfolio 123 and is for an equal weighted portfolio of over 600 stocks which the fund then held. The 1-year return was a staggering 65%, versus about 20% for the benchmark SPY.
So if Vanguard’s selection rules were correct than one would expect higher returns from these holdings going forward, but that did not happen.
Actual performance of VFMO
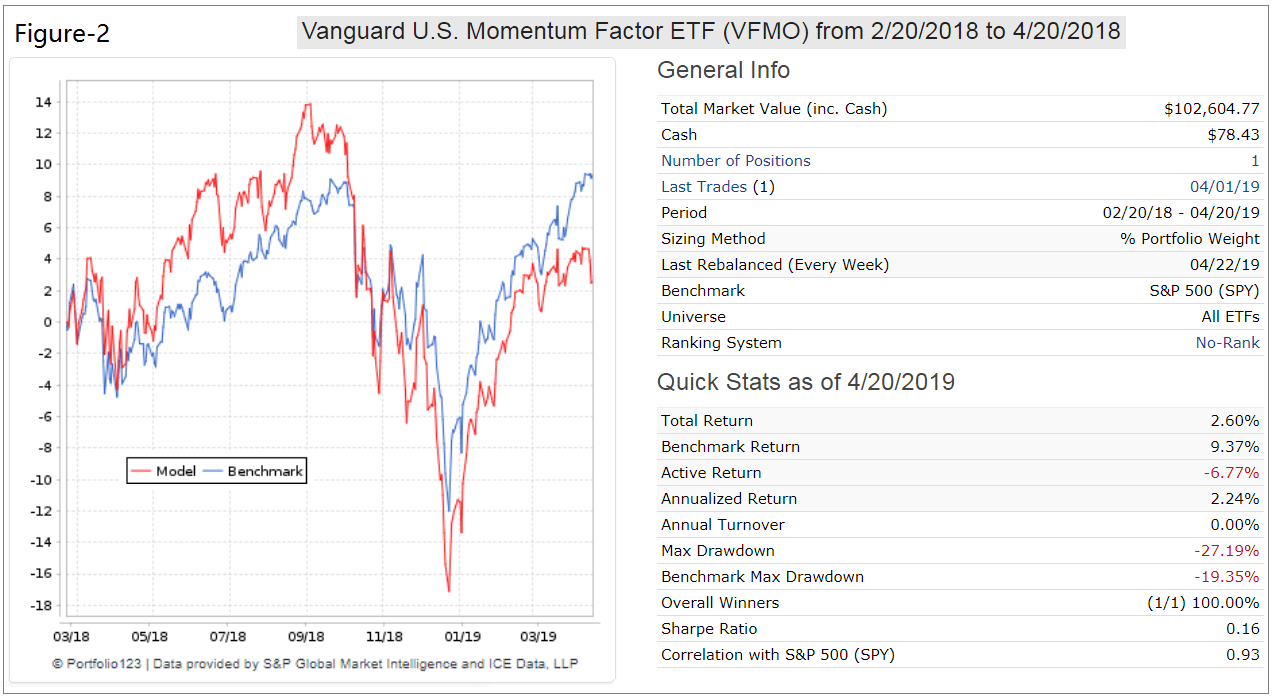
It is now more than one year after the inception date of VFMO. The performance of VFMO from inception to April 2018 is shown in Figure-2 below and compared to the performance of SPY. As expected VFMO under-performed SPY. The total return for VFMO was 2.60% versus 9.37% for SPY. The Russell 3000 ETF (IWV), from which VFMO’s holdings come from, returned 8.85%.
The lower performance of VFMO relative to the Russell 3000 ETF and the S&P 500 ETF confirms our forecast from more than a year ago, namely that VFMO would under-perform the broader market over the following year.
1-year performance of current holdings
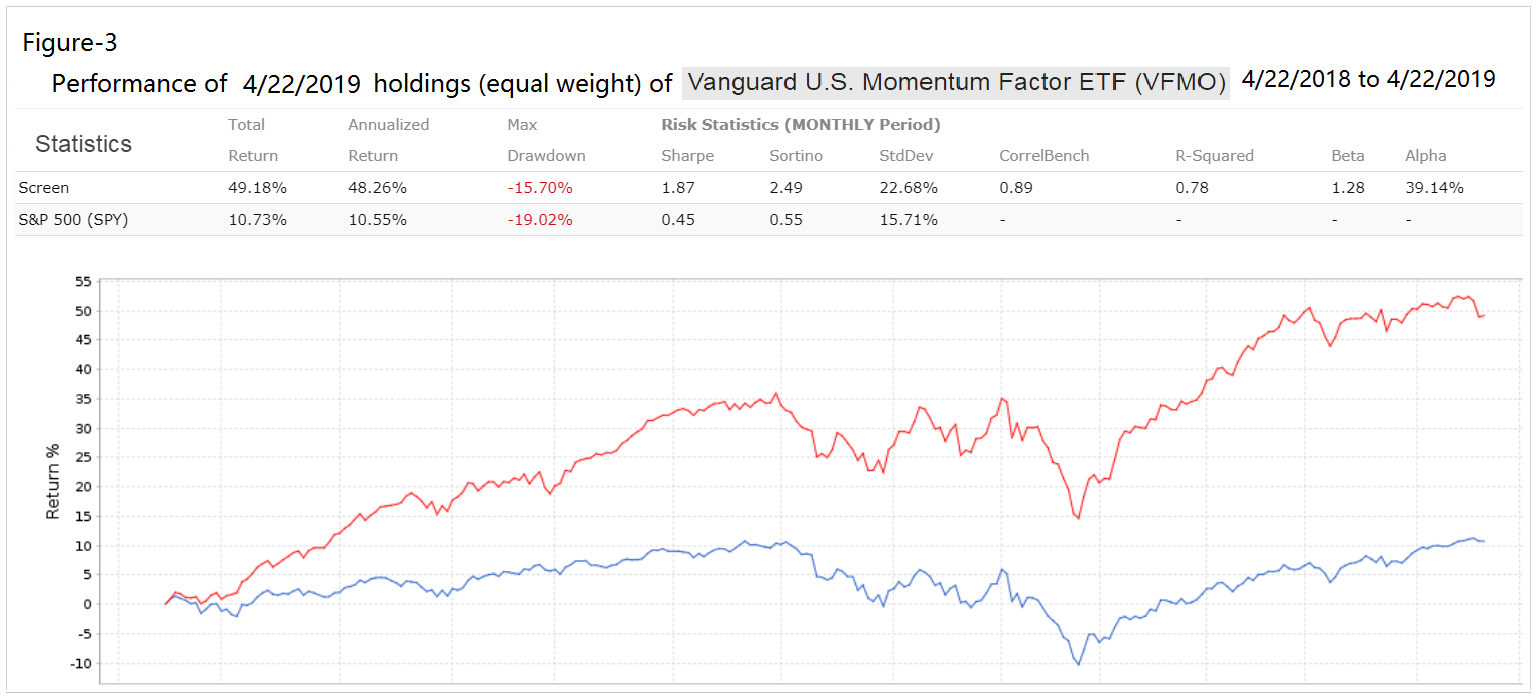
Figure-3 shows the performance of VFMO’s holdings as of 4/22/2019 over the preceding year, from 2/22/2018 to 2/22/2019. The historic data comes from Portfolio 123 and is for an equal weighted portfolio which the fund now holds. The 1-year return of this would have been 49.2%, versus 10.7%% for the benchmark SPY.
This high return confirms that Vanguard selection rules have not changed despite the mediocre performance since inception. We are looking forward to see how VFMO will perform over the next year. Our expectation has not changed from before; we believe that VFMO will underperform SPY again to April 2020.
Conclusion
Vanguards selection strategy to target stocks with strong recent performance in the hope that they will continue to perform better is flawed.
The actual performance of this fund so far, and the previous analyses presented in the referenced article clearly show that the most recent winners may be the ones most vulnerable in the future.


Leave a Reply
You must be logged in to post a comment.