
  |
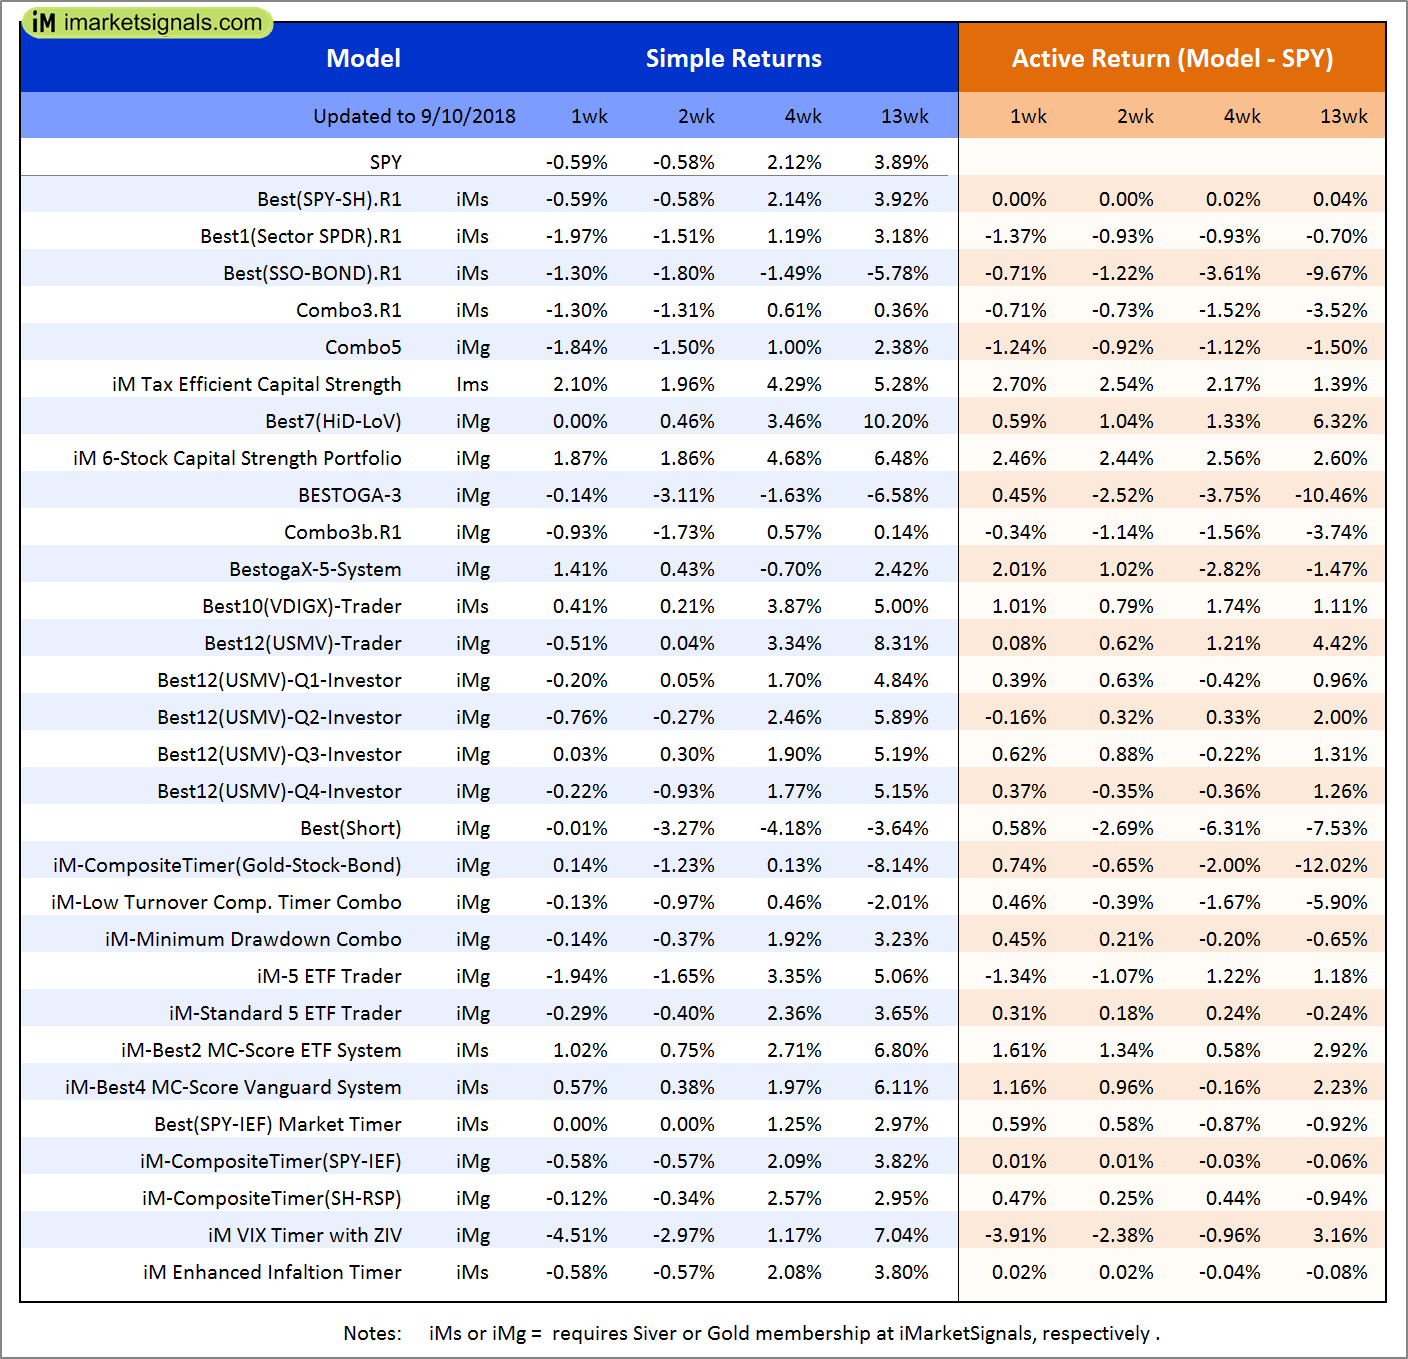
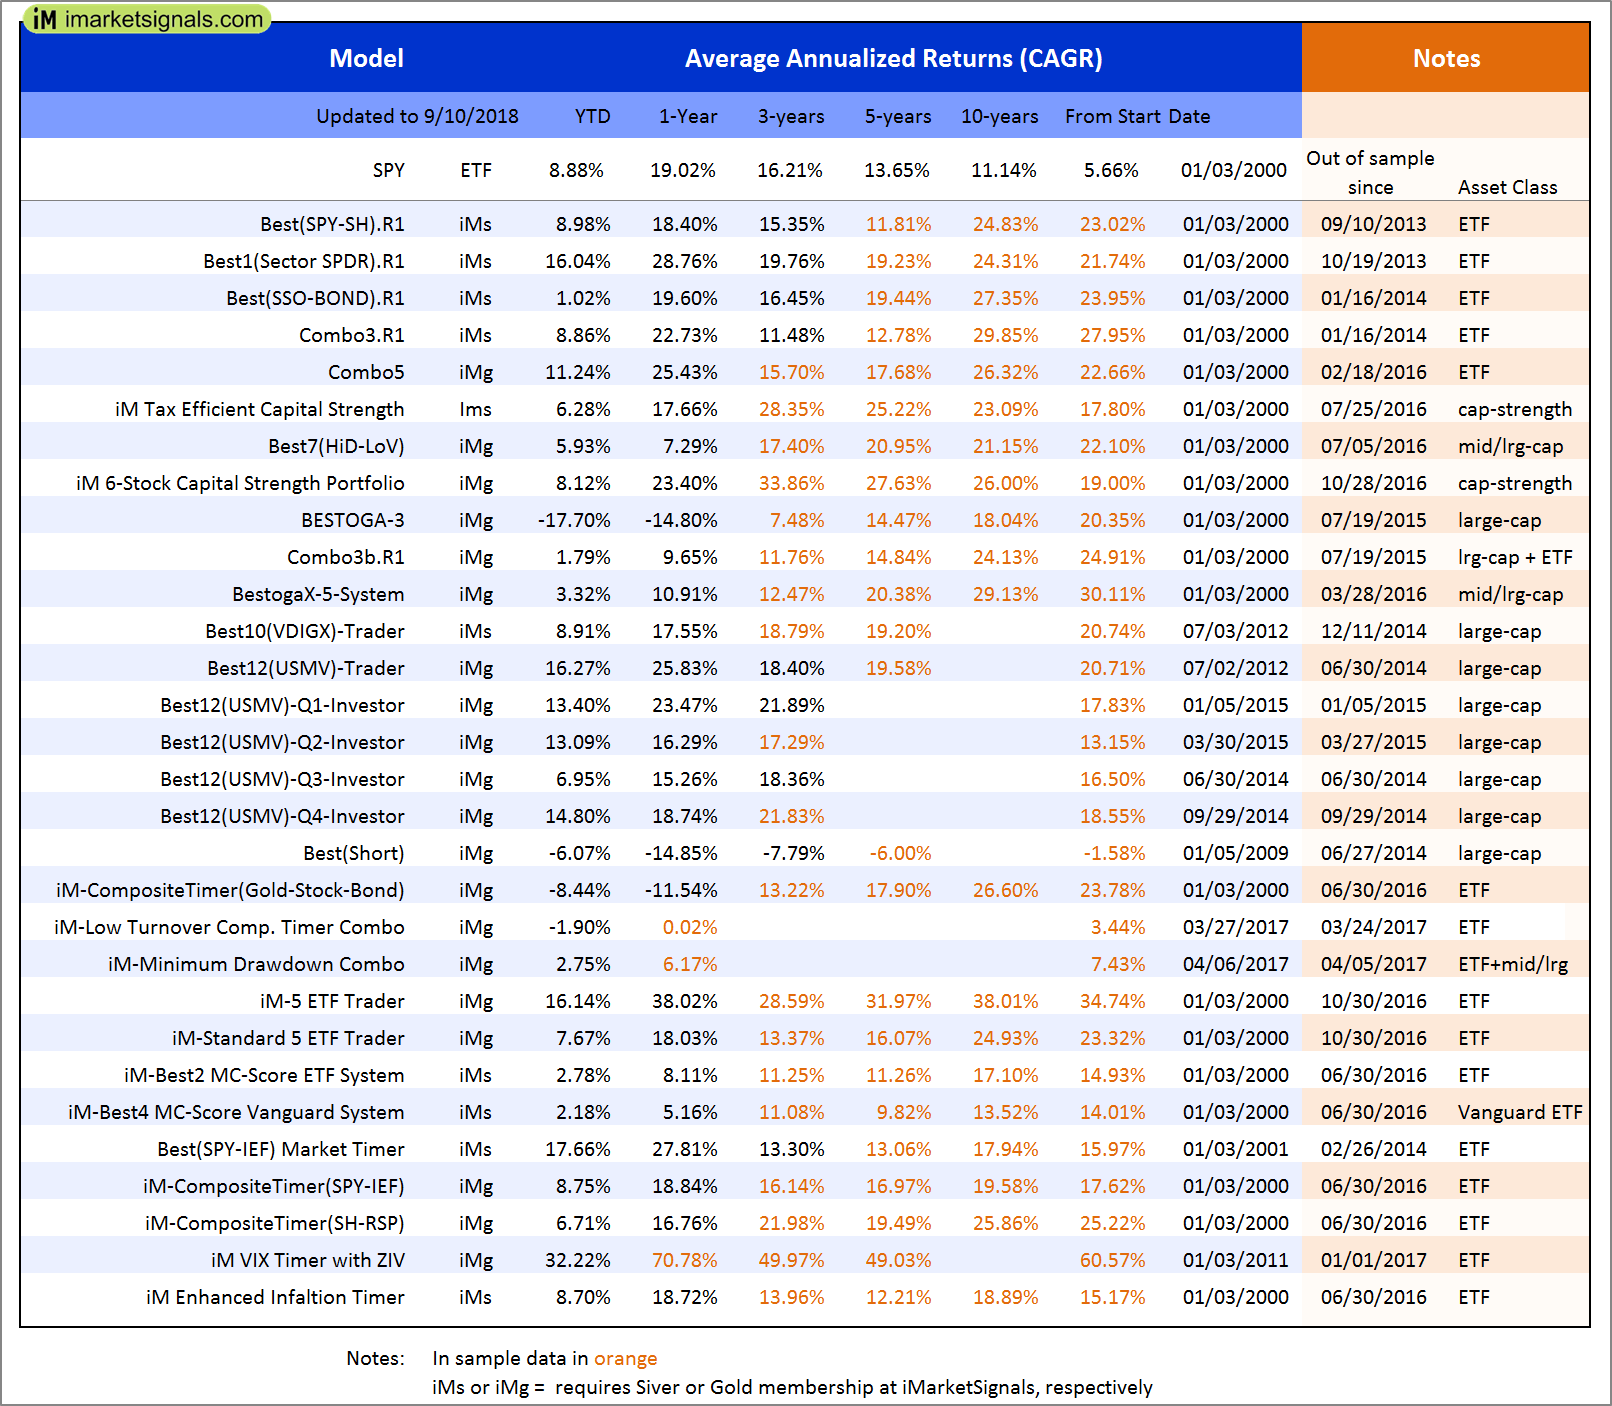
Out of sample performance summary of our models for the past 1, 2, 4 and 13 week periods. The active active return indicates how the models over- or underperformed the benchmark ETF SPY. Also the YTD, and the 1-, 3-, 5- and 10-year annualized returns are shown in the second table |
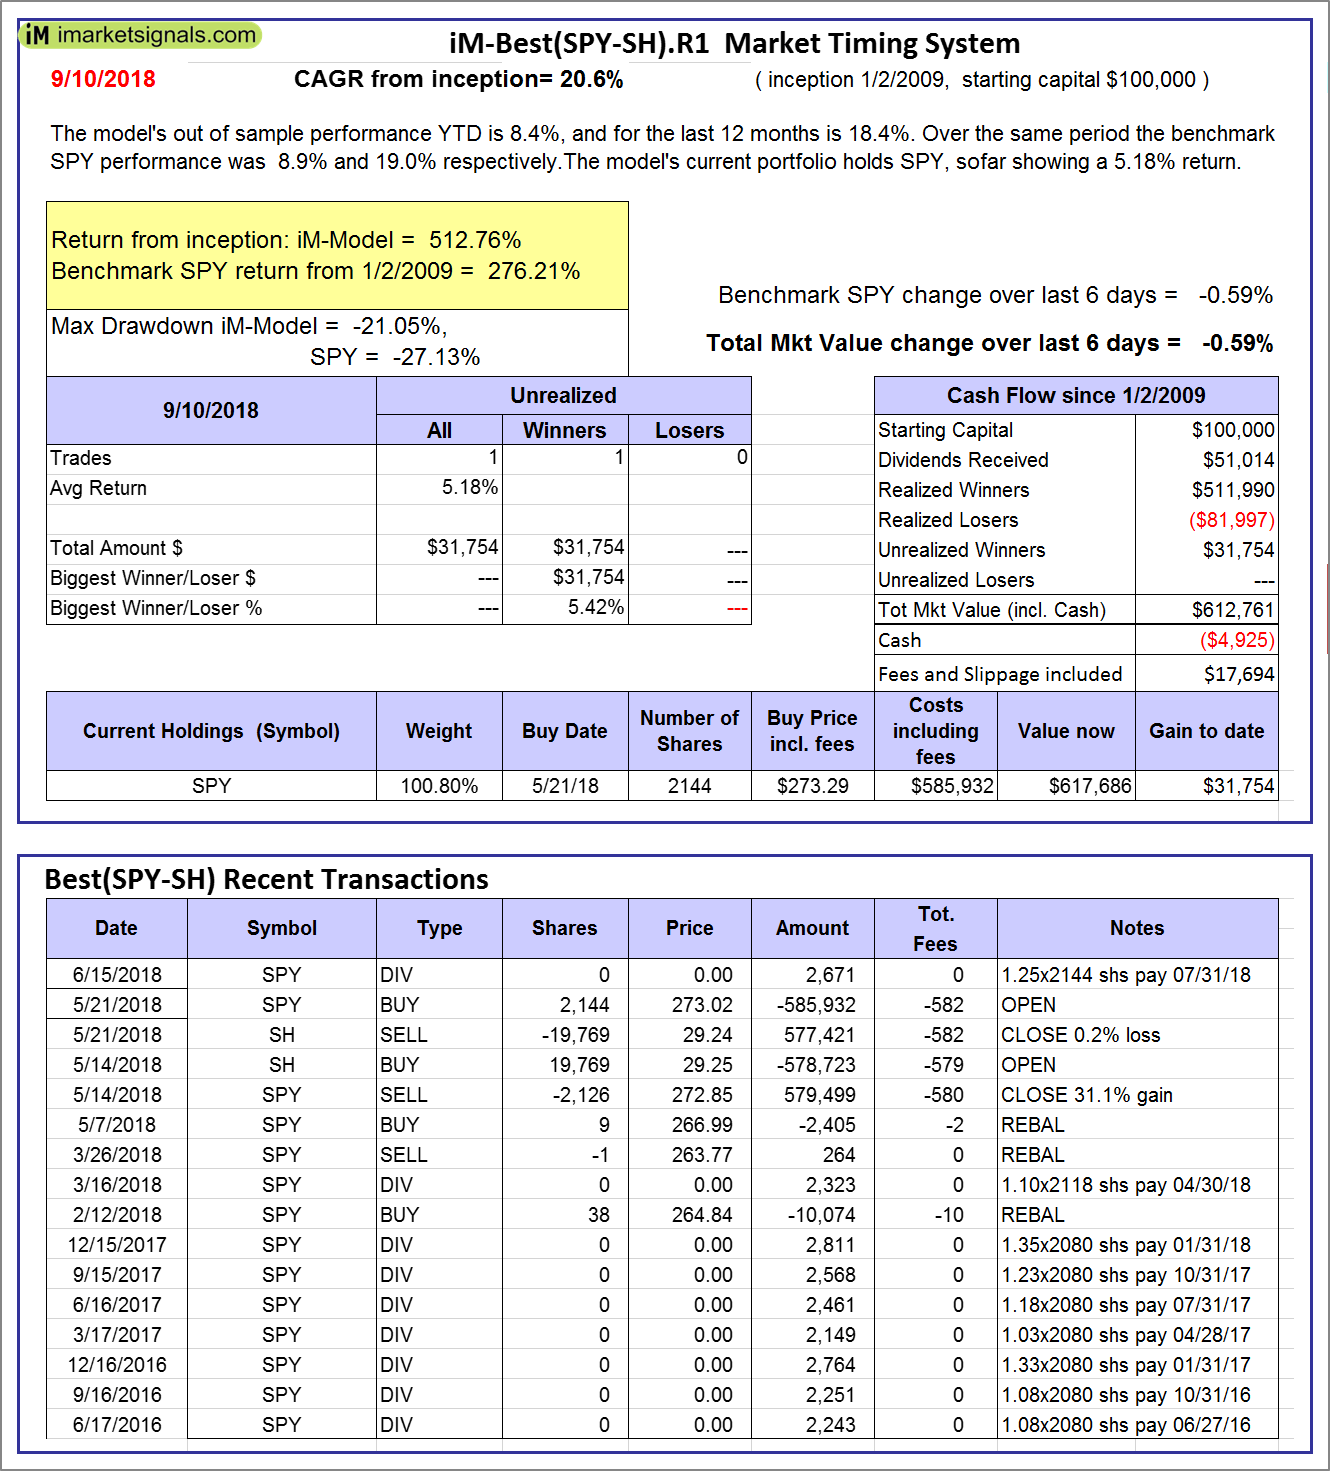 |
iM-Best(SPY-SH).R1: The model’s out of sample performance YTD is 8.4%, and for the last 12 months is 18.4%. Over the same period the benchmark SPY performance was 8.9% and 19.0% respectively. Over the previous week the market value of Best(SPY-SH) gained -0.59% at a time when SPY gained -0.59%. A starting capital of $100,000 at inception on 1/2/2009 would have grown to $612,761 which includes -$4,925 cash and excludes $17,694 spent on fees and slippage. |
 |
iM-Combo3.R1: The model’s out of sample performance YTD is 8.6%, and for the last 12 months is 22.7%. Over the same period the benchmark SPY performance was 8.9% and 19.0% respectively. Over the previous week the market value of iM-Combo3.R1 gained -1.30% at a time when SPY gained -0.59%. A starting capital of $100,000 at inception on 2/3/2014 would have grown to $171,647 which includes -$1,119 cash and excludes $4,125 spent on fees and slippage. |
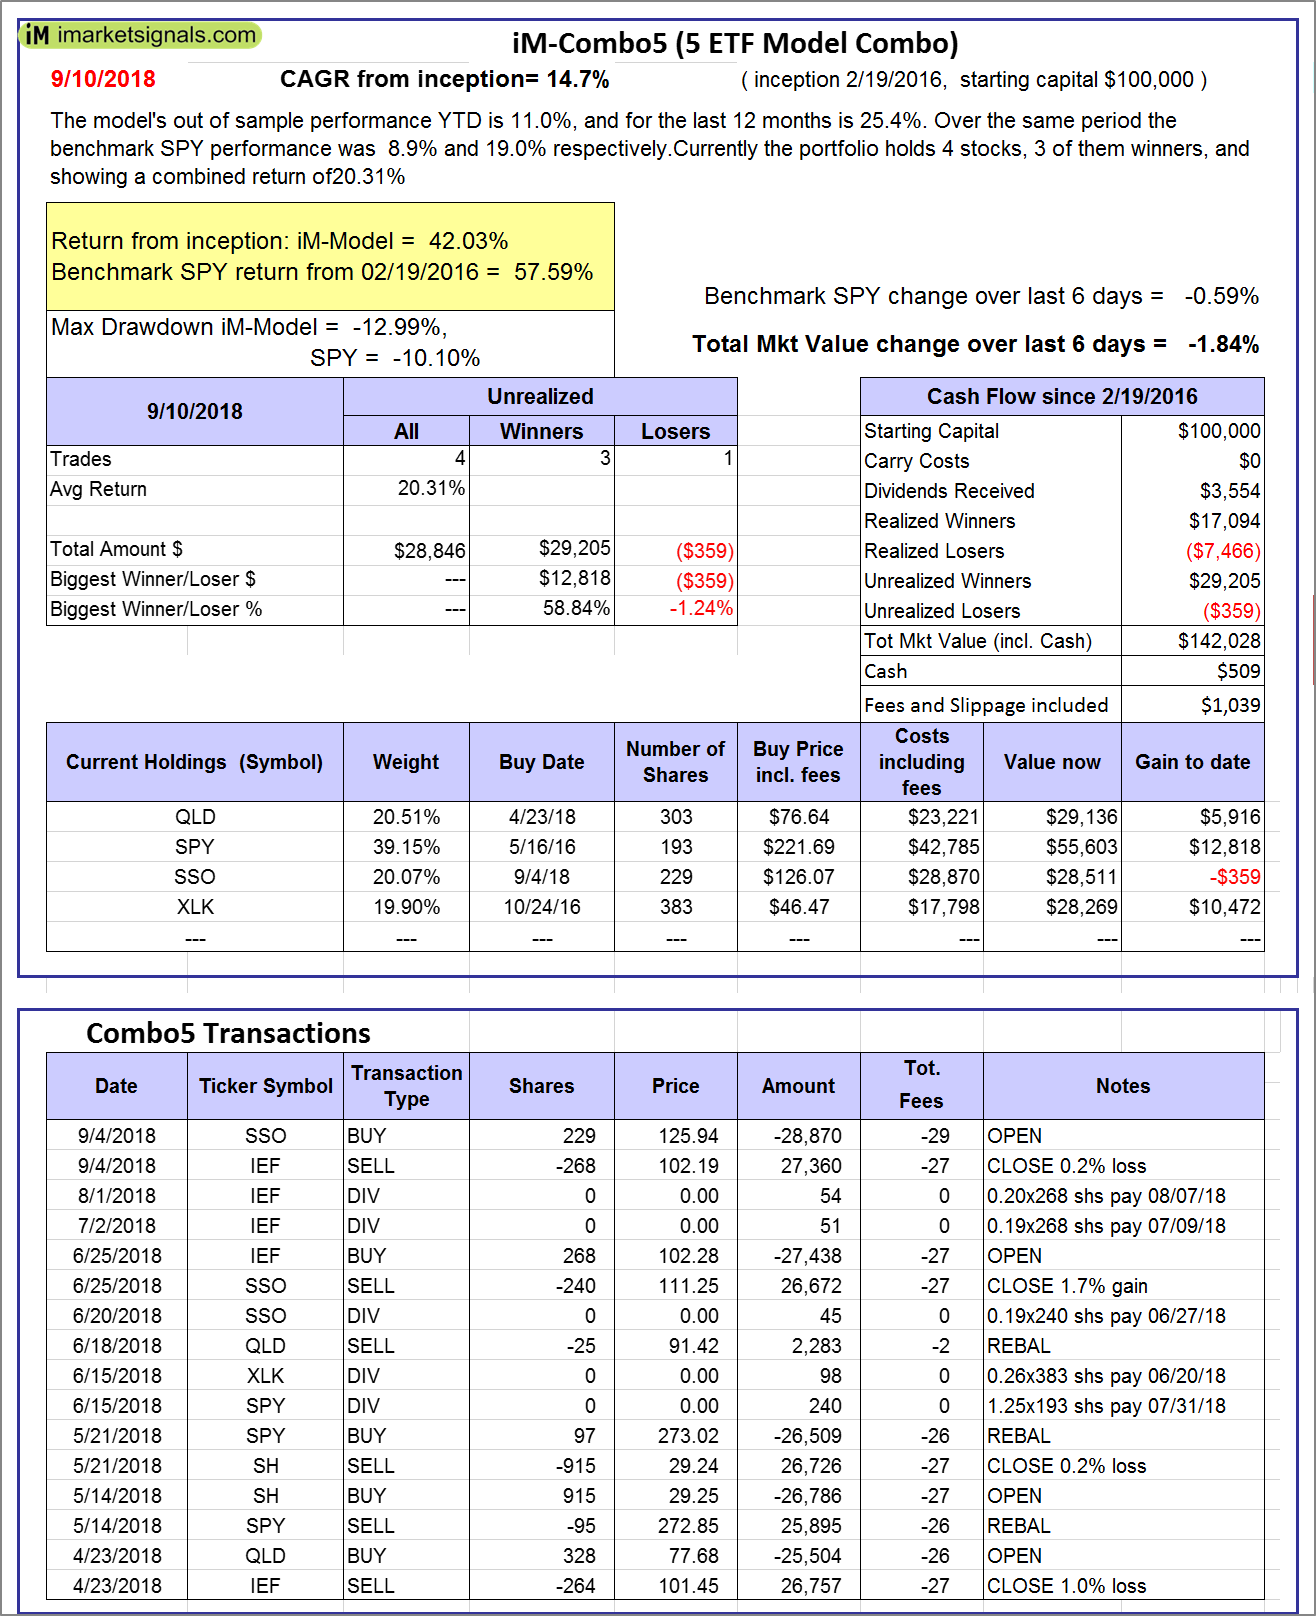 |
iM-Combo5: The model’s out of sample performance YTD is 11.0%, and for the last 12 months is 25.4%. Over the same period the benchmark SPY performance was 8.9% and 19.0% respectively. Over the previous week the market value of iM-Combo5 gained -1.84% at a time when SPY gained -0.59%. A starting capital of $100,000 at inception on 2/22/2016 would have grown to $142,028 which includes $509 cash and excludes $1,039 spent on fees and slippage. |
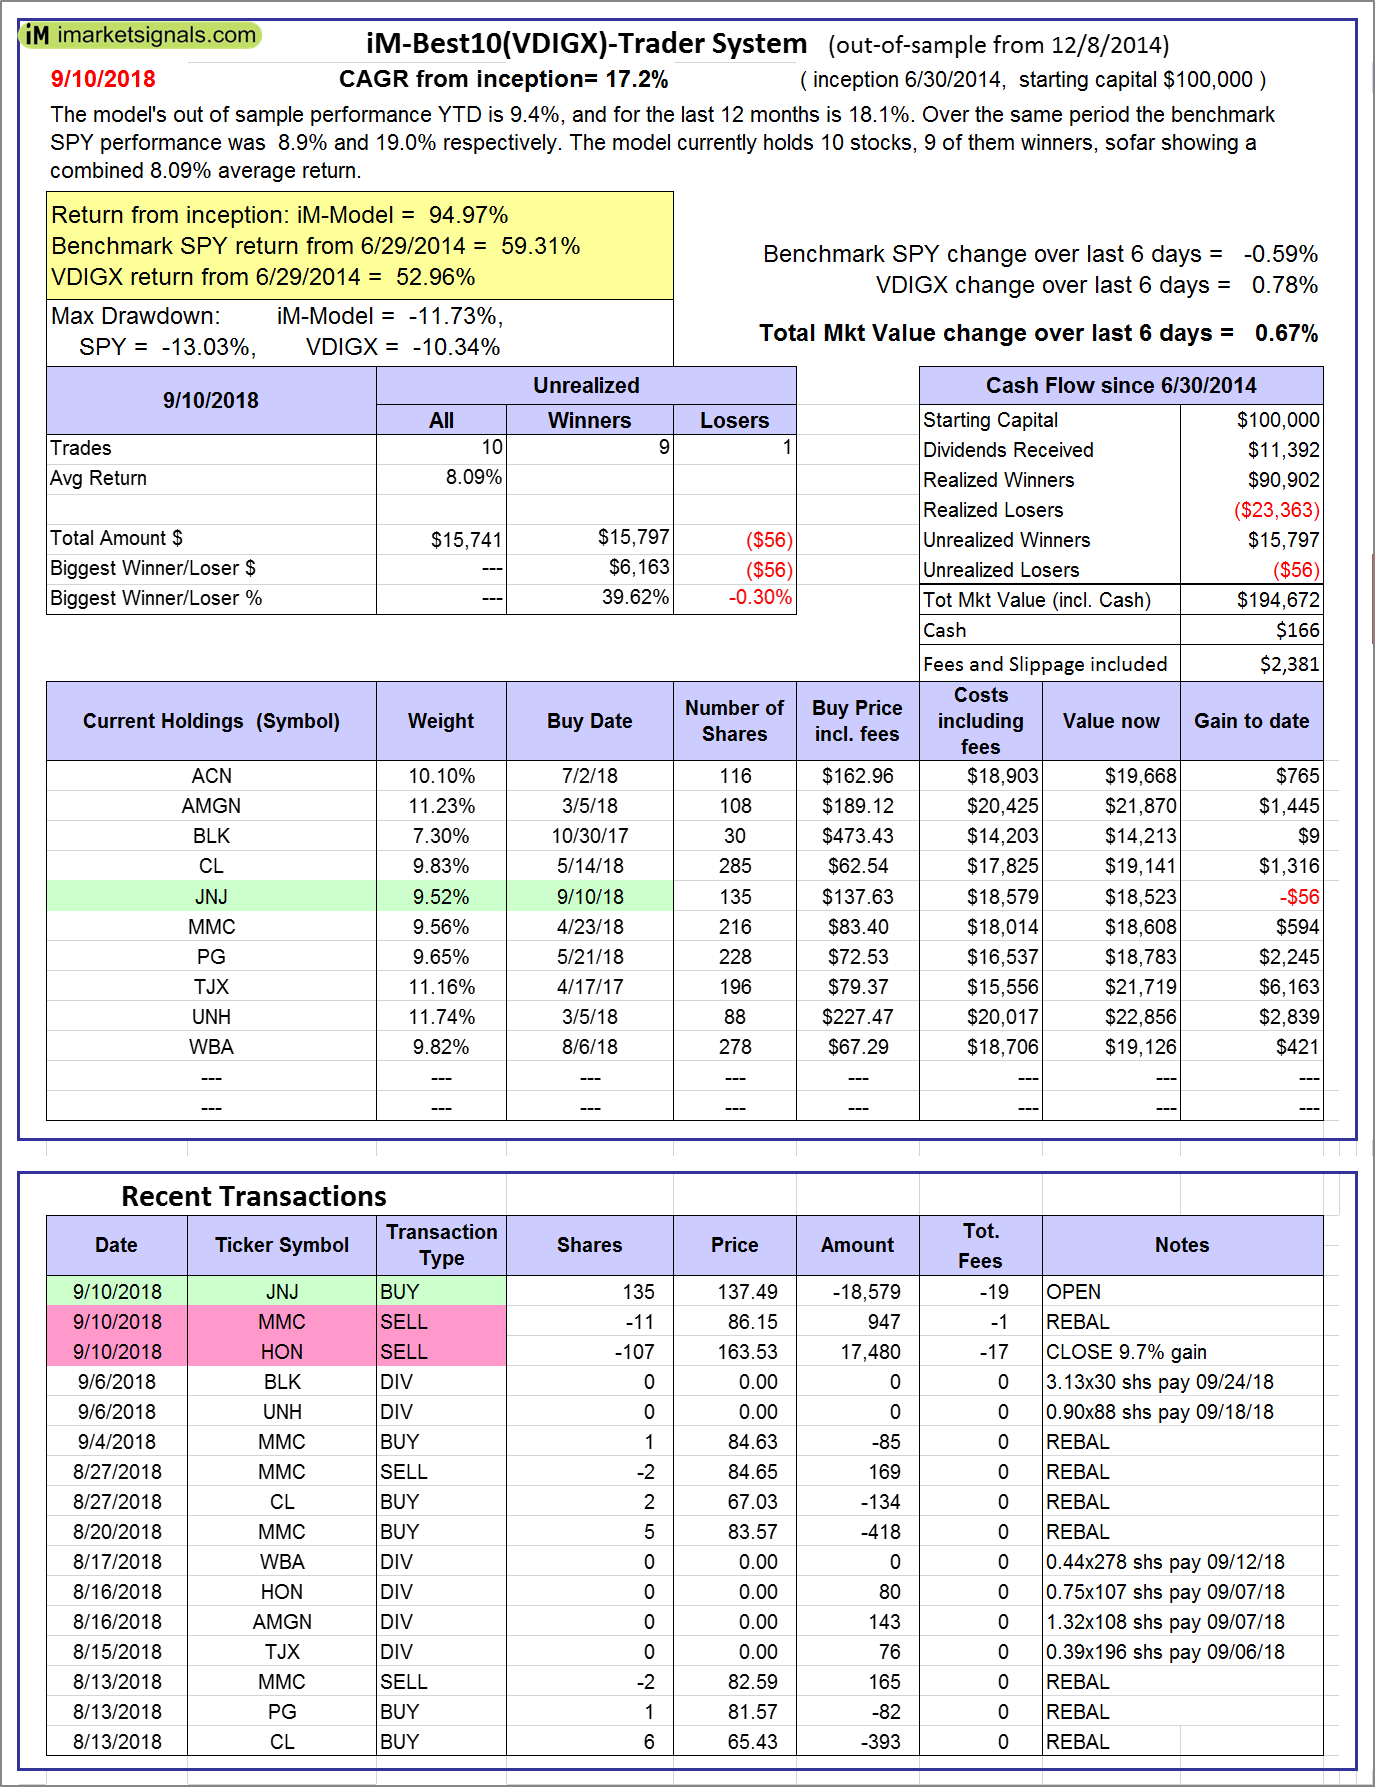 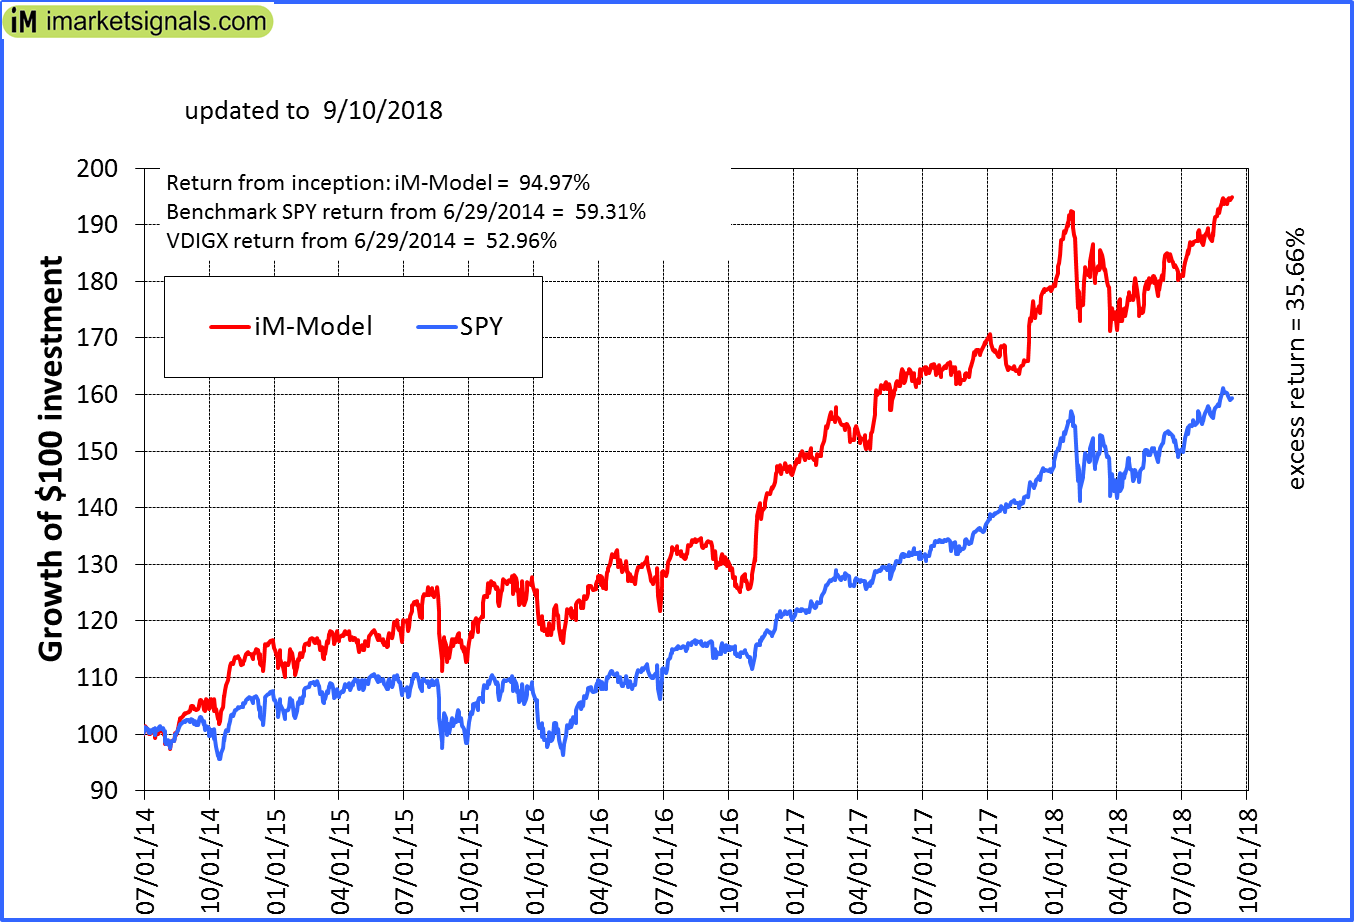 |
iM-Best10(VDIGX)-Trader: The model’s out of sample performance YTD is 9.4%, and for the last 12 months is 18.1%. Over the same period the benchmark SPY performance was 8.9% and 19.0% respectively. Since inception, on 7/1/2014, the model gained 94.97% while the benchmark SPY gained 59.31% and VDIGX gained 52.96% over the same period. Over the previous week the market value of iM-Best10(VDIGX) gained 0.67% at a time when SPY gained -0.59%. A starting capital of $100,000 at inception on 7/1/2014 would have grown to $194,672 which includes $166 cash and excludes $2,381 spent on fees and slippage. |
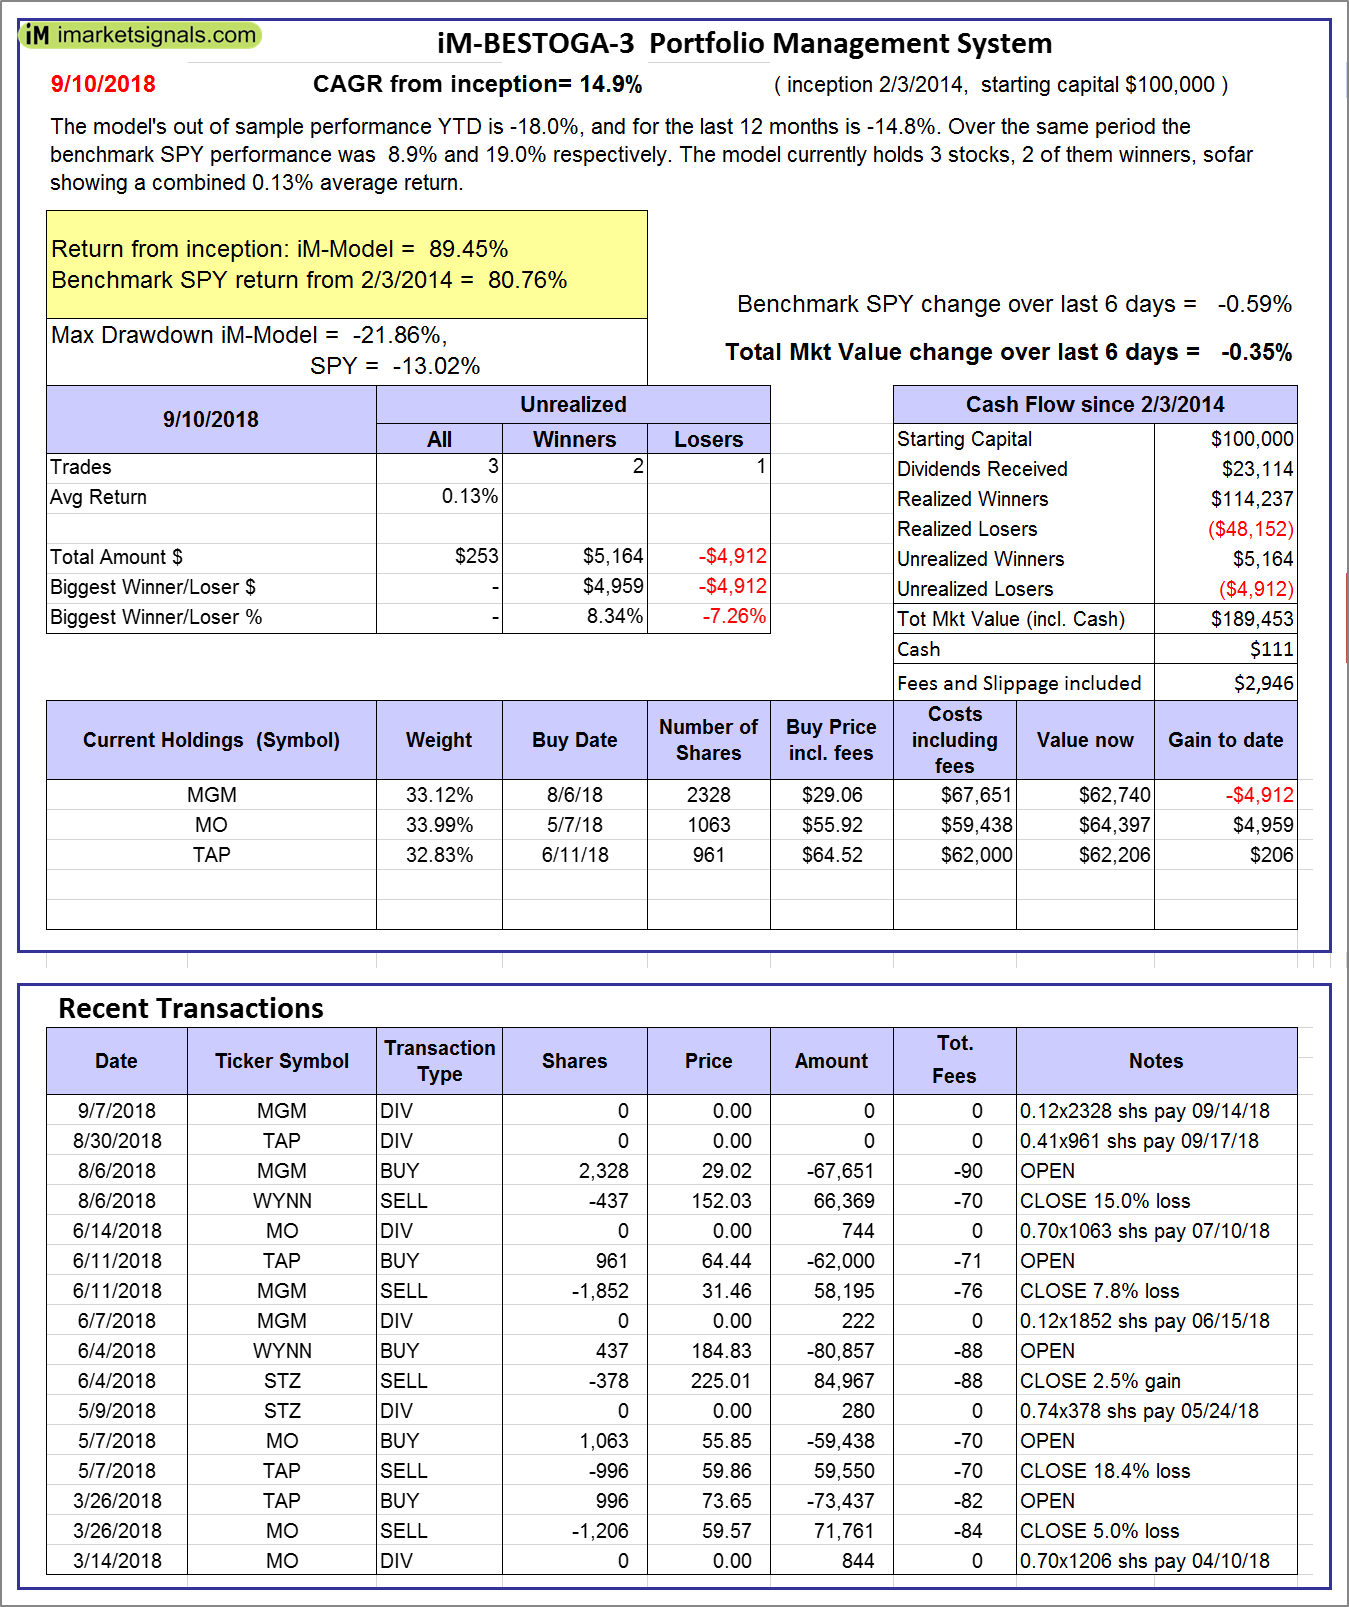 |
iM-BESTOGA-3: The model’s out of sample performance YTD is -18.0%, and for the last 12 months is -14.8%. Over the same period the benchmark SPY performance was 8.9% and 19.0% respectively. Over the previous week the market value of iM-BESTOGA-3 gained -0.35% at a time when SPY gained -0.59%. A starting capital of $100,000 at inception on 2/3/2014 would have grown to $189,453 which includes $111 cash and excludes $2,946 spent on fees and slippage. |
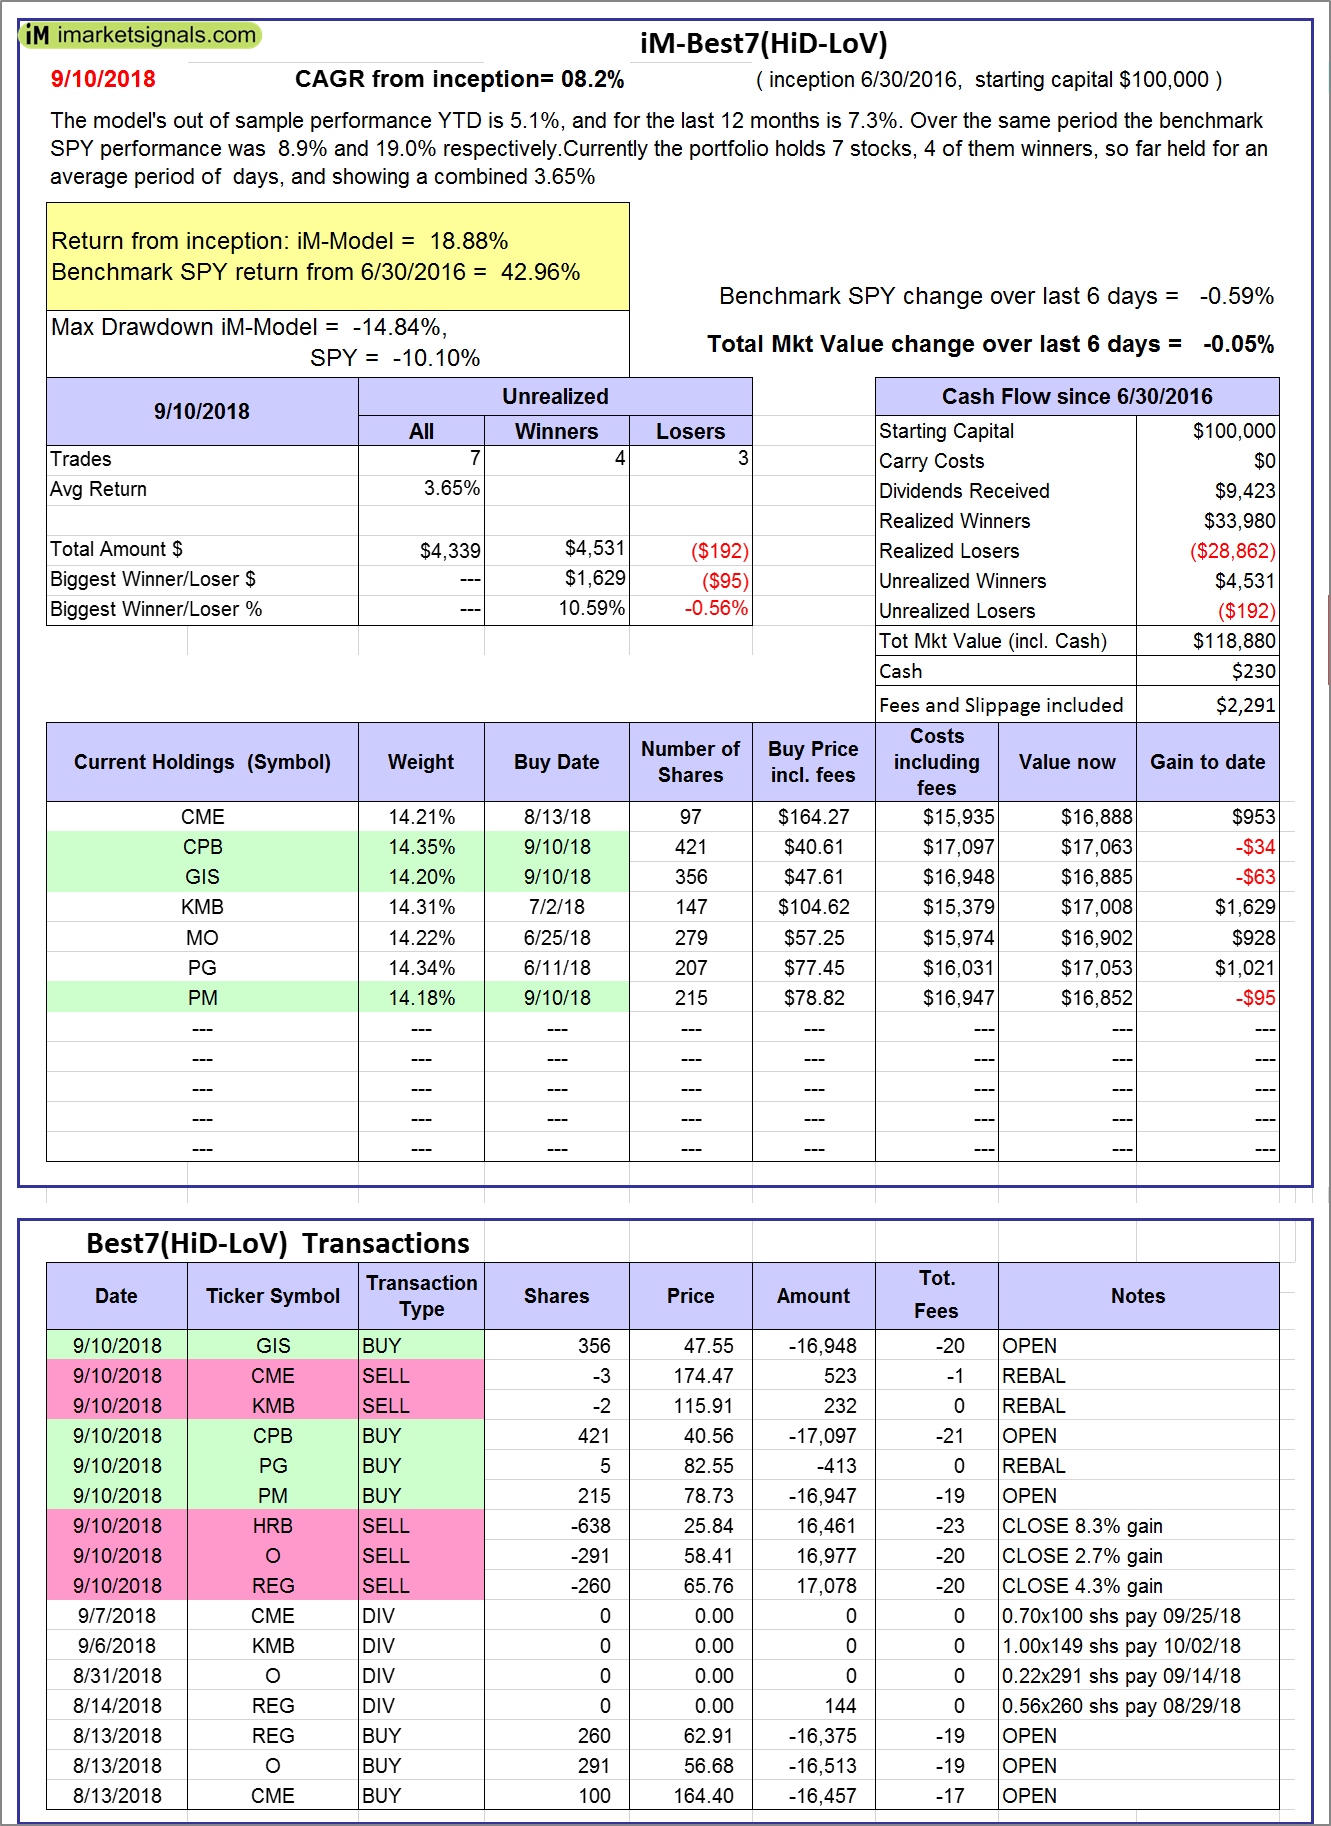 |
iM-Best7(HiD-LoV): The model’s out of sample performance YTD is 5.1%, and for the last 12 months is 7.3%. Over the same period the benchmark SPY performance was 8.9% and 19.0% respectively. Over the previous week the market value of iM-BESTOGA-3 gained -0.05% at a time when SPY gained -0.59%. A starting capital of $100,000 at inception on 6/30/2016 would have grown to $118,880 which includes $230 cash and excludes $2,291 spent on fees and slippage. |
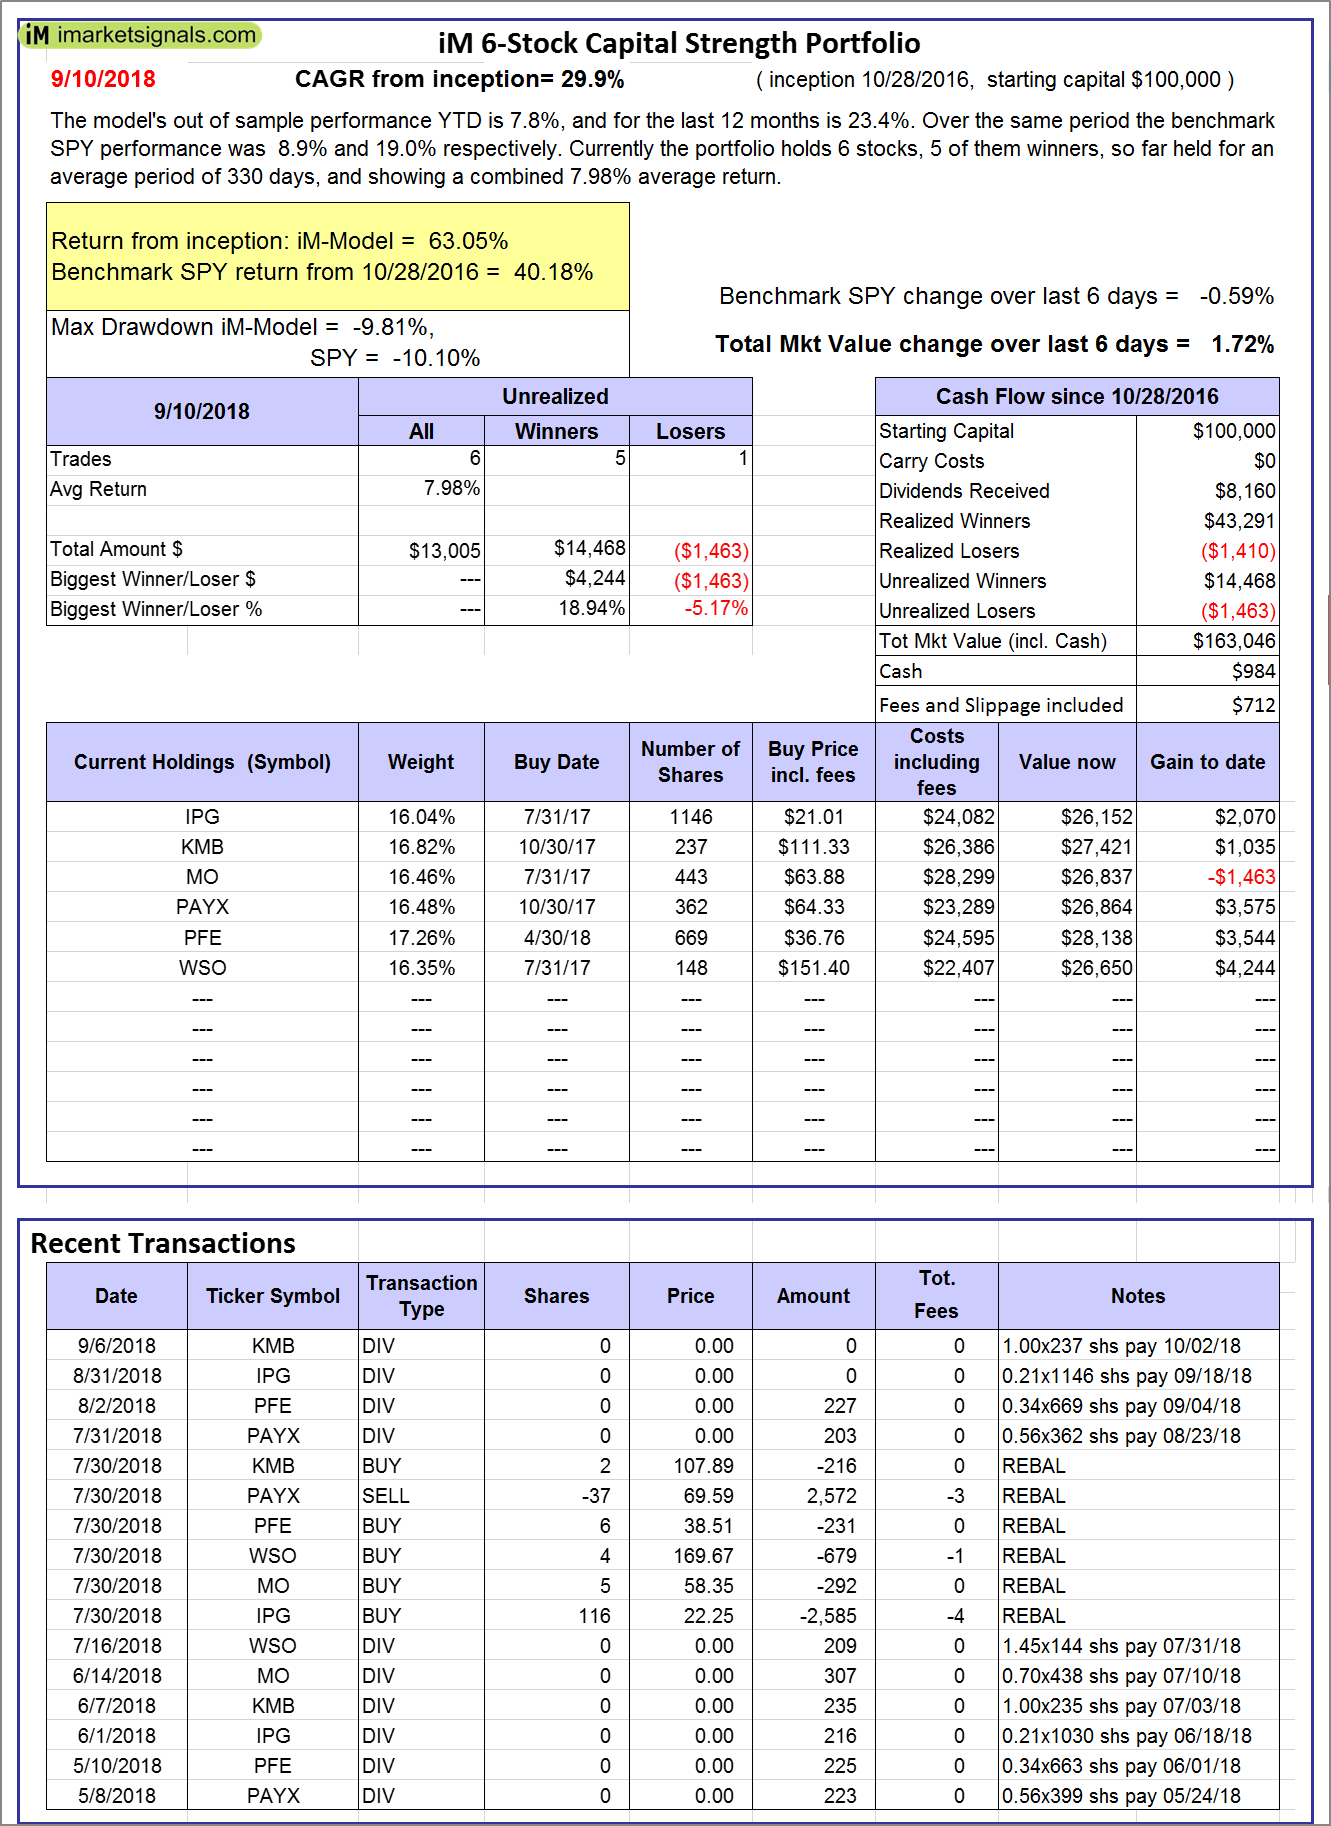 |
iM 6-Stock Capital Strength Portfolio: The model’s out of sample performance YTD is 7.8%, and for the last 12 months is 23.4%. Over the same period the benchmark SPY performance was 8.9% and 19.0% respectively. Over the previous week the market value of the iM 6-Stock Capital Strength Portfolio gained 1.72% at a time when SPY gained -0.59%. A starting capital of $100,000 at inception on 10/28/2016 would have grown to $163,046 which includes $984 cash and excludes $712 spent on fees and slippage. |
 |
iM-BestogaX5-System: The model’s out of sample performance YTD is 2.6%, and for the last 12 months is 10.9%. Over the same period the benchmark SPY performance was 8.9% and 19.0% respectively. Over the previous week the market value of iM-BestogaX5-System gained 1.14% at a time when SPY gained -0.59%. A starting capital of $100,000 at inception on 3/28/2016 would have grown to $114,719 which includes $639 cash and excludes $1,256 spent on fees and slippage. |
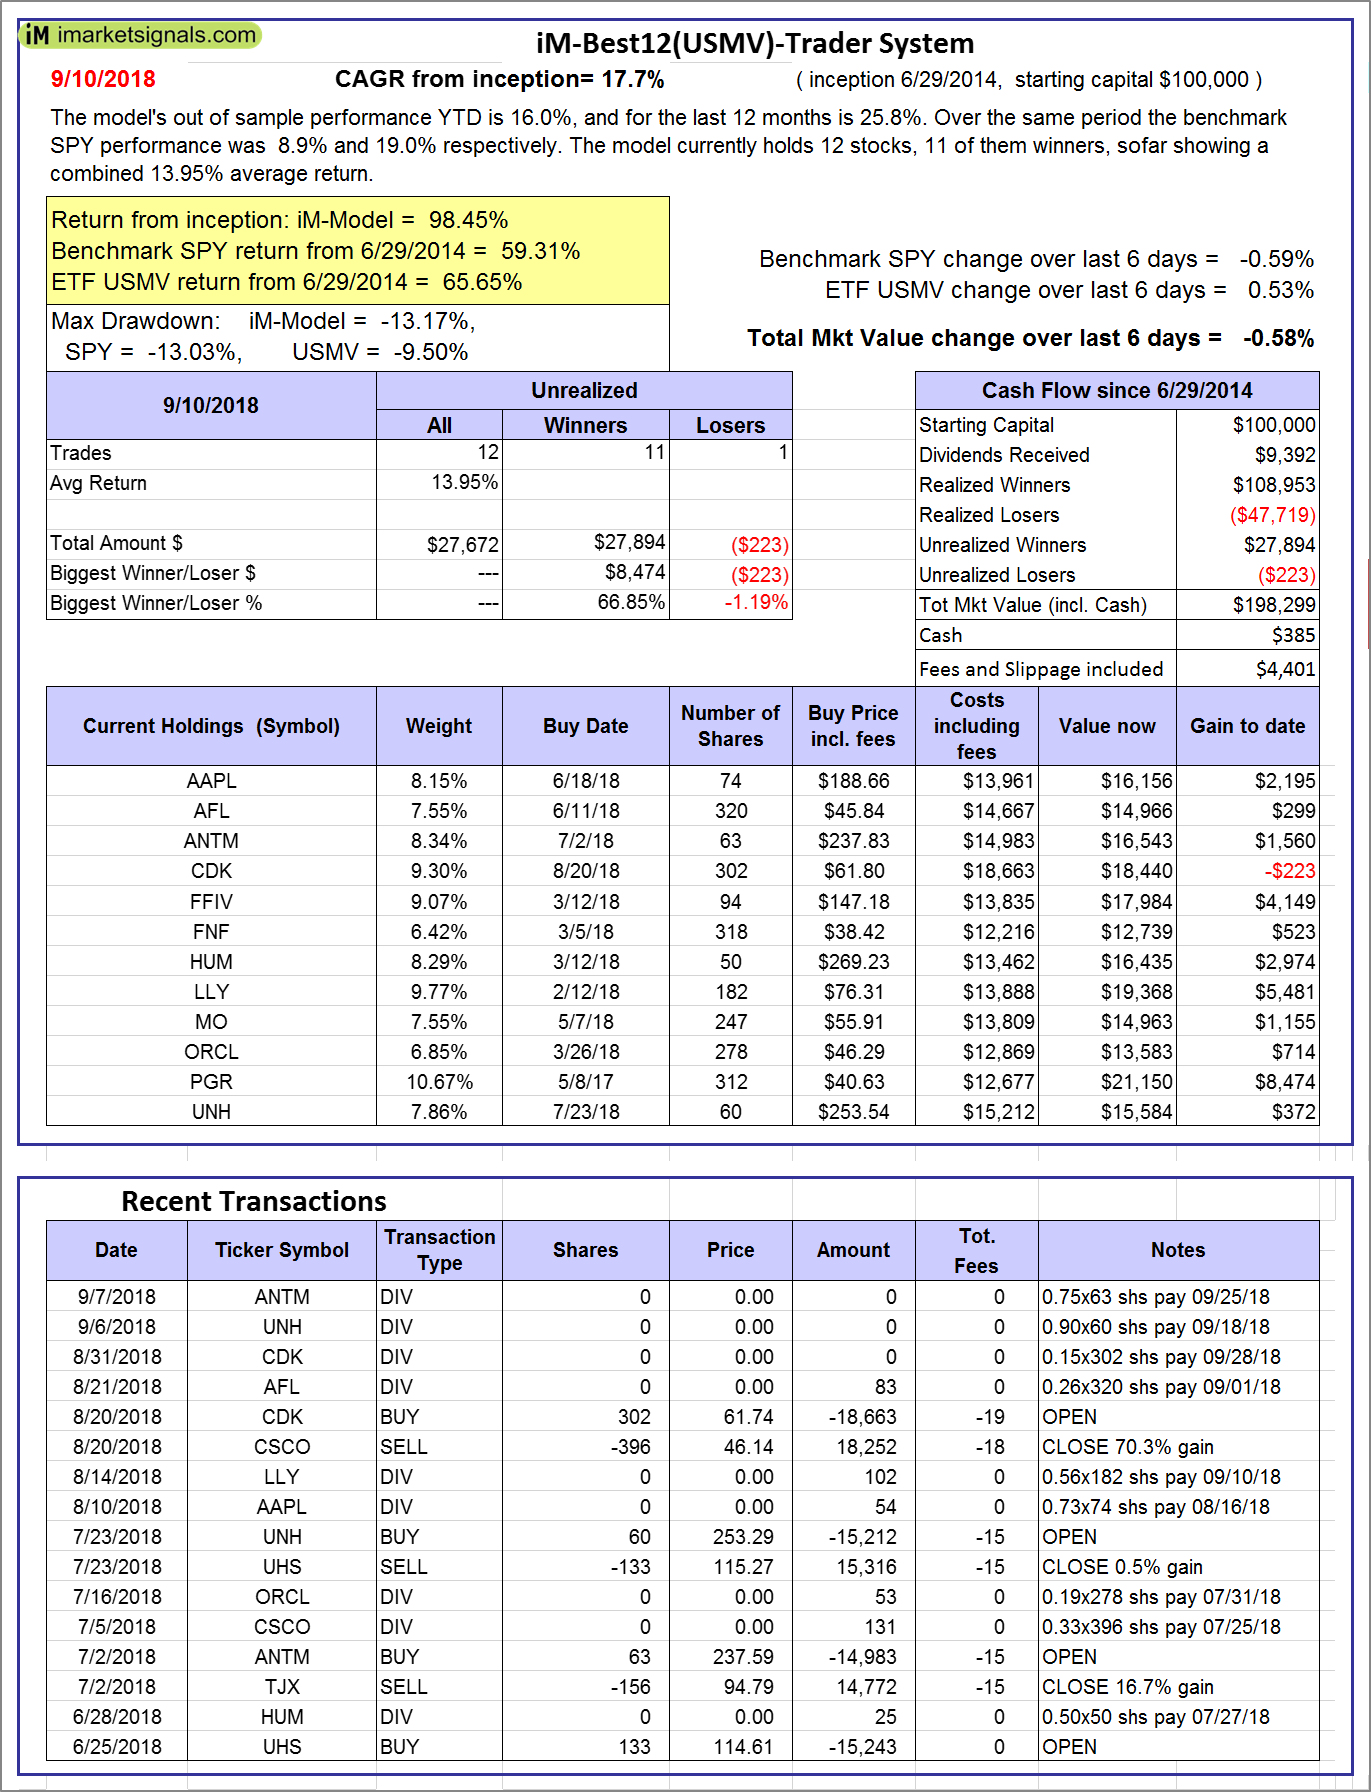 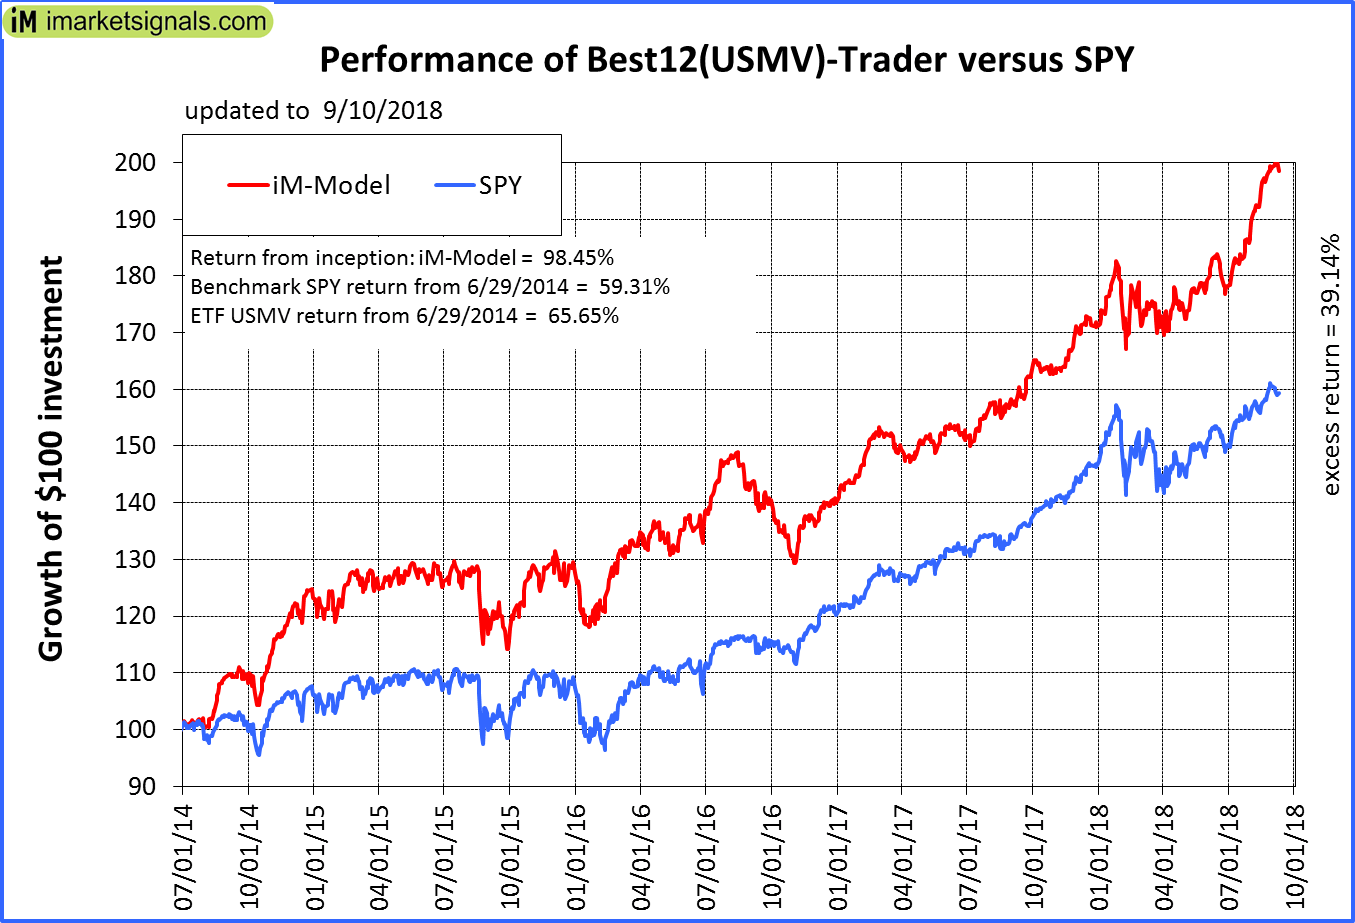 |
iM-Best12(USMV)-Trader: The model’s out of sample performance YTD is 16.0%, and for the last 12 months is 25.8%. Over the same period the benchmark SPY performance was 8.9% and 19.0% respectively. Since inception, on 6/30/2014, the model gained 98.45% while the benchmark SPY gained 59.31% and the ETF USMV gained 65.65% over the same period. Over the previous week the market value of iM-Best12(USMV)-Trader gained -0.58% at a time when SPY gained -0.59%. A starting capital of $100,000 at inception on 6/30/2014 would have grown to $198,299 which includes $385 cash and excludes $4,401 spent on fees and slippage. |
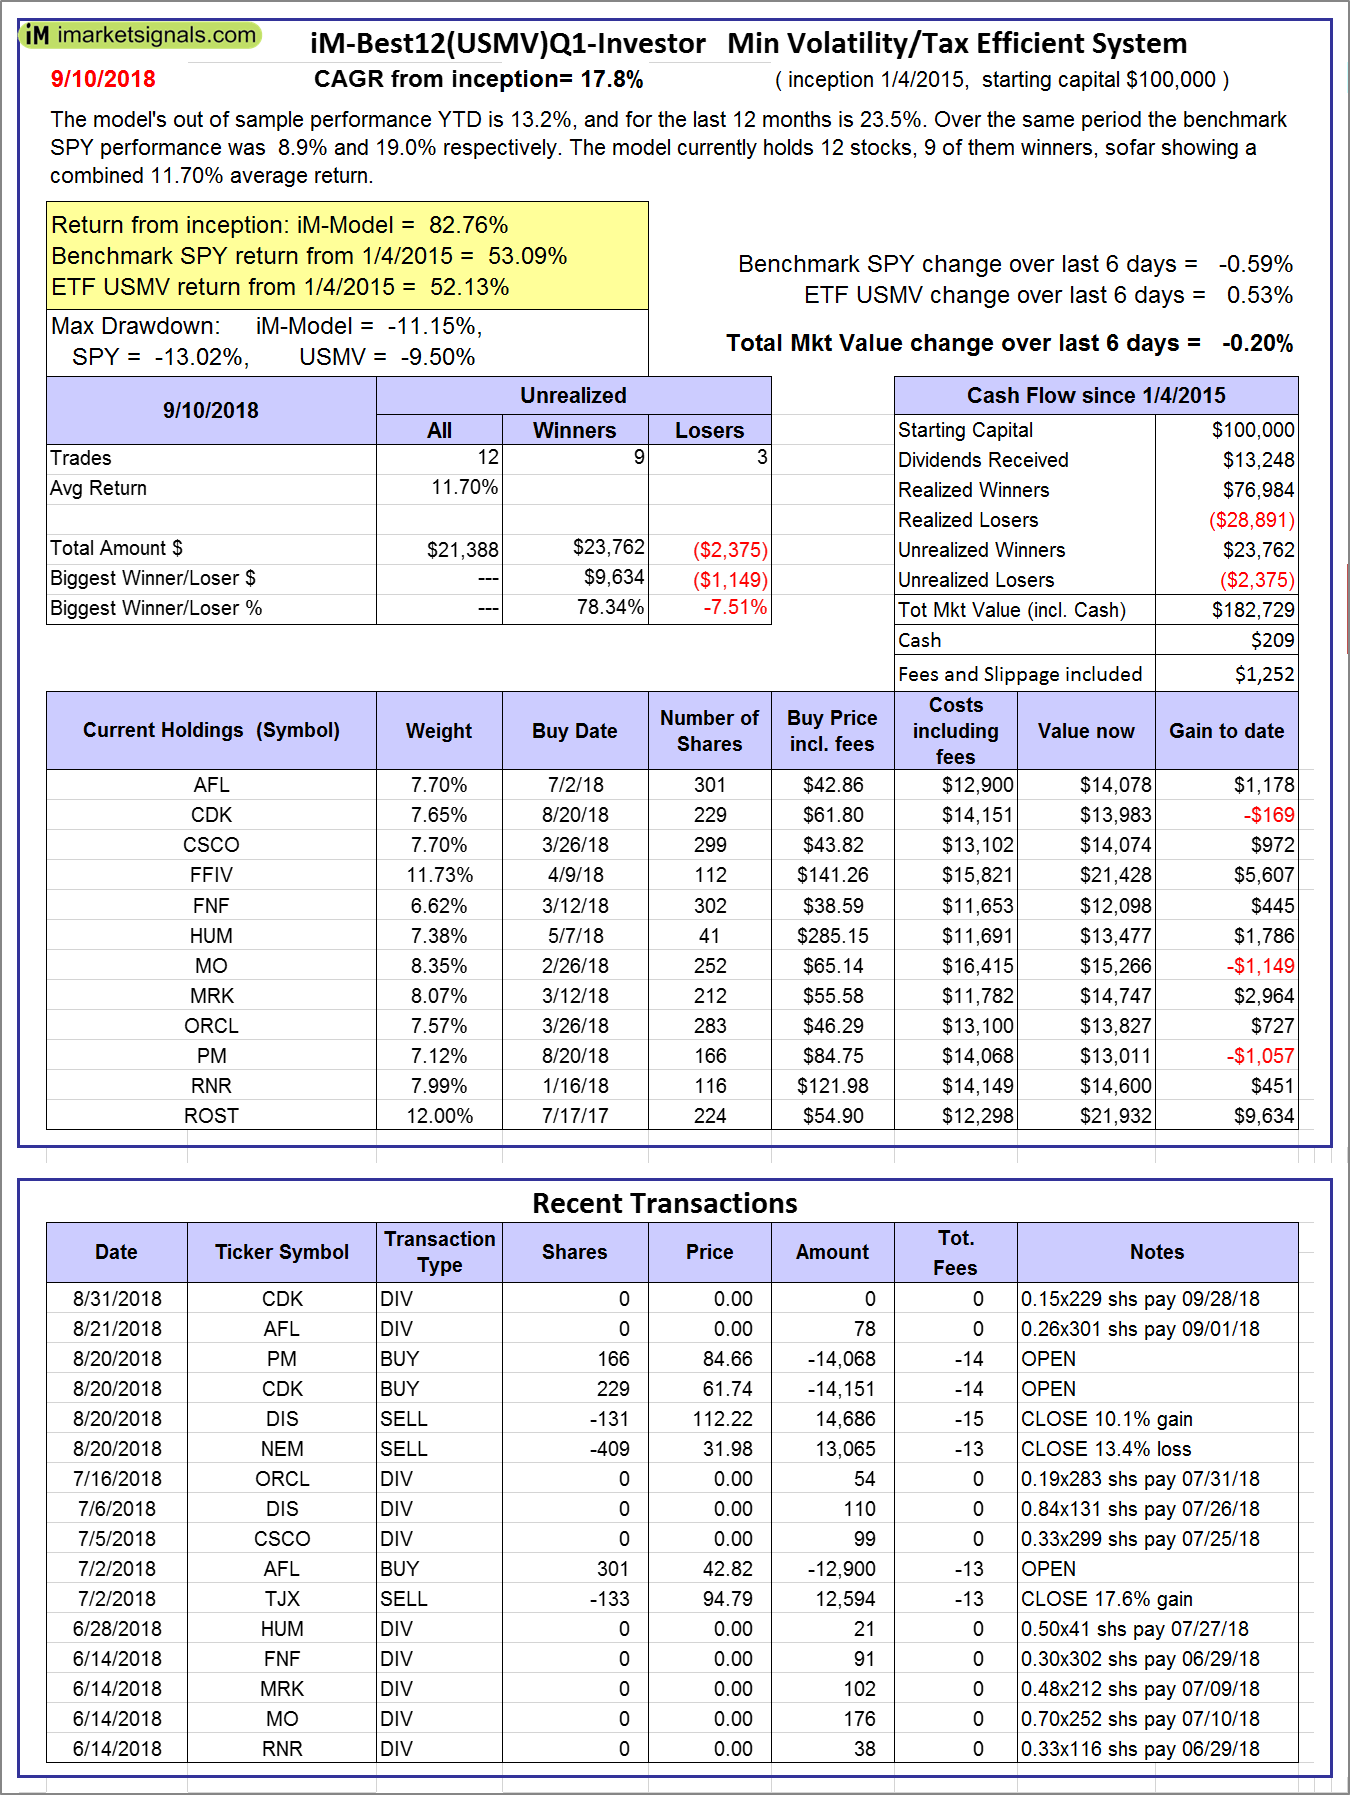 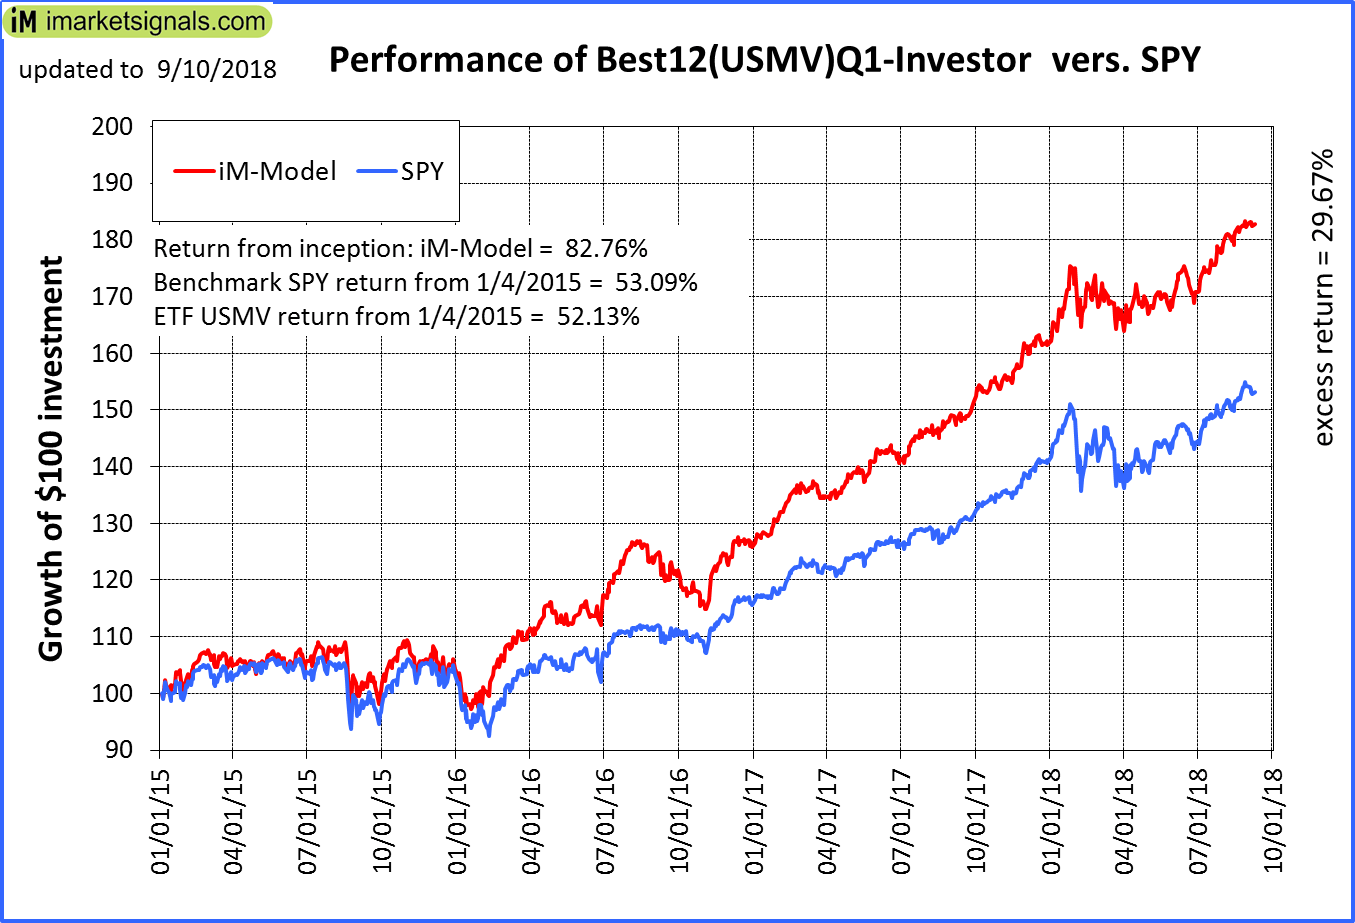 |
iM-Best12(USMV)Q1-Investor: The model’s out of sample performance YTD is 13.2%, and for the last 12 months is 23.5%. Over the same period the benchmark SPY performance was 8.9% and 19.0% respectively. Since inception, on 1/5/2015, the model gained 82.76% while the benchmark SPY gained 53.09% and the ETF USMV gained 52.13% over the same period. Over the previous week the market value of iM-Best12(USMV)Q1 gained -0.20% at a time when SPY gained -0.59%. A starting capital of $100,000 at inception on 1/5/2015 would have grown to $182,729 which includes $209 cash and excludes $1,252 spent on fees and slippage. |
 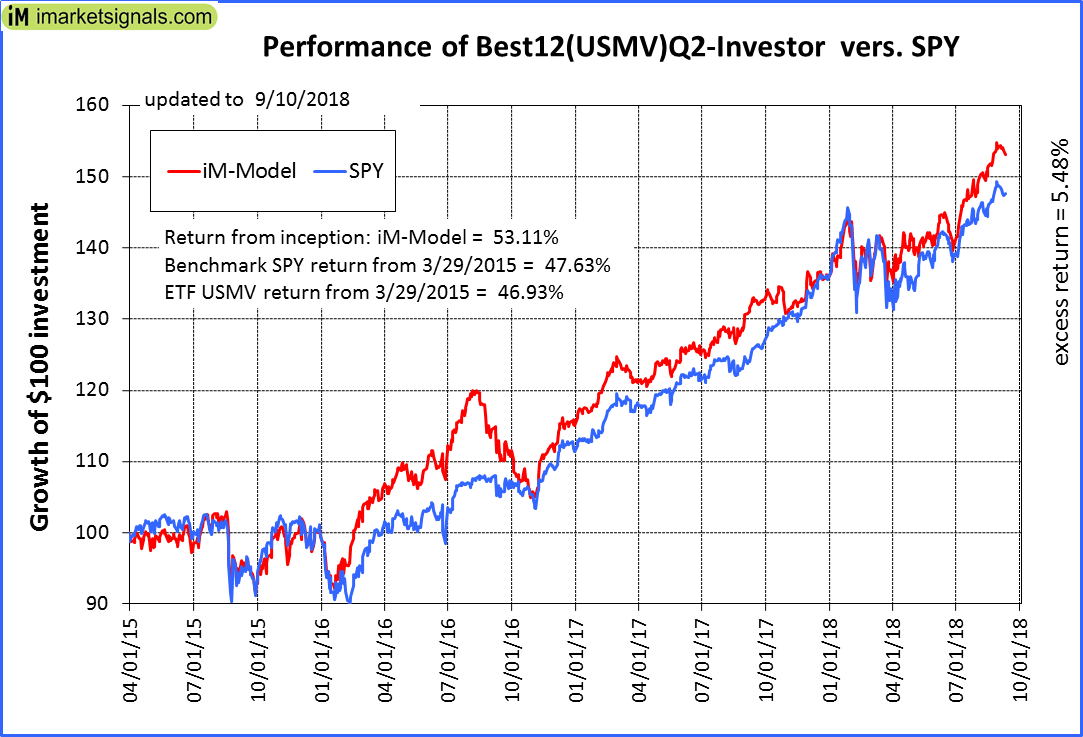 |
iM-Best12(USMV)Q2-Investor: The model’s out of sample performance YTD is 12.9%, and for the last 12 months is 16.3%. Over the same period the benchmark SPY performance was 8.9% and 19.0% respectively. Since inception, on 3/30/2015, the model gained 53.11% while the benchmark SPY gained 47.63% and the ETF USMV gained 46.93% over the same period. Over the previous week the market value of iM-Best12(USMV)Q2 gained -0.76% at a time when SPY gained -0.59%. A starting capital of $100,000 at inception on 3/30/2015 would have grown to $153,048 which includes $241 cash and excludes $1,073 spent on fees and slippage. |
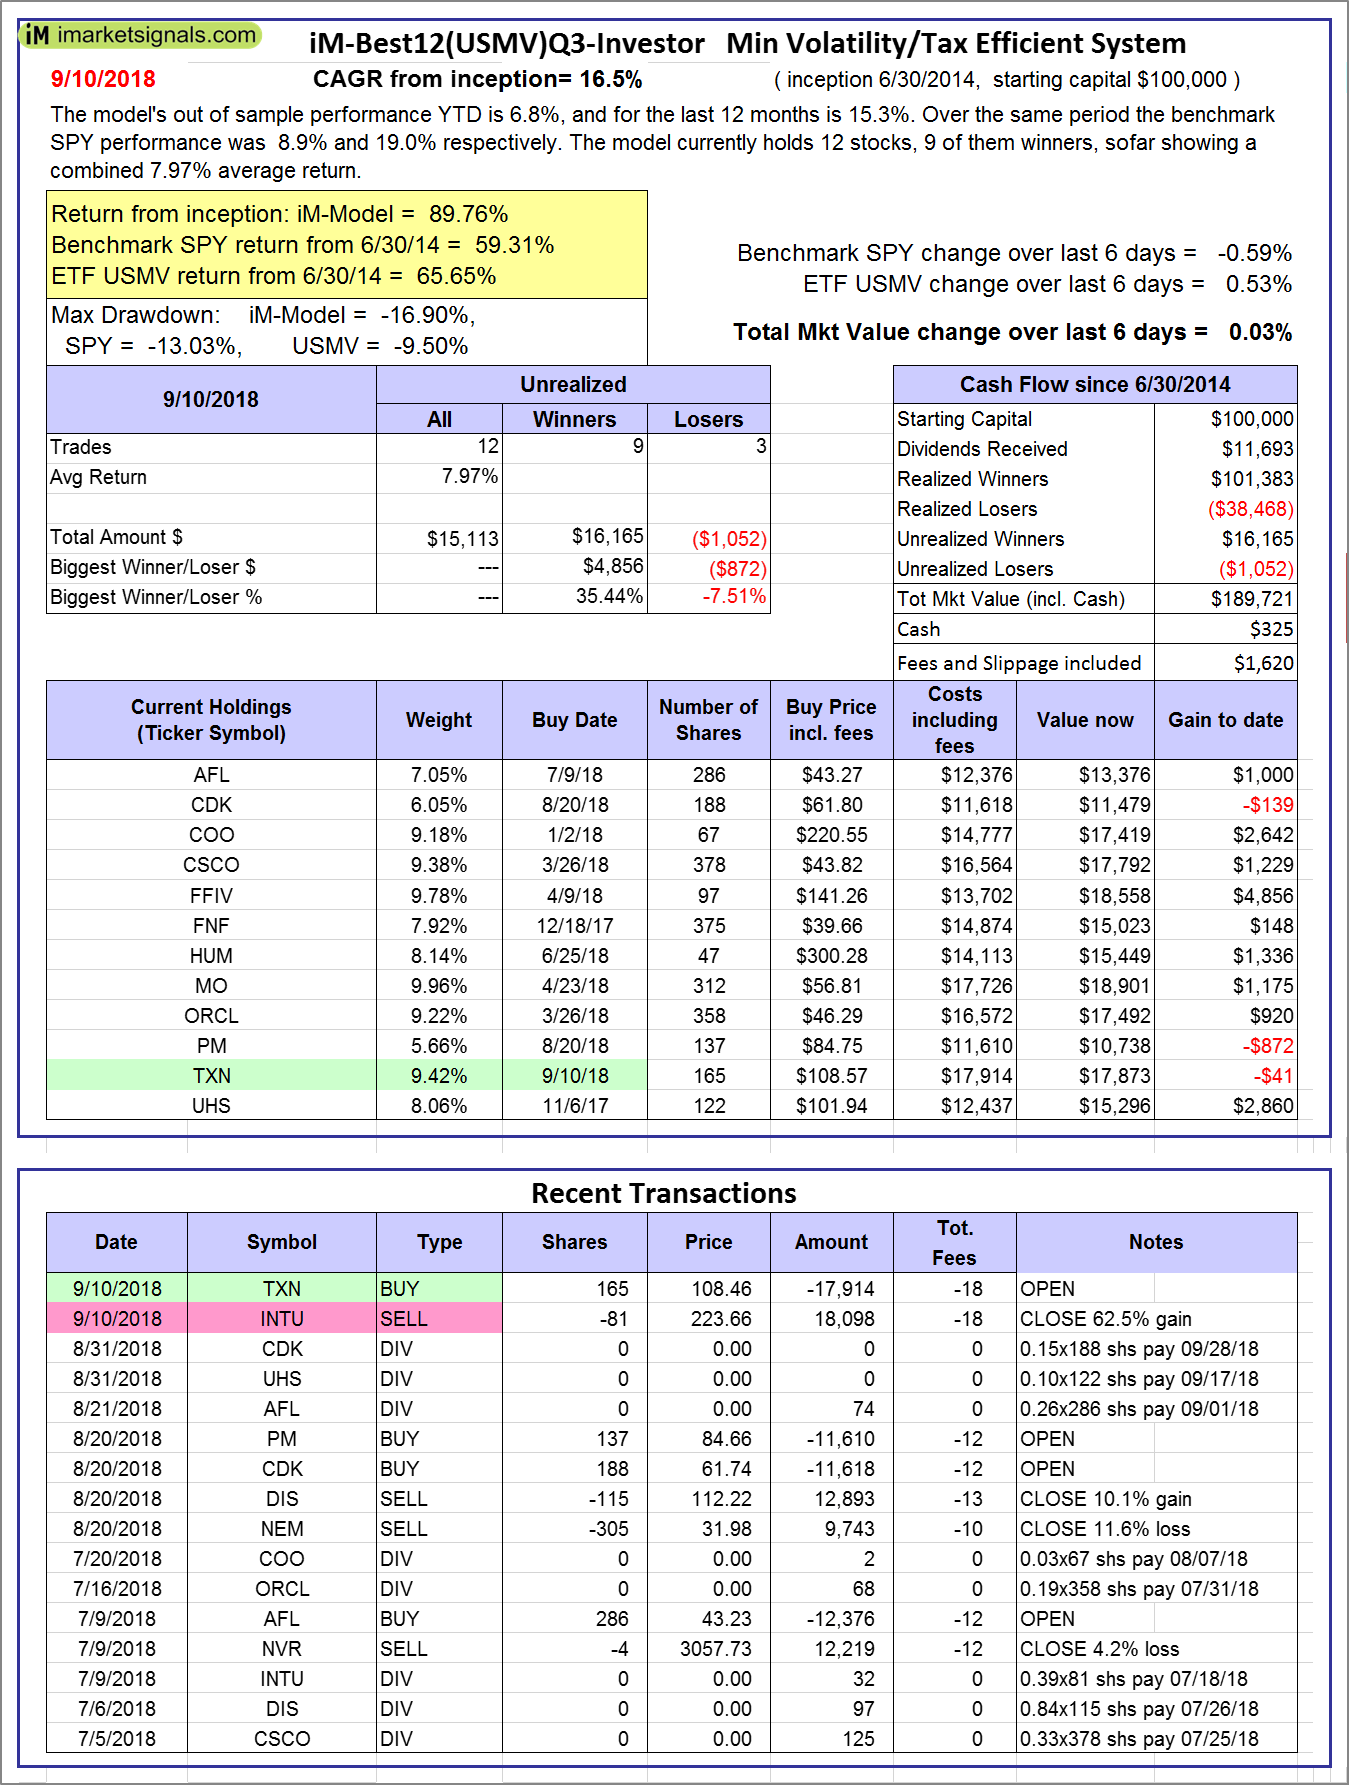 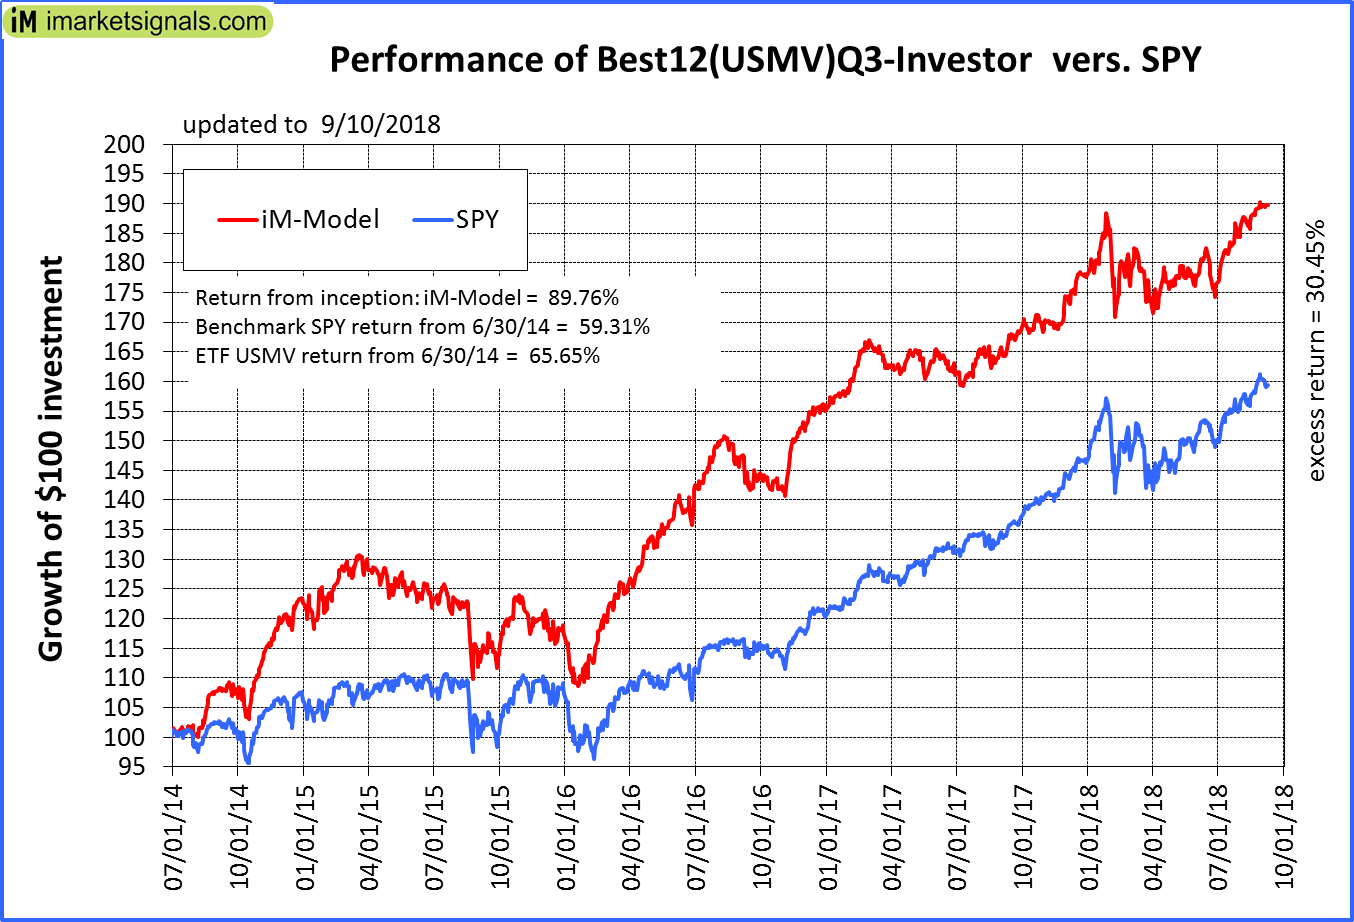 |
iM-Best12(USMV)Q3-Investor: The model’s out of sample performance YTD is 6.8%, and for the last 12 months is 15.3%. Over the same period the benchmark SPY performance was 8.9% and 19.0% respectively. Since inception, on 7/1/2014, the model gained 89.76% while the benchmark SPY gained 59.31% and the ETF USMV gained 65.65% over the same period. Over the previous week the market value of iM-Best12(USMV)Q3 gained 0.03% at a time when SPY gained -0.59%. A starting capital of $100,000 at inception on 7/1/2014 would have grown to $189,721 which includes $325 cash and excludes $1,620 spent on fees and slippage. |
 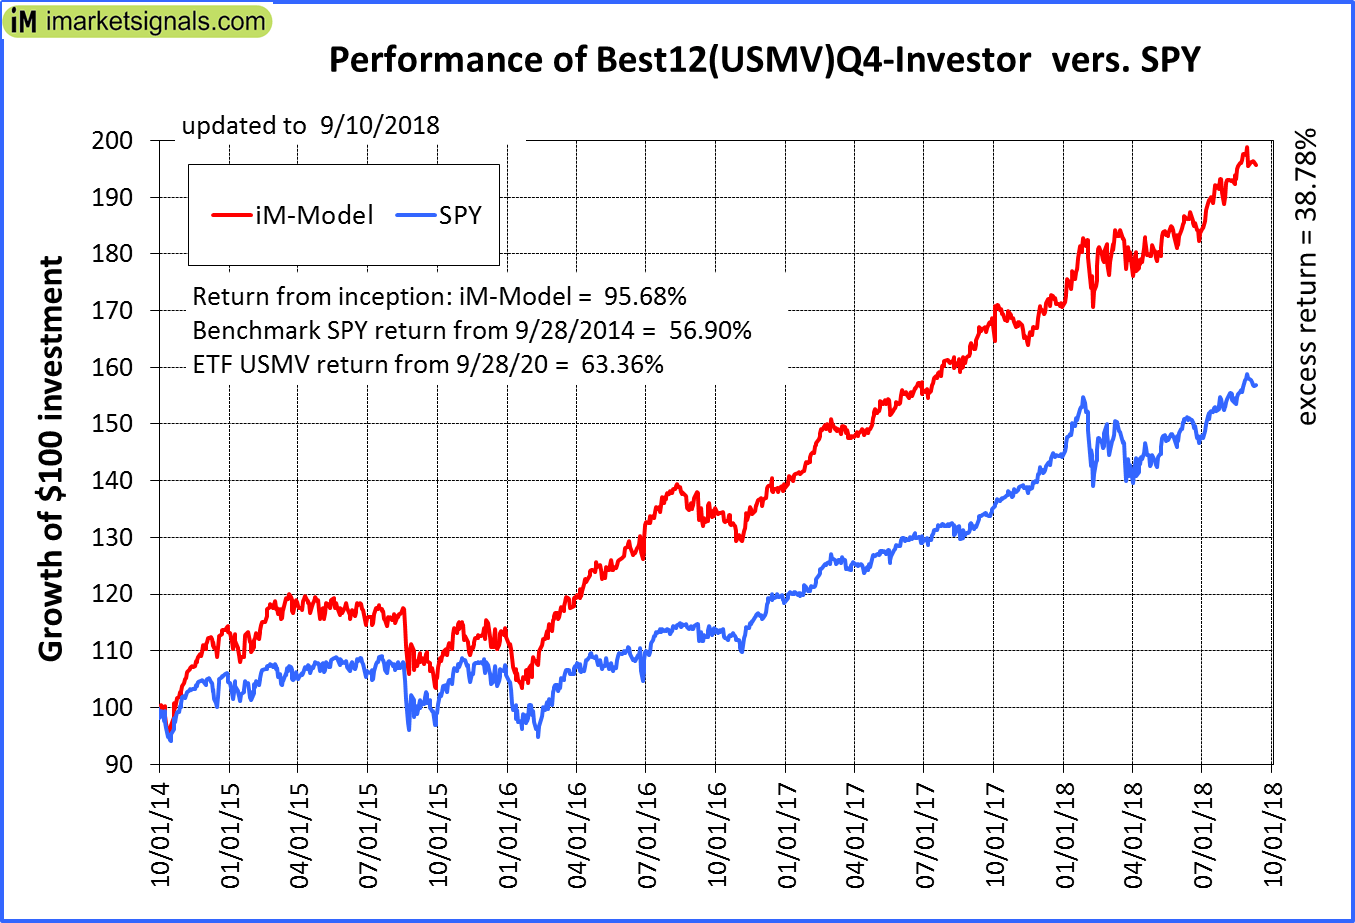 |
iM-Best12(USMV)Q4-Investor: Since inception, on 9/29/2014, the model gained 95.68% while the benchmark SPY gained 56.90% and the ETF USMV gained 63.36% over the same period. Over the previous week the market value of iM-Best12(USMV)Q4 gained -0.22% at a time when SPY gained -0.59%. A starting capital of $100,000 at inception on 9/29/2014 would have grown to $195,672 which includes $226 cash and excludes $1,404 spent on fees and slippage. |
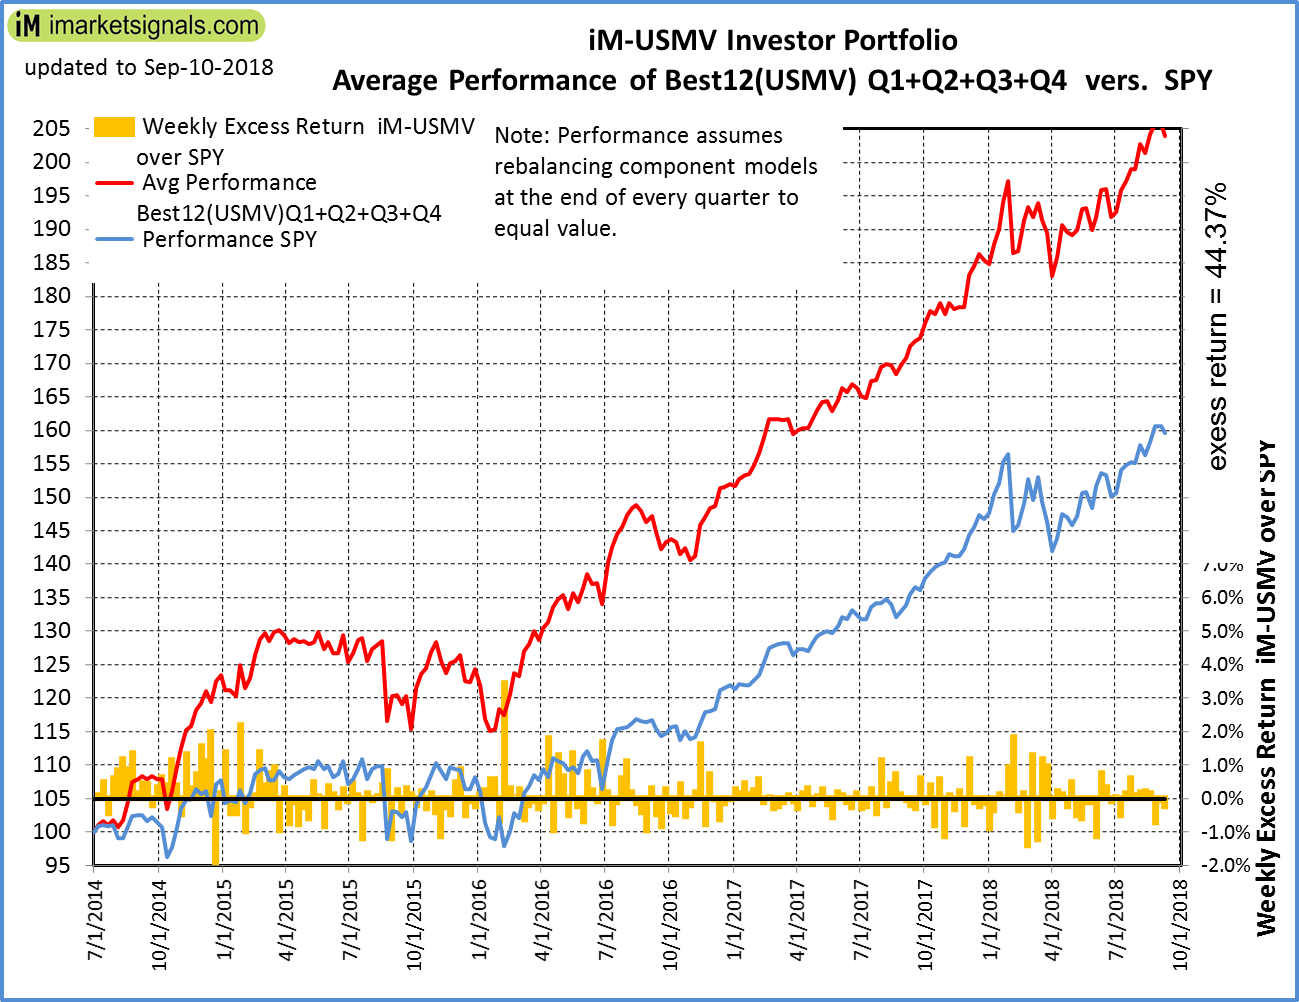 |
Average Performance of iM-Best12(USMV)Q1+Q2+Q3+Q4-Investor resulted in an excess return of 44.37% over SPY. (see iM-USMV Investor Portfolio) |
 |
iM-Best(Short): The model’s out of sample performance YTD is -6.1%, and for the last 12 months is -15.1%. Over the same period the benchmark SPY performance was 8.9% and 19.0% respectively. Over the previous week the market value of iM-Best(Short) gained -0.02% at a time when SPY gained -0.59%. Over the period 1/2/2009 to 9/10/2018 the starting capital of $100,000 would have grown to $85,686 which includes $85,686 cash and excludes $24,550 spent on fees and slippage. |
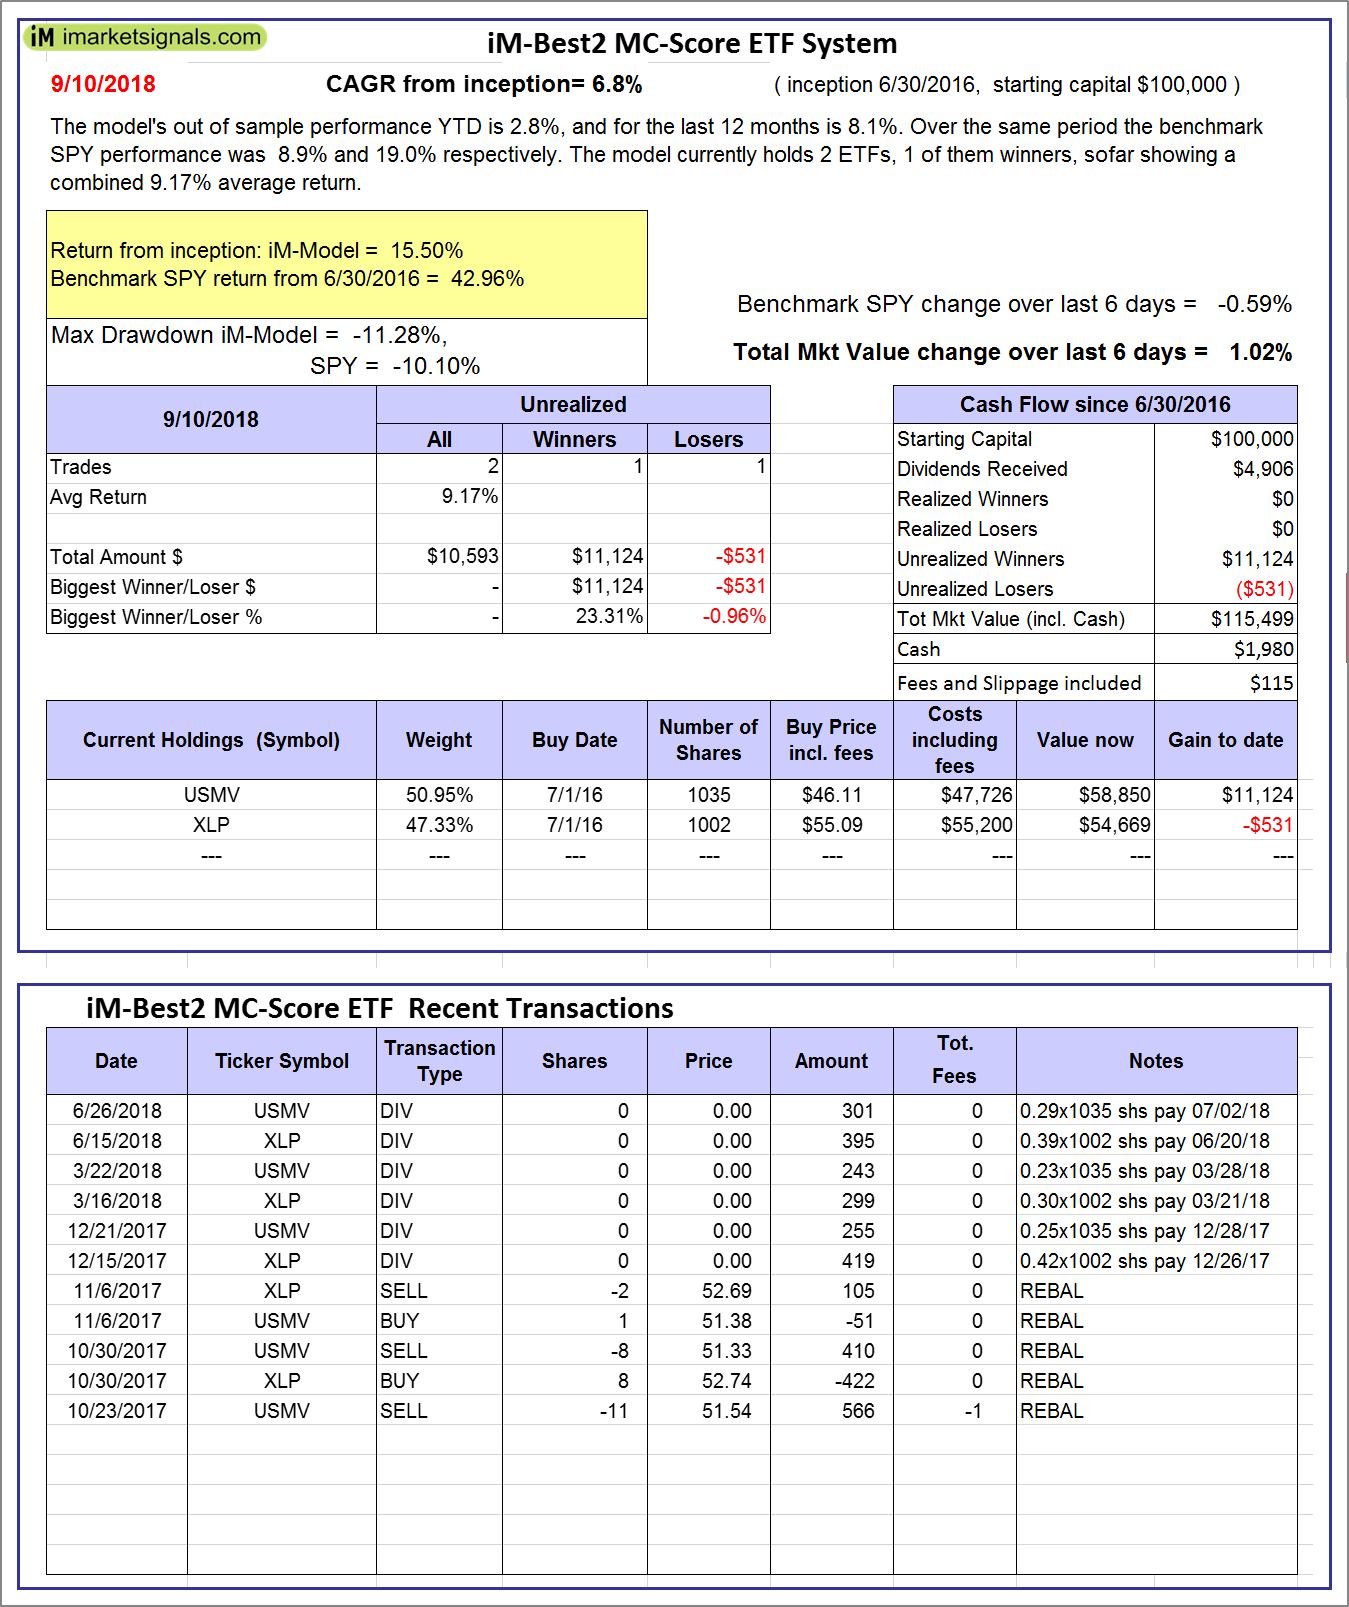 |
iM-Best2 MC-Score ETF System: The model’s out of sample performance YTD is 2.8%, and for the last 12 months is 8.1%. Over the same period the benchmark SPY performance was 8.9% and 19.0% respectively. Over the previous week the market value of the iM-Best2 MC-Score ETF System gained 1.02% at a time when SPY gained -0.59%. A starting capital of $100,000 at inception on 6/30/2016 would have grown to $115,499 which includes $1,980 cash and excludes $115 spent on fees and slippage. |
 |
iM-Best4 MC-Score Vanguard System: The model’s out of sample performance YTD is 2.2%, and for the last 12 months is 5.2%. Over the same period the benchmark SPY performance was 8.9% and 19.0% respectively. Over the previous week the market value of the iM-Best4 MC-Score Vanguard System gained 0.57% at a time when SPY gained -0.59%. A starting capital of $100,000 at inception on 6/30/2016 would have grown to $113,262 which includes $4,783 cash and excludes $00 spent on fees and slippage. |
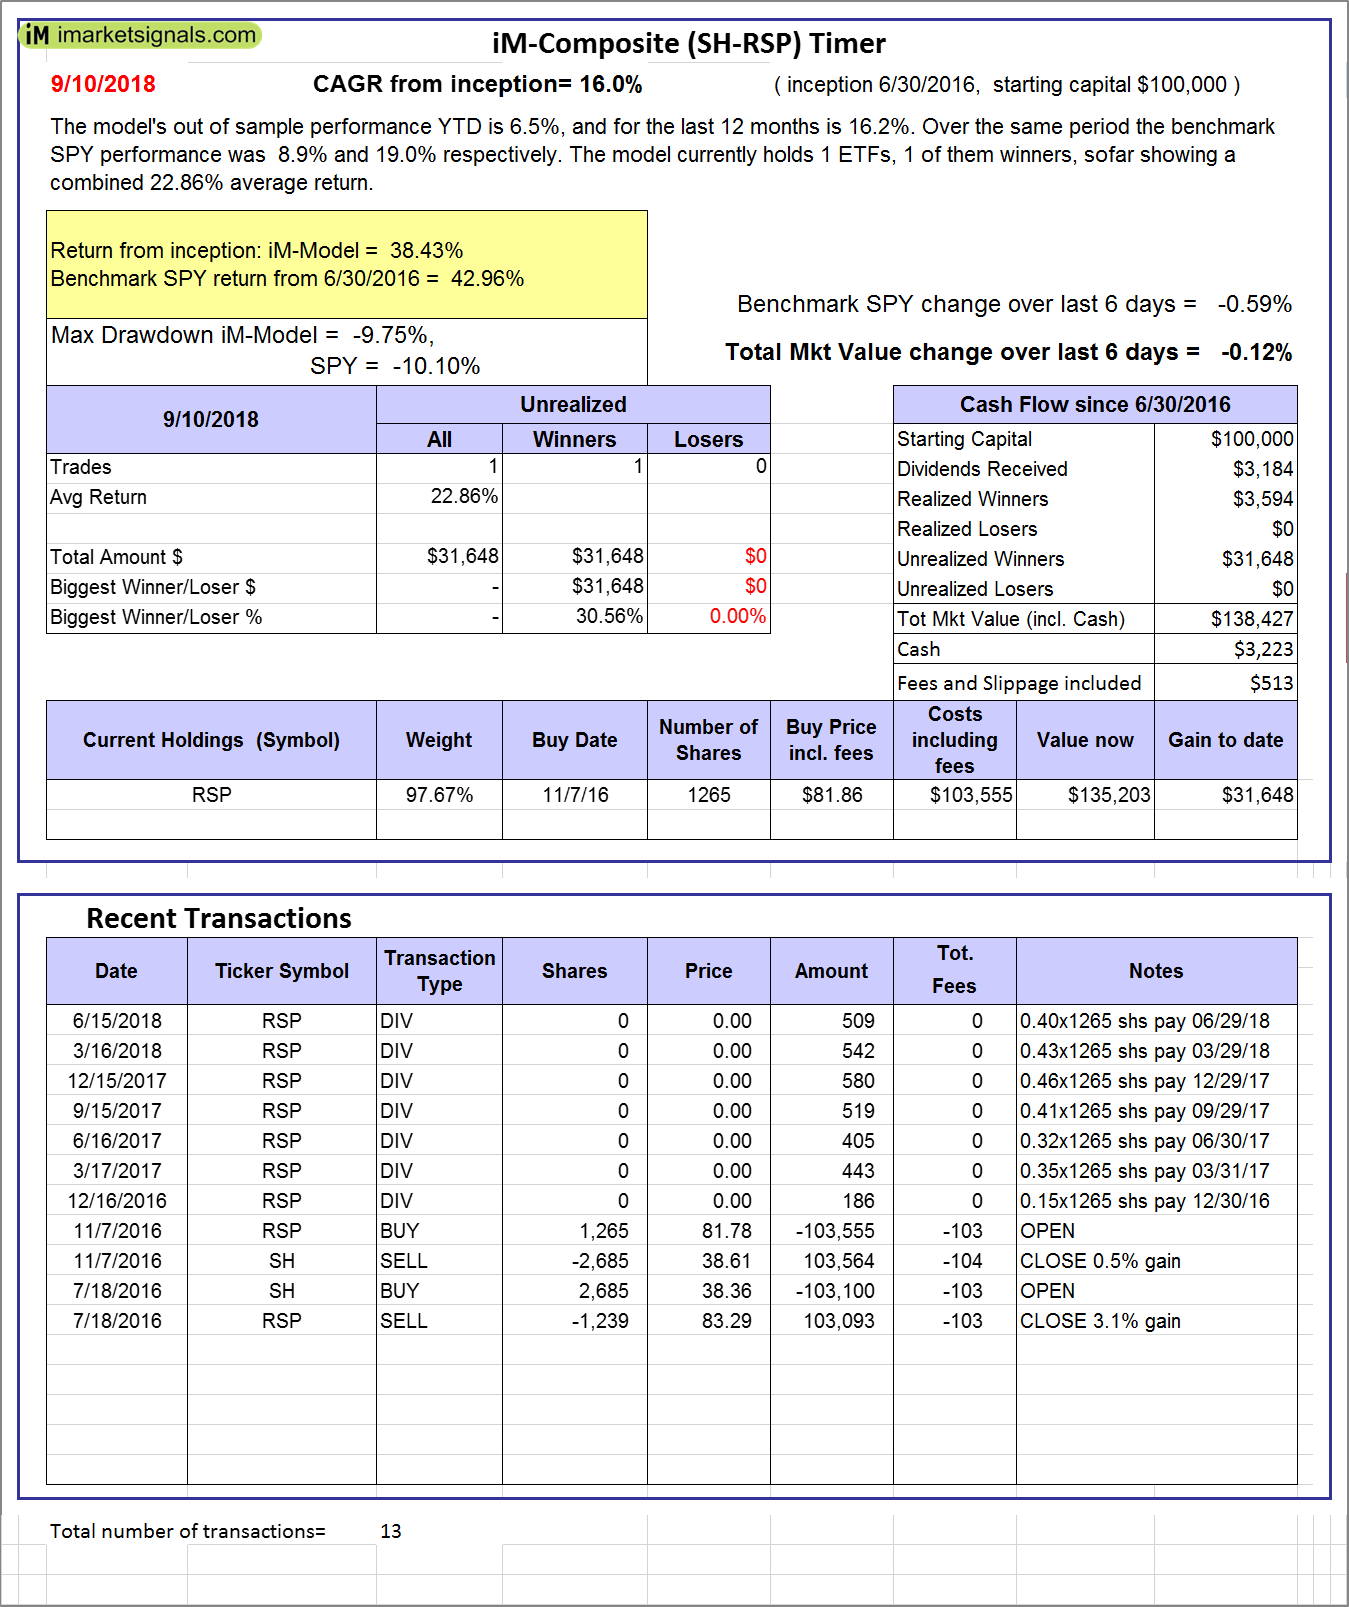 |
iM-Composite (SH-RSP) Timer: The model’s out of sample performance YTD is 6.5%, and for the last 12 months is 16.2%. Over the same period the benchmark SPY performance was 8.9% and 19.0% respectively. Over the previous week the market value of the iM-Composite (SH-RSP) Timer gained -0.12% at a time when SPY gained -0.59%. A starting capital of $100,000 at inception on 6/30/2016 would have grown to $138,427 which includes $3,223 cash and excludes $513 spent on fees and slippage. |
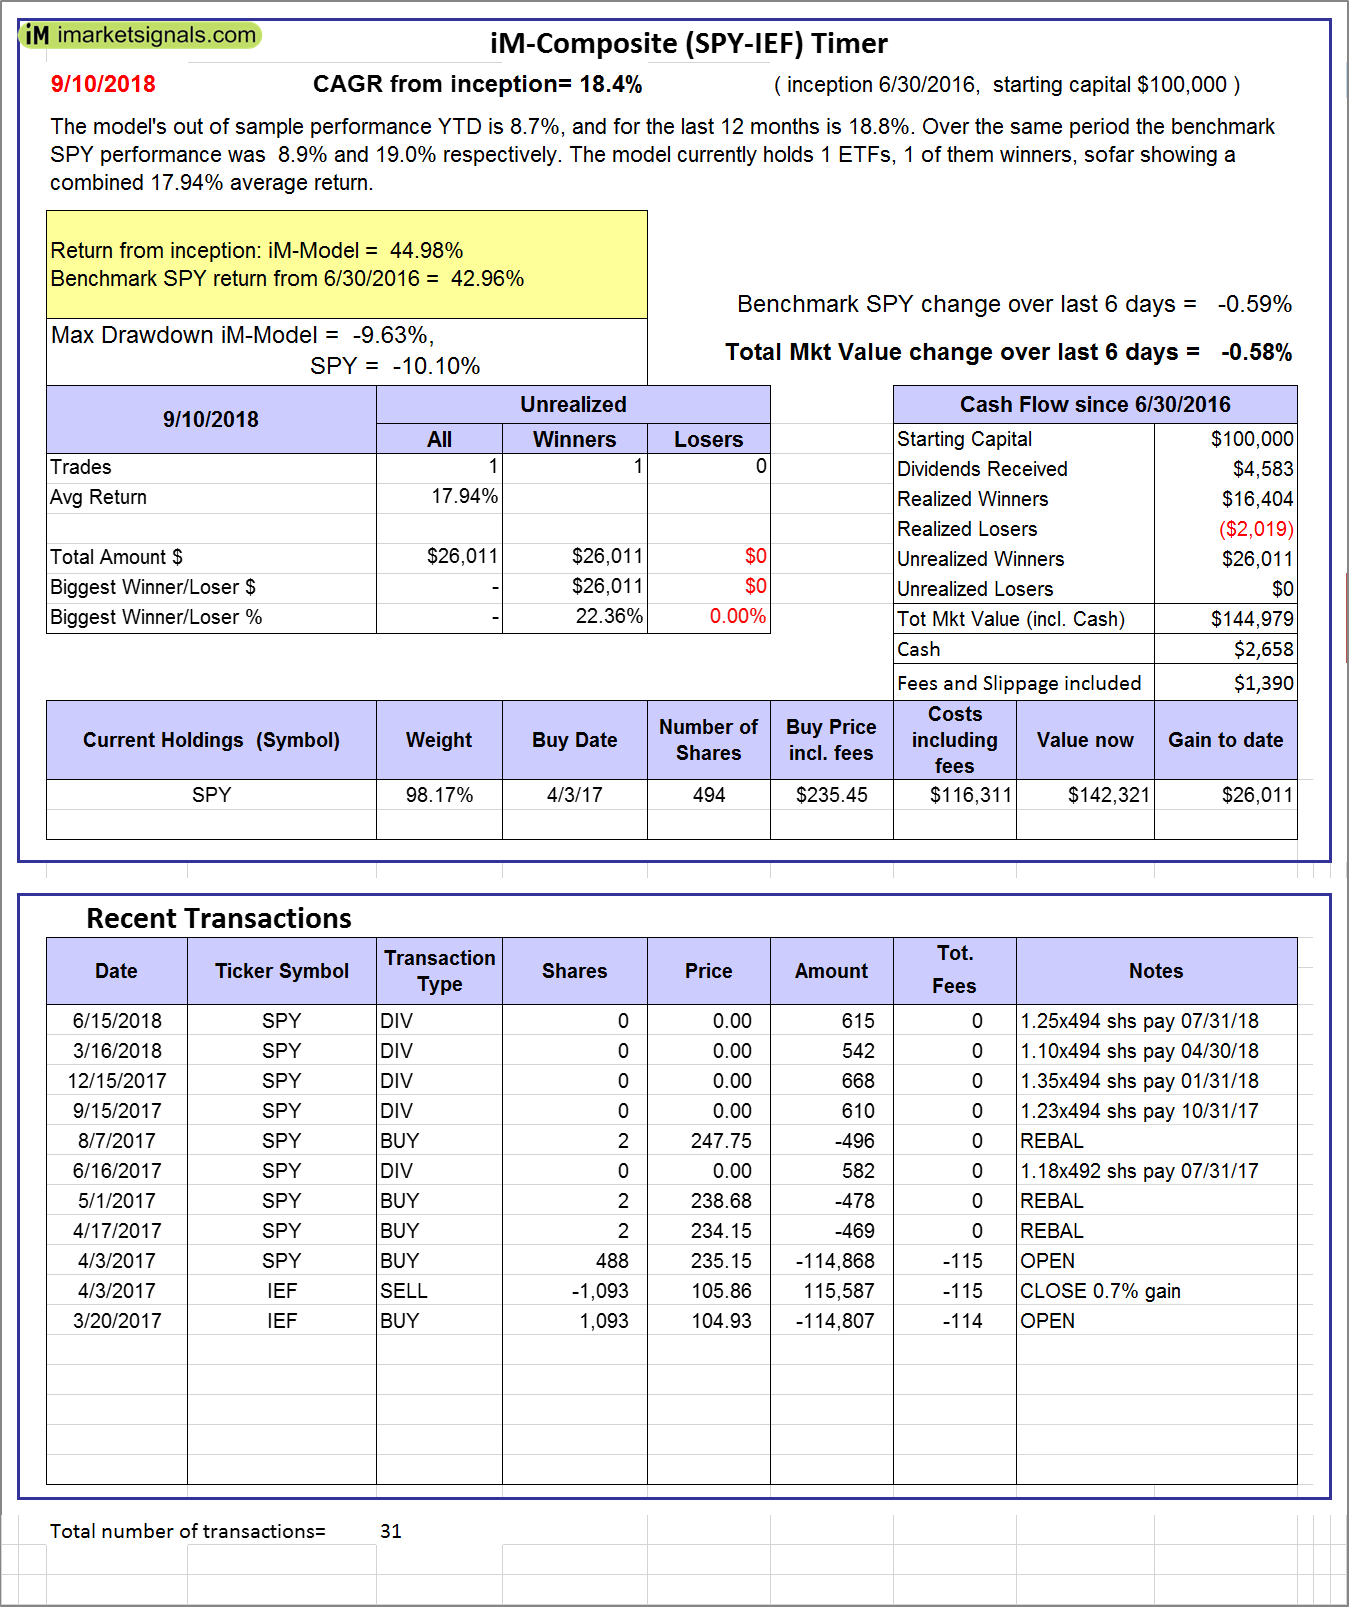 |
iM-Composite (SPY-IEF) Timer: The model’s out of sample performance YTD is 8.7%, and for the last 12 months is 18.8%. Over the same period the benchmark SPY performance was 8.9% and 19.0% respectively. Over the previous week the market value of the iM-Composite (SPY-IEF) Timer gained -0.58% at a time when SPY gained -0.59%. A starting capital of $100,000 at inception on 6/30/2016 would have grown to $144,979 which includes $2,658 cash and excludes $1,390 spent on fees and slippage. |
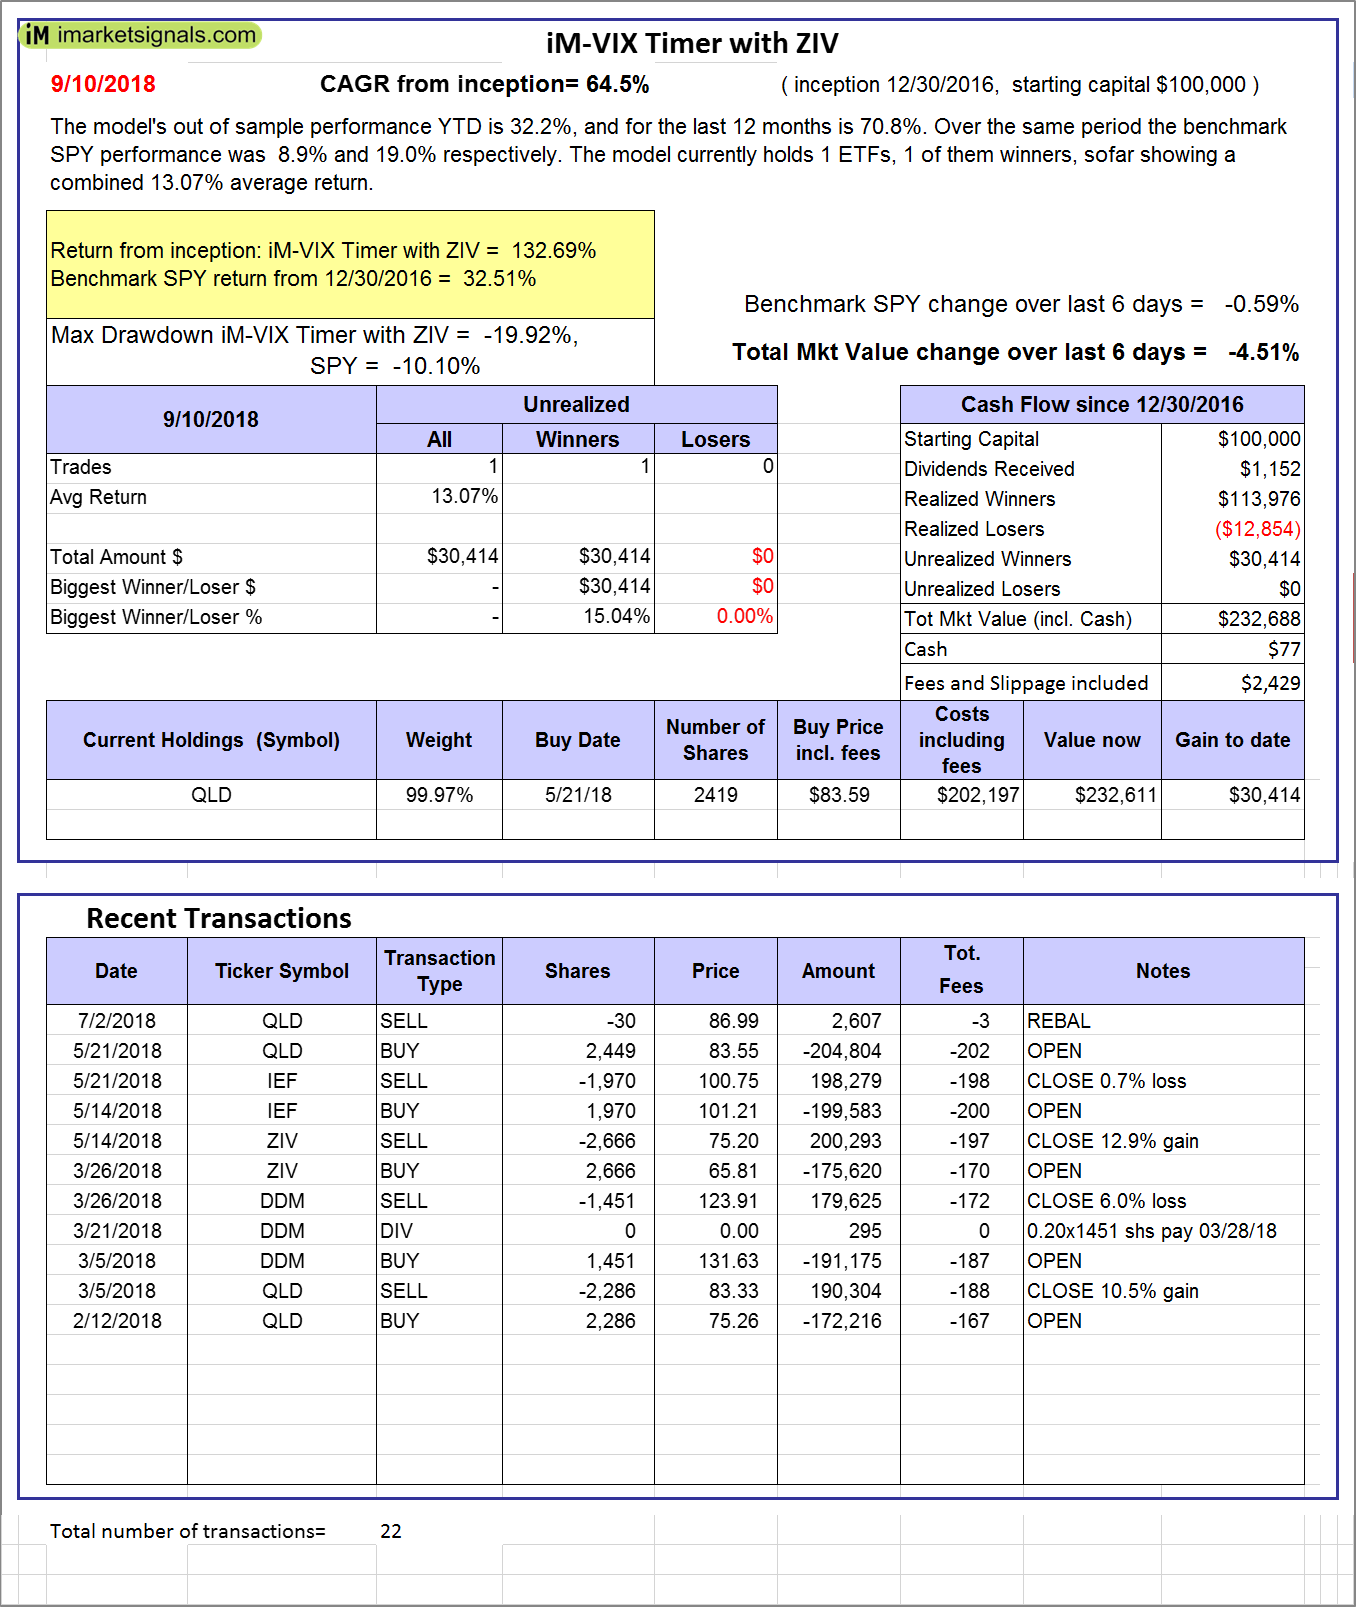 |
iM-VIX Timer with ZIV: The model’s out of sample performance YTD is 32.2%, and for the last 12 months is 70.8%. Over the same period the benchmark SPY performance was 8.9% and 19.0% respectively. Over the previous week the market value of the iM-VIX Timer with ZIV gained -4.51% at a time when SPY gained -0.59%. A starting capital of $100,000 at inception on 6/30/2016 would have grown to $232,688 which includes $77 cash and excludes $2,429 spent on fees and slippage. |
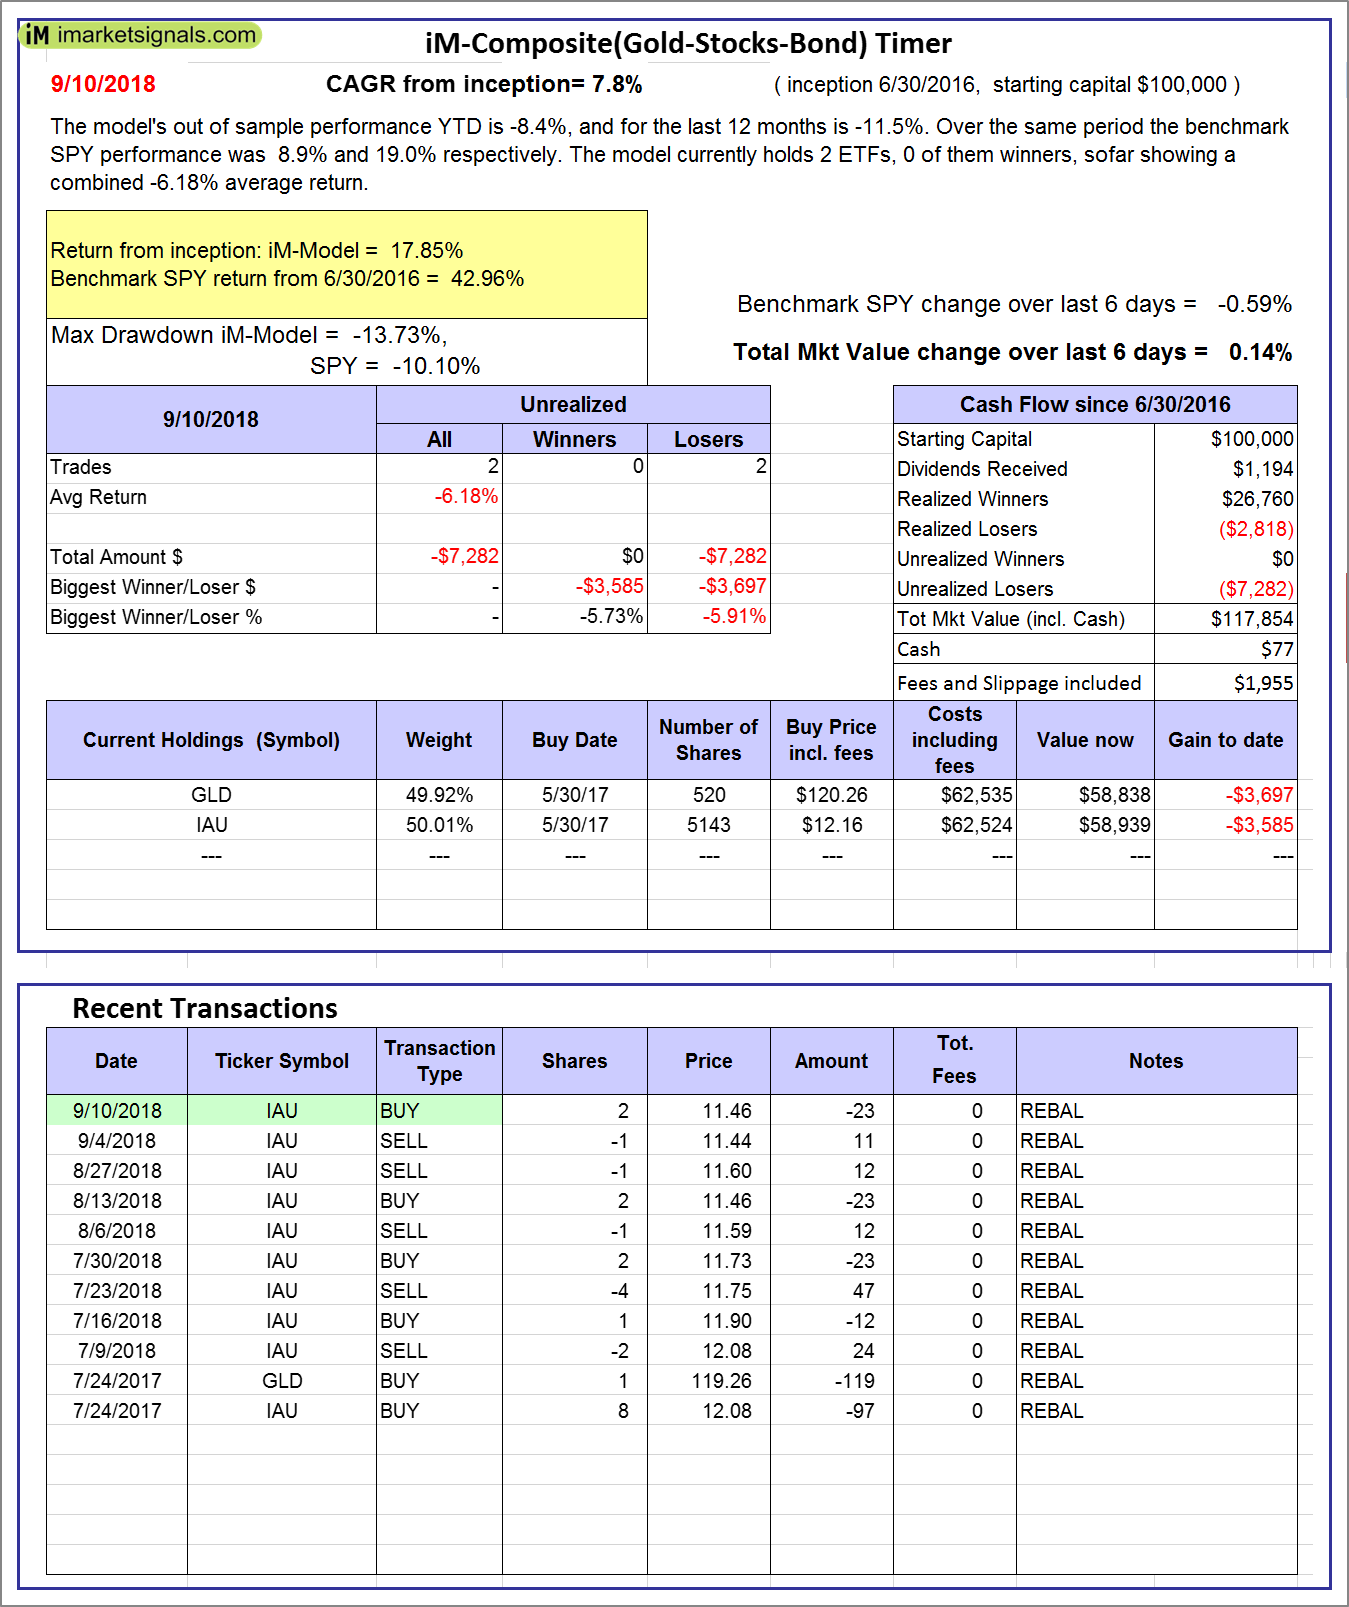 |
iM-Composite(Gold-Stocks-Bond) Timer: The model’s out of sample performance YTD is -8.4%, and for the last 12 months is -11.5%. Over the same period the benchmark SPY performance was 8.9% and 19.0% respectively. Over the previous week the market value of the iM-Composite(Gold-Stocks-Bond) Timer gained 0.14% at a time when SPY gained -0.59%. A starting capital of $100,000 at inception on 6/30/2016 would have grown to $117,854 which includes $77 cash and excludes $1,955 spent on fees and slippage. |
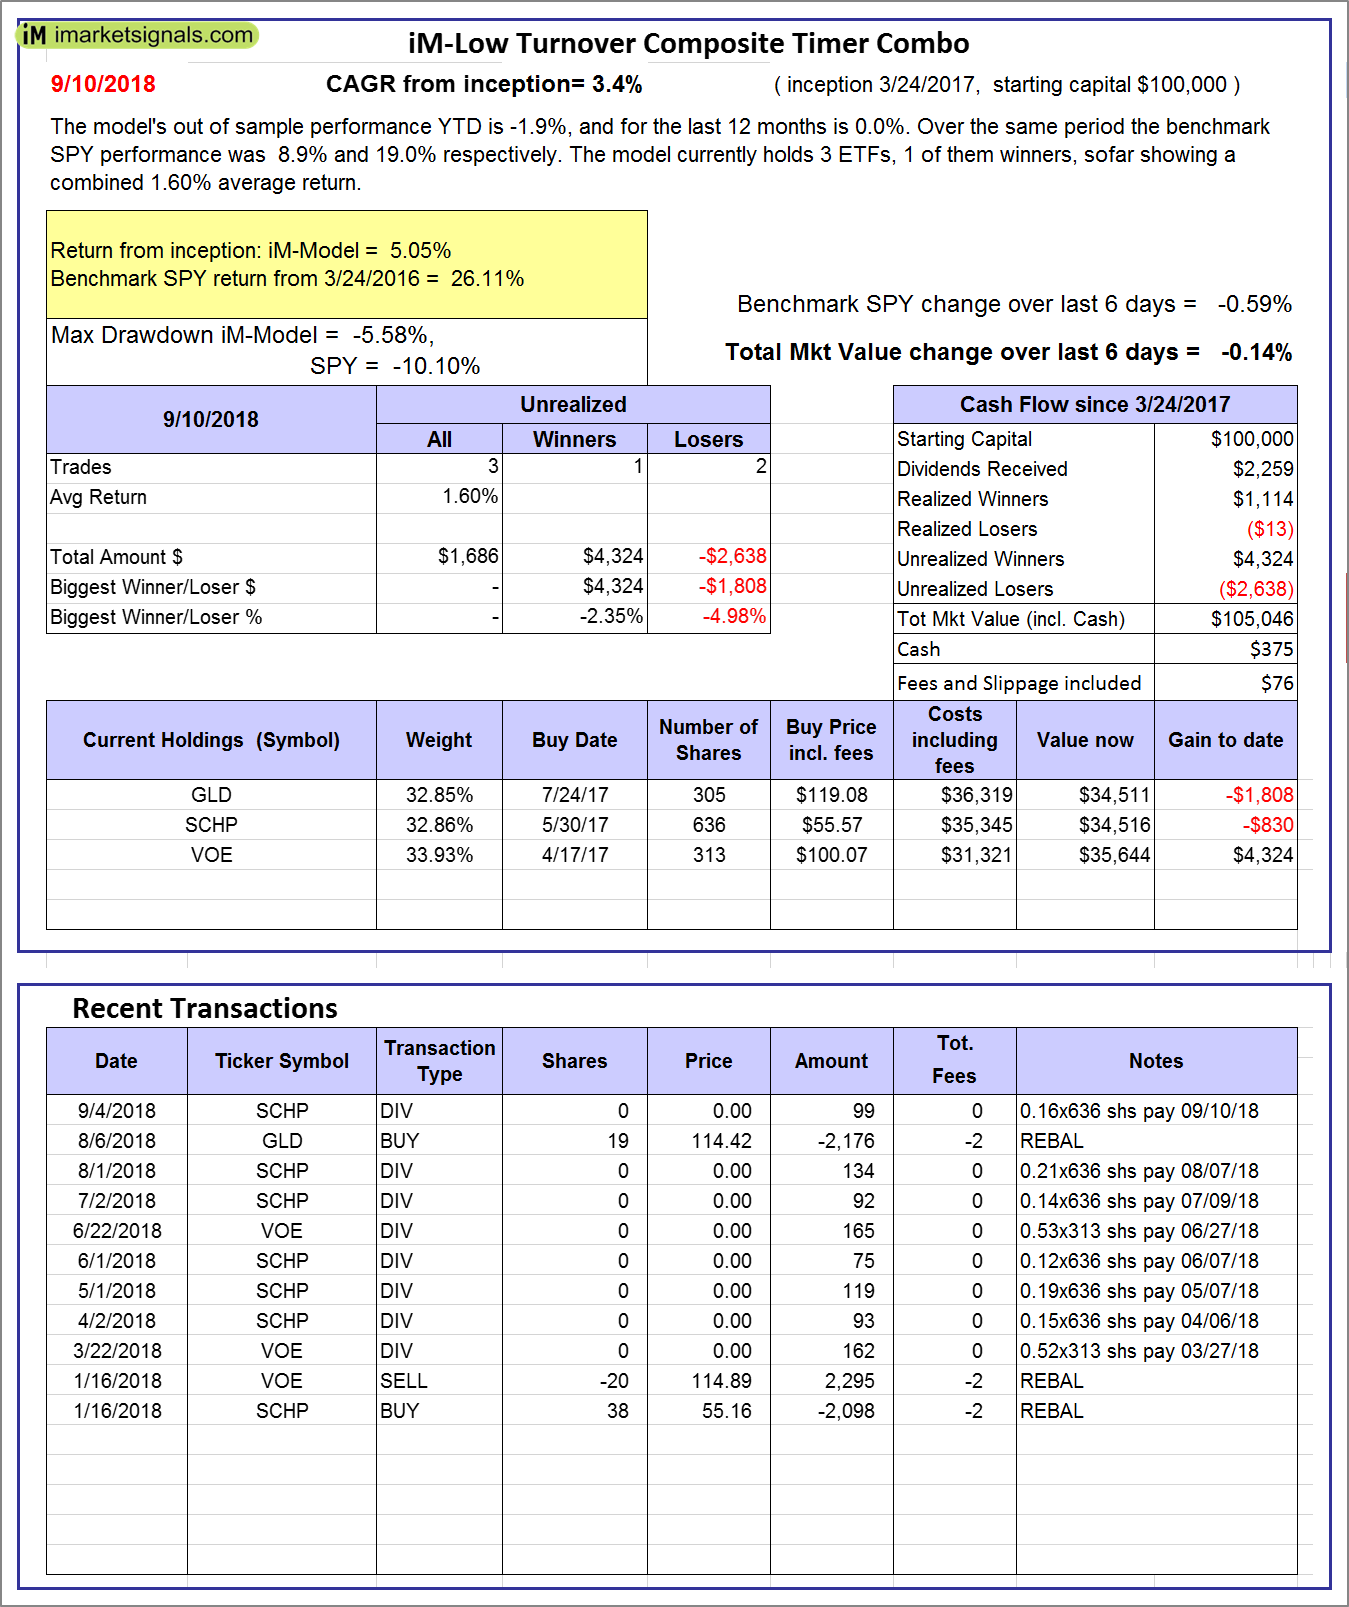 |
iM-Low Turnover Composite Timer Combo: The model’s out of sample performance YTD is -1.9%, and for the last 12 months is 0.0%. Over the same period the benchmark SPY performance was 8.9% and 19.0% respectively. Over the previous week the market value of the iM-Low Turnover Composite Timer Combo gained -0.14% at a time when SPY gained -0.59%. A starting capital of $100,000 at inception on 3/24/27 would have grown to $105,046 which includes $375 cash and excludes $76 spent on fees and slippage. |
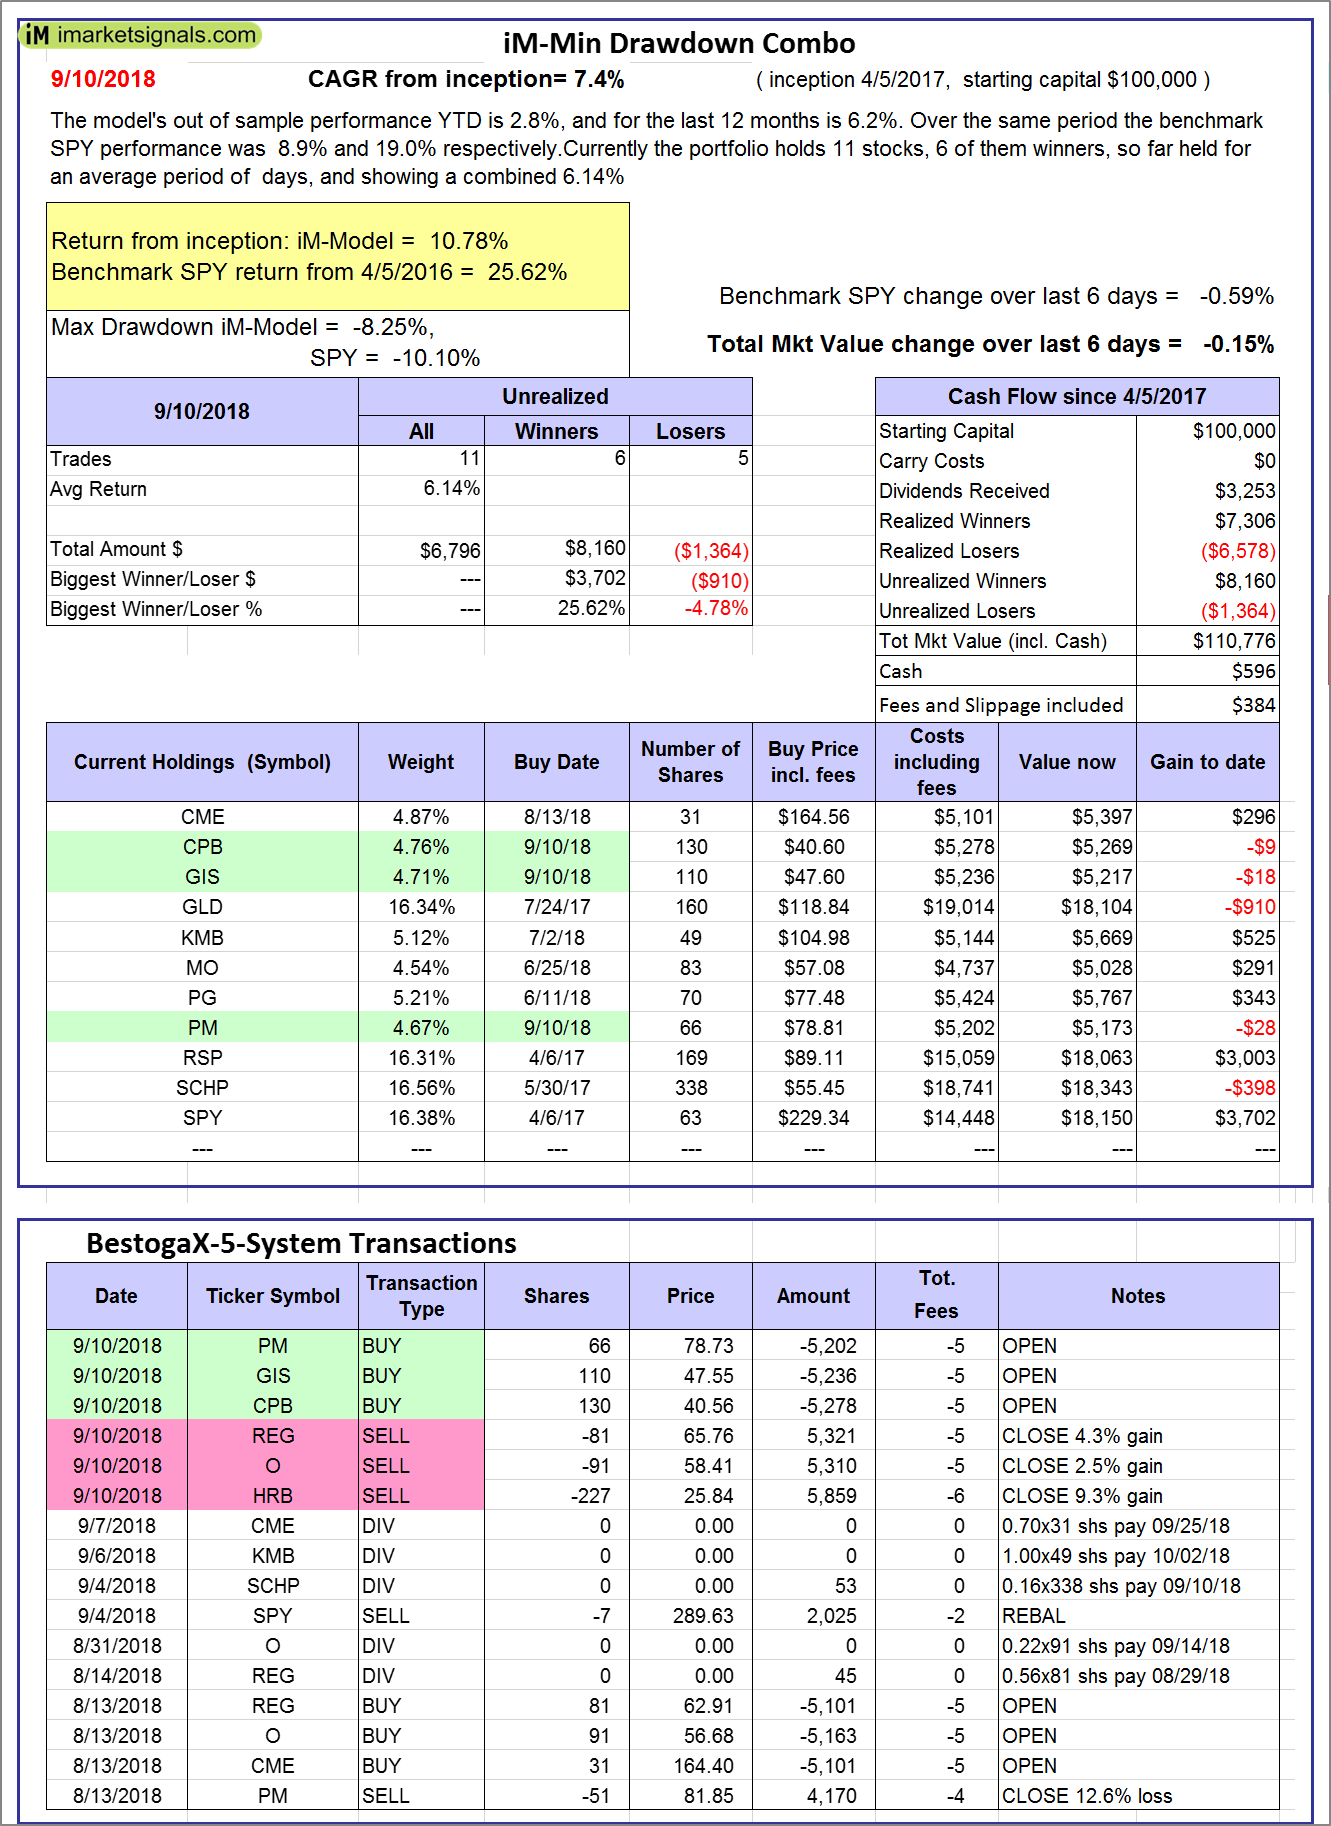 |
iM-Min Drawdown Combo: The model’s out of sample performance YTD is 2.8%, and for the last 12 months is 6.2%. Over the same period the benchmark SPY performance was 8.9% and 19.0% respectively. Over the previous week the market value of the iM-Min Drawdown Combo gained -0.15% at a time when SPY gained -0.59%. A starting capital of $100,000 at inception on 4/5/2017 would have grown to $110,776 which includes $596 cash and excludes $384 spent on fees and slippage. |
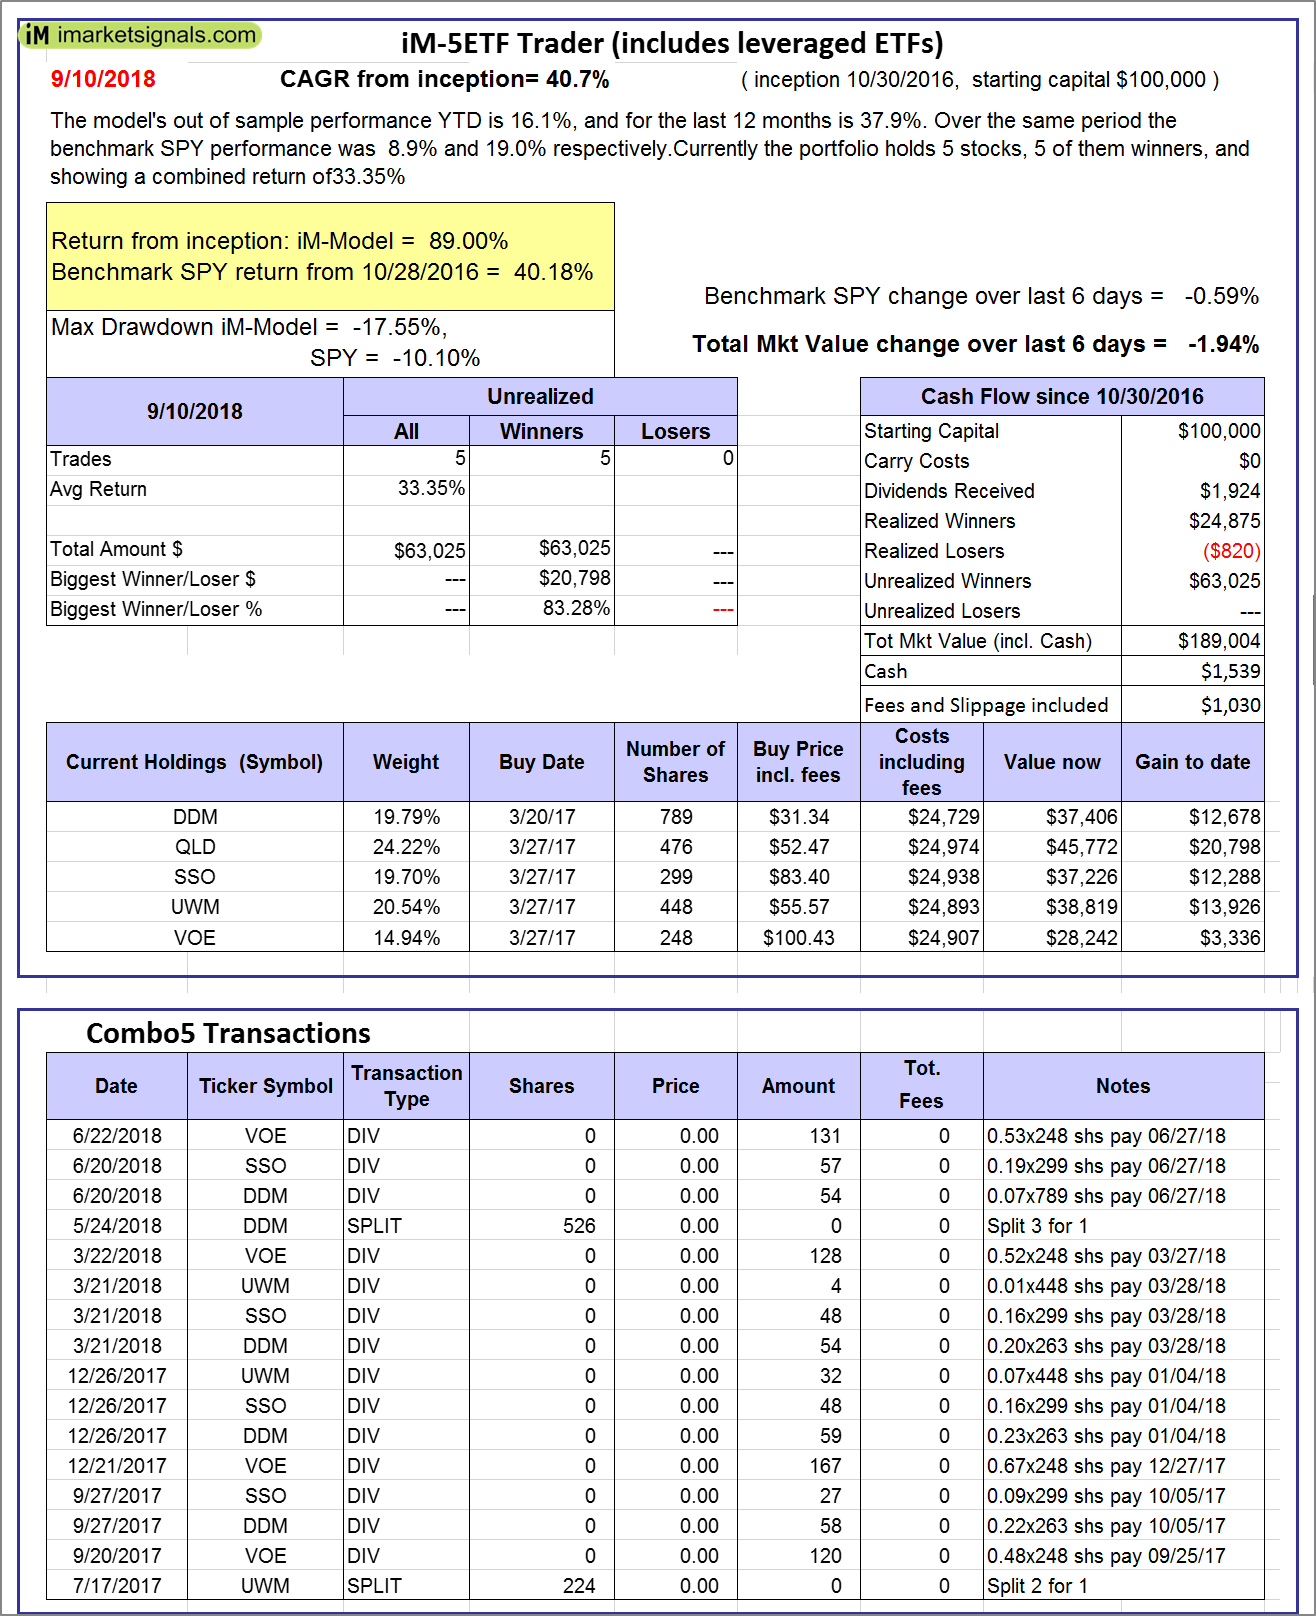 |
iM-5ETF Trader (includes leveraged ETFs): The model’s out of sample performance YTD is 16.1%, and for the last 12 months is 37.9%. Over the same period the benchmark SPY performance was 8.9% and 19.0% respectively. Over the previous week the market value of the iM-5ETF Trader (includes leveraged ETFs) gained -1.94% at a time when SPY gained -0.59%. A starting capital of $100,000 at inception on 10/30/2016 would have grown to $189,004 which includes $1,539 cash and excludes $1,030 spent on fees and slippage. |
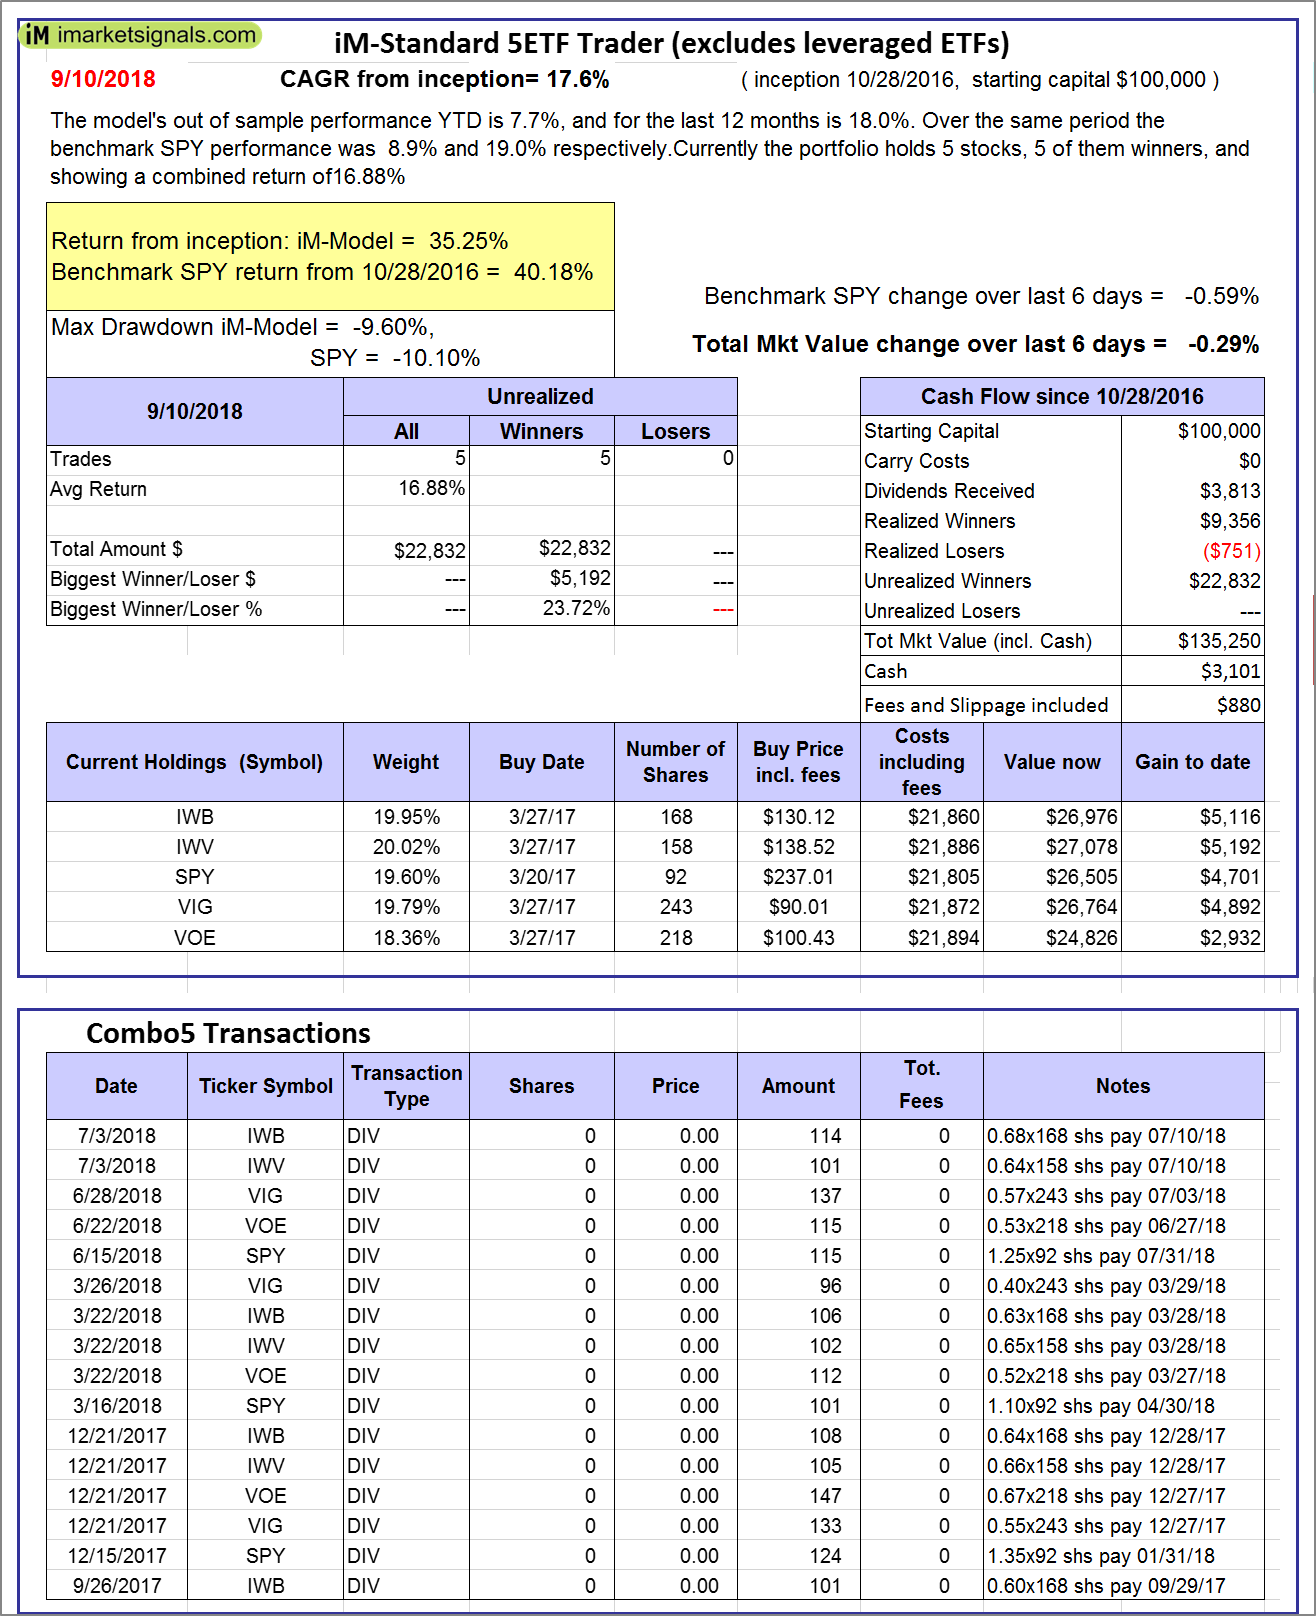 |
iM-Standard 5ETF Trader (excludes leveraged ETFs): The model’s out of sample performance YTD is 7.7%, and for the last 12 months is 18.0%. Over the same period the benchmark SPY performance was 8.9% and 19.0% respectively. Over the previous week the market value of the iM-Standard 5ETF Trader (excludes leveraged ETFs) gained -0.29% at a time when SPY gained -0.59%. A starting capital of $100,000 at inception on 10/30/2016 would have grown to $135,250 which includes $3,101 cash and excludes $880 spent on fees and slippage. |
iM-Best Reports – 9/10/2018
Posted in pmp SPY-SH
Leave a Reply
You must be logged in to post a comment.