
  |
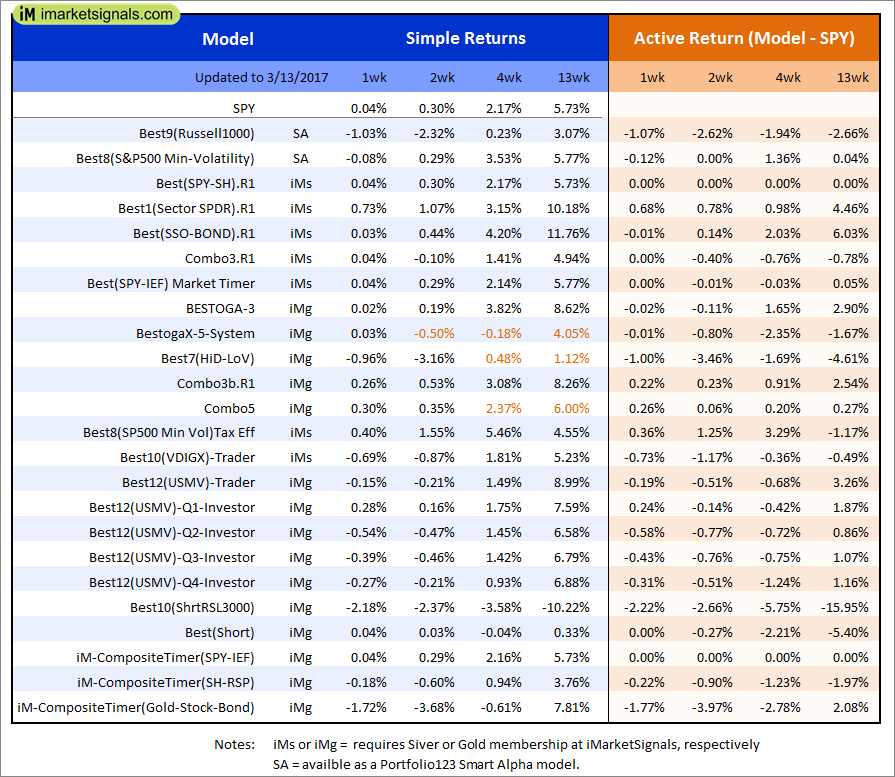
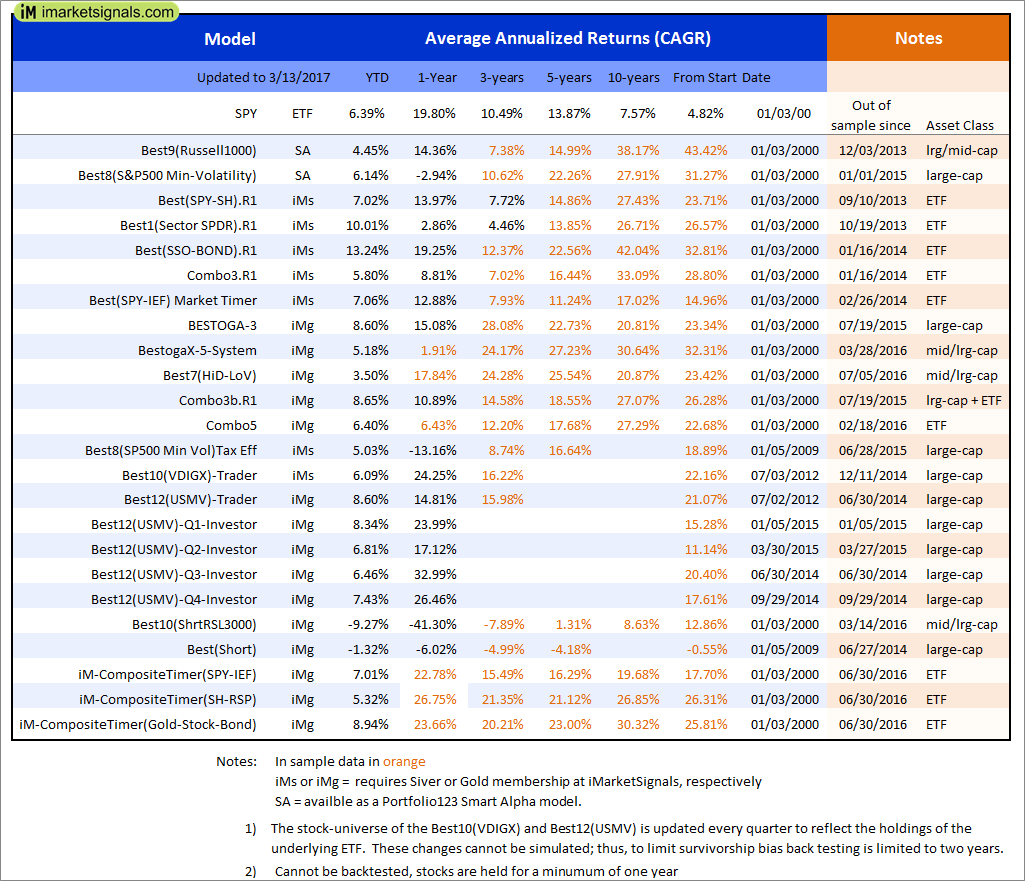
Out of sample performance summary of our models for the past 1, 2, 4 and 13 week periods. The active active return indicates how the models over- or underperformed the benchmark ETF SPY. Also the YTD, and the 1-, 3-, 5- and 10-year annualized returns are shown in the second table |
 |
iM-Best(SPY-SH).R1: The model’s out of sample performance YTD is 7.0%, and for the last 12 months is 14.0%. Over the same period the benchmark SPY performance was 6.4% and 19.8% respectively. Over the previous week the market value of Best(SPY-SH) gained 0.04% at a time when SPY gained 0.04%. A starting capital of $100,000 at inception on 1/2/2009 would have grown to $494,689 which includes $44 cash and excludes $15,358 spent on fees and slippage. |
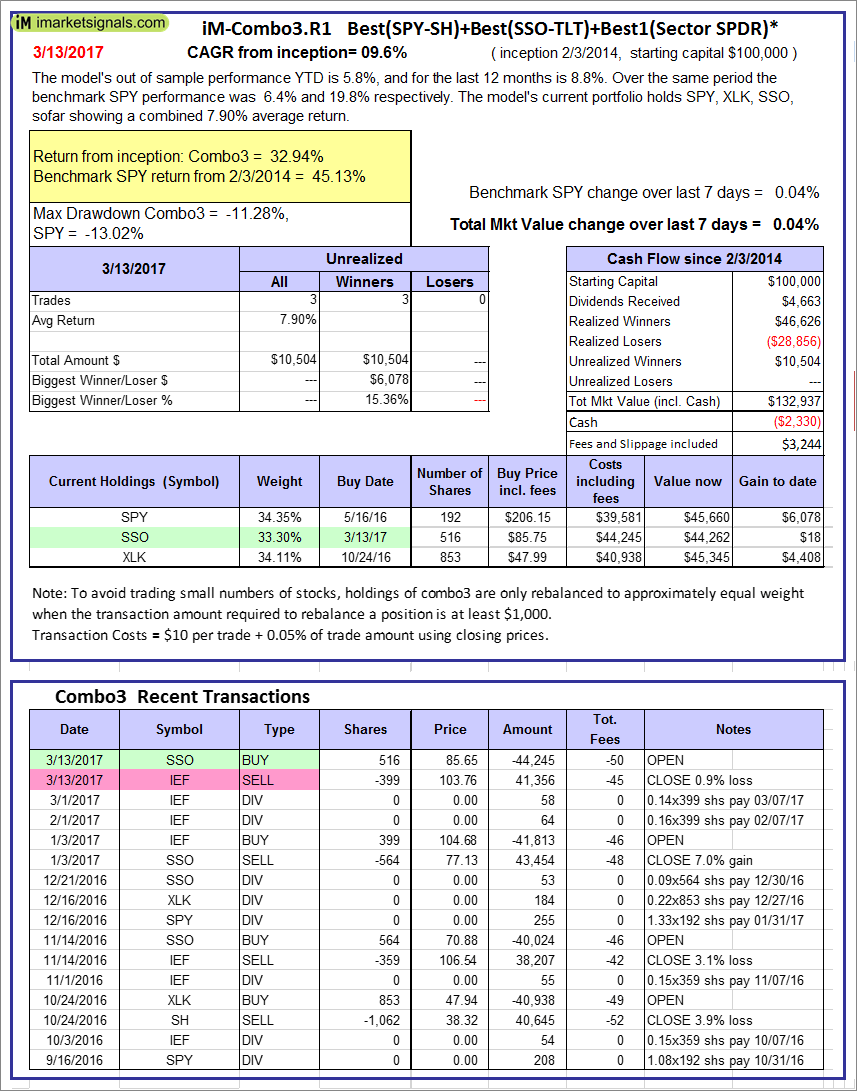 |
iM-Combo3.R1: The model’s out of sample performance YTD is 5.8%, and for the last 12 months is 8.8%. Over the same period the benchmark SPY performance was 6.4% and 19.8% respectively. Over the previous week the market value of iM-Combo3.R1 gained 0.04% at a time when SPY gained 0.04%. A starting capital of $100,000 at inception on 2/3/2014 would have grown to $132,937 which includes -$2,330 cash and excludes $3,244 spent on fees and slippage. |
 |
iM-Combo5: The model’s out of sample performance YTD is 6.4%, and for the last 12 months is 6.4%. Over the same period the benchmark SPY performance was 6.4% and 19.8% respectively. Over the previous week the market value of iM-Combo5 gained 0.30% at a time when SPY gained 0.04%. A starting capital of $100,000 at inception on 2/22/2016 would have grown to $104,941 which includes -$1,498 cash and excludes $505 spent on fees and slippage. |
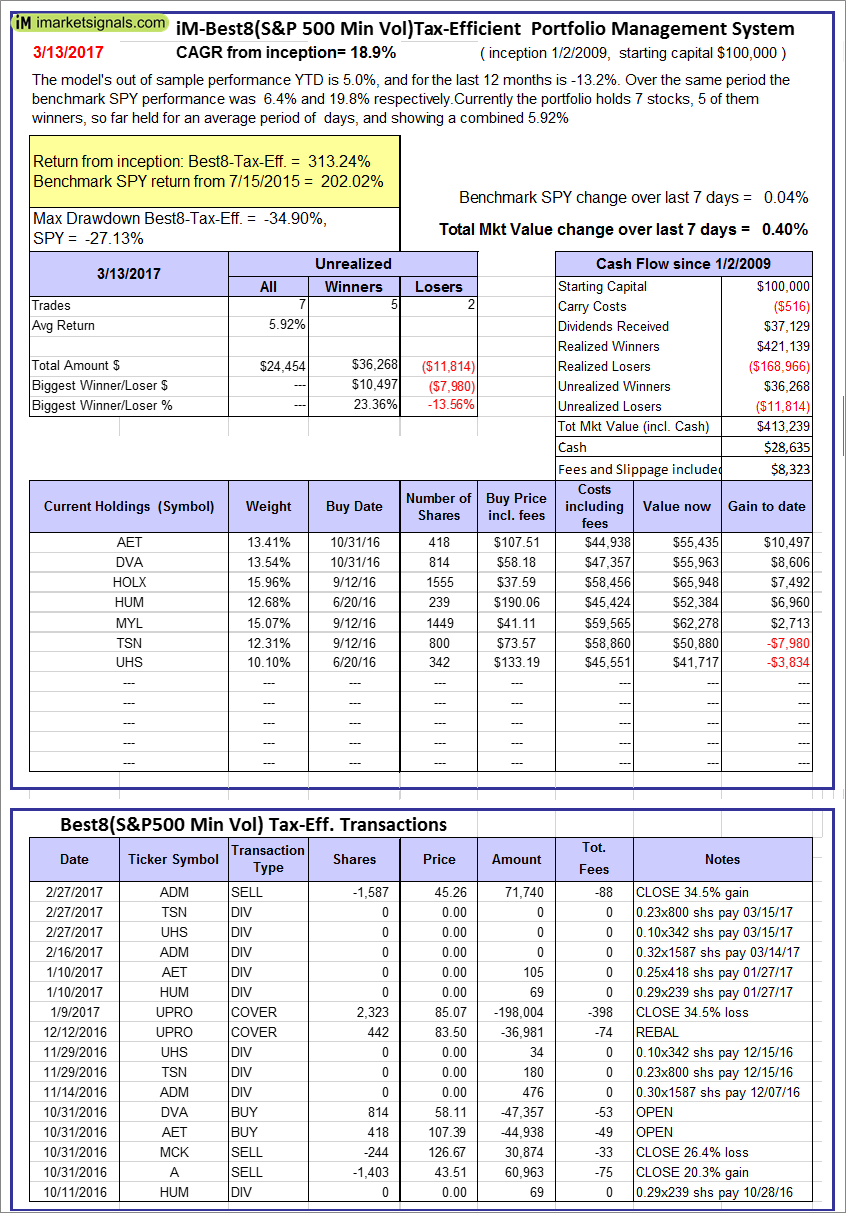 |
The iM-Best8(S&P500 Min Vol)Tax-Efficient The model’s out of sample performance YTD is 5.0%, and for the last 12 months is -13.2%. Over the same period the benchmark SPY performance was 6.4% and 19.8% respectively. Over the previous week the market value of iM-Best8(S&P 500)Tax-Eff. gained 0.40% at a time when SPY gained 0.04%. A starting capital of $100,000 at inception on 1/2/2009 would have grown to $413,239 which includes $28,635 cash and excludes $8,323 spent on fees and slippage. |
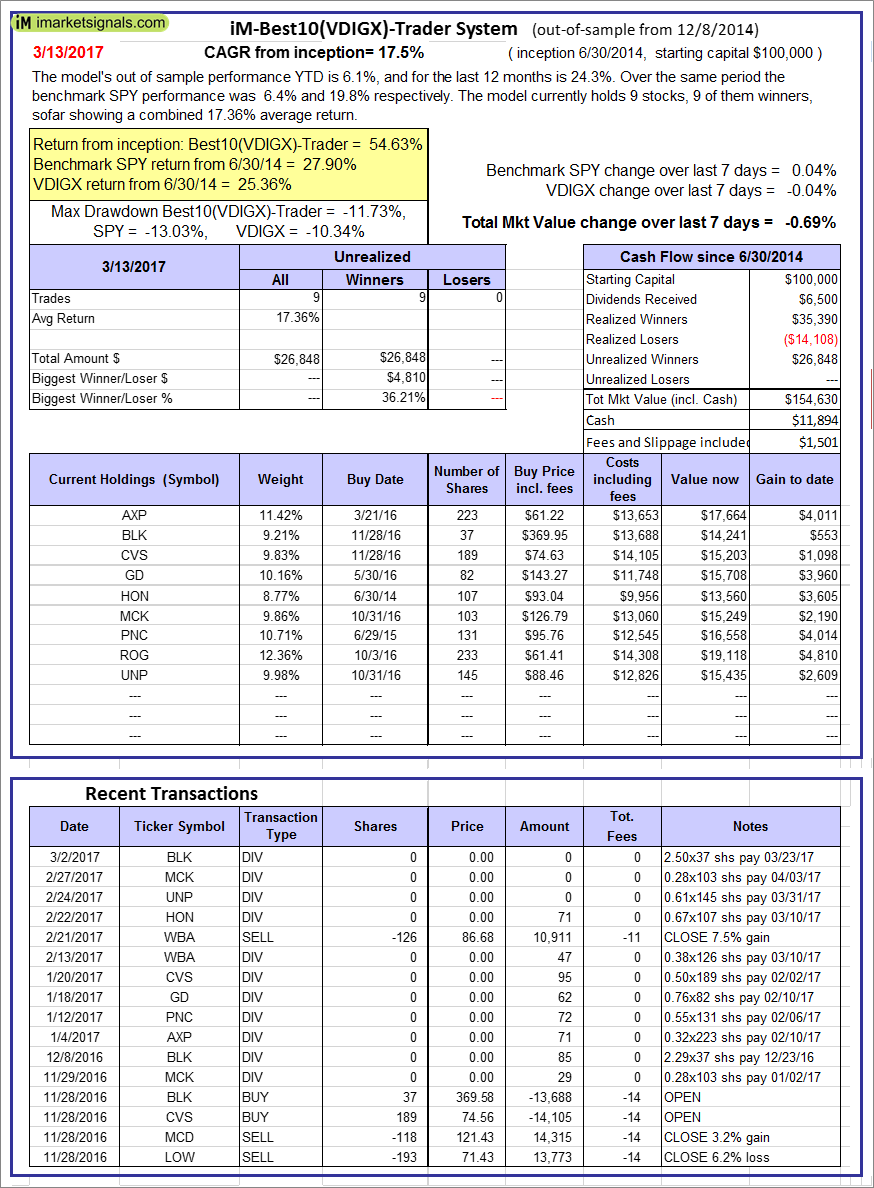 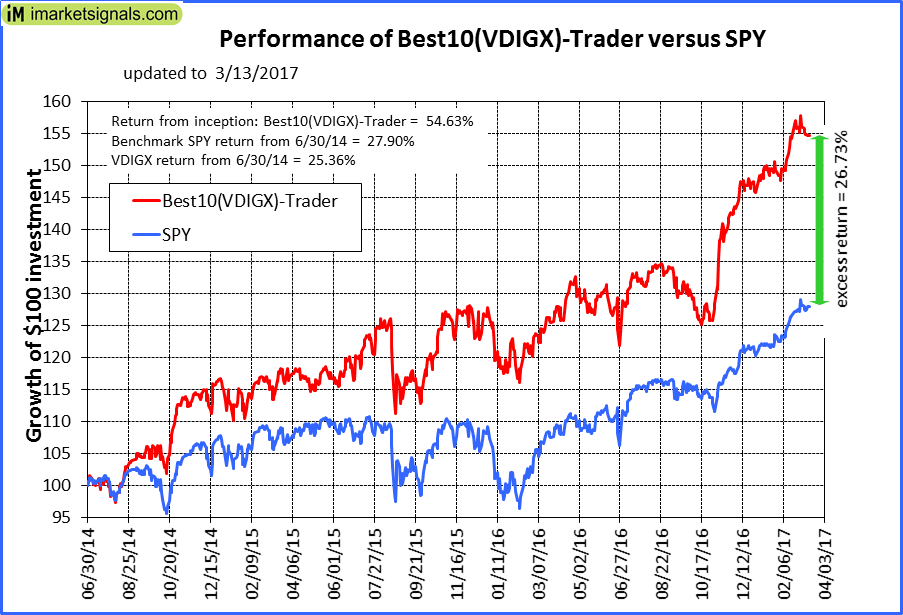 |
iM-Best10(VDIGX)-Trader: The model’s out of sample performance YTD is 6.1%, and for the last 12 months is 24.3%. Over the same period the benchmark SPY performance was 6.4% and 19.8% respectively. Since inception, on 7/1/2014, the model gained 54.63% while the benchmark SPY gained 27.90% and VDIGX gained 25.36% over the same period. Over the previous week the market value of iM-Best10(VDIGX) gained -0.69% at a time when SPY gained 0.04%. A starting capital of $100,000 at inception on 7/1/2014 would have grown to $154,630 which includes $11,894 cash and excludes $1,501 spent on fees and slippage. |
 |
iM-Best2 MC-Score ETF System: The model’s out of sample performance YTD is 6.3%, and since inception 3.0%. Over the same period the benchmark SPY performance was 6.4% and 14.8% respectively. Over the previous week the market value of iM-BESTOGA-3 gained 0.24% at a time when SPY gained 0.04%. A starting capital of $100,000 at inception on 6/30/2016 would have grown to $746 which includes $105 cash and excludes Gain to date spent on fees and slippage. |
 |
iM-BESTOGA-3: The model’s out of sample performance YTD is 8.6%, and for the last 12 months is 15.1%. Over the same period the benchmark SPY performance was 6.4% and 19.8% respectively. Over the previous week the market value of iM-BESTOGA-3 gained 0.02% at a time when SPY gained 0.04%. A starting capital of $100,000 at inception on 2/3/2014 would have grown to $219,767 which includes $21,406 cash and excludes $767 spent on fees and slippage. |
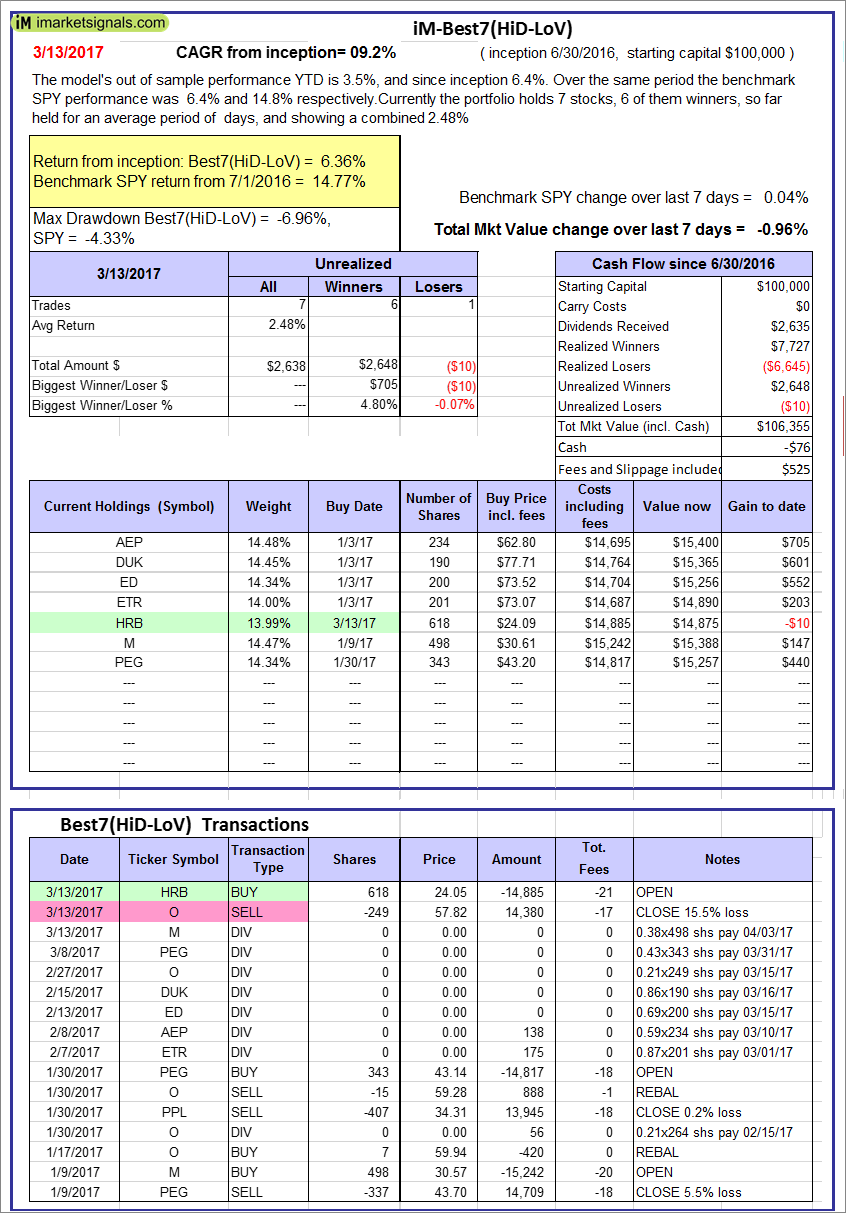 |
iM-Best7(HiD-LoV): The model’s out of sample performance YTD is 3.5%, and since inception 6.4%. Over the same period the benchmark SPY performance was 6.4% and 14.8% respectively. Over the previous week the market value of iM-BESTOGA-3 gained -0.96% at a time when SPY gained 0.04%. A starting capital of $100,000 at inception on 6/30/2016 would have grown to $106,355 which includes -$76 cash and excludes $525 spent on fees and slippage. |
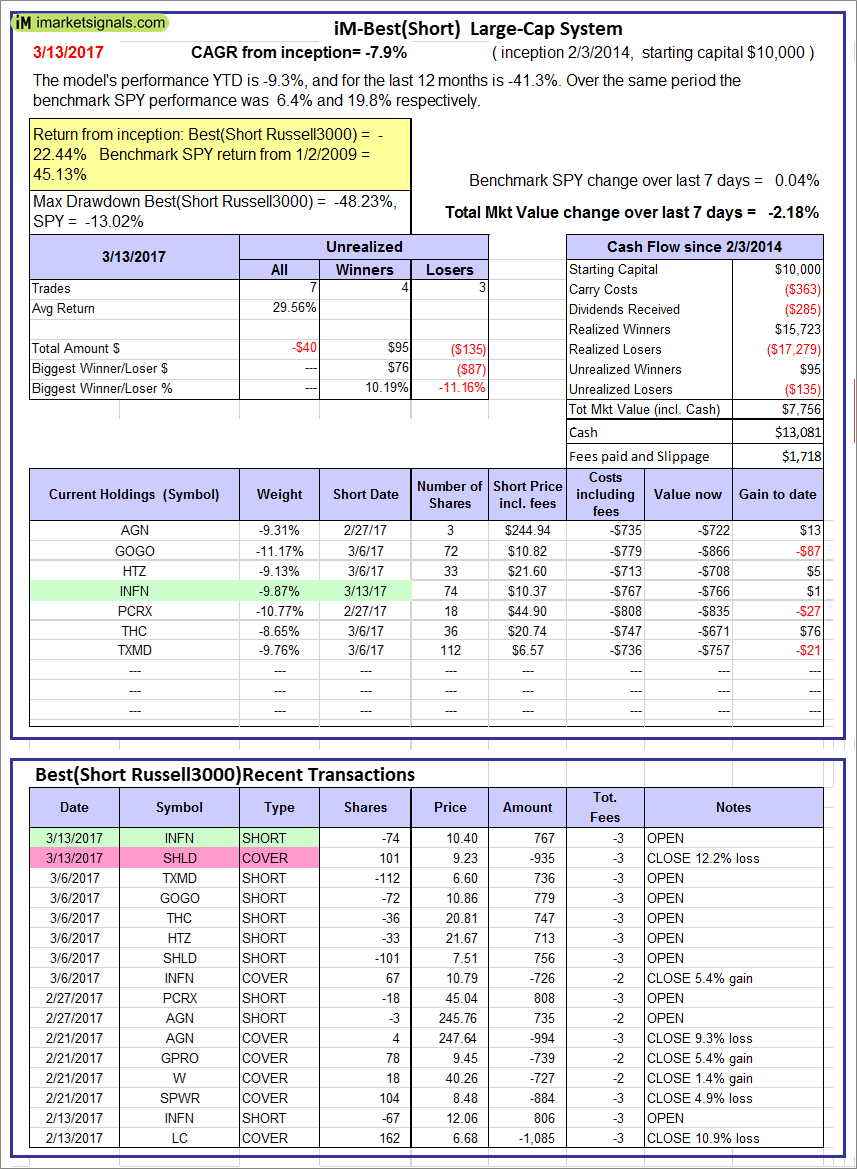 |
iM-Best10(Short Russell3000): The model’s performance YTD is -9.3%, and for the last 12 months is -41.3%. Over the same period the benchmark SPY performance was 6.4% and 19.8% respectively. Over the previous week the market value of iM-Best10(Short Russell3000) gained -2.18% at a time when SPY gained 0.04%. Over the period 2/3/2014 to 3/13/2017 the starting capital of $100,000 would have grown to $7,756 which includes $13,081 cash and excludes $1,718 spent on fees and slippage. |
 |
iM-BestogaX5-System: The model’s out of sample performance YTD is 5.2%, and since inception 3.7%. Over the same period the benchmark SPY performance was 6.4% and 18.9% respectively. Over the previous week the market value of iM-Best8(S&P 500)Tax-Eff. gained 0.03% at a time when SPY gained 0.04%. A starting capital of $100,000 at inception on 3/28/2016 would have grown to $103,662 which includes $540 cash and excludes $488 spent on fees and slippage. |
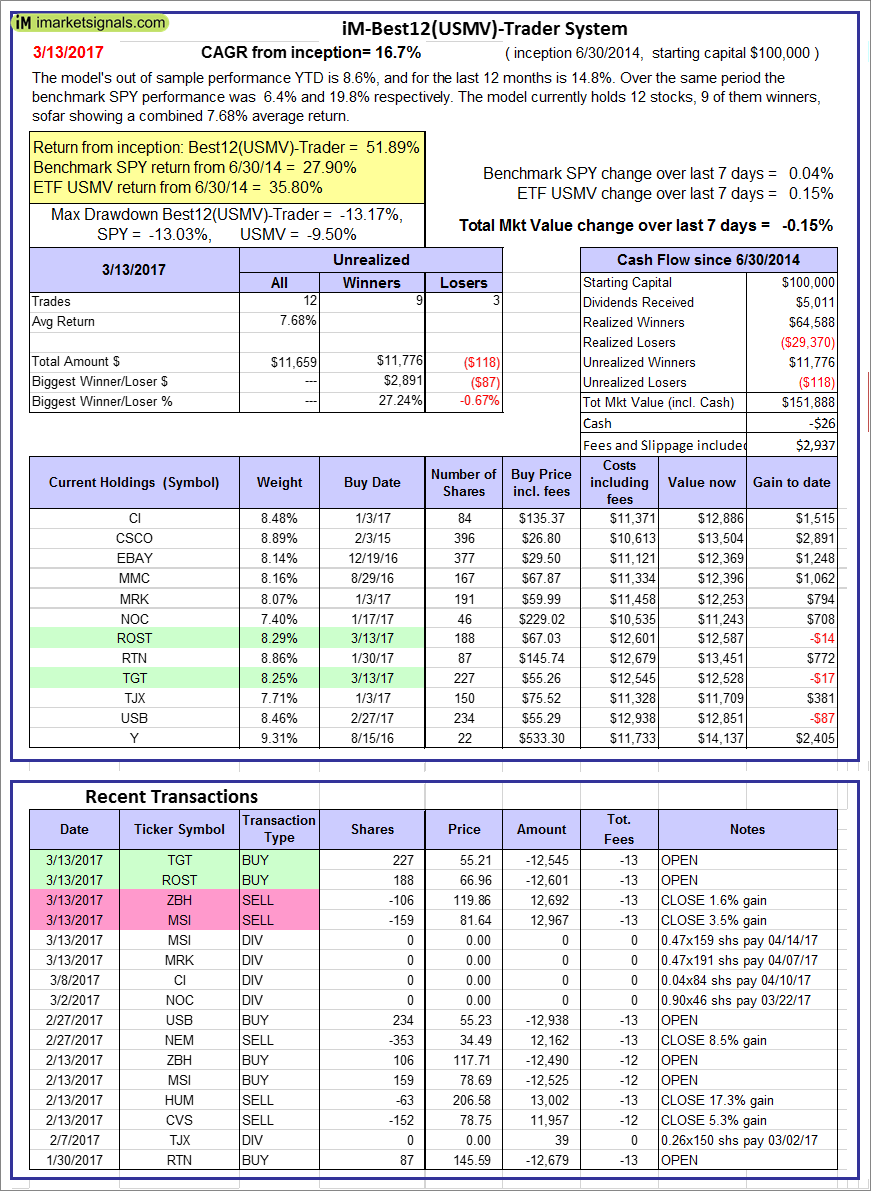 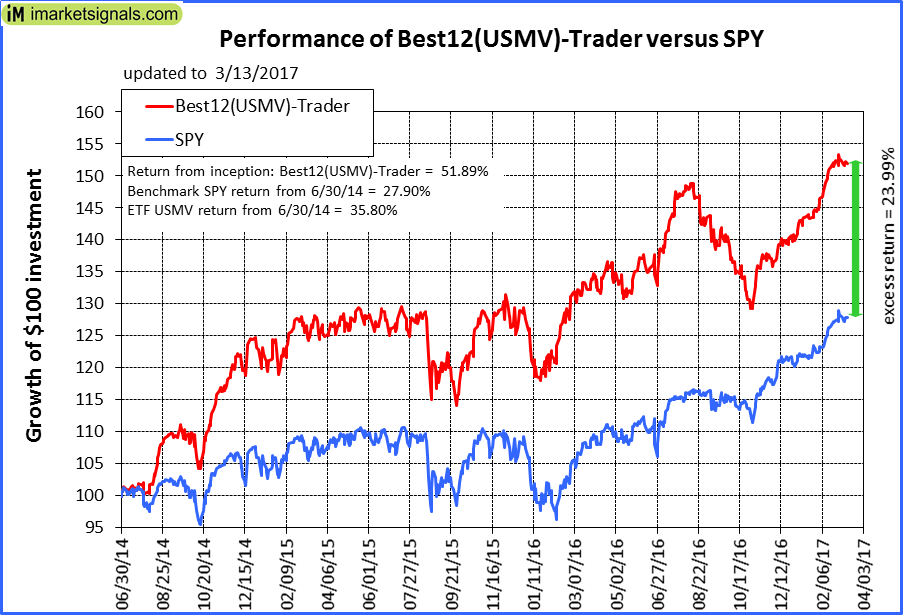 |
iM-Best12(USMV)-Trader: The model’s out of sample performance YTD is 8.6%, and for the last 12 months is 14.8%. Over the same period the benchmark SPY performance was 6.4% and 19.8% respectively. Since inception, on 7/1/2014, the model gained 51.89% while the benchmark SPY gained 27.90% and the ETF USMV gained 35.80% over the same period. Over the previous week the market value of iM-Best12(USMV)-Trader gained -0.15% at a time when SPY gained 0.04%. A starting capital of $100,000 at inception on 7/1/2014 would have grown to $151,888 which includes -$26 cash and excludes $2,937 spent on fees and slippage. |
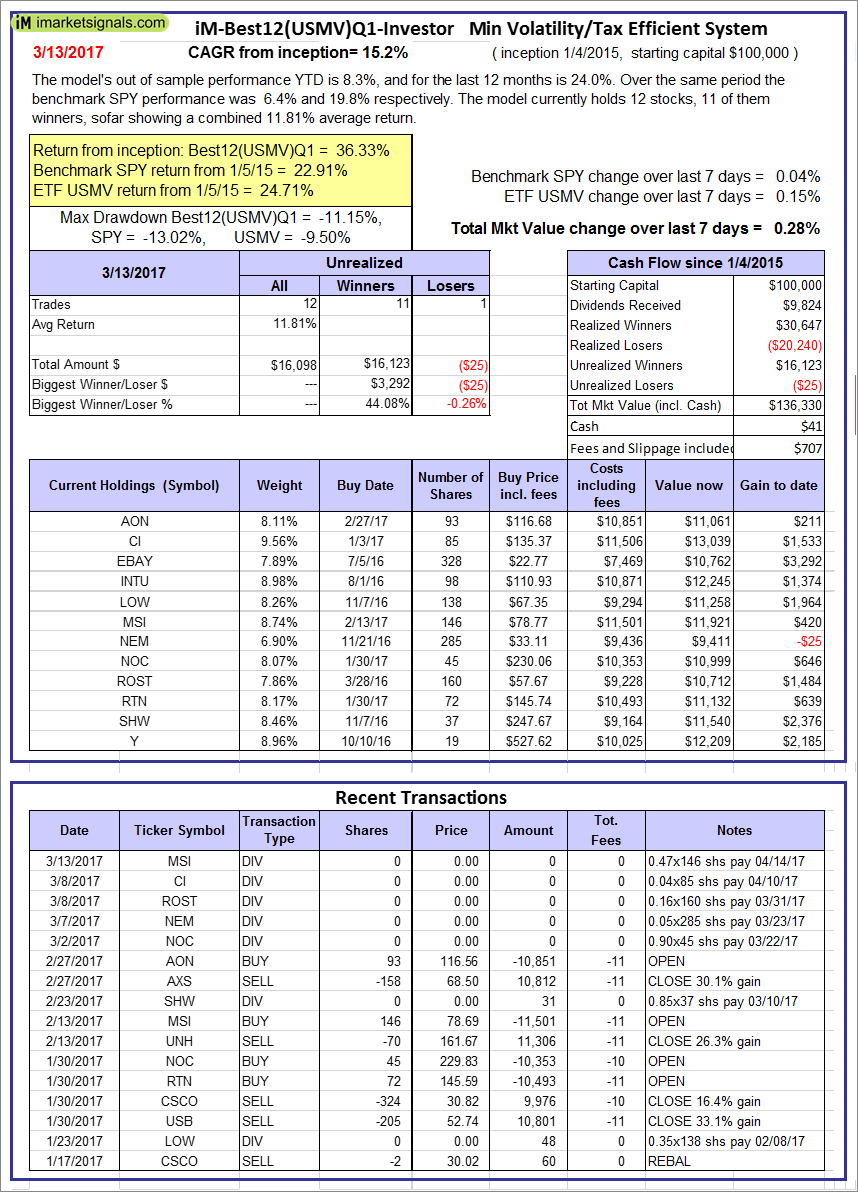 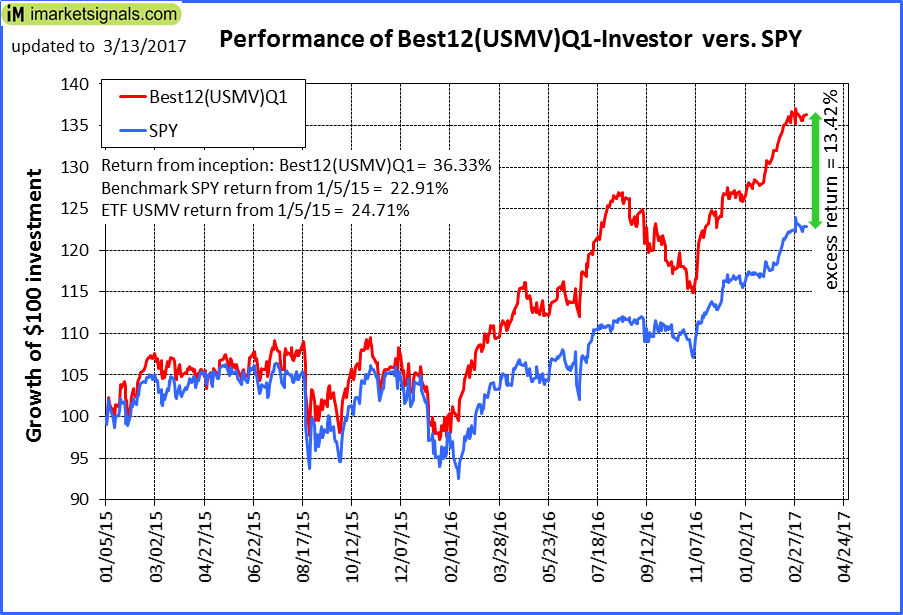 |
iM-Best12(USMV)Q1-Investor: The model’s out of sample performance YTD is 8.3%, and for the last 12 months is 24.0%. Over the same period the benchmark SPY performance was 6.4% and 19.8% respectively. Since inception, on 1/5/2015, the model gained 36.33% while the benchmark SPY gained 22.91% and the ETF USMV gained 24.71% over the same period. Over the previous week the market value of iM-Best12(USMV)Q1 gained 0.28% at a time when SPY gained 0.04%. A starting capital of $100,000 at inception on 1/5/2015 would have grown to $136,330 which includes $41 cash and excludes $707 spent on fees and slippage. |
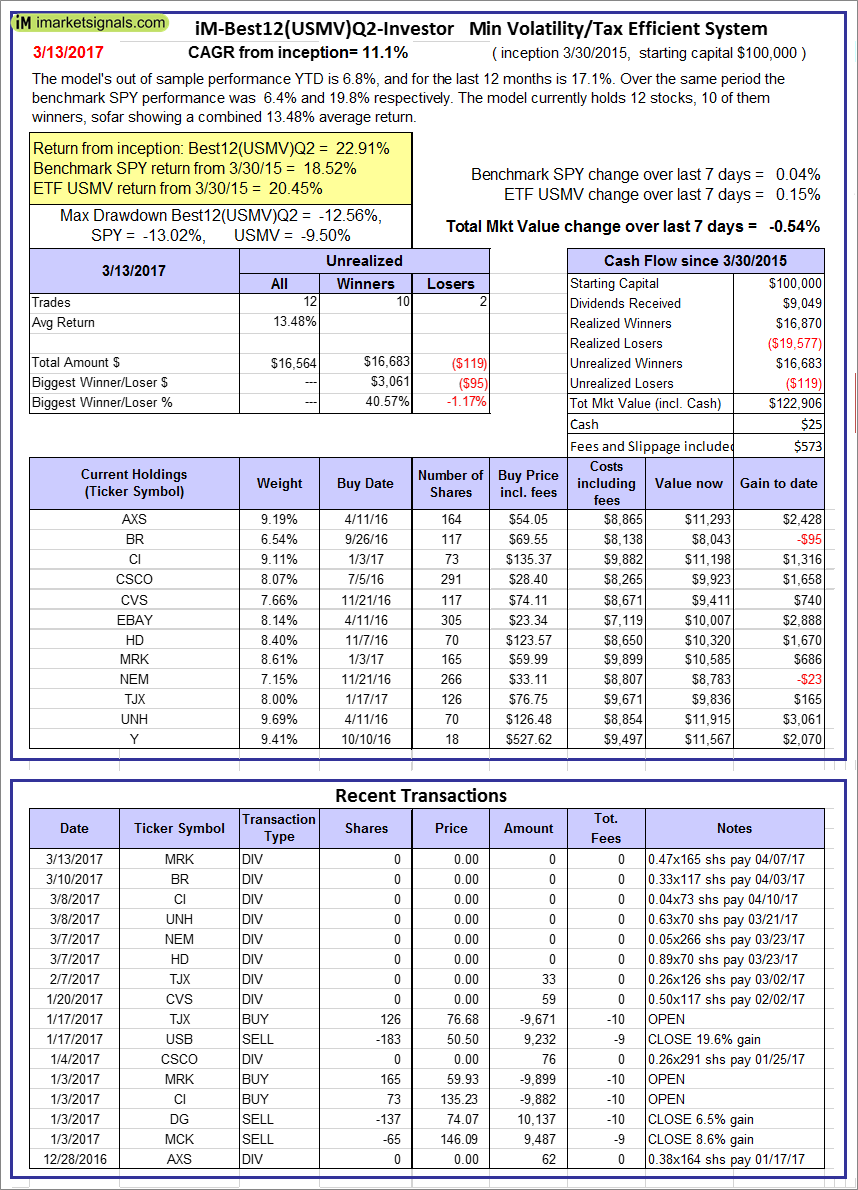  |
iM-Best12(USMV)Q2-Investor: The model’s out of sample performance YTD is 6.8%, and for the last 12 months is 17.1%. Over the same period the benchmark SPY performance was 6.4% and 19.8% respectively. Since inception, on 3/31/2015, the model gained 22.91% while the benchmark SPY gained 18.52% and the ETF USMV gained 20.45% over the same period. Over the previous week the market value of iM-Best12(USMV)Q2 gained -0.54% at a time when SPY gained 0.04%. A starting capital of $100,000 at inception on 3/31/2015 would have grown to $122,906 which includes $25 cash and excludes $573 spent on fees and slippage. |
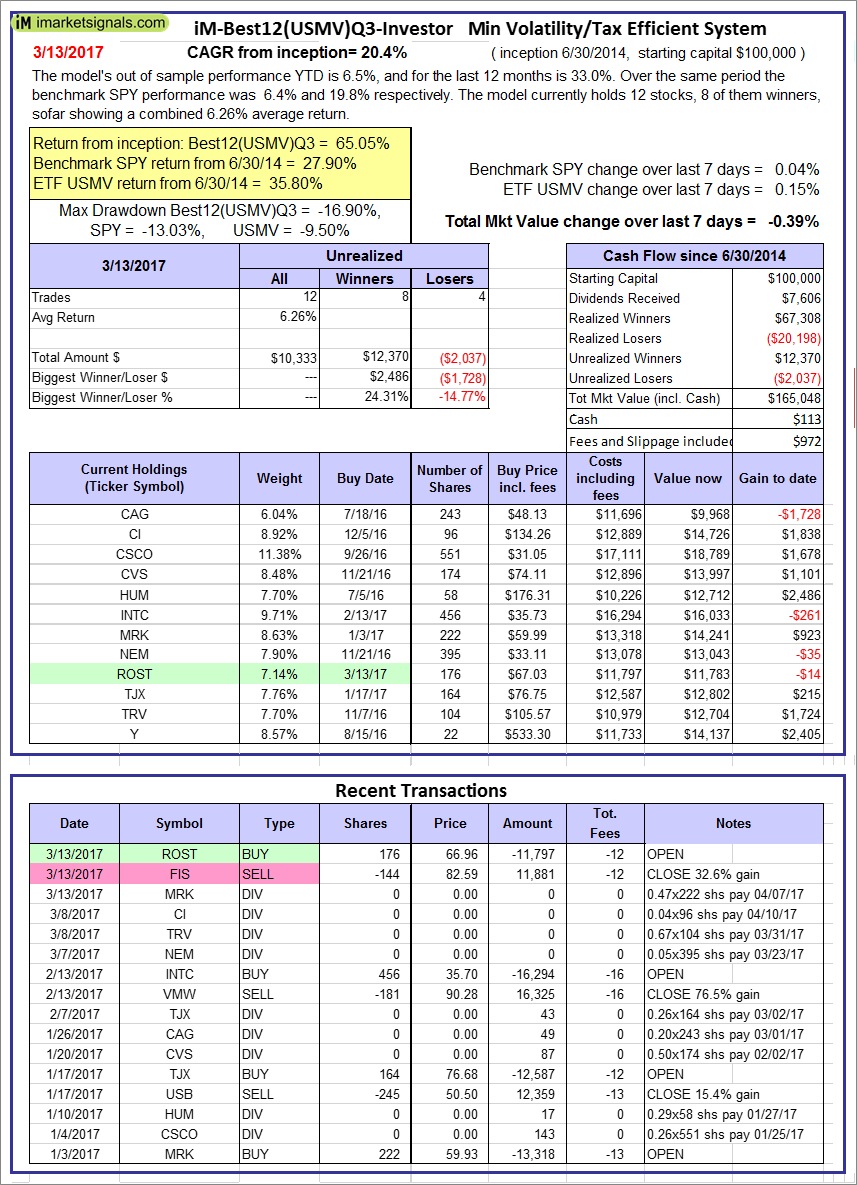 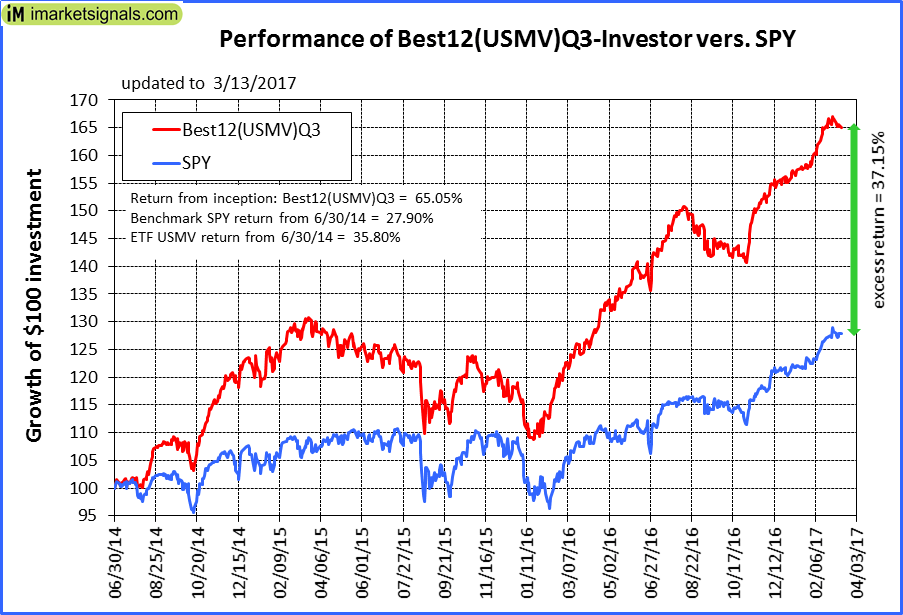 |
iM-Best12(USMV)Q3-Investor: The model’s out of sample performance YTD is 6.5%, and for the last 12 months is 33.0%. Over the same period the benchmark SPY performance was 6.4% and 19.8% respectively. Since inception, on 7/1/2014, the model gained 65.05% while the benchmark SPY gained 27.90% and the ETF USMV gained 35.80% over the same period. Over the previous week the market value of iM-Best12(USMV)Q3 gained -0.39% at a time when SPY gained 0.04%. A starting capital of $100,000 at inception on 7/1/2014 would have grown to $165,048 which includes $113 cash and excludes $972 spent on fees and slippage. |
 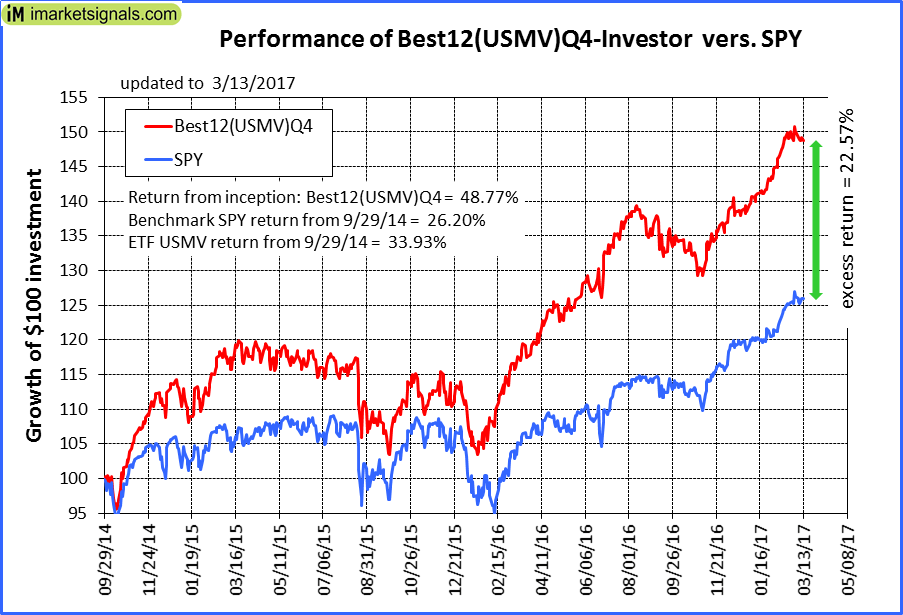 |
iM-Best12(USMV)Q4-Investor: Since inception, on 9/30/2014, the model gained 48.77% while the benchmark SPY gained 26.20% and the ETF USMV gained 33.93% over the same period. Over the previous week the market value of iM-Best12(USMV)Q4 gained -0.27% at a time when SPY gained 0.04%. A starting capital of $100,000 at inception on 9/30/2014 would have grown to $148,769 which includes $120 cash and excludes $827 spent on fees and slippage. |
 |
Average Performance of iM-Best12(USMV)Q1+Q2+Q3+Q4-Investor resulted in an excess return of 33.38% over SPY. (see iM-USMV Investor Portfolio) |
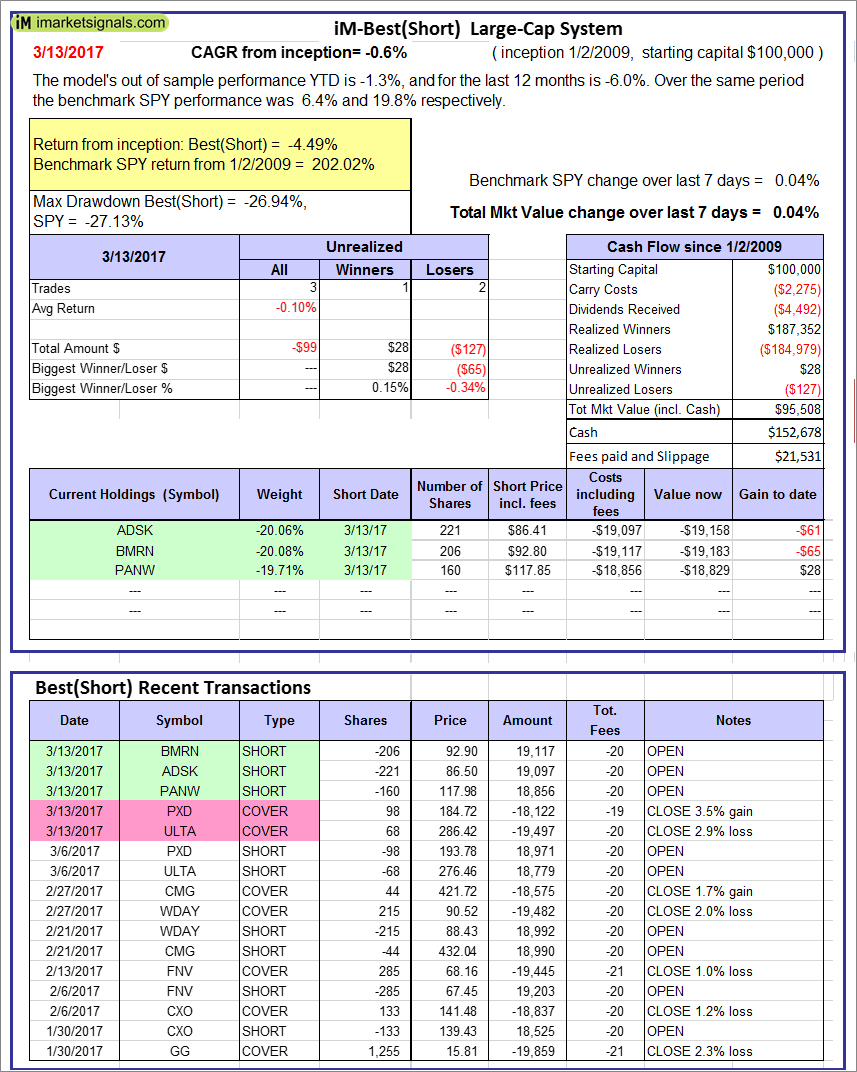 |
iM-Best(Short): The model’s out of sample performance YTD is -1.3%, and for the last 12 months is -6.0%. Over the same period the benchmark SPY performance was 6.4% and 19.8% respectively. Over the previous week the market value of iM-Best(Short) gained 0.04% at a time when SPY gained 0.04%. Over the period 1/2/2009 to 3/13/2017 the starting capital of $100,000 would have grown to $95,508 which includes $152,678 cash and excludes $21,531 spent on fees and slippage. |
iM-Best Reports – 3/13/2017
Posted in pmp SPY-SH
Leave a Reply
You must be logged in to post a comment.