
  |
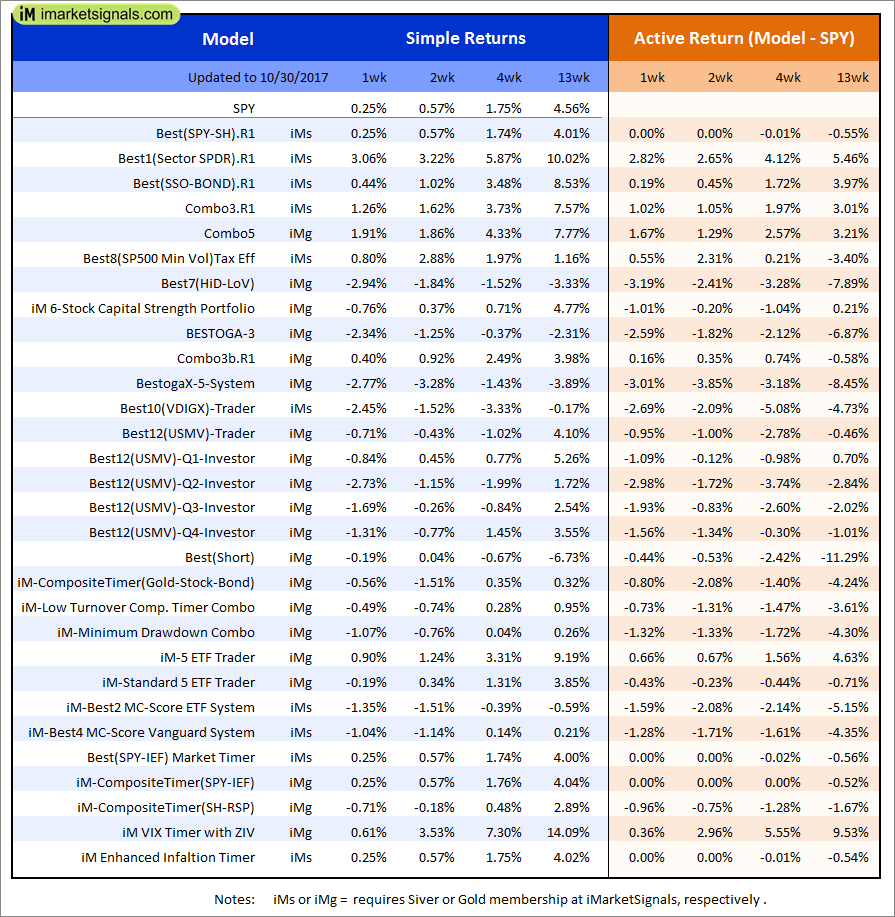
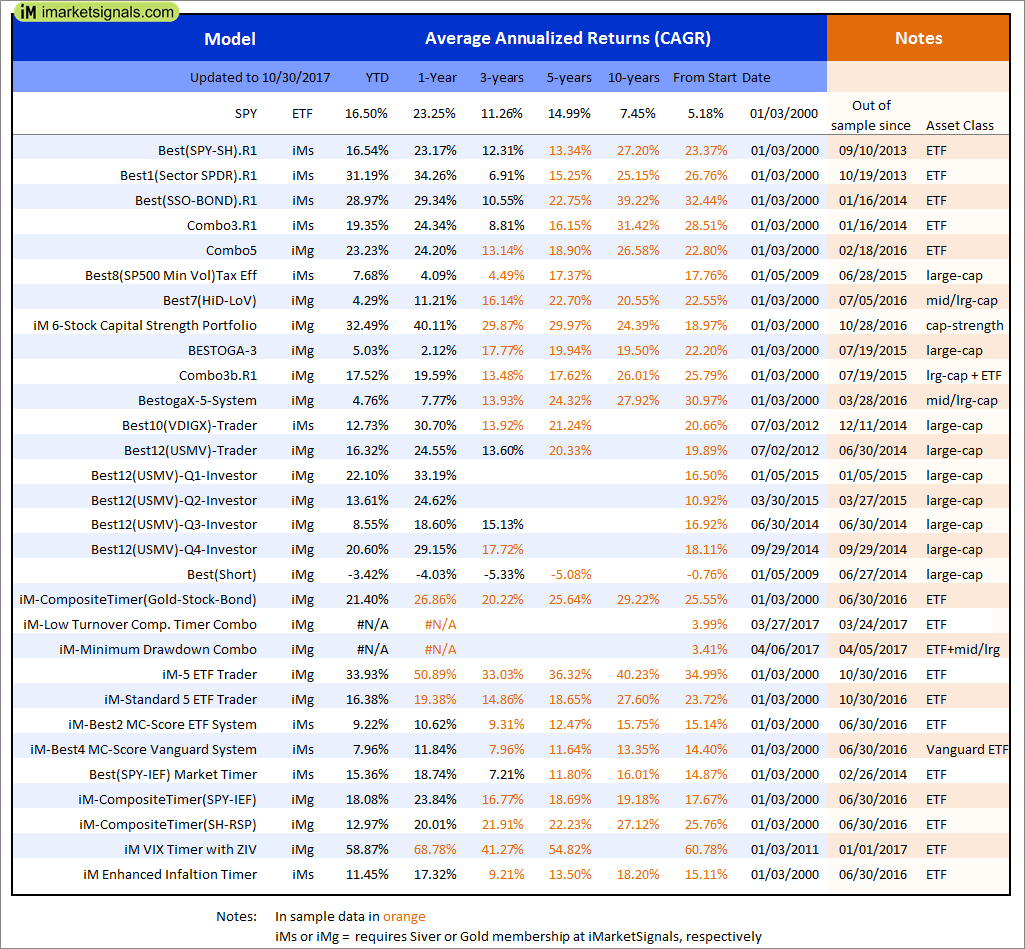
Out of sample performance summary of our models for the past 1, 2, 4 and 13 week periods. The active active return indicates how the models over- or underperformed the benchmark ETF SPY. Also the YTD, and the 1-, 3-, 5- and 10-year annualized returns are shown in the second table |
 |
iM-Best(SPY-SH).R1: The model’s out of sample performance YTD is 16.5%, and for the last 12 months is 23.2%. Over the same period the benchmark SPY performance was 16.5% and 23.2% respectively. Over the previous week the market value of Best(SPY-SH) gained 0.25% at a time when SPY gained 0.25%. A starting capital of $100,000 at inception on 1/2/2009 would have grown to $538,694 which includes $4,654 cash and excludes $15,358 spent on fees and slippage. |
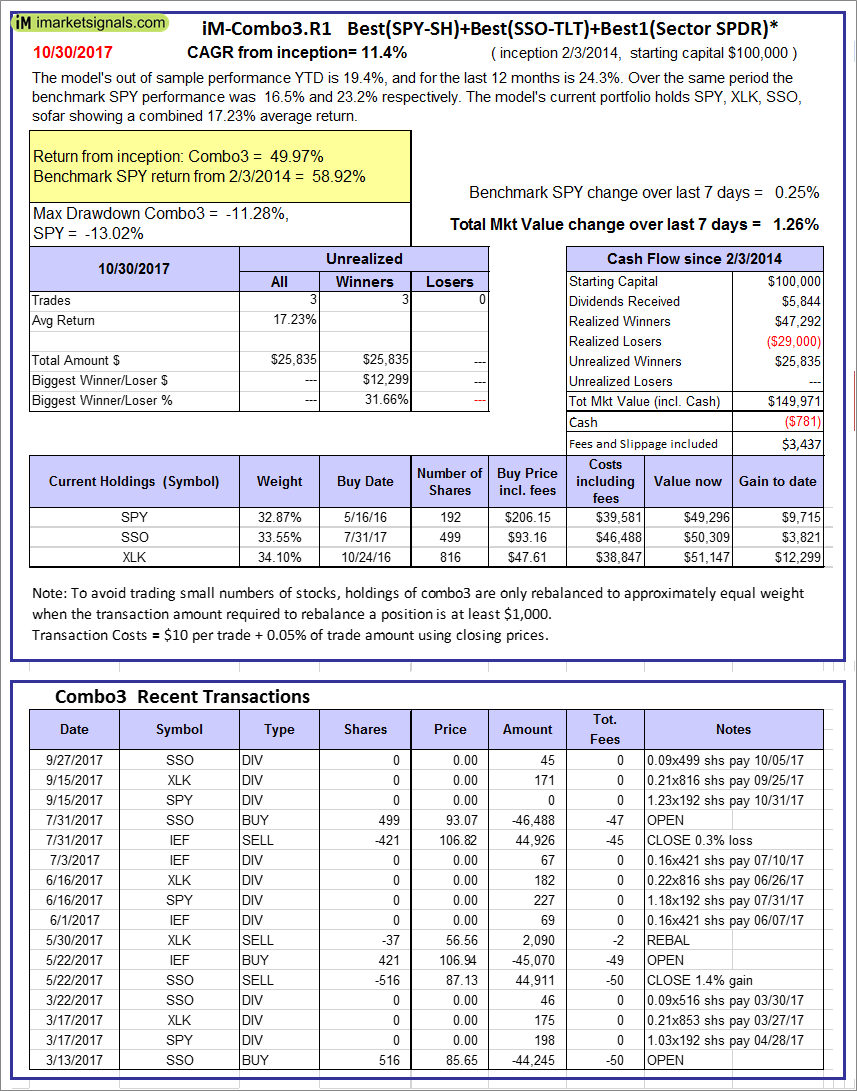 |
iM-Combo3.R1: The model’s out of sample performance YTD is 19.4%, and for the last 12 months is 24.3%. Over the same period the benchmark SPY performance was 16.5% and 23.2% respectively. Over the previous week the market value of iM-Combo3.R1 gained 1.26% at a time when SPY gained 0.25%. A starting capital of $100,000 at inception on 2/3/2014 would have grown to $149,971 which includes -$781 cash and excludes $3,437 spent on fees and slippage. |
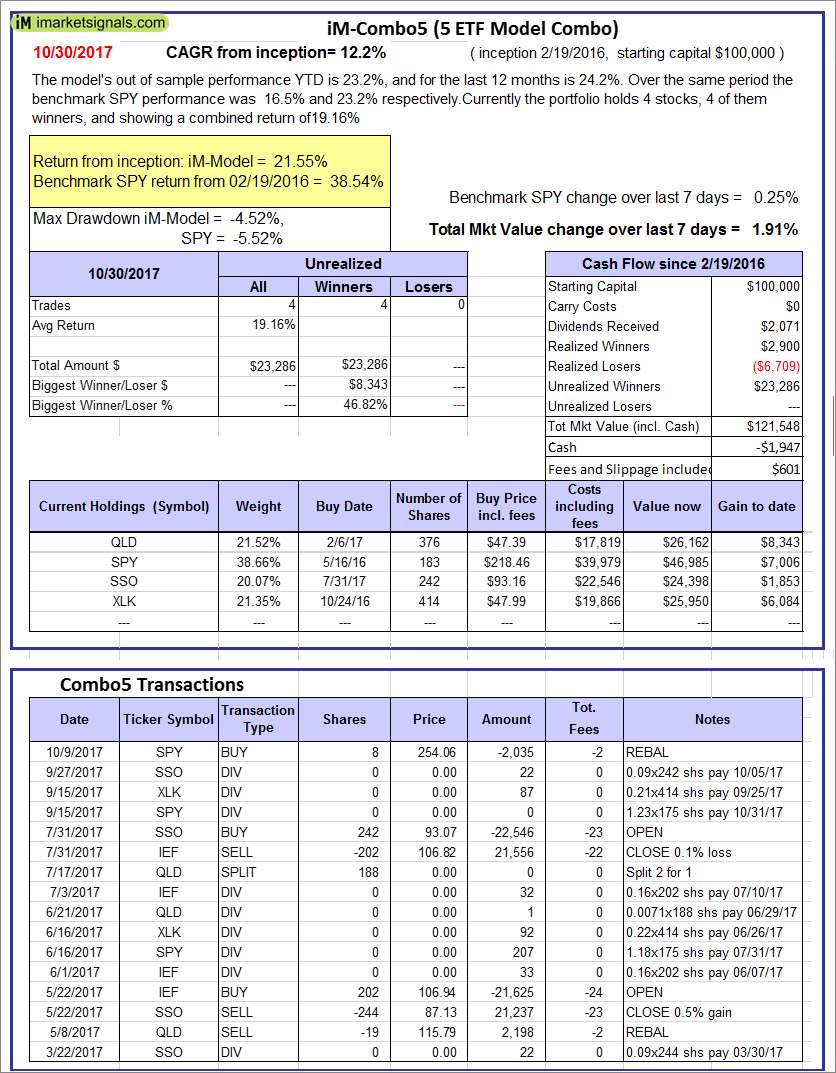 |
iM-Combo5: The model’s out of sample performance YTD is 23.2%, and for the last 12 months is 24.2%. Over the same period the benchmark SPY performance was 16.5% and 23.2% respectively. Over the previous week the market value of iM-Combo5 gained 1.91% at a time when SPY gained 0.25%. A starting capital of $100,000 at inception on 2/22/2016 would have grown to $121,548 which includes -$1,947 cash and excludes $601 spent on fees and slippage. |
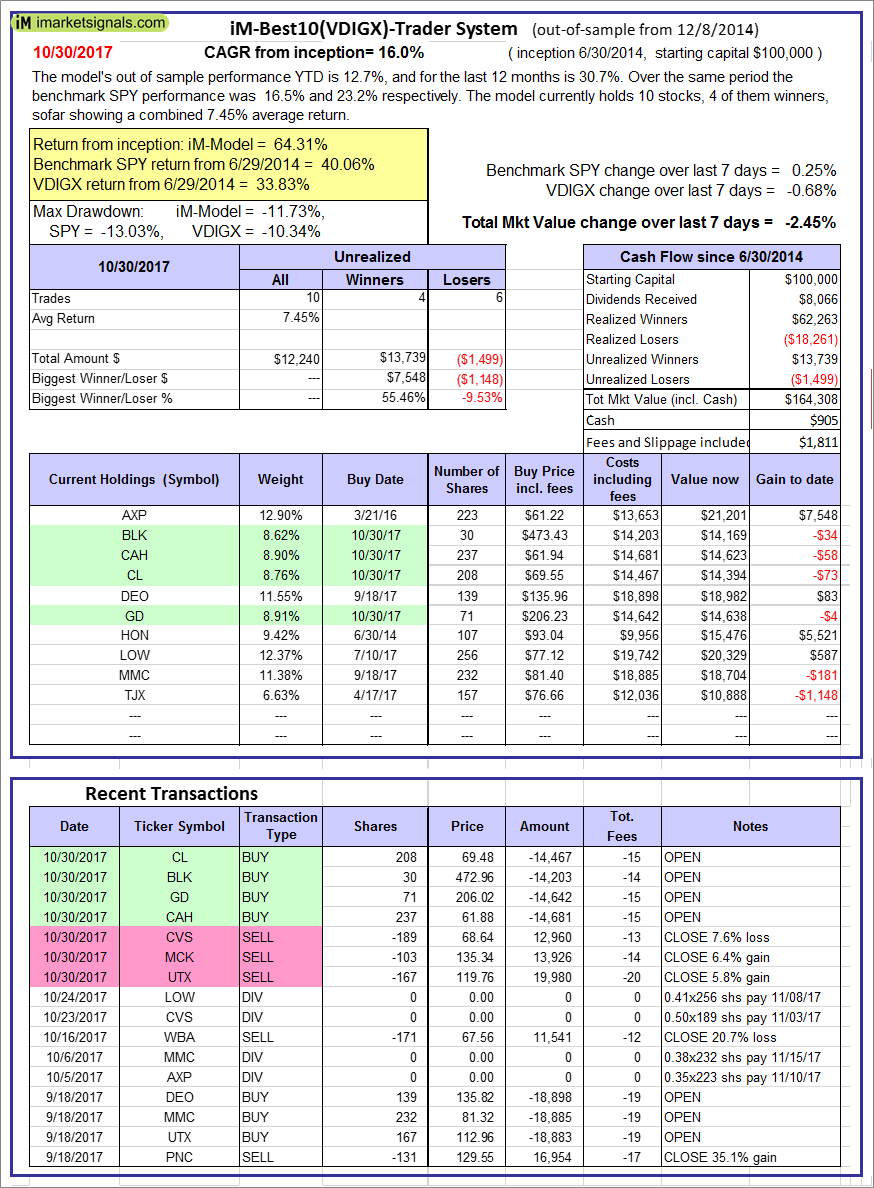 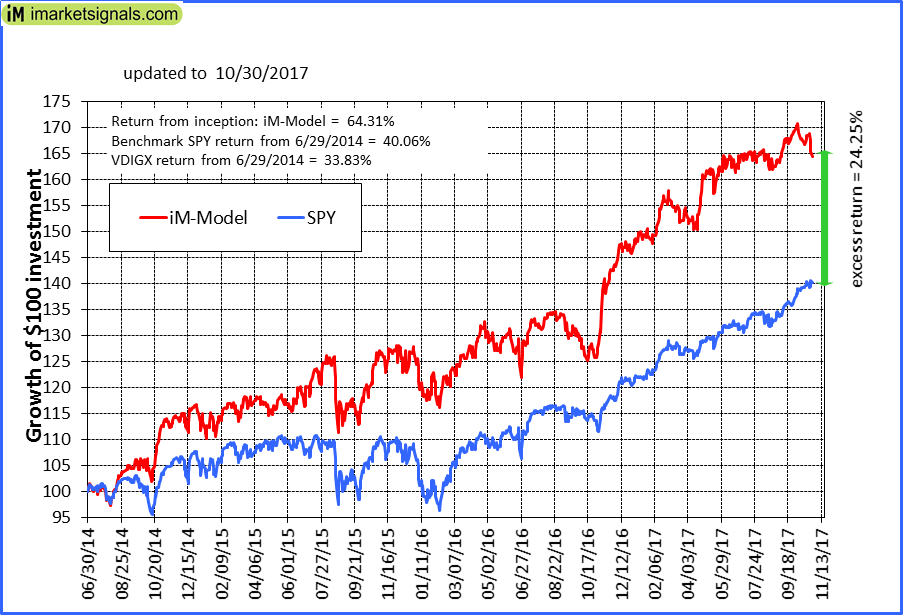 |
iM-Best10(VDIGX)-Trader: The model’s out of sample performance YTD is 12.7%, and for the last 12 months is 30.7%. Over the same period the benchmark SPY performance was 16.5% and 23.2% respectively. Since inception, on 7/1/2014, the model gained 64.31% while the benchmark SPY gained 40.06% and VDIGX gained 33.83% over the same period. Over the previous week the market value of iM-Best10(VDIGX) gained -2.45% at a time when SPY gained 0.25%. A starting capital of $100,000 at inception on 7/1/2014 would have grown to $164,308 which includes $905 cash and excludes $1,811 spent on fees and slippage. |
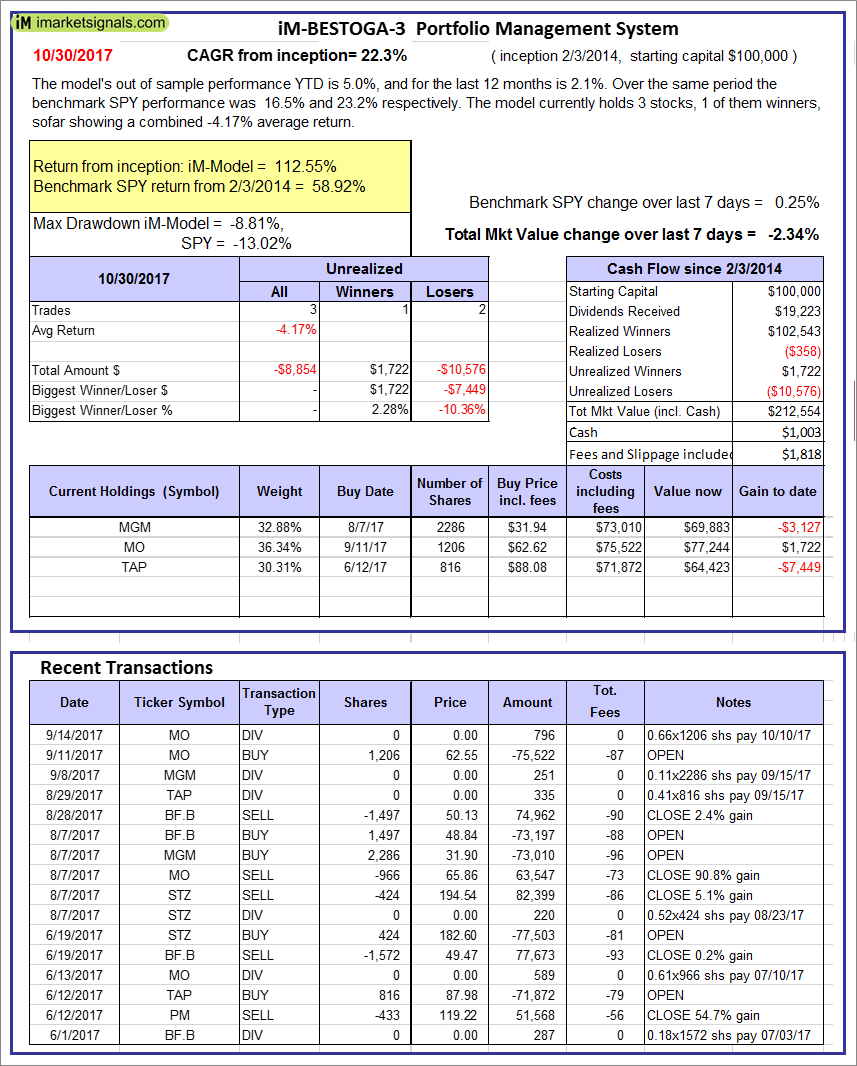 |
iM-BESTOGA-3: The model’s out of sample performance YTD is 5.0%, and for the last 12 months is 2.1%. Over the same period the benchmark SPY performance was 16.5% and 23.2% respectively. Over the previous week the market value of iM-BESTOGA-3 gained -2.34% at a time when SPY gained 0.25%. A starting capital of $100,000 at inception on 2/3/2014 would have grown to $212,554 which includes $1,003 cash and excludes $1,818 spent on fees and slippage. |
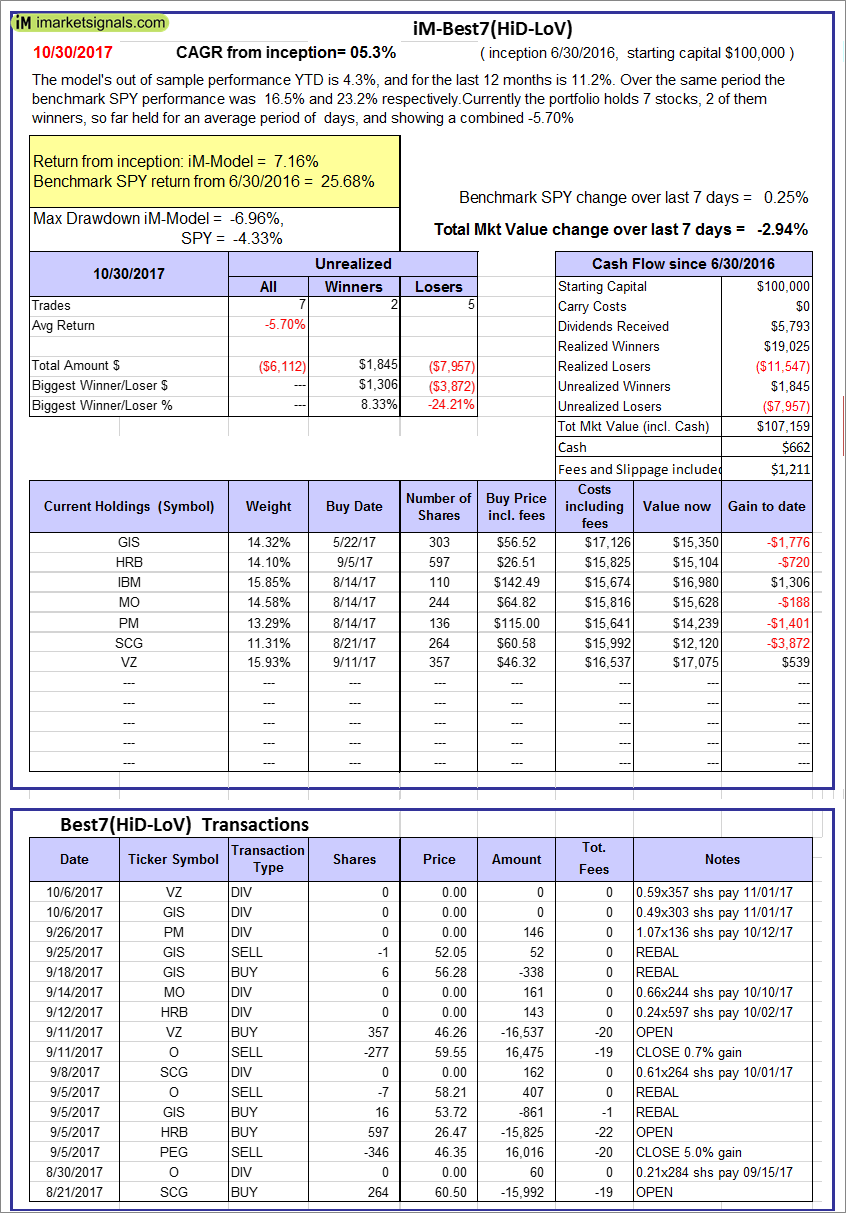 |
iM-Best7(HiD-LoV): The model’s out of sample performance YTD is 4.3%, and for the last 12 months is 11.2%. Over the same period the benchmark SPY performance was 16.5% and 23.2% respectively. Over the previous week the market value of iM-BESTOGA-3 gained -2.94% at a time when SPY gained 0.25%. A starting capital of $100,000 at inception on 6/30/2016 would have grown to $107,159 which includes $662 cash and excludes $1,211 spent on fees and slippage. |
 |
iM 6-Stock Capital Strength Portfolio: The model’s out of sample performance YTD is 32.5%, and for the last 12 months is 40.1%. Over the same period the benchmark SPY performance was 16.5% and 23.2% respectively. Over the previous week the market value of the iM 6-Stock Capital Strength Portfolio gained -0.76% at a time when SPY gained 0.25%. A starting capital of $100,000 at inception on 10/28/2016 would have grown to $140,108 which includes $544 cash and excludes $559 spent on fees and slippage. |
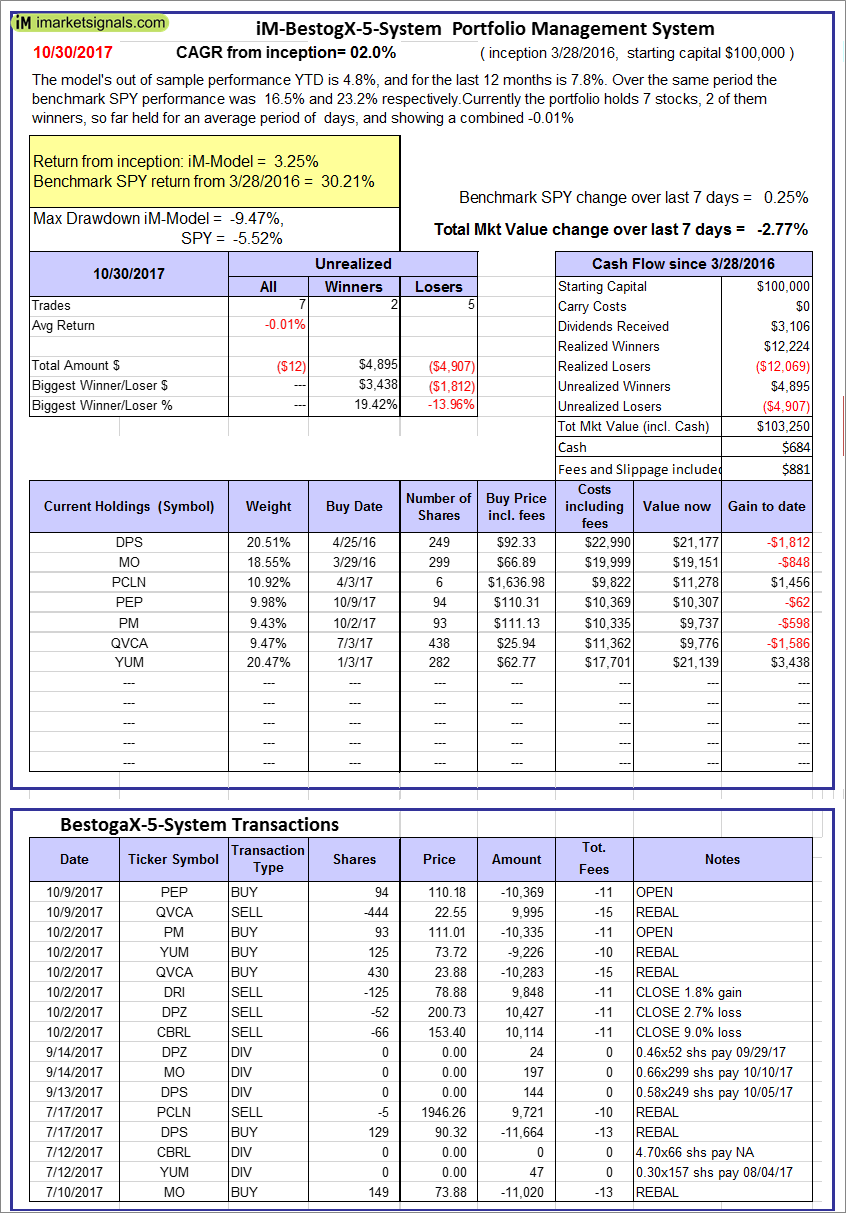 |
iM-BestogaX5-System: The model’s out of sample performance YTD is 4.8%, and for the last 12 months is 7.8%. Over the same period the benchmark SPY performance was 16.5% and 23.2% respectively. Over the previous week the market value of iM-Best8(S&P 500)Tax-Eff. gained -2.77% at a time when SPY gained 0.25%. A starting capital of $100,000 at inception on 3/28/2016 would have grown to $103,250 which includes $684 cash and excludes $881 spent on fees and slippage. |
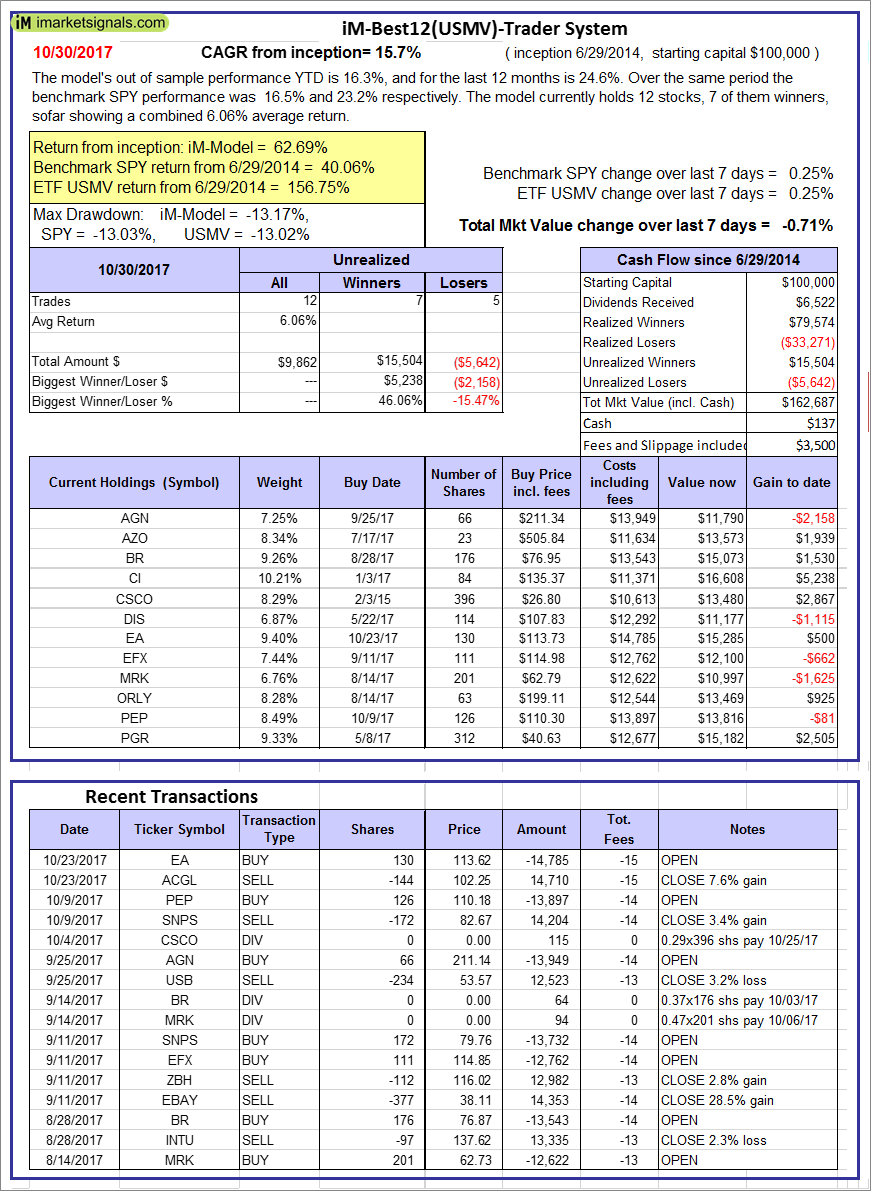 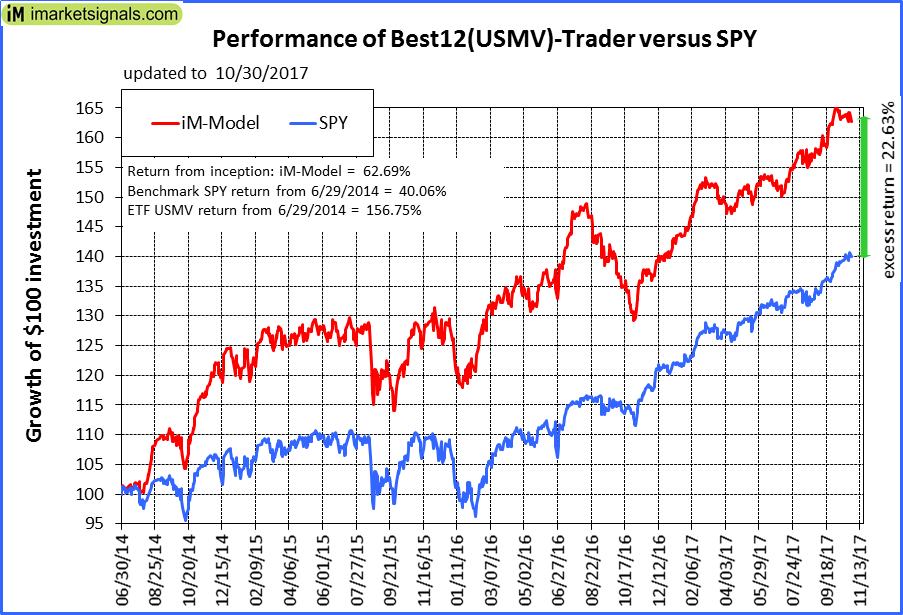 |
iM-Best12(USMV)-Trader: The model’s out of sample performance YTD is 16.3%, and for the last 12 months is 24.6%. Over the same period the benchmark SPY performance was 16.5% and 23.2% respectively. Since inception, on 6/30/2014, the model gained 62.69% while the benchmark SPY gained 40.06% and the ETF USMV gained 156.75% over the same period. Over the previous week the market value of iM-Best12(USMV)-Trader gained -0.71% at a time when SPY gained 0.25%. A starting capital of $100,000 at inception on 6/30/2014 would have grown to $162,687 which includes $137 cash and excludes $3,500 spent on fees and slippage. |
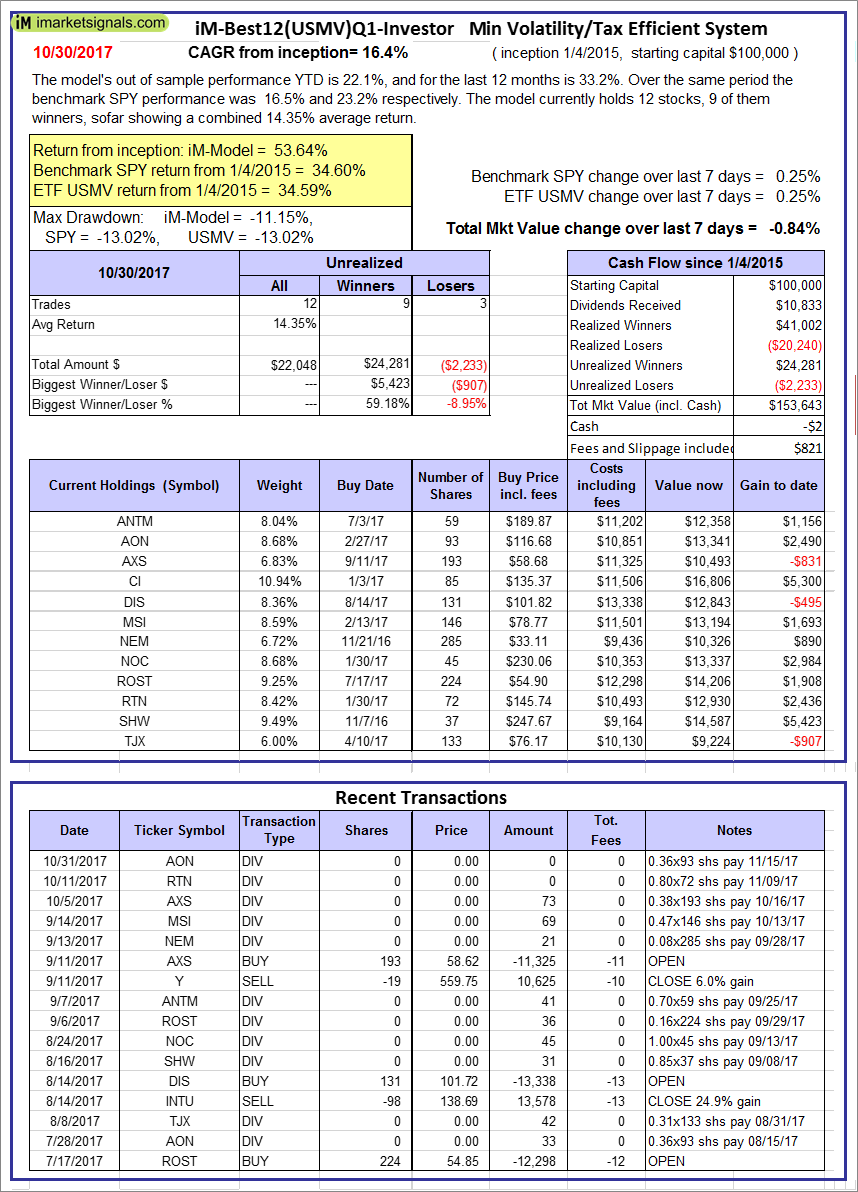  |
iM-Best12(USMV)Q1-Investor: The model’s out of sample performance YTD is 22.1%, and for the last 12 months is 33.2%. Over the same period the benchmark SPY performance was 16.5% and 23.2% respectively. Since inception, on 1/5/2015, the model gained 53.64% while the benchmark SPY gained 34.60% and the ETF USMV gained 34.59% over the same period. Over the previous week the market value of iM-Best12(USMV)Q1 gained -0.84% at a time when SPY gained 0.25%. A starting capital of $100,000 at inception on 1/5/2015 would have grown to $153,643 which includes -$2 cash and excludes $821 spent on fees and slippage. |
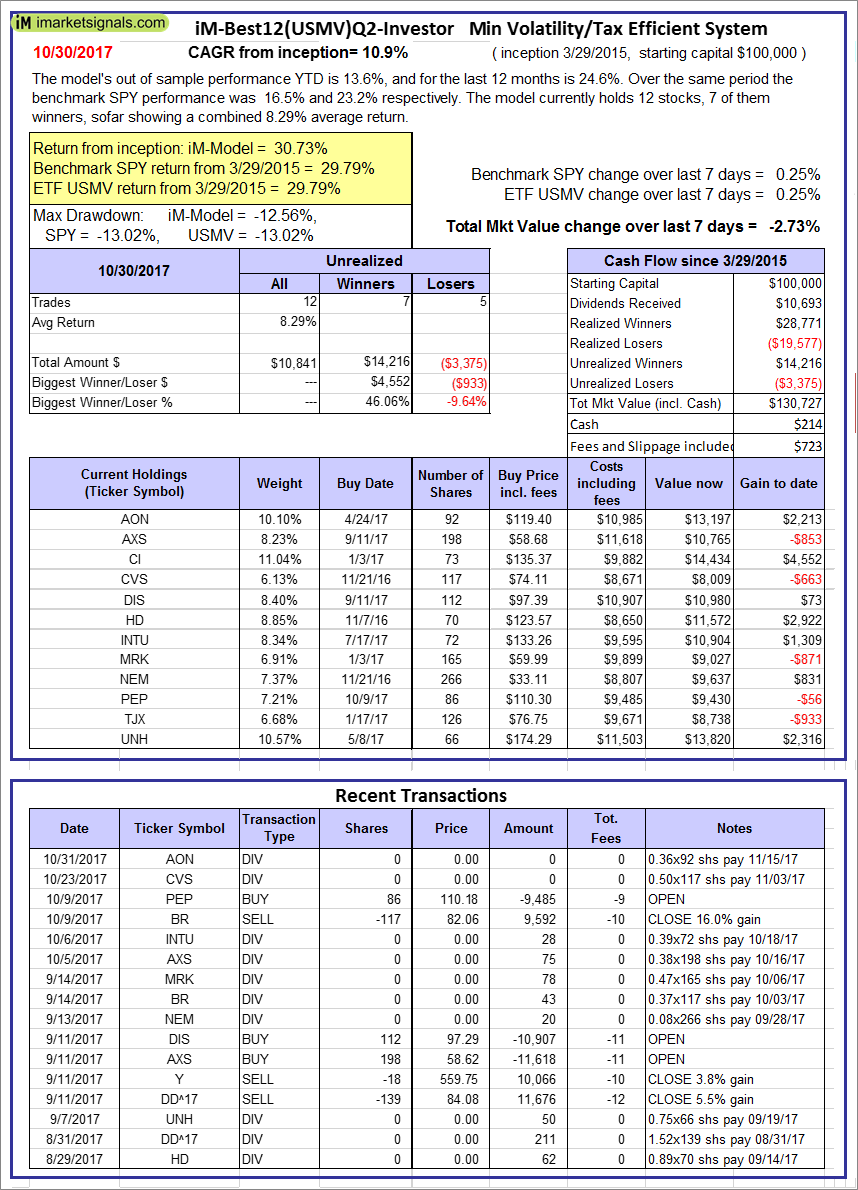 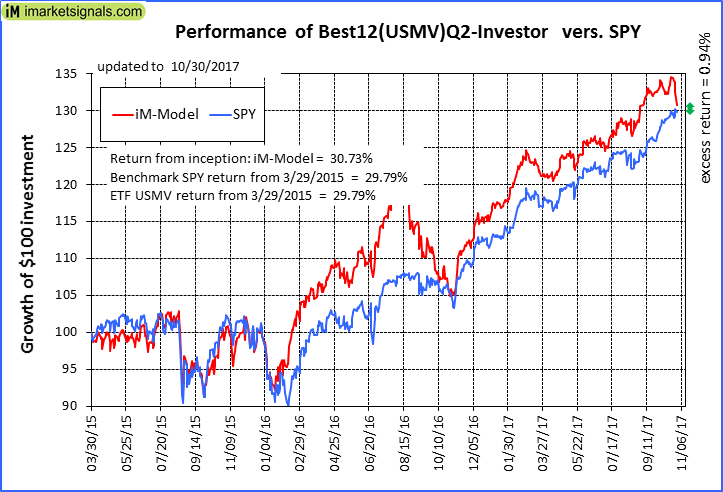 |
iM-Best12(USMV)Q2-Investor: The model’s out of sample performance YTD is 13.6%, and for the last 12 months is 24.6%. Over the same period the benchmark SPY performance was 16.5% and 23.2% respectively. Since inception, on 3/30/2015, the model gained 30.73% while the benchmark SPY gained 29.79% and the ETF USMV gained 29.79% over the same period. Over the previous week the market value of iM-Best12(USMV)Q2 gained -2.73% at a time when SPY gained 0.25%. A starting capital of $100,000 at inception on 3/30/2015 would have grown to $130,727 which includes $214 cash and excludes $723 spent on fees and slippage. |
  |
iM-Best12(USMV)Q3-Investor: The model’s out of sample performance YTD is 8.6%, and for the last 12 months is 18.6%. Over the same period the benchmark SPY performance was 16.5% and 23.2% respectively. Since inception, on 7/1/2014, the model gained 68.29% while the benchmark SPY gained 40.06% and the ETF USMV gained 156.75% over the same period. Over the previous week the market value of iM-Best12(USMV)Q3 gained -1.69% at a time when SPY gained 0.25%. A starting capital of $100,000 at inception on 7/1/2014 would have grown to $168,287 which includes $355 cash and excludes $1,104 spent on fees and slippage. |
  |
iM-Best12(USMV)Q4-Investor: Since inception, on 9/29/2014, the model gained 67.01% while the benchmark SPY gained 37.94% and the ETF USMV gained 38.19% over the same period. Over the previous week the market value of iM-Best12(USMV)Q4 gained -1.31% at a time when SPY gained 0.25%. A starting capital of $100,000 at inception on 9/29/2014 would have grown to $167,010 which includes $36 cash and excludes $942 spent on fees and slippage. |
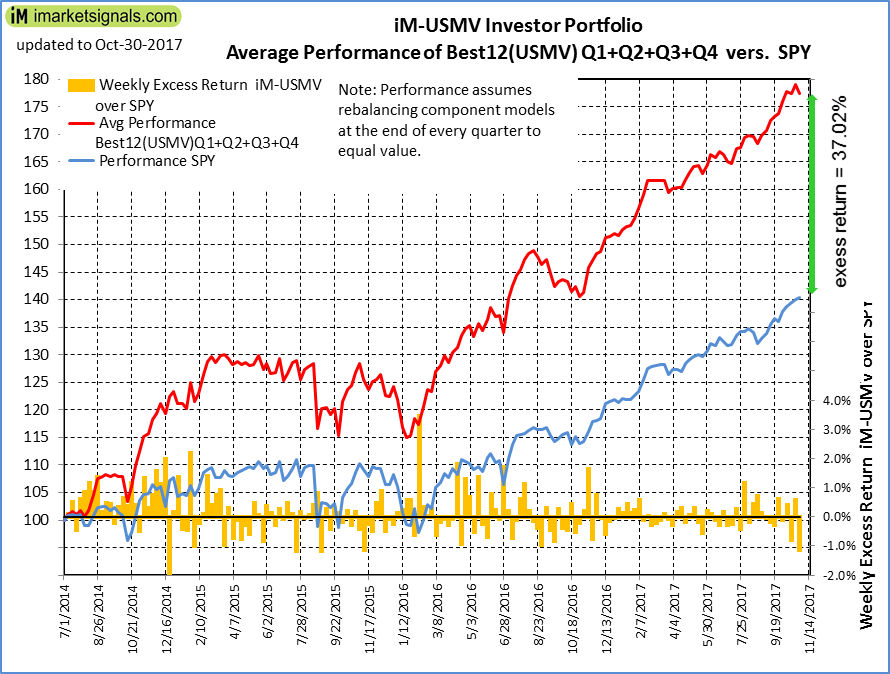 |
Average Performance of iM-Best12(USMV)Q1+Q2+Q3+Q4-Investor resulted in an excess return of 37.02% over SPY. (see iM-USMV Investor Portfolio) |
 |
iM-Best(Short): The model’s out of sample performance YTD is -3.4%, and for the last 12 months is -4.0%. Over the same period the benchmark SPY performance was 16.5% and 23.2% respectively. Over the previous week the market value of iM-Best(Short) gained -0.20% at a time when SPY gained 0.25%. Over the period 1/2/2009 to 10/30/2017 the starting capital of $100,000 would have grown to $93,476 which includes $168,763 cash and excludes $22,974 spent on fees and slippage. |
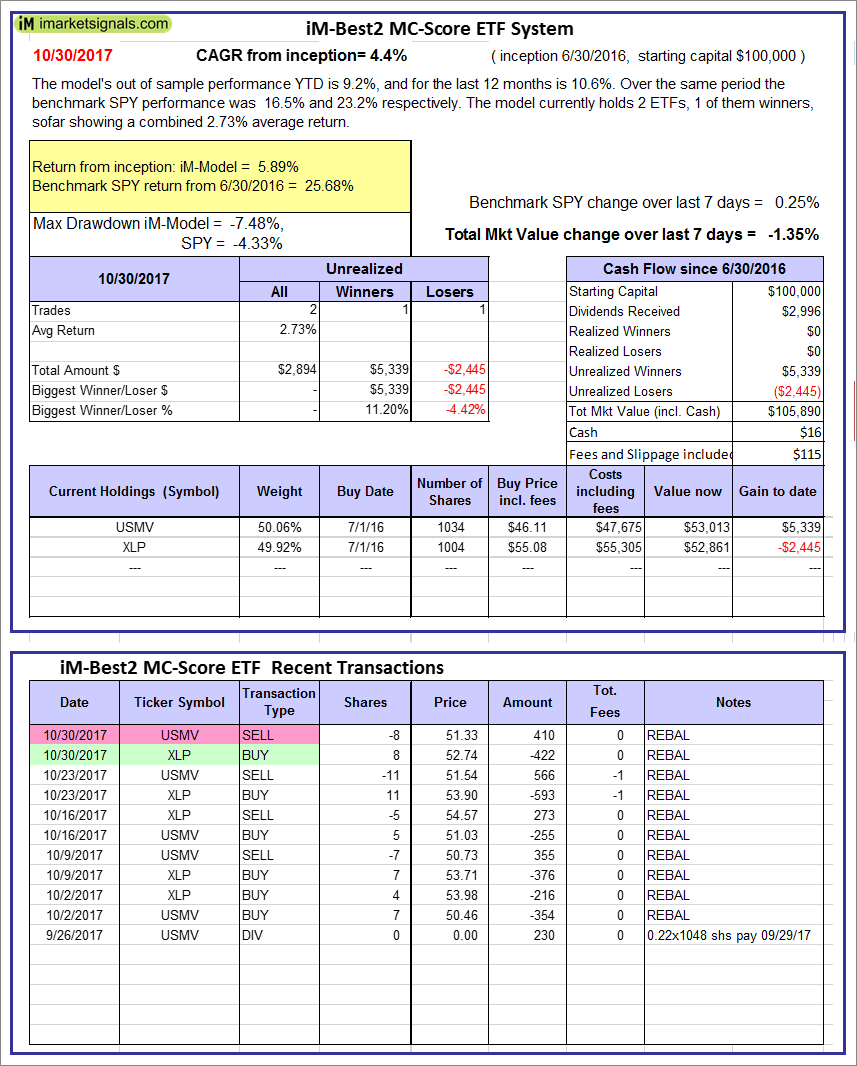 |
iM-Best2 MC-Score ETF System: The model’s out of sample performance YTD is 9.2%, and for the last 12 months is 10.6%. Over the same period the benchmark SPY performance was 16.5% and 23.2% respectively. Over the previous week the market value of the iM-Best2 MC-Score ETF System gained -1.35% at a time when SPY gained 0.25%. A starting capital of $100,000 at inception on 6/30/2016 would have grown to $105,890 which includes $16 cash and excludes $115 spent on fees and slippage. |
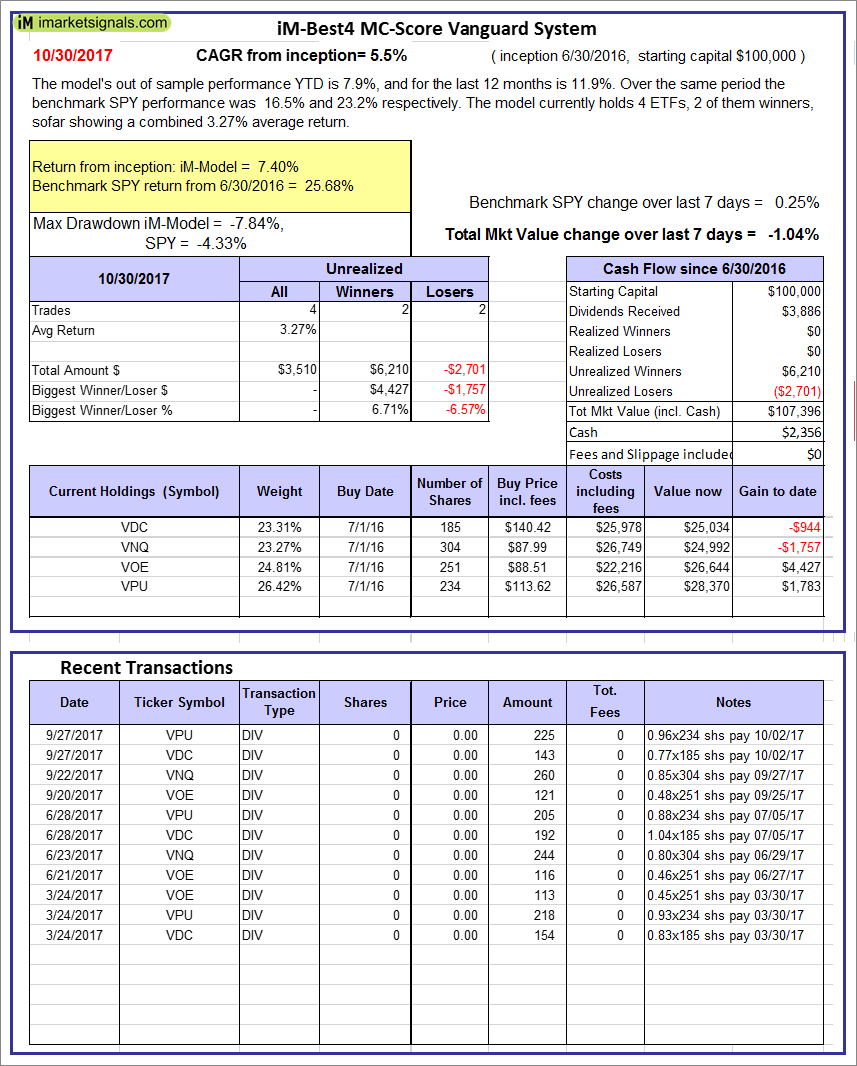 |
iM-Best4 MC-Score Vanguard System: The model’s out of sample performance YTD is 7.9%, and for the last 12 months is 11.9%. Over the same period the benchmark SPY performance was 16.5% and 23.2% respectively. Over the previous week the market value of the iM-Best4 MC-Score Vanguard System gained -1.04% at a time when SPY gained 0.25%. A starting capital of $100,000 at inception on 6/30/2016 would have grown to $107,396 which includes $2,356 cash and excludes $00 spent on fees and slippage. |
 |
iM-Composite (SH-RSP) Timer: The model’s out of sample performance YTD is 12.5%, and for the last 12 months is 18.7%. Over the same period the benchmark SPY performance was 16.5% and 23.2% respectively. Over the previous week the market value of the iM-Composite (SH-RSP) Timer gained -0.69% at a time when SPY gained 0.25%. A starting capital of $100,000 at inception on 6/30/2016 would have grown to $123,539 which includes $1,593 cash and excludes $513 spent on fees and slippage. |
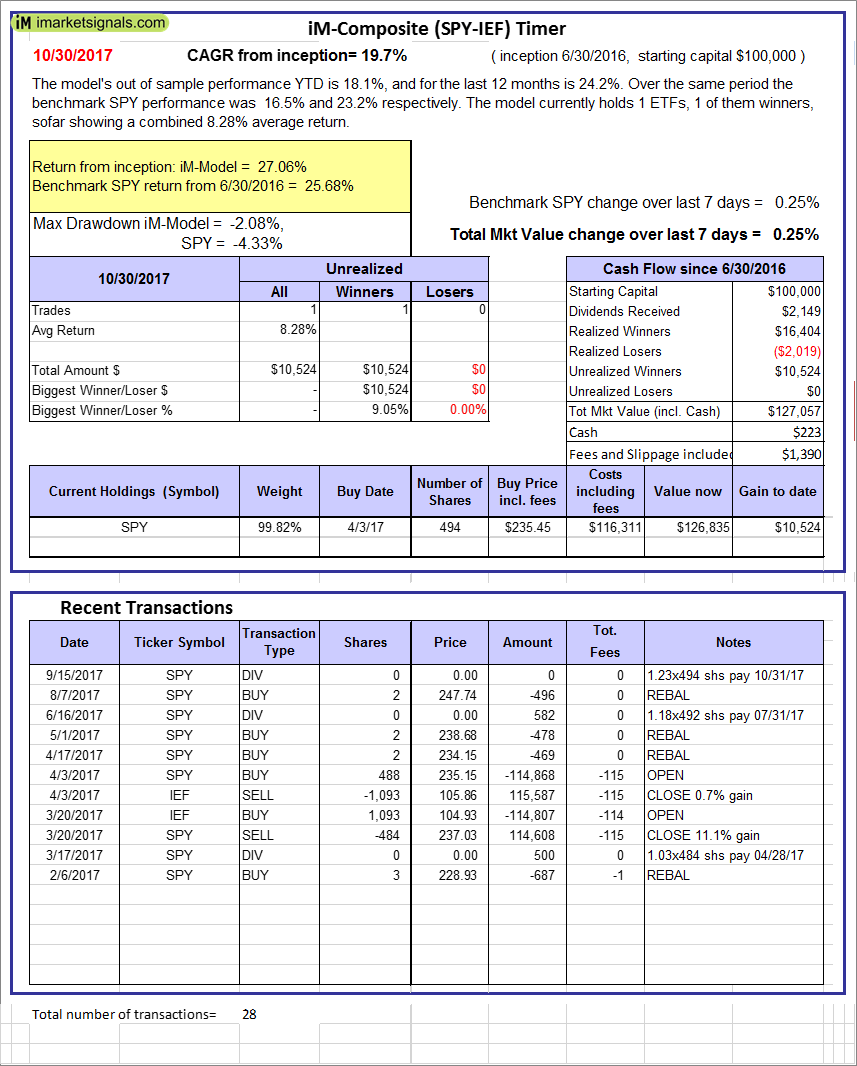 |
iM-Composite (SPY-IEF) Timer: The model’s out of sample performance YTD is 18.1%, and for the last 12 months is 24.2%. Over the same period the benchmark SPY performance was 16.5% and 23.2% respectively. Over the previous week the market value of the iM-Composite (SPY-IEF) Timer gained 0.25% at a time when SPY gained 0.25%. A starting capital of $100,000 at inception on 6/30/2016 would have grown to $127,057 which includes $223 cash and excludes $1,390 spent on fees and slippage. |
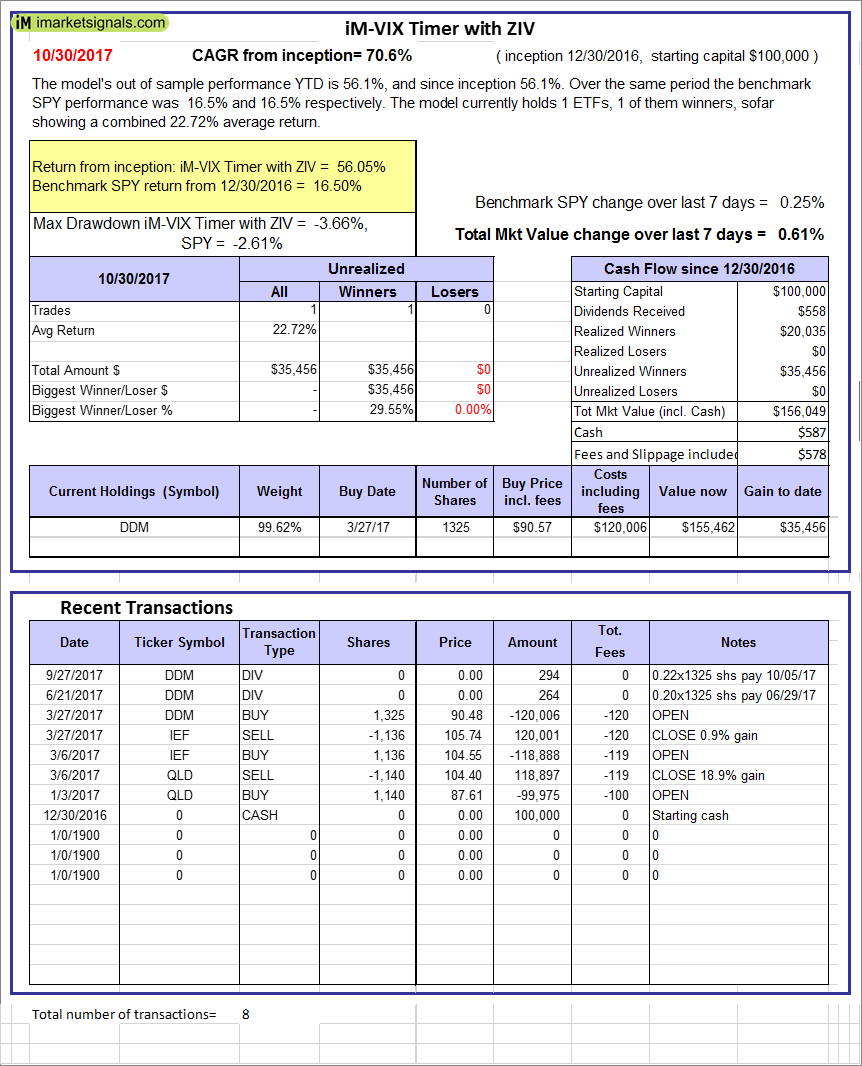 |
iM-VIX Timer with ZIV: The model’s out of sample performance YTD is 56.1%, and since inception 56.1%. Over the same period the benchmark SPY performance was 16.5% and 16.5% respectively. Over the previous week the market value of the iM-VIX Timer with ZIV gained 0.61% at a time when SPY gained 0.25%. A starting capital of $100,000 at inception on 6/30/2016 would have grown to $156,049 which includes $587 cash and excludes $578 spent on fees and slippage. |
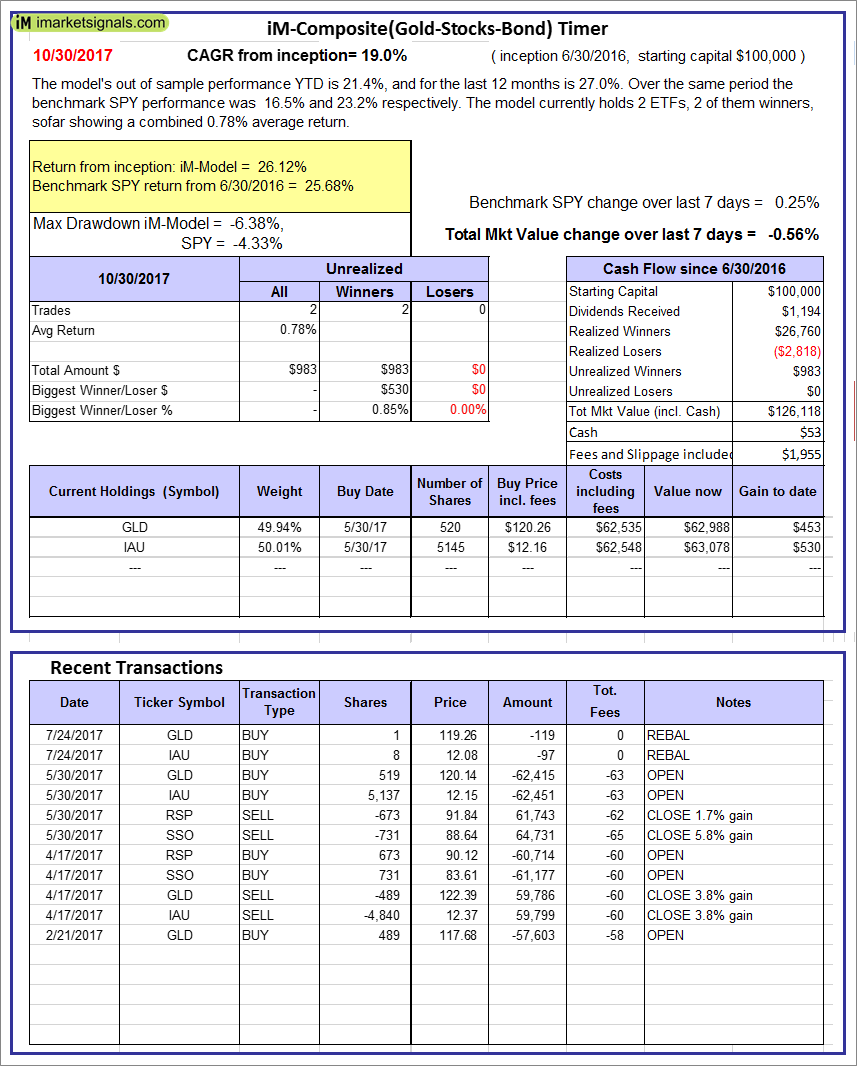 |
iM-Composite(Gold-Stocks-Bond) Timer: The model’s out of sample performance YTD is 21.4%, and for the last 12 months is 27.0%. Over the same period the benchmark SPY performance was 16.5% and 23.2% respectively. Over the previous week the market value of the iM-Composite(Gold-Stocks-Bond) Timer gained -0.56% at a time when SPY gained 0.25%. A starting capital of $100,000 at inception on 6/30/2016 would have grown to $126,118 which includes $53 cash and excludes $1,955 spent on fees and slippage. |
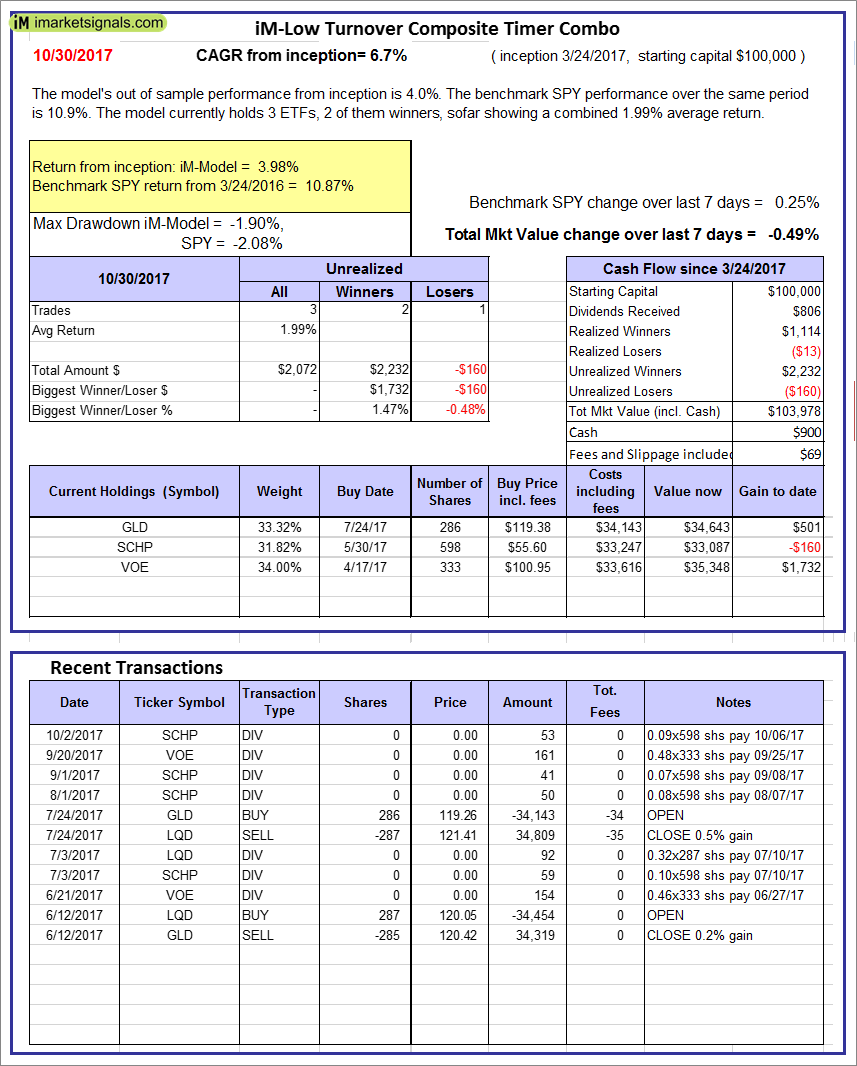 |
iM-Low Turnover Composite Timer Combo: The model’s out of sample performance from inception is 4.0%. The benchmark SPY performance over the same period is 10.9%. Over the previous week the market value of the iM-Low Turnover Composite Timer Combo gained -0.49% at a time when SPY gained 0.25%. A starting capital of $100,000 at inception on 3/24/27 would have grown to $103,978 which includes $900 cash and excludes $69 spent on fees and slippage. |
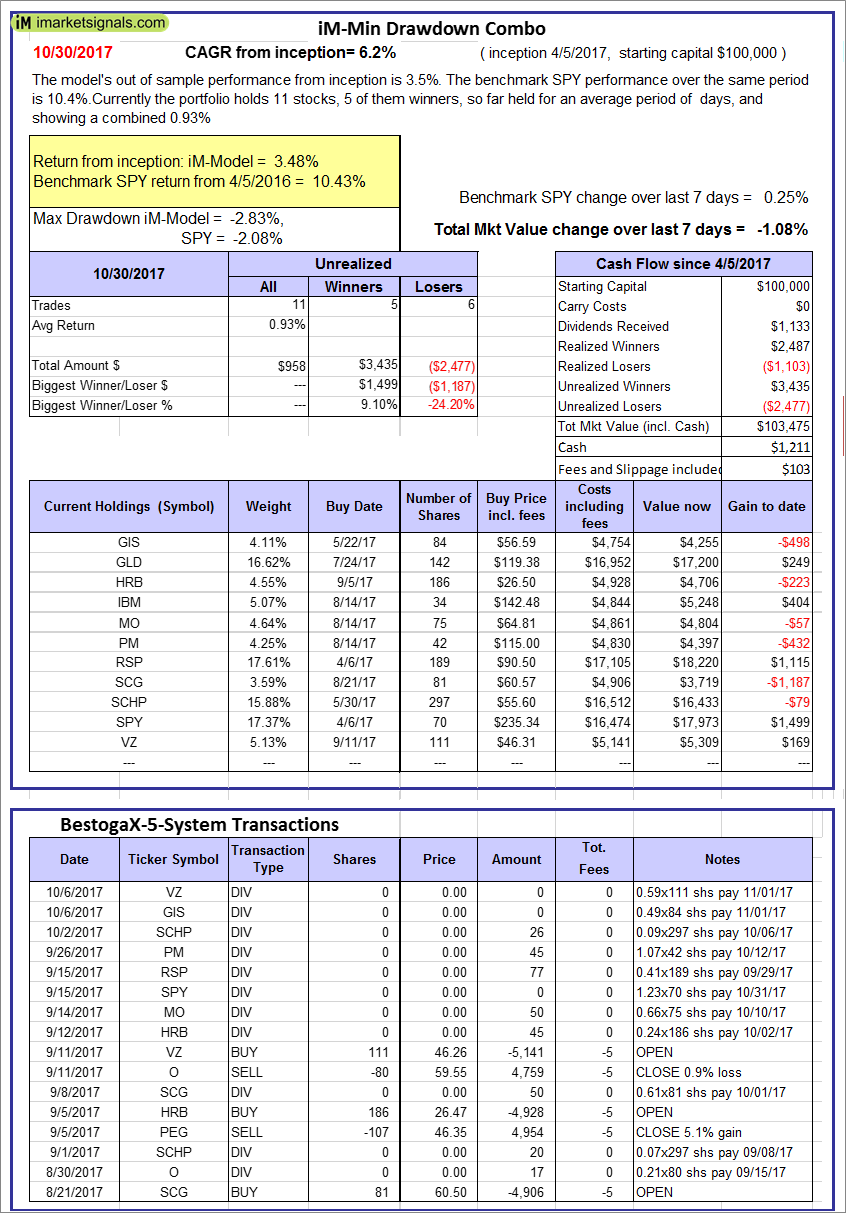 |
iM-Min Drawdown Combo: The model’s out of sample performance from inception is 3.5%. The benchmark SPY performance over the same period is 10.4%. Over the previous week the market value of the iM-Min Drawdown Combo gained -1.08% at a time when SPY gained 0.25%. A starting capital of $100,000 at inception on 4/5/2017 would have grown to $103,475 which includes $1,211 cash and excludes $103 spent on fees and slippage. |
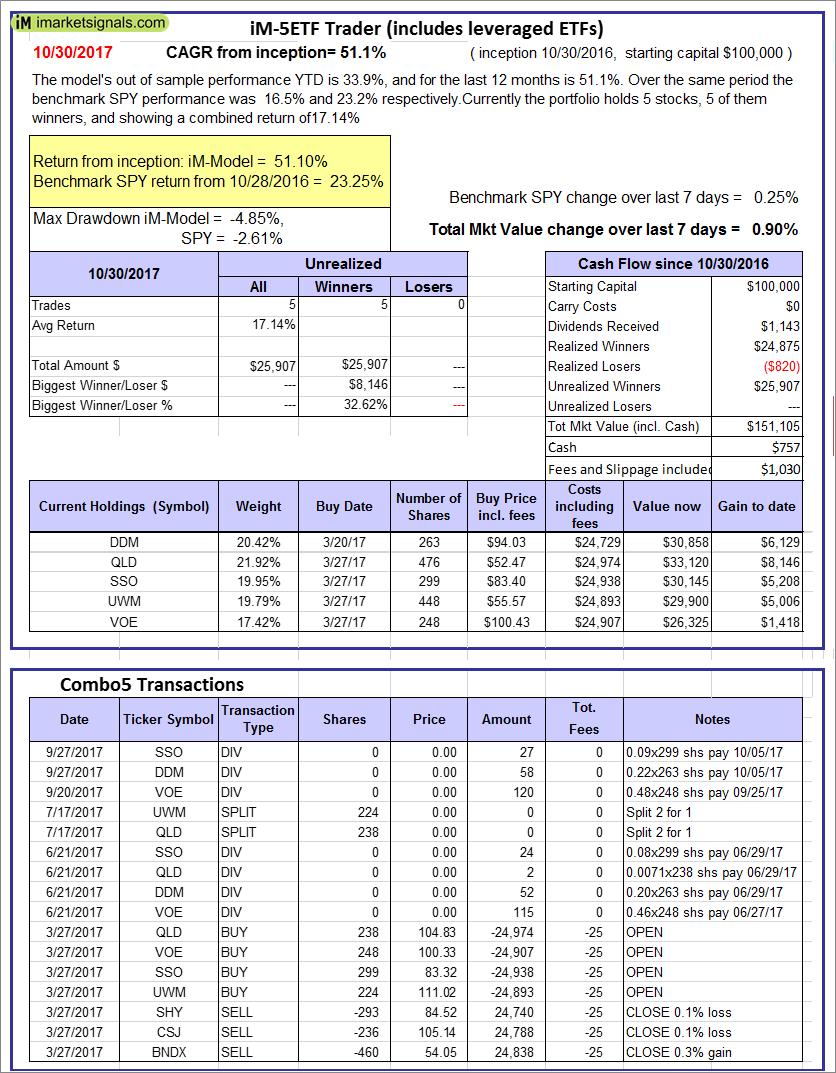 |
iM-5ETF Trader (includes leveraged ETFs): The model’s out of sample performance YTD is 33.9%, and for the last 12 months is 51.1%. Over the same period the benchmark SPY performance was 16.5% and 23.2% respectively. Over the previous week the market value of the iM-5ETF Trader (includes leveraged ETFs) gained 0.90% at a time when SPY gained 0.25%. A starting capital of $100,000 at inception on 10/30/2016 would have grown to $151,105 which includes $757 cash and excludes $1,030 spent on fees and slippage. |
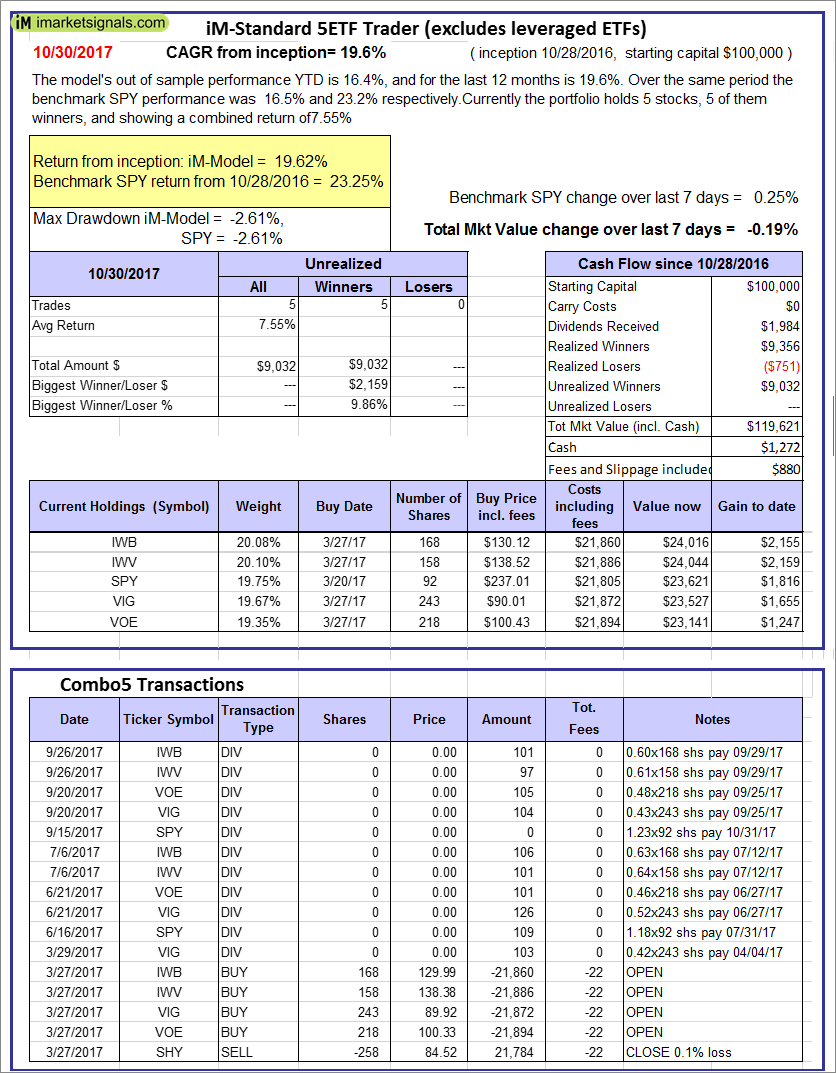 |
iM-Standard 5ETF Trader (excludes leveraged ETFs): The model’s out of sample performance YTD is 16.4%, and for the last 12 months is 19.6%. Over the same period the benchmark SPY performance was 16.5% and 23.2% respectively. Over the previous week the market value of the iM-Standard 5ETF Trader (excludes leveraged ETFs) gained -0.19% at a time when SPY gained 0.25%. A starting capital of $100,000 at inception on 10/30/2016 would have grown to $119,621 which includes $1,272 cash and excludes $880 spent on fees and slippage. |
iM-Best Reports – 10/30/2017
Posted in pmp SPY-SH
Leave a Reply
You must be logged in to post a comment.