- Shiller’s Cyclically Adjusted Price to Earnings Ratio (CAPE ratio) is at 27.8, which is 11.1 above its long-term mean of 16.7, signifying overvaluation of stocks and low forward returns.
- According to Jeremy Siegel it incorporates time-inconsistent data, and the failure to correct for changes in accounting methodology led to substantial under prediction of realized stock returns in recent decades.
- Siegel recalculated the CAPE ratio using adjusted NIPA profits and found much higher forward returns for Jan-2015 than from the Shiller’s CAPE ratio which uses S&P reported 12-month earnings.
- The alternative CAPE ratio methodology offered in this article references stock market valuation to a 35-year moving-average of the Shiller CAPE ratio instead of to the 1881-2016 fixed long-term mean.
- The latest CAPE ratio predicts a 10-year annualized real return of only 1.5%, whereas the presented methodology forecasts 5.8%, similar to the long-term market trend expected real return of 5.4%.
The historic long-term market trend
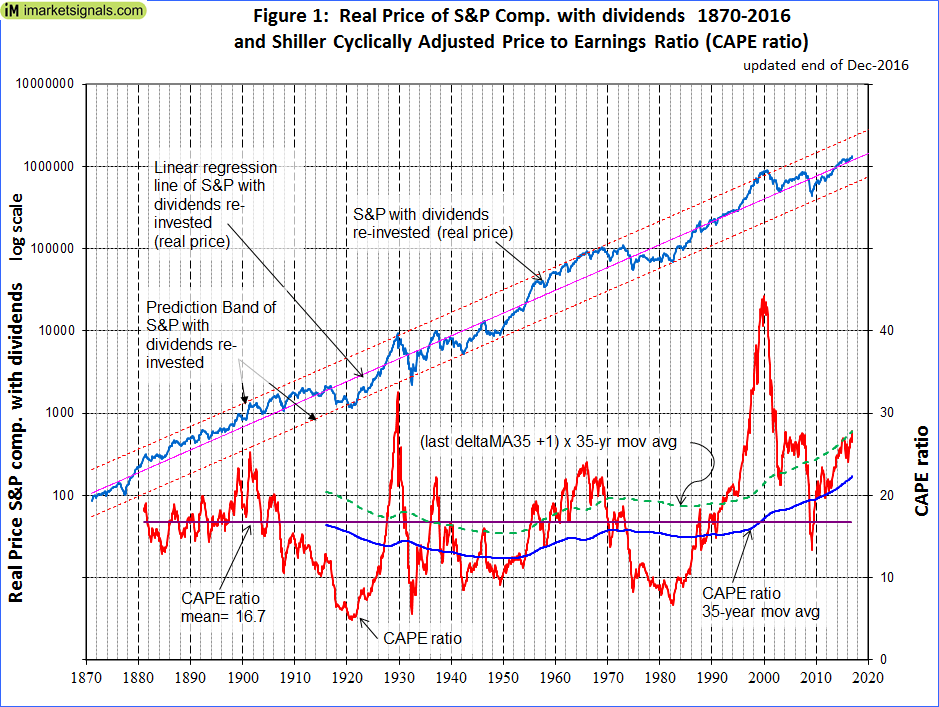
The historic data from Shiller’s S&P series is used to estimate future returns. The best-fit line for the real price of the S&P-Composite with dividends re-invested (S&P-real) from 1871 onward is a straight line when plotted to a semi-log scale. There is no evidence to suggest that this long-term trend, which shows an average compound annual real return of 6.7%, will be interrupted. S&P-real and the best-fit line together with its 95% prediction band are shown in Figure-1. (For the equation of the trendline see Appendix A in this Aug-2012 article.)
The historic trend forecast obtained by extending the best fit line indicates a probable annualized real return of 2.8% over the next three years, and 5.4% over the next ten years.
The Shiller CAPE ratio
Also shown in Figure-1 is the Cyclically Adjusted Price to Earnings Ratio, which is the real price of the S&P 500 Index, divided by the arithmetic average of the last 10 years of real reported 12 months earnings per share of the Index. The CAPE ratio is currently at a level of 27.8. This is 11.1 higher than its 1881-2016 long-term mean of 16.7.
According to Shiller the elevated CAPE ratio level signifies substantial overvaluation of stocks. However, Jeremy Siegel believes that the failure to correct for changes in accounting methodologies leads to a significant overstatement of the CAPE ratio and the model’s substantial under-prediction of realized stock returns in recent decades. (See The Shiller CAPE Ratio: A New Look, and comments from Robert Shiller and Jeremy Siegel in the Appendix.)
To address Siegel’s concerns, an alternative approach to assess stock market valuation would be to use a moving average of the CAPE ratio, rather than referencing the valuation to the 1881-2016 fixed long-term average. This should to some degree smooth or eliminate effects from changes to accounting practices, dividend policies, and other reporting parameters over time.
In this analysis a 35-year moving average of the CAPE ratio is calculated, currently having a level of 22.3, which is significantly higher than the long-term average of the ratio of 16.7. The moving average over 35 years was chosen so that it would cover at least three business cycles based on the longest recent expansion and contraction period from March 1991 to November 2001 of 128 months.
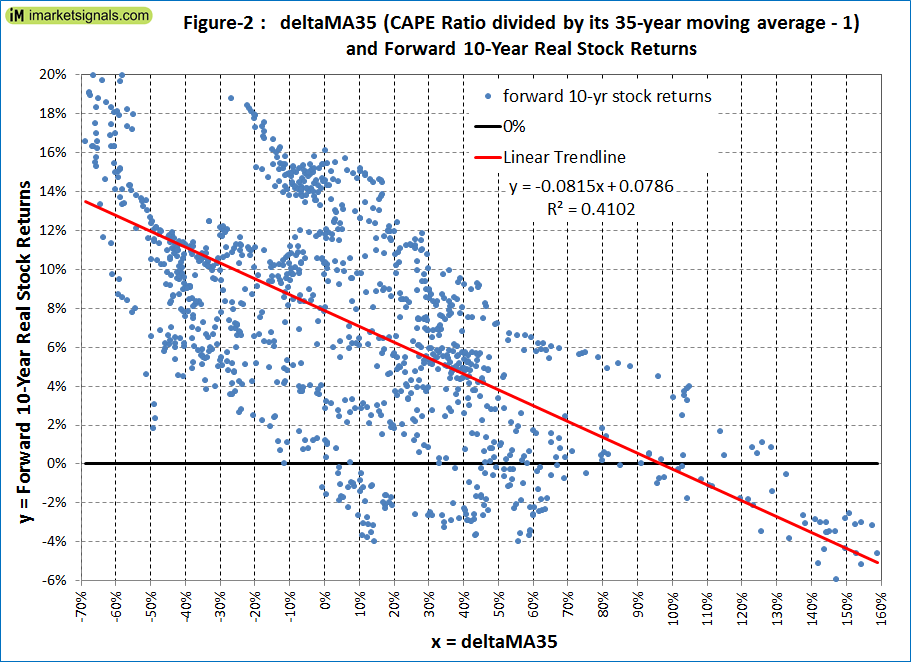
The ratio obtained from dividing the CAPE ratio by its 35-year moving-average and subtracting 1.00 from it is termed “deltaMA35”. A forecasting equation is calculated by regressing the forward 10-year annualized stock returns on the corresponding values of deltaMA35.
The CAPE ratio is therefore only 5.5 above its current 35-year moving average of 22.3, and the last deltaMA35 is (27.8 / 22.3 – 1) = 25%. A deltaMA35 of 25% predicts a 10-year annualized real return of 5.8%. This indicates that stocks are not nearly as overvalued as the current level of the CAPE ratio relative to its long-term average would suggest.
What gains (if any) can we expect?
Figure-2 shows the historic 10-year real annualized returns which followed various values of deltaMA35 from Jan-1916 to Dec-2006. The 10-year annualized return diminishes as deltaMA35 increases. The historic 10-year annualized returns that followed for the current deltaMA35 of 25% +/-2% ranged from -2.6% to +11.6%, and the forward 10-year real stock return is 5.8% when calculated from the regression equation shown in the figure.
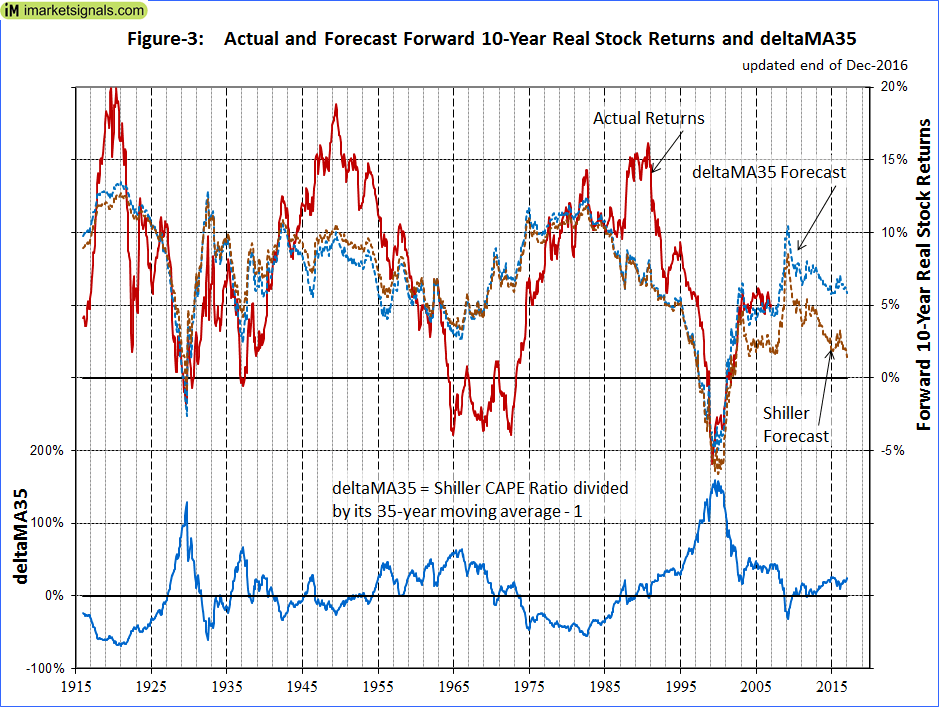
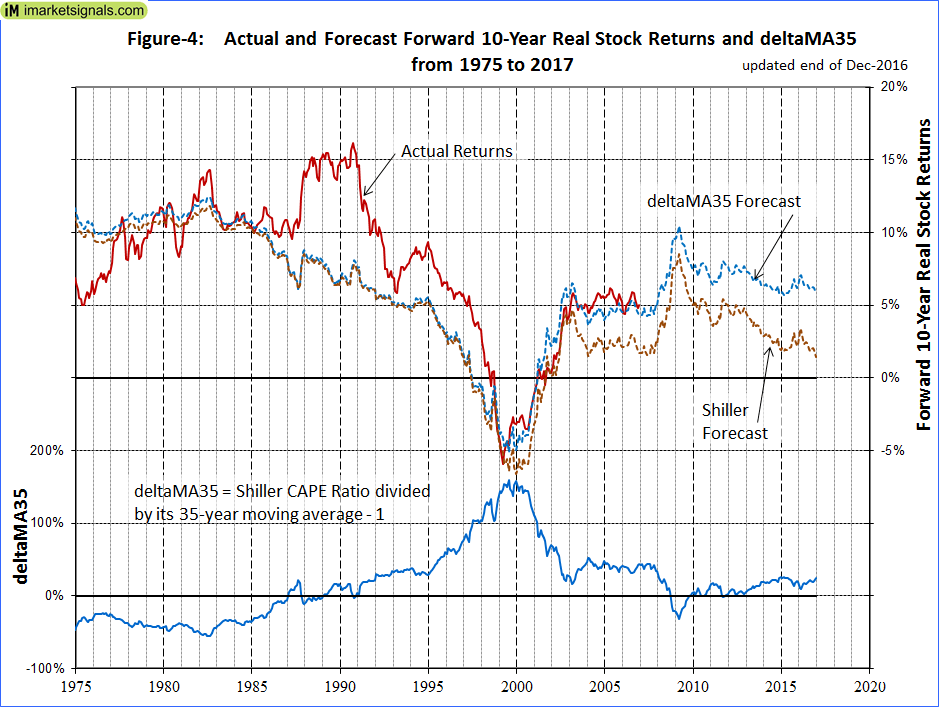
Figure-3 shows the actual returns together with the forecast returns calculated from the deltaMA35 and the CAPE ratio’s regression equations. From 1999 to the end of 2006 the deltaMA35 predicted- and actual 10-year returns are almost identical (shown in greater detail in Figure-4).
Until 2003 the CAPE ratio’s predicted returns match closely those calculated from deltaMA35. After that date the CAPE ratio’s forecast returns becomes much less than the predicted deltaMA35 returns, and also much less than the actual returns to the end of 2006.
Note, that for consistency the Shiller CAPE ratio forecast equation used was determined over the same period as for deltaMA35, Jan-1916 to Dec-2006.
From Figure-4 above it is evident that the forecast decline of the CAPE ratio since 2003 is not reflected in the forecast returns from the deltaMA35 model.
Comparing the deltaMA35 and the Shiller / Siegel methodologies:
Siegel replaces Standard & Poor’s reported earnings with adjusted national income and product accounts profits (NIPA profits) in the calculation of the CAPE ratio to forecast a significantly higher forward stock return from January 2015 than what Shiller’s CAPE methodology produced. His results are summarized in Table 3 of his article – The Shiller CAPE Ratio: A New Look reproduced here for easy reference.
The deltaMa35 was 24.1% for January 2015. The projected stock return from the deltaMA35 methodology for January 2015 was 5.90% which exceeds that from Siegel’s Total Return CAPE with NIPA profits, the highest value in the Table 3.
Although it is easy enough to download the NIPA data (line 45 of Table 1.12) from the website of the Bureau of Economic Analysis, it is difficult to make all of Siegel’s adjustments to it. He uses annual data of NIPA profits from 1928 to 1947, quarterly data from 1947 to 2015, and splices S&P reported earnings into the series before 1928. In his presentation to Q Group Scottsdale AZ, October 15, 2013 he states that NIPA profits were converted to “per share” basis by using the S&P divisor from 1963 onward. Before 1963, he said, he used the average value 1.40% per year to deflate NIPA profits.
As mentioned before, deltaMA35 is calculated from the reported earnings, same as for the Shiller CAPE ratio, and can easily be reproduced by using Shiller’s standard CAPE excel spreadsheet. The deltaMA35 model does not need replacing Standard & Poor’s reported earnings with adjusted NIPA profits to forecast significantly higher stock returns than the CAPE ratio from 2003 onward.
Conclusion
The current level of the CAPE ratio relative to its 35-year moving average does not suggests that stocks are highly overvalued. From deltaMA35 and the historic long-term market trend the 10-year forecast returns are 5.8% and 5.4%, respectively. Thus, the most likely forward 10-year real annualized return would be about 5.5 %.
However, this should not be interpreted to mean that stocks will actually produce a 5.5% return over the next 10 years. From deltaMA35 and the historic long-term market trend the minimum & maximum 10-year forecast returns are -2.6% & 11.2% and -1.3% & 12.6%, respectively. Thus it is possible, but not very likely, that the market could show a small loss over the next 10 years.
Large drawdowns are always possible during a 10-year period. Investments can be protected by following signals from low frequency market-timing models, such as the CAPE Cycle-ID market timer. It is also important to know when a recession is looming, because stocks usually do poorly during recession periods. Our Business Cycle Index should provide early warning of an oncoming recession.
Appendix
In this Sep-2014 article Shiller was quoted as follows:
“As of yesterday my price earnings ratio was 26.3. There’s only three major occasions in US history back to 1881 when it was higher than that. One is 1929, the year of the crash. The other is 2000, which I call the peak of the millennium bubble, and it was also followed by a crash. And then 2007, which was also followed by a crash. But that’s only three observations so I don’t say that it necessarily has to do the same thing, …but it is cause for concern.”
According to a June-13-2015 commentary published in The Economist, Jeremy Siegel, Professor of Finance – Wharton School, does not share Shiller’s view on market valuation:
“My point is that the earnings series that Mr. Shiller uses has changed substantially since he developed the model some 20 years ago. The mandates of the Financial Accounting Standards Board in the 1990s required firms for the first time to employ “mark-to-market” accounting, a procedure which greatly increased the volatility of reported earnings. Such volatility was particularly evident in the recession that followed the financial crisis when reported earnings fell by a much greater percentage than they had during the Depression of the 1930s, a slump that was five times as great.
The failure to correct for the change in accounting methodology leads to a significant overstatement of the CAPE ratio and the model’s substantial under-prediction of realized stock returns in recent decades. There have been only nine months since January 1991 when the CAPE ratio has been below its mean (signaling undervaluation), while in all but six months since 1981 the realized ten-year returns from stocks have exceeded forecasts using the CAPE model. In fact, the CAPE methodology signaled the stock market “overvalued” in May 2009 when the S&P 500 Index was 920, far less than one-half its current level.
These prediction failures are a result of time-inconsistent data, not a defect in the CAPE model. The Shiller CAPE ratio remains the best tool for predicting long-term real stock returns.
When a time-consistent series of corporate earnings, such as those published in the national income accounts are used instead of GAAP earnings, not only does the predictive power of the CAPE ratio improve, but the current stock market does not appear nearly as overvalued.”


a bit over my head, but it’s good to see this kind of analysis. a 35-yr moving average certainly might make more sense than a historic p/e that stretches over a century. things change. i’m glad to see a p/e analysis that is relatively positive for once