The iM Standard Market Timer endeavors to signal periods when it may be advantageous to exit the market or hedge one’s portfolio of stocks. For the simulation it was assumed that during the hedging periods the model holds the ProShares Short S&P500 (SH), and when not invested in SH the model switches to cash.
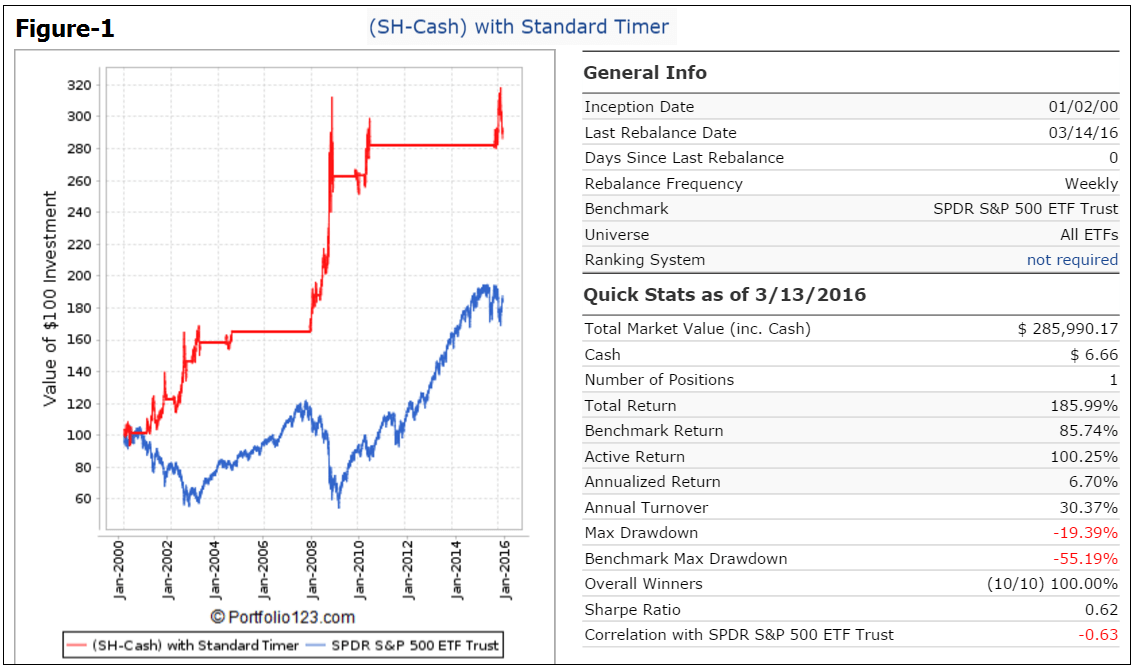
The model was backtested on the web-based portfolio simulation platform Portfolio 123 from Jan-2-2000 onward, as this was the first full year when the algorithm had access to all the indicators it uses:
- Daily closing price of SPY,
- CBOE Volatility Index (VIX ),
- S&P500 Estimated Earnings Current Year, and
- S&P500 Risk Premium –the difference between the Current Estimated Earnings Yield of the S&P500 and the Treasury 10-yr Note Yield.
With the model optimized to keep the number of trades reasonably low, it still provided an average annualized return of about 6.7% from Jan-2000 to the middle of Mar-2016.
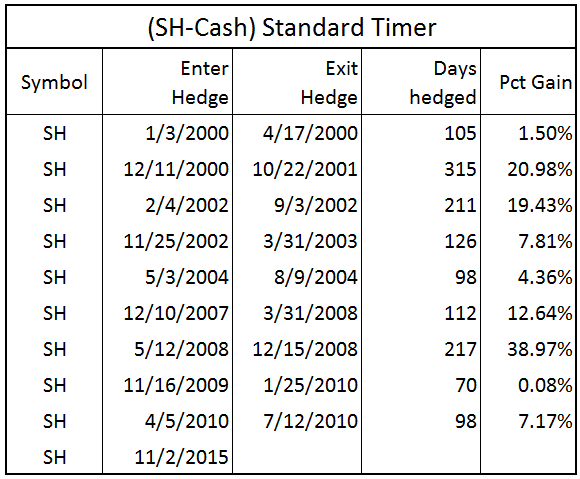
Figure-1 shows the performance when only invested in SH during the hedging periods and otherwise in Cash. There were 9 realized trades, all of them winners. Currently (Mar-13) the model holds SH, also showing a positive return. Annualized return would have been higher than the 3.9% return for buy-and-hold SPY.
The prices for transactions were taken to be “Next Close” after a signal was generated, and slippage of 0.1% of the transaction amount plus commission of 1.0 cents/share was assumed for the simulation.
The table below shows all the trades from this model.
Following the Model
The (SH-Cash) Standard Timer can be followed live at iMarketSignals (Gold membership required), where it will be updated weekly to signal start and end of hedging periods.

Disclaimer
One should be aware that all results for this system are from a simulation and not from actual trading.
All results are presented for informational and educational purposes only and shall not be construed as advice to invest in any assets. Out-of-sample performance may be much different. Backtesting results should be interpreted in light of differences between simulated performance and actual trading, and an understanding that past performance is no guarantee of future results. We can make no claims about future performance of this model, which may include significant potential for losses. All investors should make investment choices based upon their own analysis of the asset, its expected returns and risks, or consult a financial adviser. The designer of this model is not a registered investment adviser.


That is great. Question: what do the results look like if you enter SPY instead of cash?
Tom C
If one used SPY instead of cash then for the simulation from 2000-2016:
Annualized Return = 20.2%
Max D/D = -34.0%
Total number of trades = 19
Winners = 18/19
Looks like its out during the 2 recessions. What time period was the -34.0% drawdown?
This is not a model we feature.
George,
Is this model affected by problems in February with SPEPSCY?
We have hopefully addressed this by setting up custom series for SPEPSCY and SPEPSCNY which is now also in the model. The custom series uses the EPS for each stock in the S&P500 to calculates the weekly values for the S&P500. (SPEPSCNY is a blend of the SP500 estimate CurrY EPS & NextY EPS).
Georg and Anton,
This is a question that needs to be addressed. Considering the thread you referred me to on P123, what are we to do going forward with models that have data which is subject to estimated data/data revisions? I got the impression from your responses in that thread that you were no longer going to use estimated data. Is that true, and if so, are you planning to overhaul these models?
Thanks
Please see our comment above.
Have there been any signals since 11/2/15?
Above chart ends with that signal and report on main page just shows Hedge is ON.
Curious if there have been any changes between now and November.
Thanks
The model is still in SH.
George,
Looks like the first real trade just ended moving back into cash….What was the recorded loss of the trade ?
I am surprised that your “sector rotation model” still remains short when so many options are performing so well ?
XLE @ 19%
XLB @ 11%
XLK @ 13%
XLU @ 16%
The iM-Standard Timer signaled hedging from 11/2/2015 to 10/10/2016.
Over this period returns were:
SPY +5.0%
SH -6.7%
IEF +6.4%
If one had sold 50% of SPY and bought 50% SH (hedge ratio 100%) then over this period one would have had a loss of 0.85%.
If one had sold 50% of SPY and bought 50% IEF then over this period one would have had a gain of 5.7%.
The Standard Timer is not intended to be an investment model on its own.
Hi. Can you provide a history of signals since the last one shown in 2015? I don’t see it on the main page.
Thanks.
Tom C
SH : 11/02/15 to 10/10/16
since 10/10/16 not in SH.
was there another quick trade after that? the current page says “Hedge OFF no trades since 11/21/2016”
Thanks
Tom C
Tom, thanks for reporting this discrepancy, 10/10/16 is correct and front page corrected accordingly.
Georg,
Why do we need the BCI index when we can hedge against all recessions and corrections using this?
The BCI goes back to 1967, whereas the Standard Market Timer starts in 2000.
Also we do not claim that with the Timer one “can hedge against all recessions and corrections”. Better to look at the bigger picture as well.
Ok how specifically then, would you use the Standard Timer in tandem with the BCI? For example, what would you do in the following situation:
The BCI signals peak but the Standard Timer says no hedge. In this case, would you initiate a short position regardless? And if so, how long would you remain short?
My thinking is you should be short for 14 months or until you reach 10.7 forward PE, whichever comes first, the former is the average duration of bear markets and the latter is the average bear market ending PE.
This example raises another intersting issue which I hope you can address. The BCI signals peaks but there is no BCI for the trough.
For the backtest since 1967 (includes 7 recessions) the historic average lead to recession start is about 20 weeks for BCIp, and 11 weeks for BCIg. It is prudent to exit the stock market before recessions or hedge long positions.
Since the Standard Timer has only been backtested over 2 recessions the BCI signals should have more weight.
We have a model (not published yet) similar to BCIp to signal re-entry into stock market.
it would be interesting to see what the drawdown would be if you combined the Standard Market Timer with the Low Frequency timer for a long-short signal, i.e., SH if BOTH SMT and LFT are bearish, SPY otherwise.
Tom C
Have there been any signals after 4/22/2017?
Since I’m following the Composite (SPY-EF) Timer, if the Standard Timer signals cash instead of SH its position in the Composite (SPY-EF) Timer goes to 100%?
Thanks…
Our weekly update of the iM-Composite Timer (SPY-IEF) has the following Note: “The Component Standard Timer (STD) differs in some respects from the iM Standard Timer.”
We use the CMP Standard Timer (SPY-IEF) which is supposed to swich to IEF and not to SH during down-markets.
We do not report separately on the performance of the CMP Standard Timer (SPY-IEF), other than in the weekly signal report of the iM-Composite Timer (SPY-IEF).
Thanks Georg. I know and that’s why I was asking for newer signals of the iM Standard Timer. Above you’ve reported them up to and including 4/22/2017, so I wonder if there have been more since we’ve been through quite some turbulence.
Thanks…
in your composite of all your timing mechanisms which now indicates 40% iM Market Timer indicates 100% IN stocks. However in the individual selection is still says HEDGE ON. Which is correct. both links lead to the same page of information and track record
5/3/2020 iM-Stock Market Confidence Level iM-SMC = 40% (Down-Market)
weekly P123 2000 Standard Market Timer 1.0 100% +100%
The iM Standard Market Timer: Hedge On No trades since 3/30/2020
Thanks for your response…
contactdeparture:
The May-3 update refers.
5/3/2020 iM-Stock Market Confidence Level iM-SMC = 35% (Down-Market)
This composite is used by the SuperTimer models and indicates 0% in stocks.
weekly P123 2000 Standard Market Timer 1.0 100% +100%
This timer switched from 0% to 100% in stocks.
The iM Standard Market Timer: Hedge OFF Trades 1 assets
This timer switched from 0% to 100% in stocks, which is consistent with the P123 2000 Standard Market Timer.