
  |
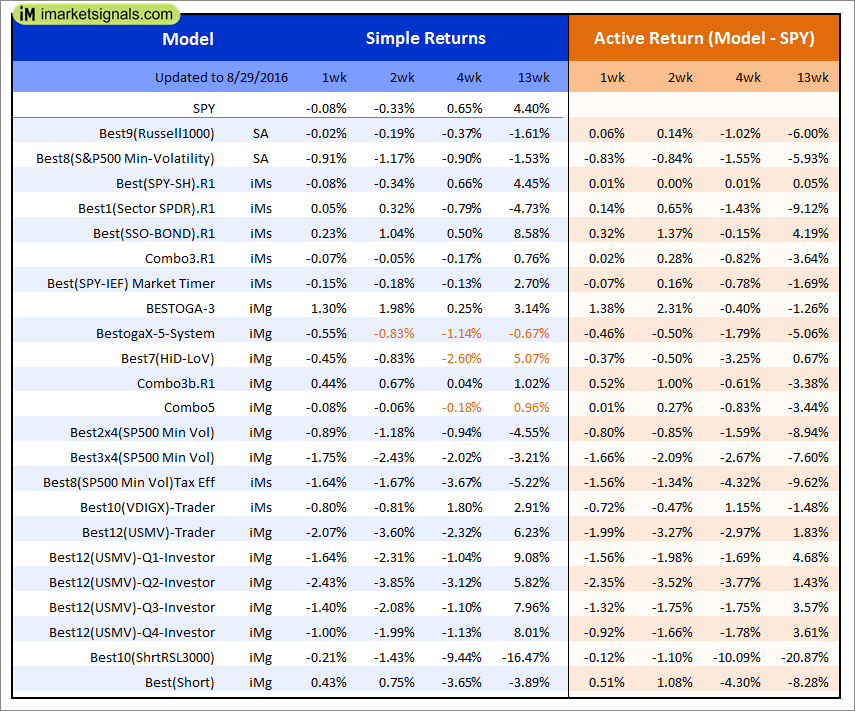
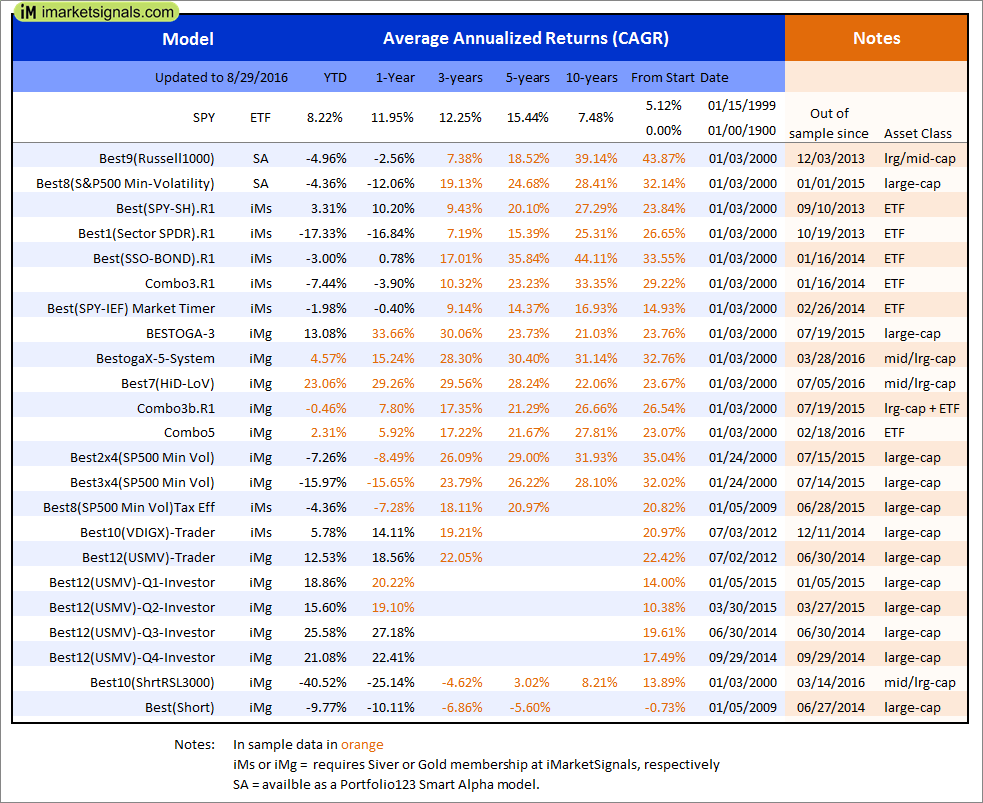
Out of sample performance summary of our models for the past 1, 2, 4 and 13 week periods. The active active return indicates how the models over- or underperformed the benchmark ETF SPY. Also the YTD, and the 1-, 3-, 5- and 10-year annualized returns are shown in the second table |
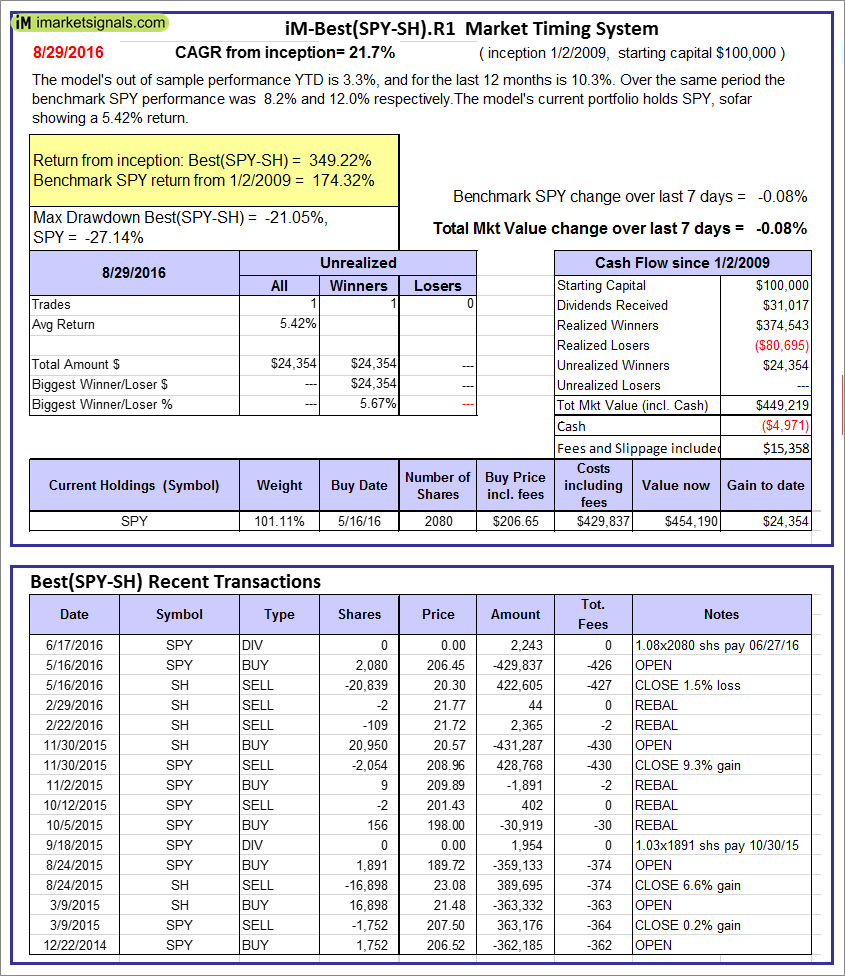 |
iM-Best(SPY-SH).R1: The model’s out of sample performance YTD is 3.3%, and for the last 12 months is 10.3%. Over the same period the benchmark SPY performance was 8.2% and 12.0% respectively. Over the previous week the market value of Best(SPY-SH) gained -0.08% at a time when SPY gained -0.08%. A starting capital of $100,000 at inception on 1/2/2009 would have grown to $449,219 which includes -$4,971 cash and excludes $15,358 spent on fees and slippage. |
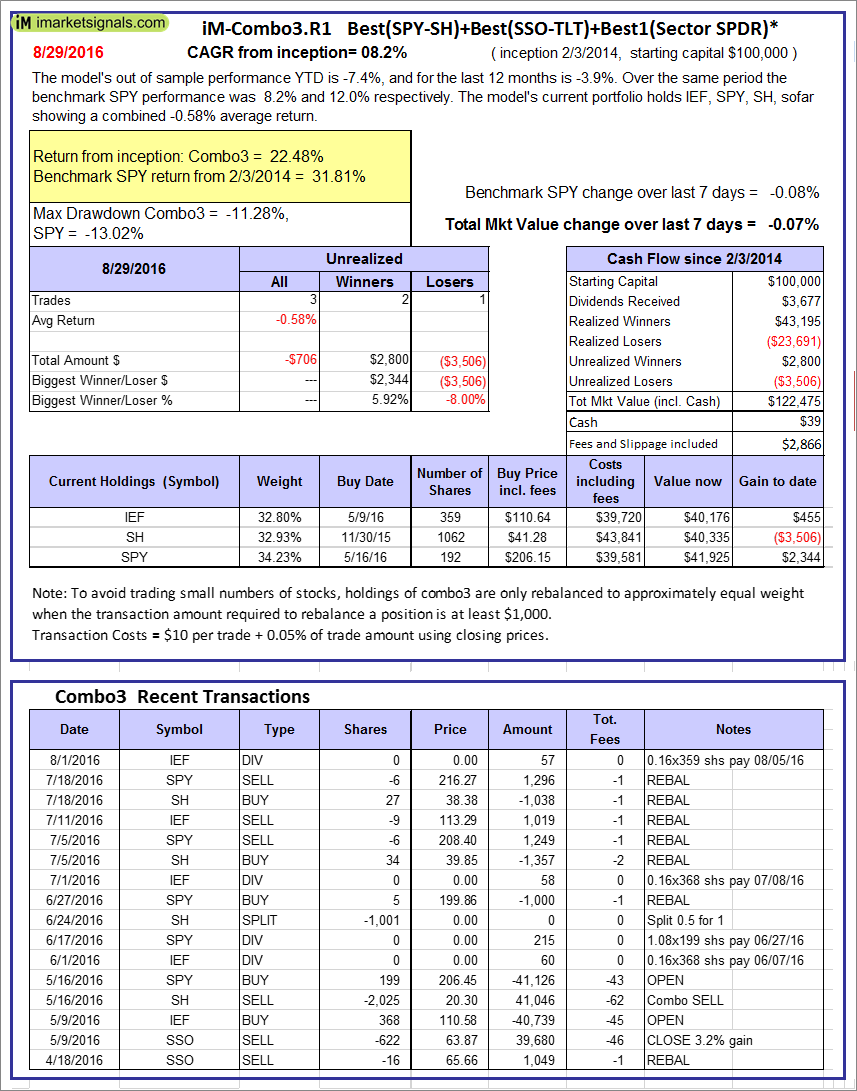 |
iM-Combo3.R1: The model’s out of sample performance YTD is -7.4%, and for the last 12 months is -3.9%. Over the same period the benchmark SPY performance was 8.2% and 12.0% respectively. Over the previous week the market value of iM-Combo3.R1 gained -0.07% at a time when SPY gained -0.08%. A starting capital of $100,000 at inception on 2/3/2014 would have grown to $122,475 which includes $39 cash and excludes $2,866 spent on fees and slippage. |
 |
iM-Combo5: The model’s out of sample performance from inception is -0.9%. The benchmark SPY performance over the same period is 14.9%. Over the previous week the market value of iM-Combo5 gained -0.08% at a time when SPY gained -0.08%. A starting capital of $100,000 at inception on 2/22/2016 would have grown to $99,076 which includes $18,977 cash and excludes $237 spent on fees and slippage. |
 |
The iM-Best8(S&P500 Min Vol)Tax-Efficient The model’s out of sample performance YTD is -4.4%, and for the last 12 months is -7.3%. Over the same period the benchmark SPY performance was 8.2% and 12.0% respectively. Over the previous week the market value of iM-Best8(S&P 500)Tax-Eff. gained -1.64% at a time when SPY gained -0.08%. A starting capital of $100,000 at inception on 1/2/2009 would have grown to $425,928 which includes $187,883 cash and excludes $6,973 spent on fees and slippage. |
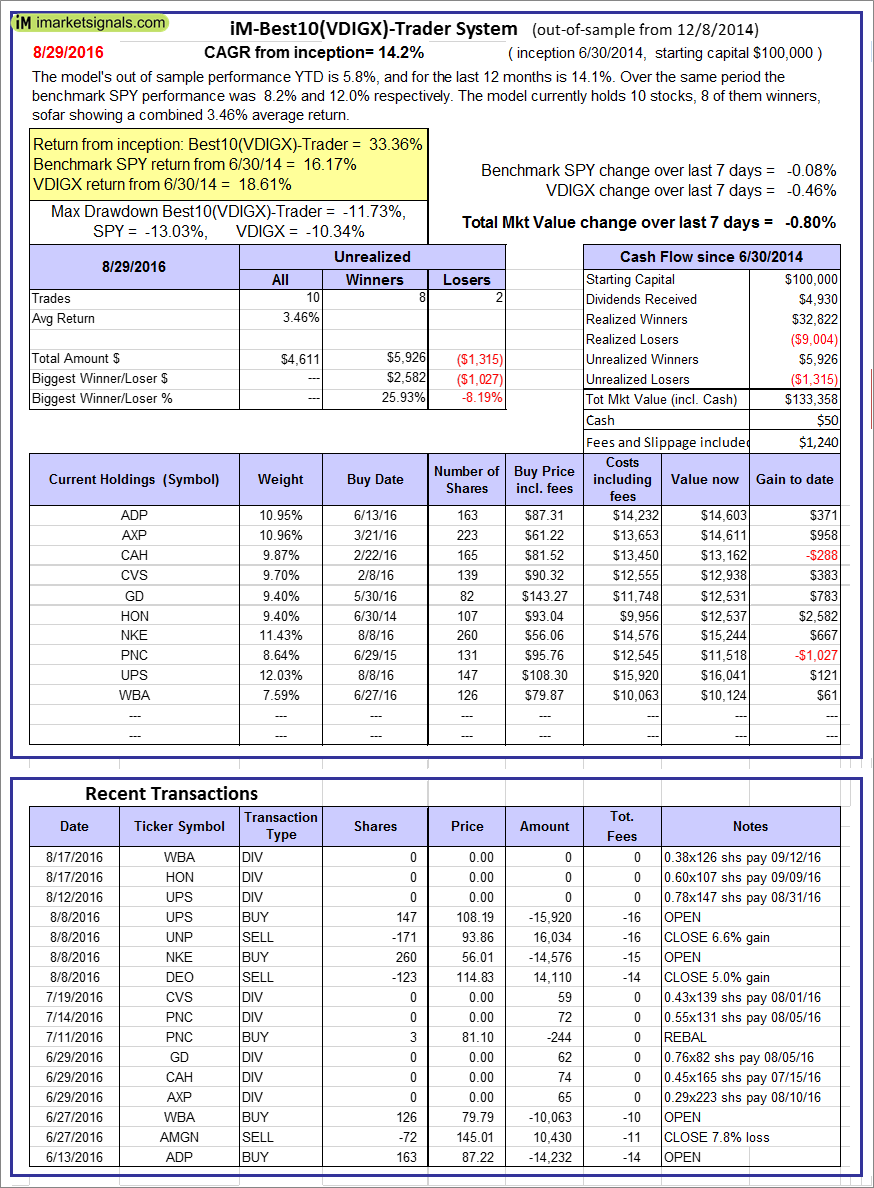 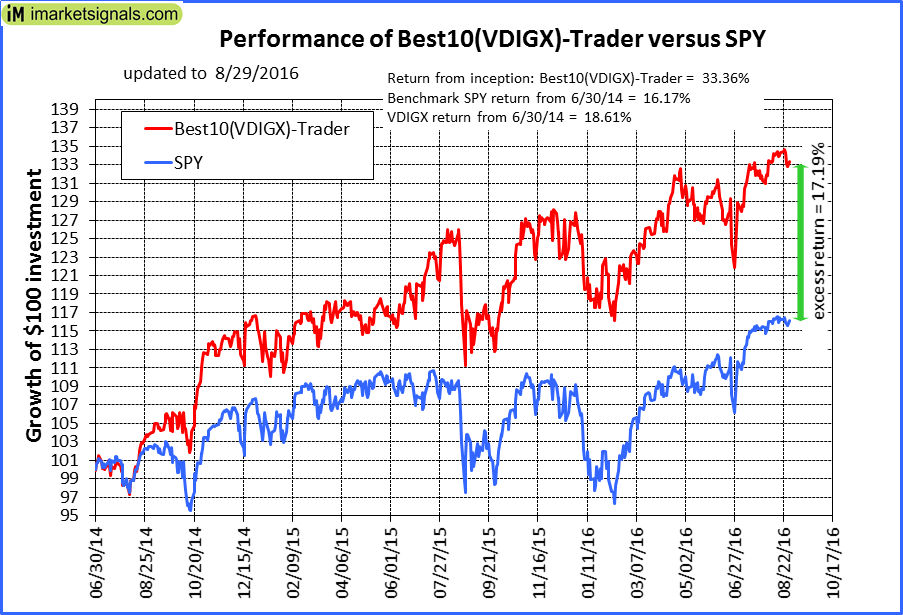 |
iM-Best10(VDIGX)-Trader: The model’s out of sample performance YTD is 5.8%, and for the last 12 months is 14.1%. Over the same period the benchmark SPY performance was 8.2% and 12.0% respectively. Since inception, on 7/1/2014, the model gained 33.36% while the benchmark SPY gained 16.17% and the ETF VDIGX gained 18.61% over the same period. Over the previous week the market value of iM-Best10(VDIGX) gained -0.80% at a time when SPY gained -0.08%. A starting capital of $100,000 at inception on 7/1/2014 would have grown to $133,358 which includes $50 cash and excludes $1,240 spent on fees and slippage. |
 |
iM-Best2 MC-Score ETF System: The model’s out of sample performance from inception is -0.5%. The benchmark SPY performance over the same period is 4.2%. Over the previous week the market value of iM-BESTOGA-3 gained -0.48% at a time when SPY gained -0.08%. A starting capital of $100,000 at inception on 2/3/2014 would have grown to $58 which includes $101 cash and excludes Gain to date spent on fees and slippage. |
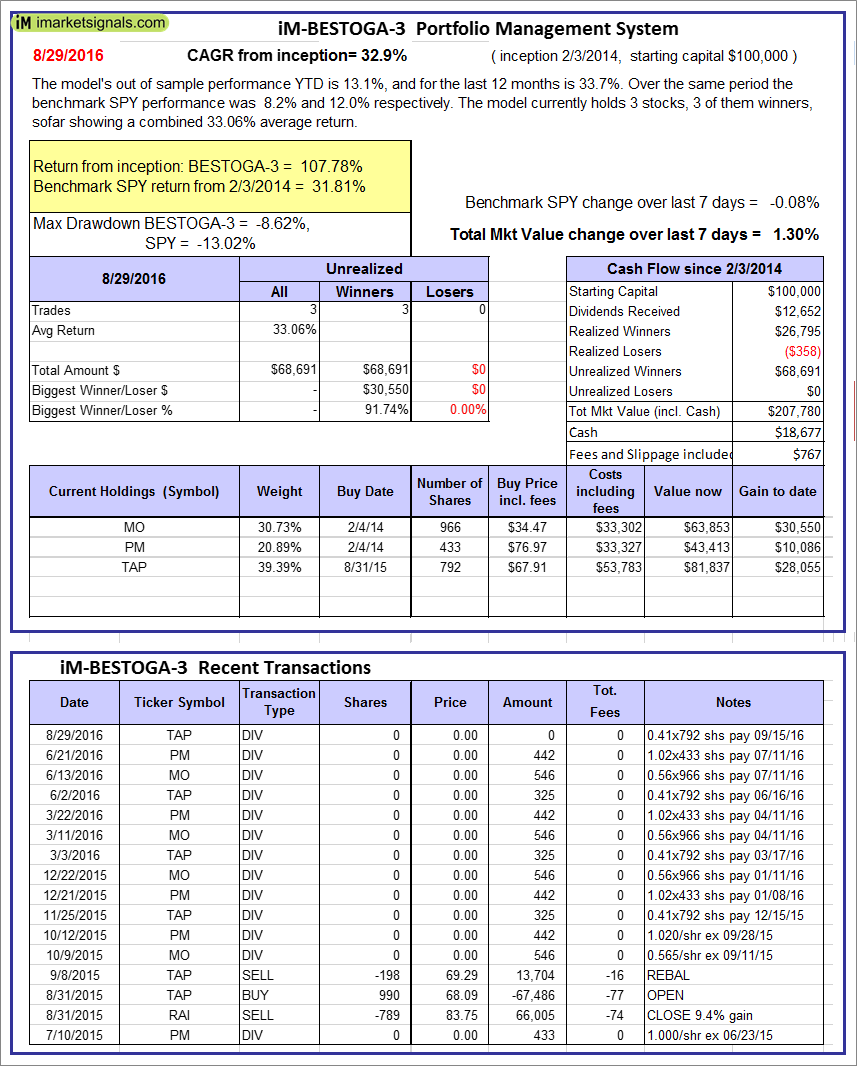 |
iM-BESTOGA-3: The model’s out of sample performance YTD is 13.1%, and for the last 12 months is 33.7%. Over the same period the benchmark SPY performance was 8.2% and 12.0% respectively. Over the previous week the market value of iM-BESTOGA-3 gained 1.30% at a time when SPY gained -0.08%. A starting capital of $100,000 at inception on 2/3/2014 would have grown to $207,780 which includes $18,677 cash and excludes $767 spent on fees and slippage. |
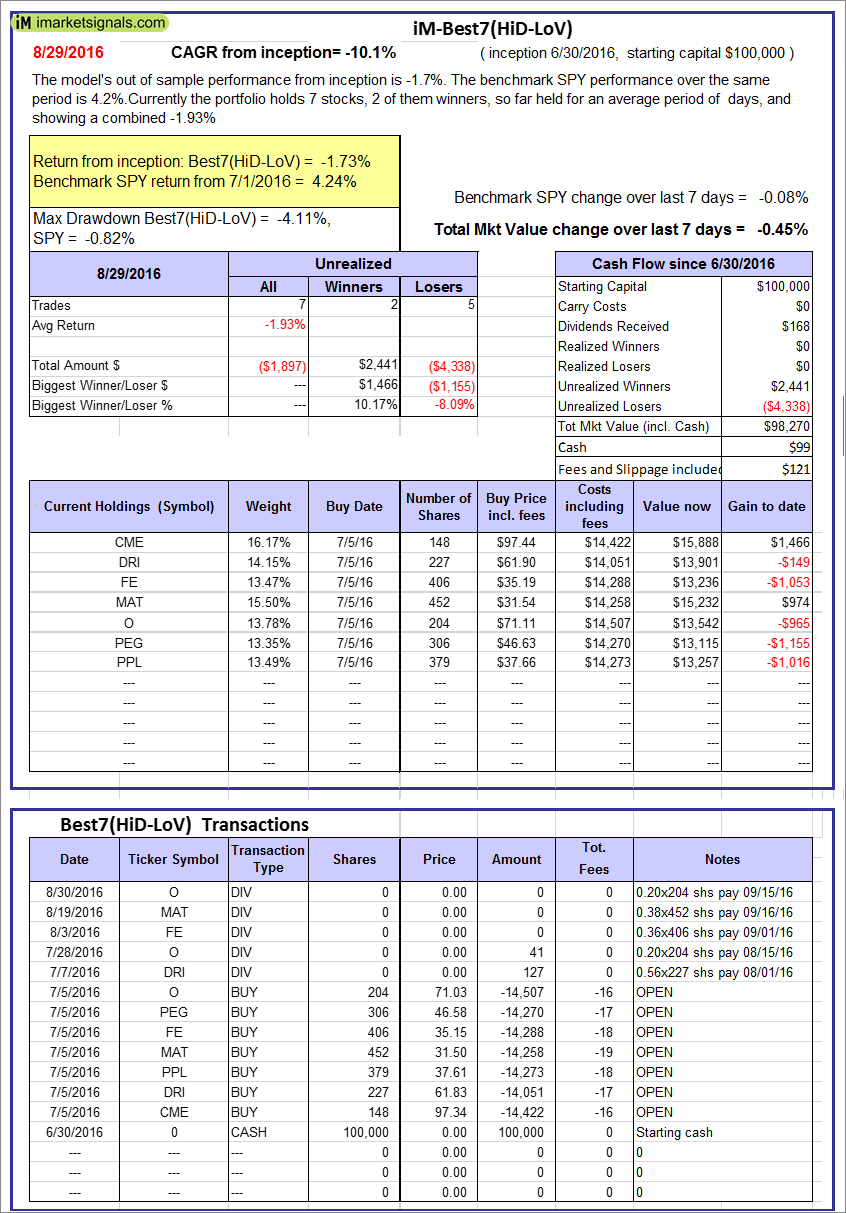 |
iM-Best7(HiD-LoV): The model’s out of sample performance from inception is -1.7%. The benchmark SPY performance over the same period is 4.2%. Over the previous week the market value of iM-BESTOGA-3 gained -0.45% at a time when SPY gained -0.08%. A starting capital of $100,000 at inception on 2/3/2014 would have grown to $98,270 which includes $99 cash and excludes $121 spent on fees and slippage. |
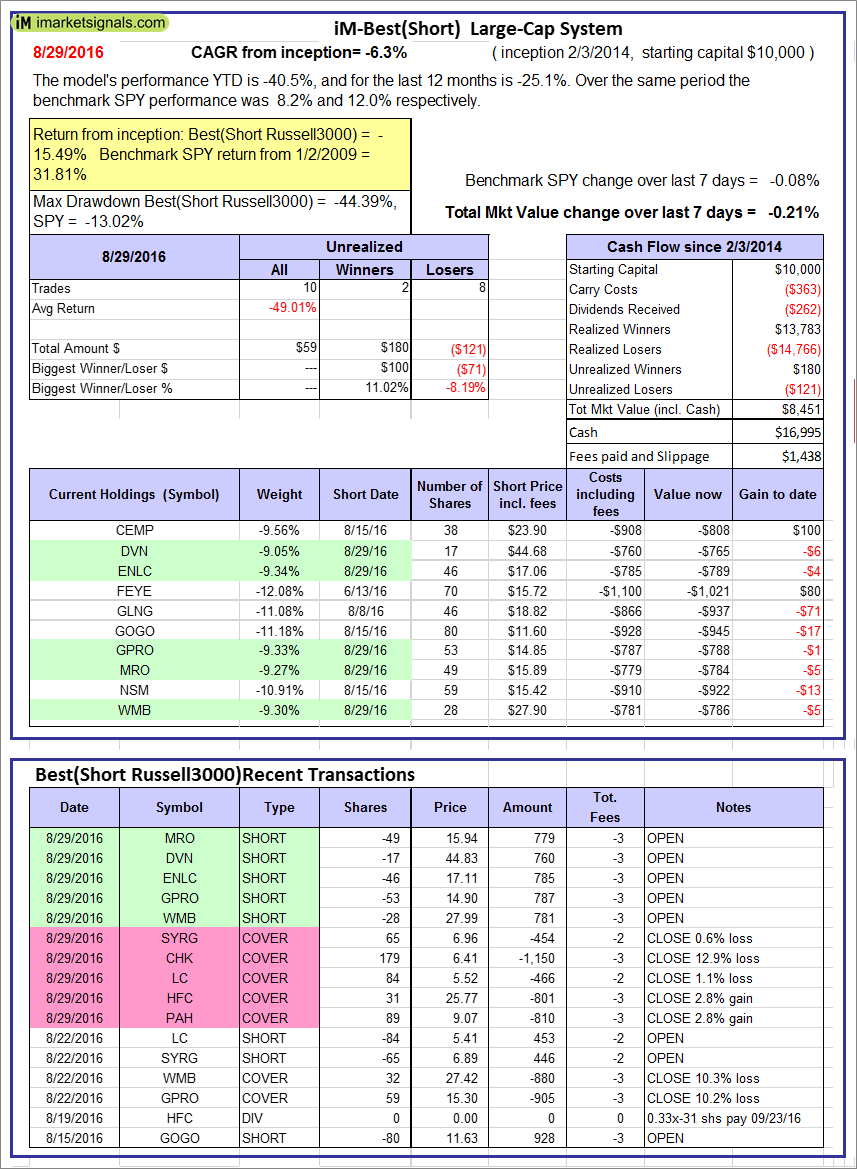 |
iM-Best10(Short Russell3000): The model’s performance YTD is -40.5%, and for the last 12 months is -25.1%. Over the same period the benchmark SPY performance was 8.2% and 12.0% respectively. Over the previous week the market value of iM-Best10(Short Russell3000) gained -0.21% at a time when SPY gained -0.08%. Over the period 2/3/2014 to 8/29/2016 the starting capital of $100,000 would have grown to $8,451 which includes $16,995 cash and excludes $1,438 spent on fees and slippage. |
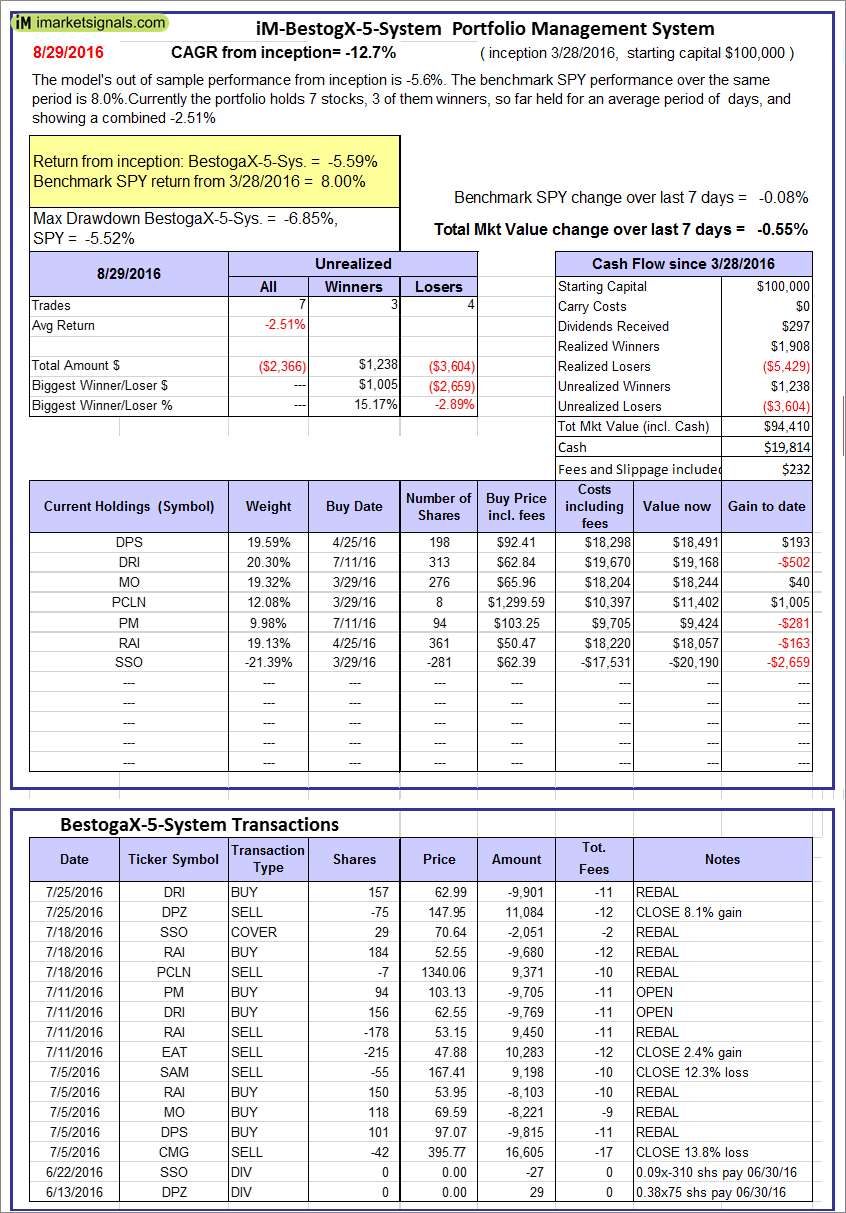 |
iM-BestogaX5-System: The model’s out of sample performance from inception is -5.6%. The benchmark SPY performance over the same period is 8.0%. Over the previous week the market value of iM-Best8(S&P 500)Tax-Eff. gained -0.55% at a time when SPY gained -0.08%. A starting capital of $100,000 at inception on 1/2/2009 would have grown to $94,410 which includes $19,814 cash and excludes $232 spent on fees and slippage. |
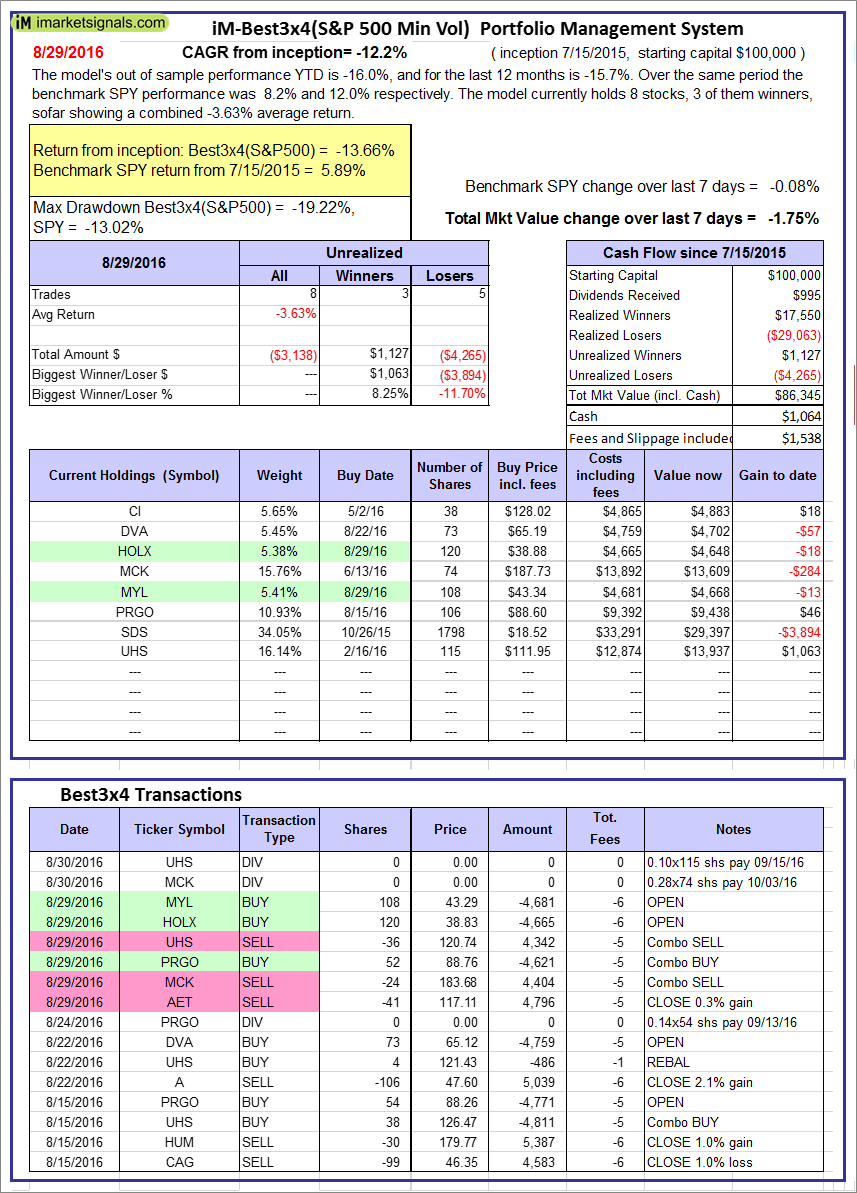 |
iM-Best3x4(S&P 500 Min Vol): The model’s out of sample performance YTD is -16.0%, and for the last 12 months is -15.7%. Over the same period the benchmark SPY performance was 8.2% and 12.0% respectively. Over the previous week the market value of iM-Best3x4 gained -1.75% at a time when SPY gained -0.08%. A starting capital of $100,000 at inception on 7/15/2015 would have grown to $86,345 which includes $1,064 cash and excludes $1,538 spent on fees and slippage. |
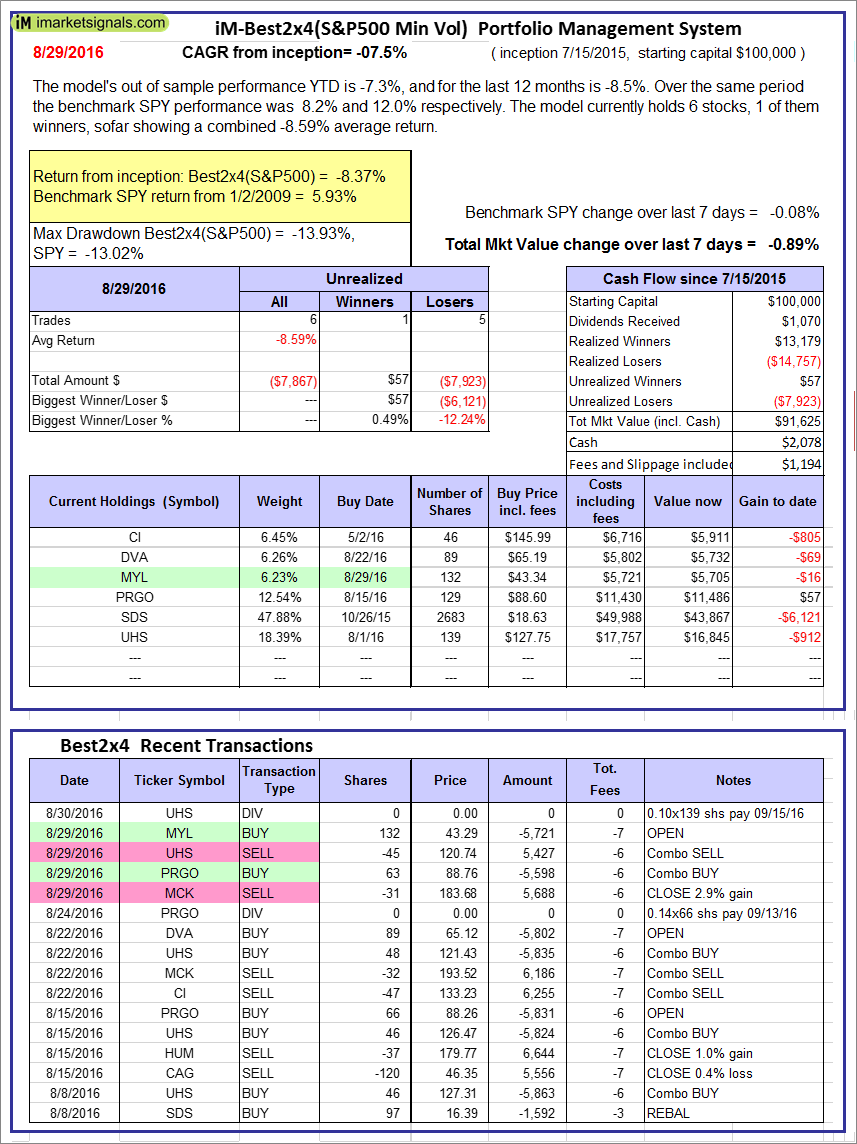 |
iM-Best2x4(S&P 500 Min Vol): The model’s out of sample performance YTD is -7.3%, and for the last 12 months is -8.5%. Over the same period the benchmark SPY performance was 8.2% and 12.0% respectively. Over the previous week the market value of iM-Best2x4 gained -0.89% at a time when SPY gained -0.08%. A starting capital of $100,000 at inception on 7/16/2015 would have grown to $91,625 which includes $2,078 cash and excludes $1,194 spent on fees and slippage. |
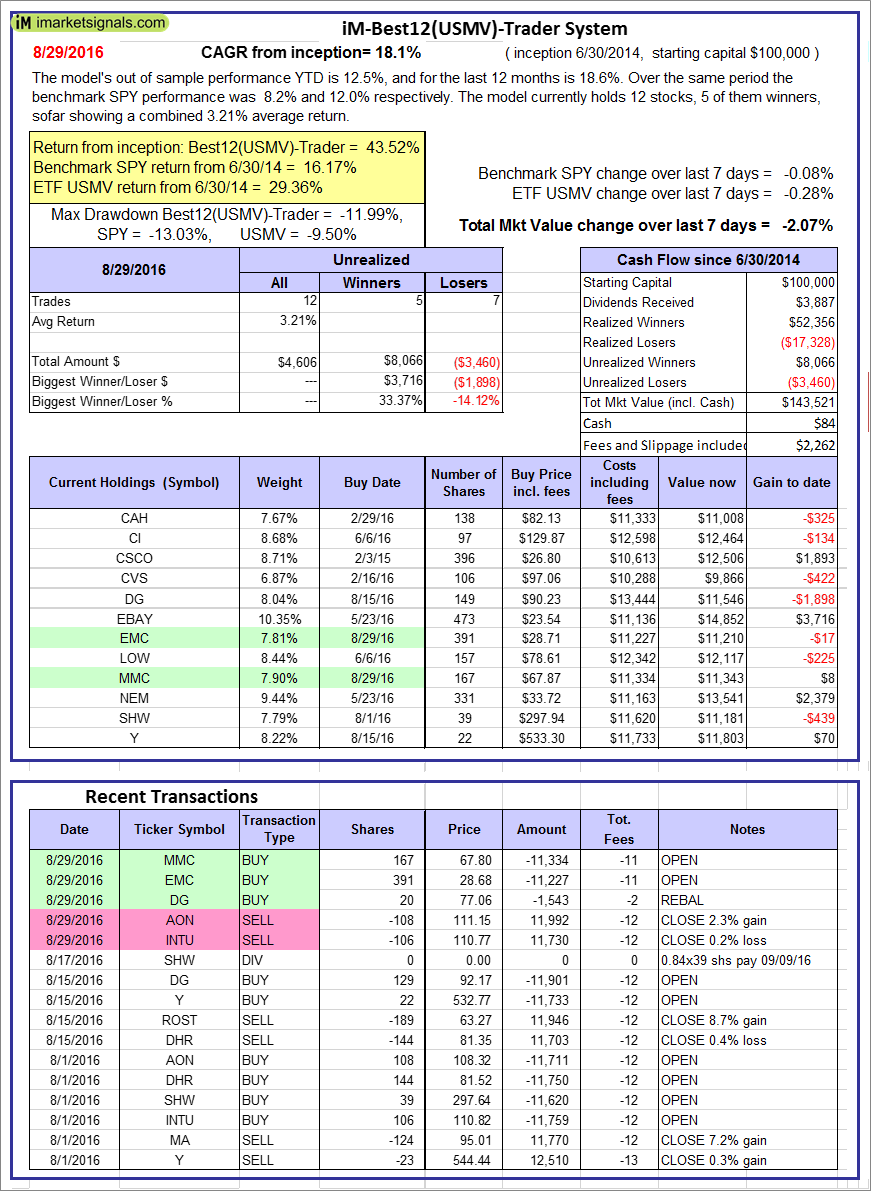 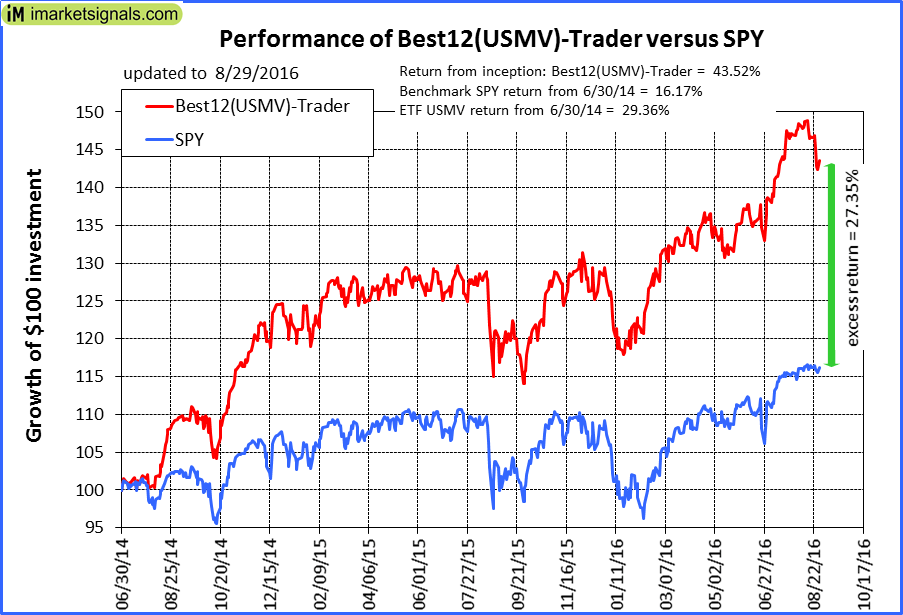 |
iM-Best12(USMV)-Trader: The model’s out of sample performance YTD is 12.5%, and for the last 12 months is 18.6%. Over the same period the benchmark SPY performance was 8.2% and 12.0% respectively. Since inception, on 7/1/2014, the model gained 43.52% while the benchmark SPY gained 16.17% and the ETF USMV gained 29.36% over the same period. Over the previous week the market value of iM-Best12(USMV)-Trader gained -2.07% at a time when SPY gained -0.08%. A starting capital of $100,000 at inception on 7/1/2014 would have grown to $143,521 which includes $84 cash and excludes $2,262 spent on fees and slippage. |
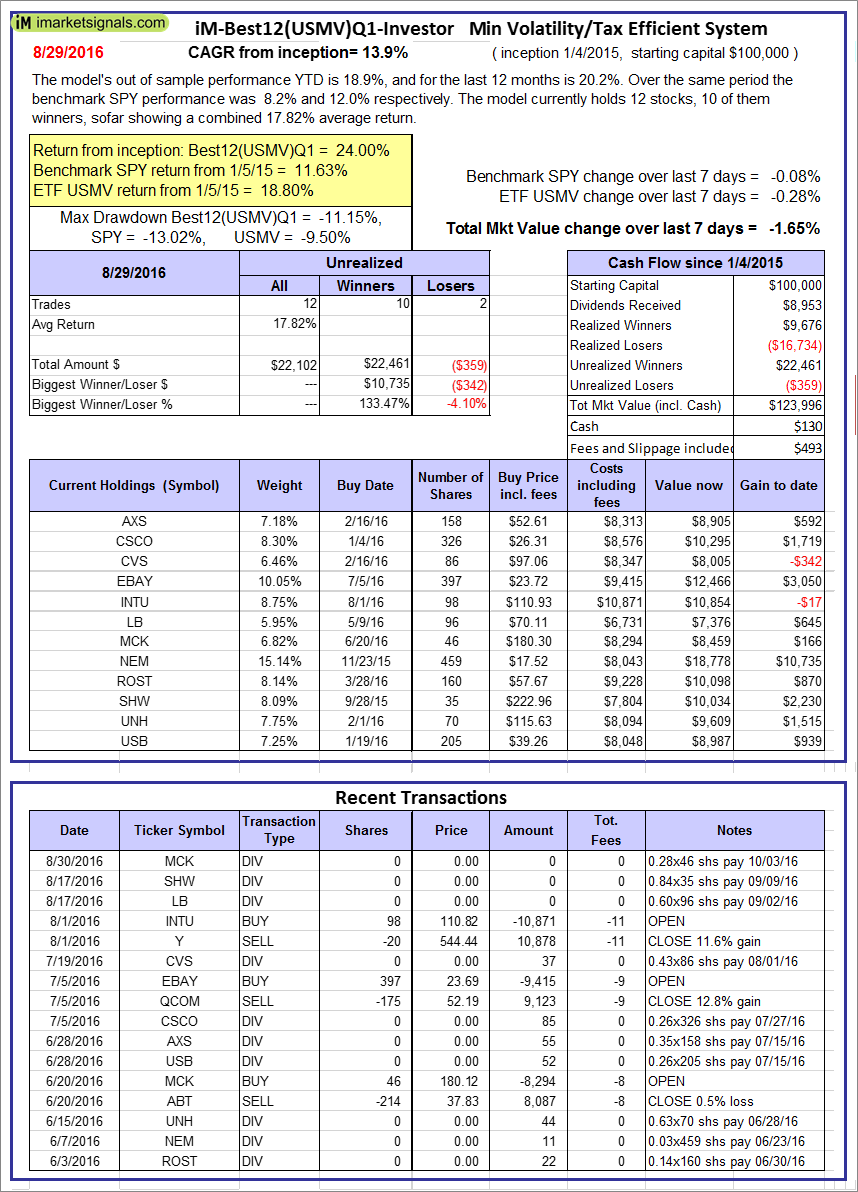 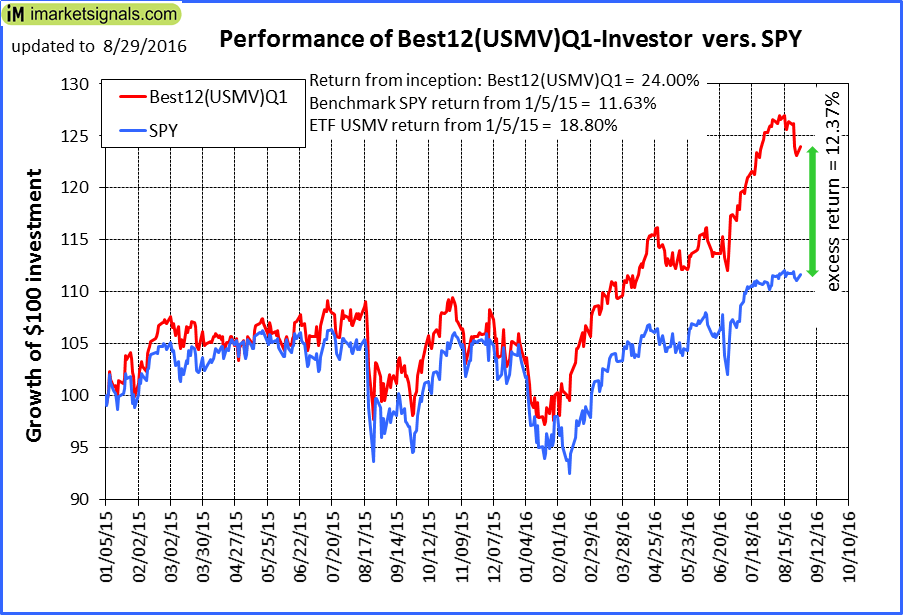 |
iM-Best12(USMV)Q1-Investor: The model’s out of sample performance YTD is 18.9%, and for the last 12 months is 20.2%. Over the same period the benchmark SPY performance was 8.2% and 12.0% respectively. Since inception, on 1/5/2015, the model gained 24.00% while the benchmark SPY gained 11.63% and the ETF USMV gained 18.80% over the same period. Over the previous week the market value of iM-Best12(USMV)Q1 gained -1.65% at a time when SPY gained -0.08%. A starting capital of $100,000 at inception on 1/5/2015 would have grown to $123,996 which includes $130 cash and excludes $493 spent on fees and slippage. |
 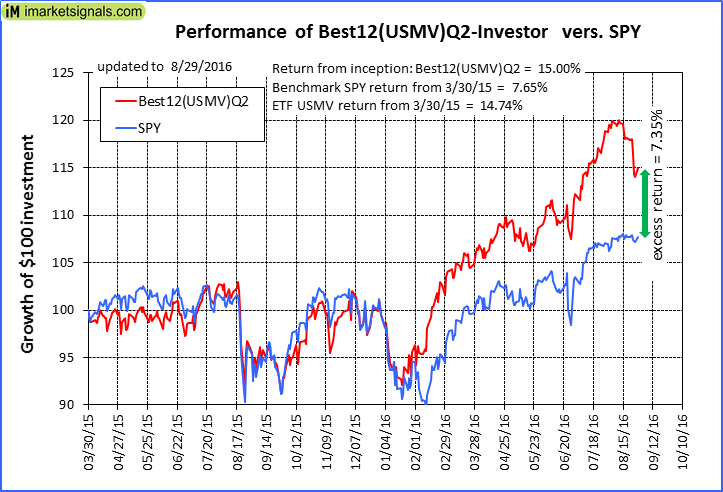 |
iM-Best12(USMV)Q2-Investor: The model’s out of sample performance YTD is 15.6%, and for the last 12 months is 19.1%. Over the same period the benchmark SPY performance was 8.2% and 12.0% respectively. Since inception, on 3/31/2015, the model gained 15.00% while the benchmark SPY gained 7.65% and the ETF USMV gained 14.74% over the same period. Over the previous week the market value of iM-Best12(USMV)Q2 gained -2.43% at a time when SPY gained -0.08%. A starting capital of $100,000 at inception on 3/31/2015 would have grown to $115,002 which includes $33 cash and excludes $386 spent on fees and slippage. |
  |
iM-Best12(USMV)Q3-Investor: The model’s out of sample performance YTD is 25.6%, and for the last 12 months is 27.2%. Over the same period the benchmark SPY performance was 8.2% and 12.0% respectively. Since inception, on 7/1/2014, the model gained 47.27% while the benchmark SPY gained 16.17% and the ETF USMV gained 29.36% over the same period. Over the previous week the market value of iM-Best12(USMV)Q3 gained -1.40% at a time when SPY gained -0.08%. A starting capital of $100,000 at inception on 7/1/2014 would have grown to $147,268 which includes $156 cash and excludes $700 spent on fees and slippage. |
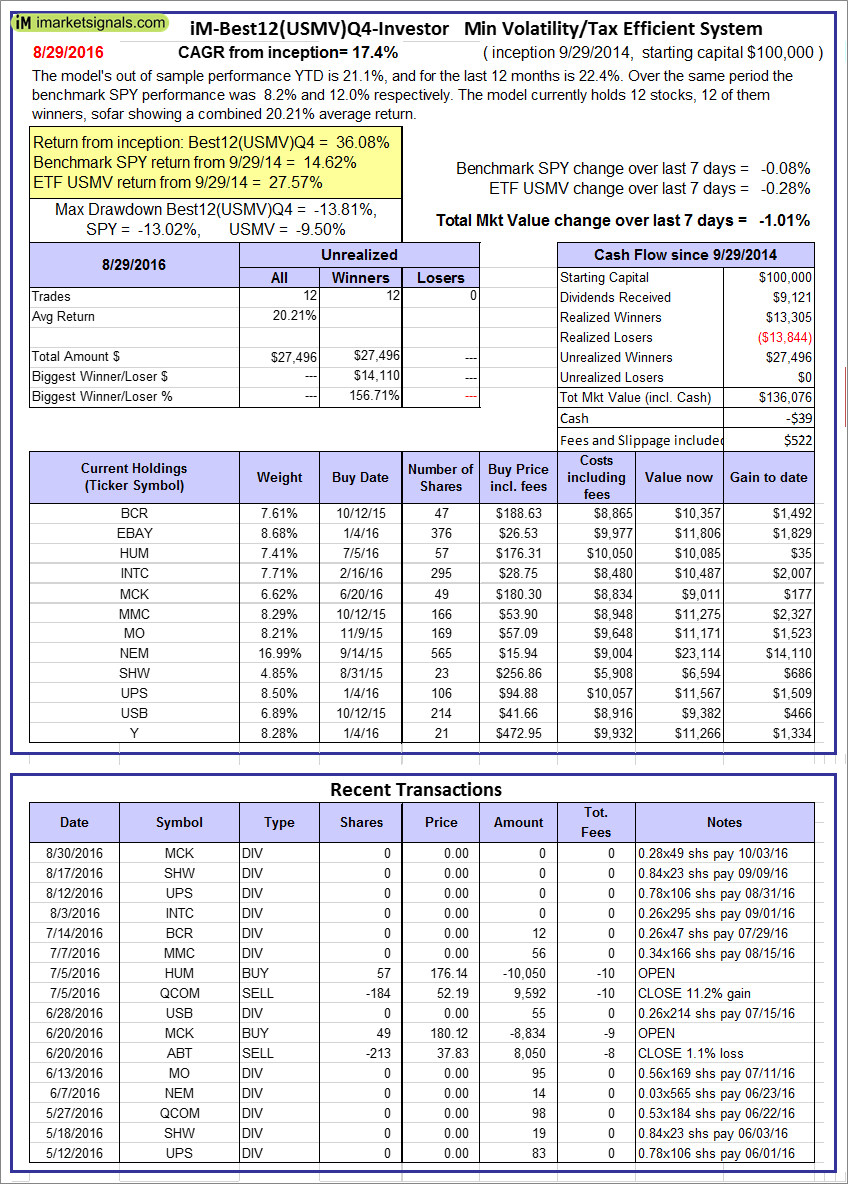 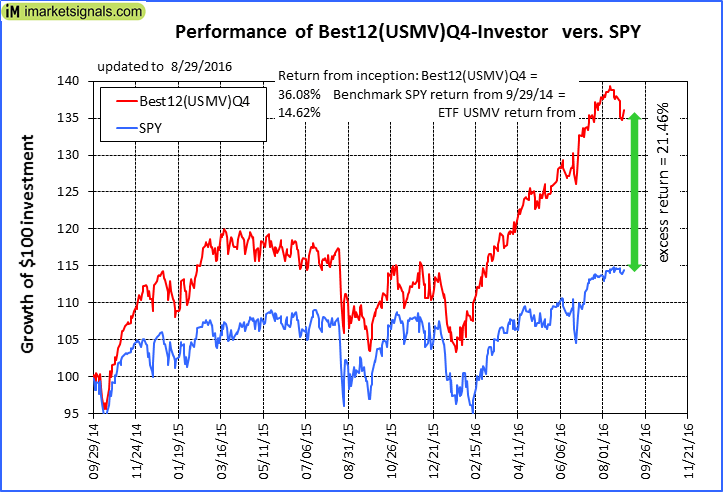 |
iM-Best12(USMV)Q4-Investor: Since inception, on 9/30/2014, the model gained 36.08% while the benchmark SPY gained 14.62% and the ETF USMV gained 27.57% over the same period. Over the previous week the market value of iM-Best12(USMV)Q4 gained -1.01% at a time when SPY gained -0.08%. A starting capital of $100,000 at inception on 9/30/2014 would have grown to $136,076 which includes -$39 cash and excludes $522 spent on fees and slippage. |
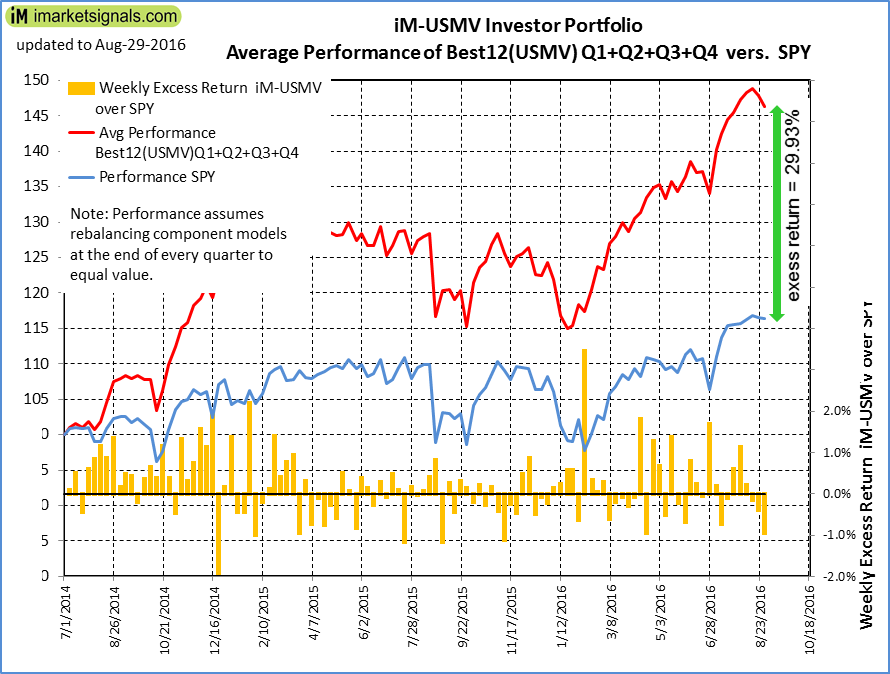 |
Average Performance of iM-Best12(USMV)Q1+Q2+Q3+Q4-Investor resulted in an excess return of 31.37% over SPY. (see iM-USMV Investor Portfolio) |
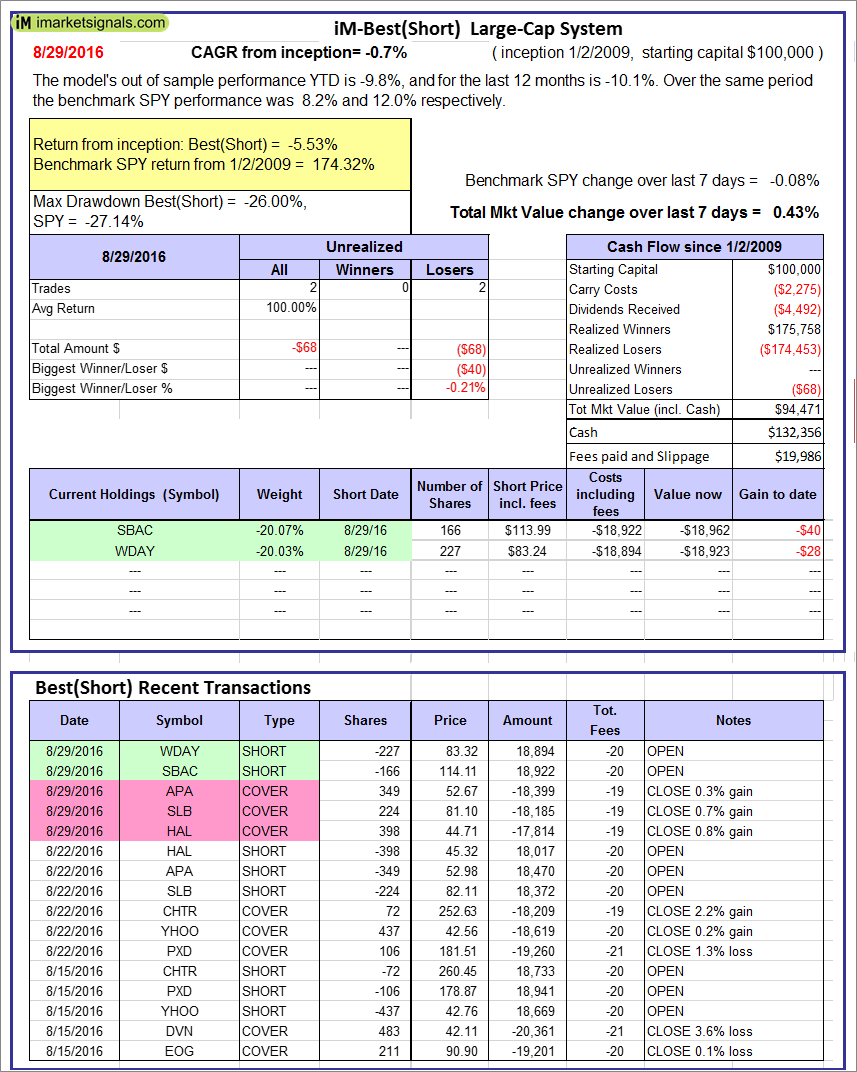 |
iM-Best(Short): The model’s out of sample performance YTD is -9.8%, and for the last 12 months is -10.1%. Over the same period the benchmark SPY performance was 8.2% and 12.0% respectively. Over the previous week the market value of iM-Best(Short) gained 0.43% at a time when SPY gained -0.08%. Over the period 1/2/2009 to 8/29/2016 the starting capital of $100,000 would have grown to $94,471 which includes $132,356 cash and excludes $19,986 spent on fees and slippage. |
iM-Best Reports – 8/29/2016
Posted in pmp SPY-SH
Leave a Reply
You must be logged in to post a comment.