
  |
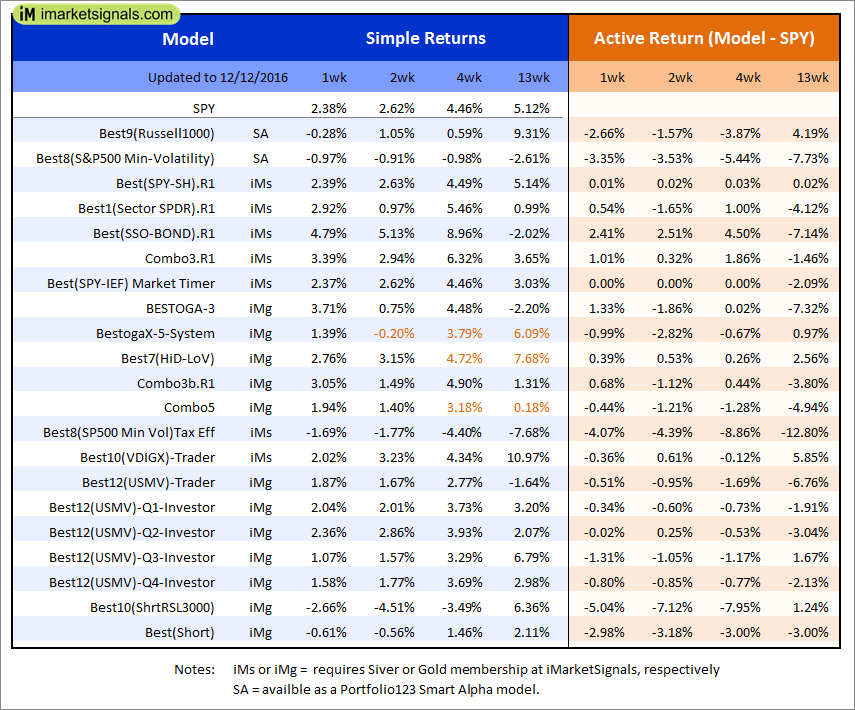
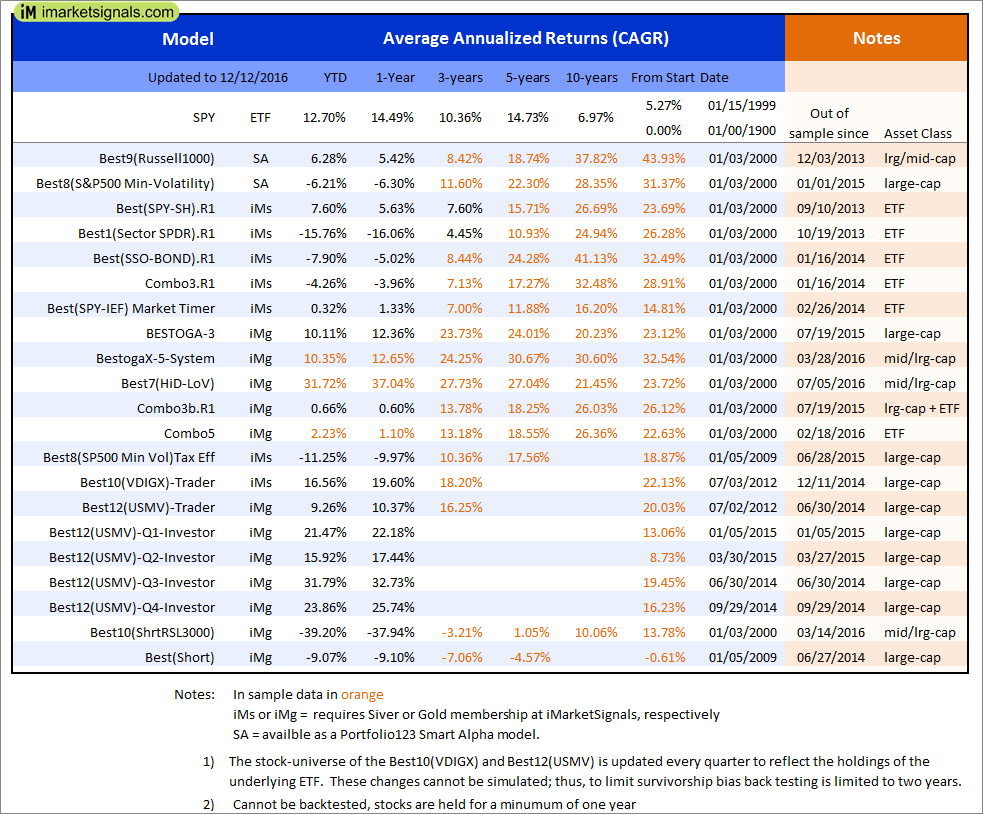
Out of sample performance summary of our models for the past 1, 2, 4 and 13 week periods. The active active return indicates how the models over- or underperformed the benchmark ETF SPY. Also the YTD, and the 1-, 3-, 5- and 10-year annualized returns are shown in the second table |
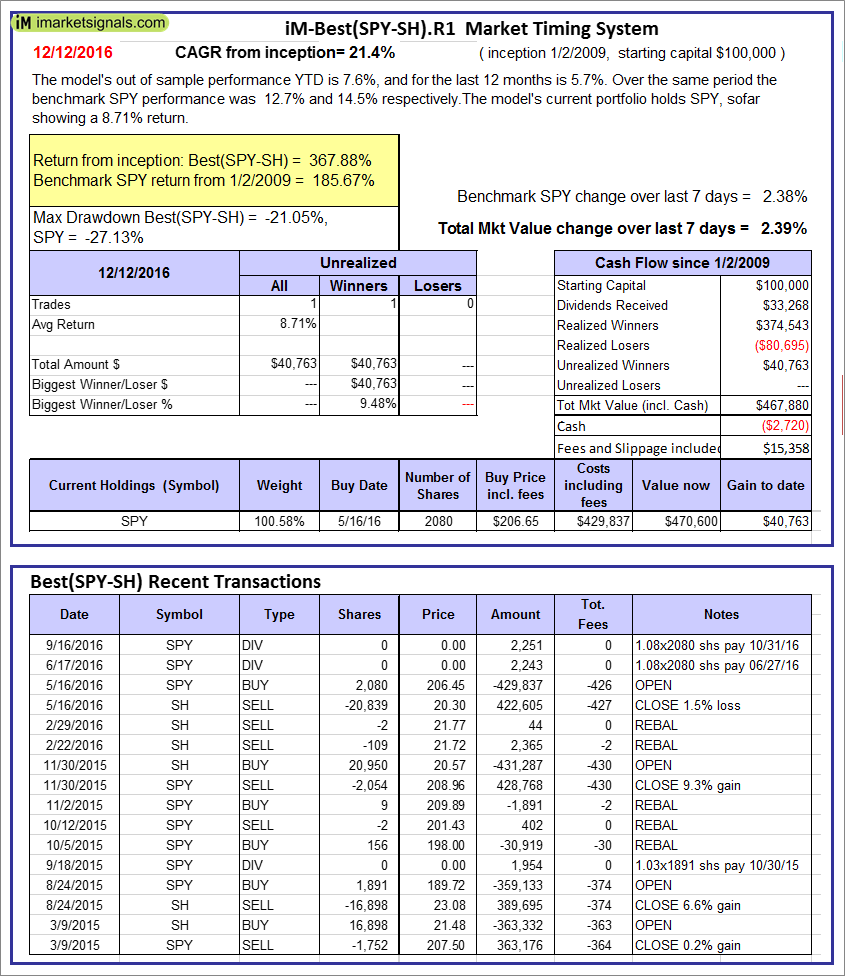 |
iM-Best(SPY-SH).R1: The model’s out of sample performance YTD is 7.6%, and for the last 12 months is 5.7%. Over the same period the benchmark SPY performance was 12.7% and 14.5% respectively. Over the previous week the market value of Best(SPY-SH) gained 2.39% at a time when SPY gained 2.38%. A starting capital of $100,000 at inception on 1/2/2009 would have grown to $467,880 which includes -$2,720 cash and excludes $15,358 spent on fees and slippage. |
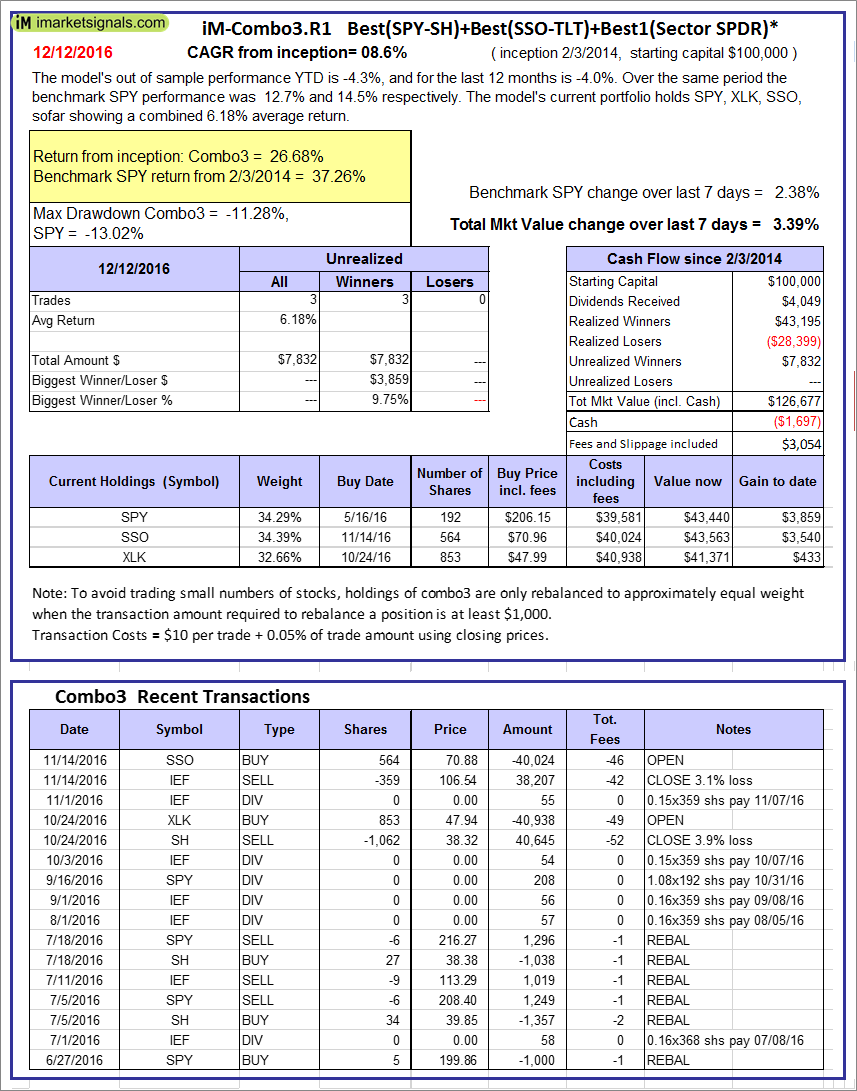 |
iM-Combo3.R1: The model’s out of sample performance YTD is -4.3%, and for the last 12 months is -4.0%. Over the same period the benchmark SPY performance was 12.7% and 14.5% respectively. Over the previous week the market value of iM-Combo3.R1 gained 3.39% at a time when SPY gained 2.38%. A starting capital of $100,000 at inception on 2/3/2014 would have grown to $126,677 which includes -$1,697 cash and excludes $3,054 spent on fees and slippage. |
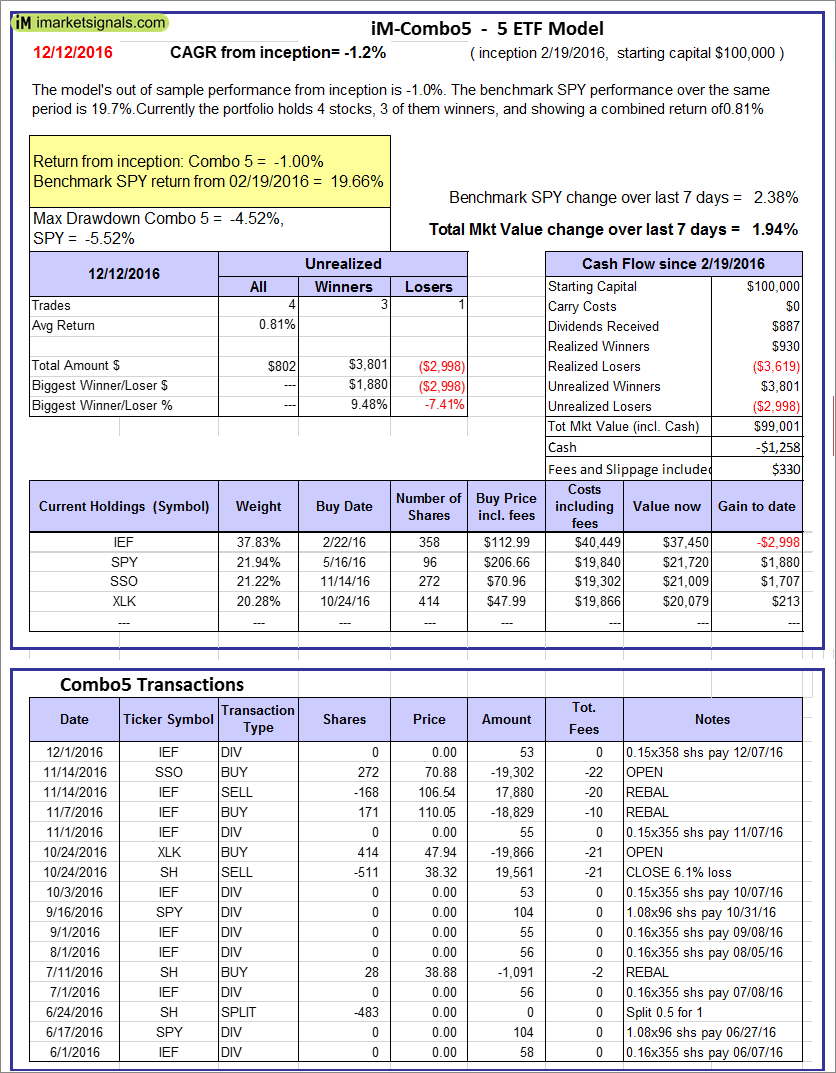 |
iM-Combo5: The model’s out of sample performance from inception is -1.0%. The benchmark SPY performance over the same period is 19.7%. Over the previous week the market value of iM-Combo5 gained 1.94% at a time when SPY gained 2.38%. A starting capital of $100,000 at inception on 2/22/2016 would have grown to $99,001 which includes -$1,258 cash and excludes $330 spent on fees and slippage. |
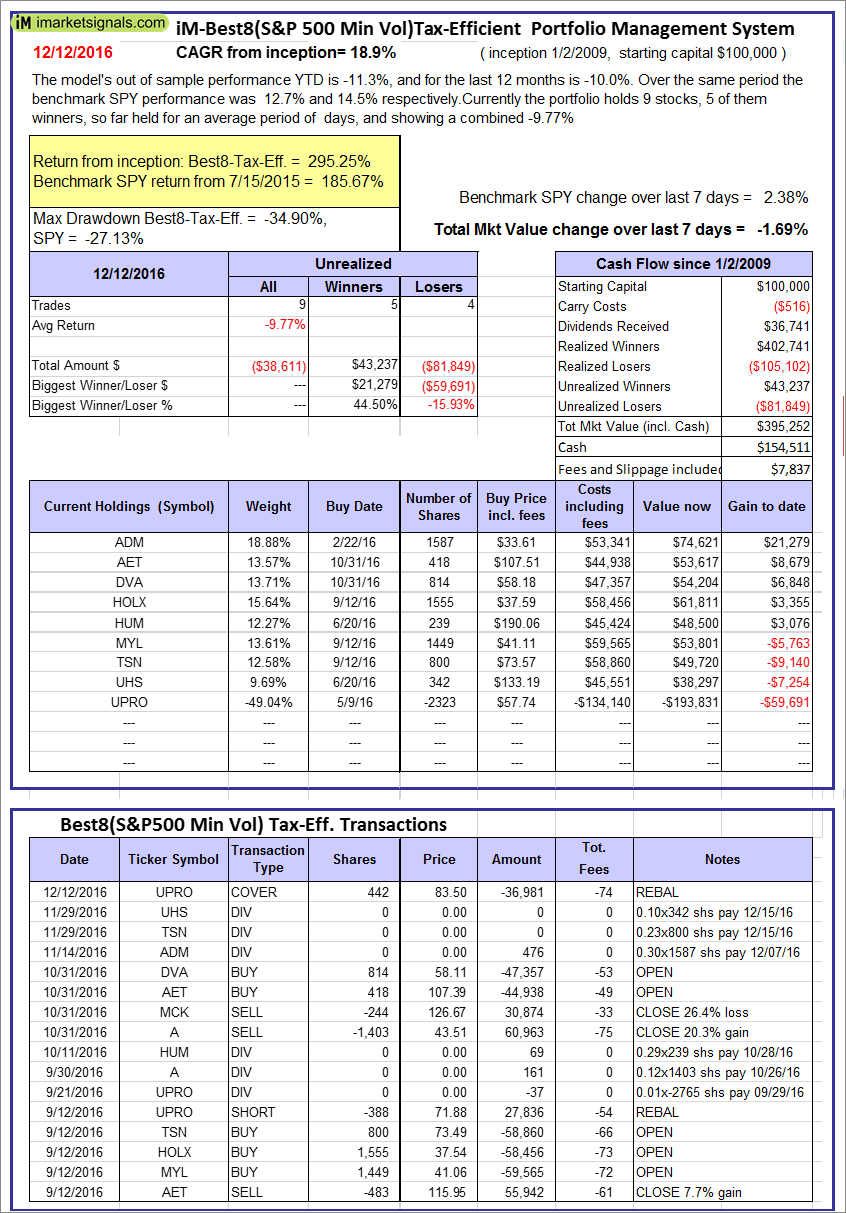 |
The iM-Best8(S&P500 Min Vol)Tax-Efficient The model’s out of sample performance YTD is -11.3%, and for the last 12 months is -10.0%. Over the same period the benchmark SPY performance was 12.7% and 14.5% respectively. Over the previous week the market value of iM-Best8(S&P 500)Tax-Eff. gained -1.69% at a time when SPY gained 2.38%. A starting capital of $100,000 at inception on 1/2/2009 would have grown to $395,252 which includes $154,511 cash and excludes $7,837 spent on fees and slippage. |
 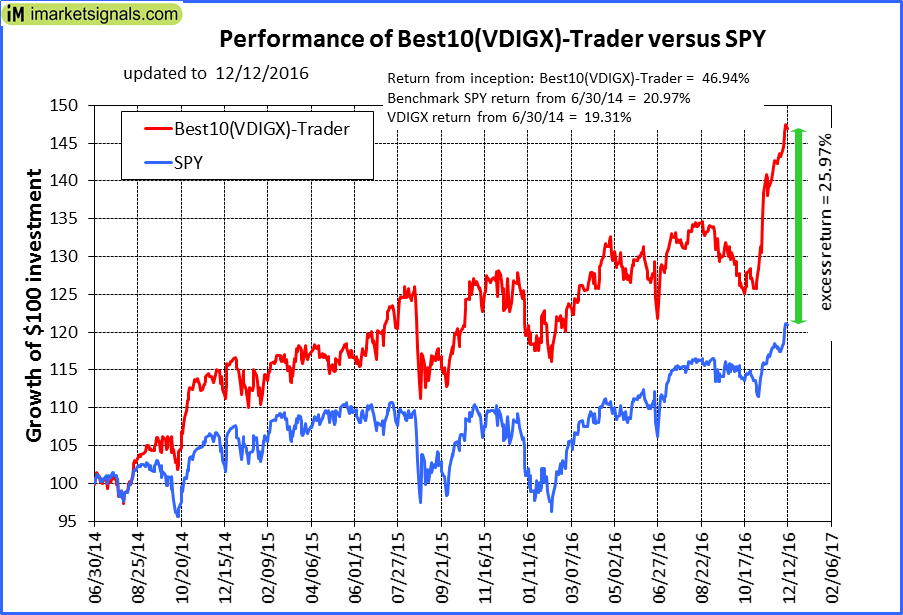 |
iM-Best10(VDIGX)-Trader: The model’s out of sample performance YTD is 16.6%, and for the last 12 months is 19.6%. Over the same period the benchmark SPY performance was 12.7% and 14.5% respectively. Since inception, on 7/1/2014, the model gained 46.94% while the benchmark SPY gained 20.97% and the ETF VDIGX gained 19.31% over the same period. Over the previous week the market value of iM-Best10(VDIGX) gained 2.02% at a time when SPY gained 2.38%. A starting capital of $100,000 at inception on 7/1/2014 would have grown to $146,938 which includes $363 cash and excludes $1,491 spent on fees and slippage. |
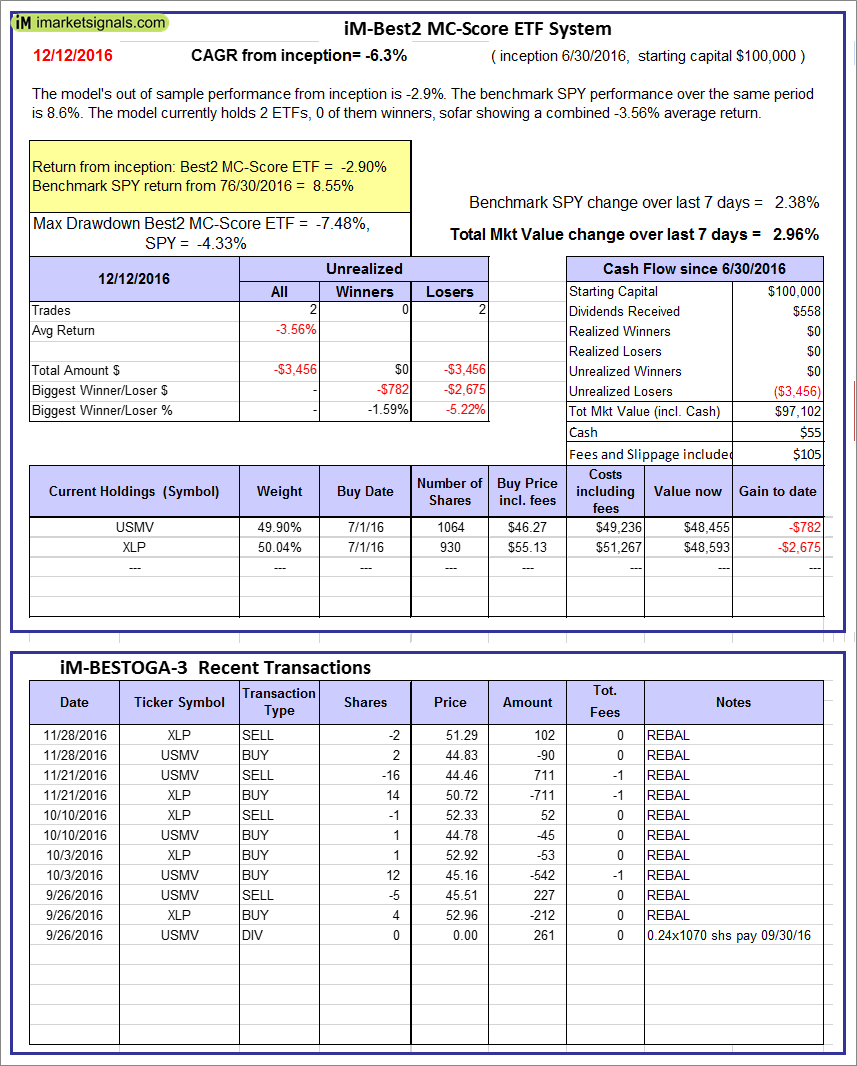 |
iM-Best2 MC-Score ETF System: The model’s out of sample performance from inception is -2.9%. The benchmark SPY performance over the same period is 8.6%. Over the previous week the market value of iM-BESTOGA-3 gained 2.96% at a time when SPY gained 2.38%. A starting capital of $100,000 at inception on 2/3/2014 would have grown to $55 which includes $105 cash and excludes Gain to date spent on fees and slippage. |
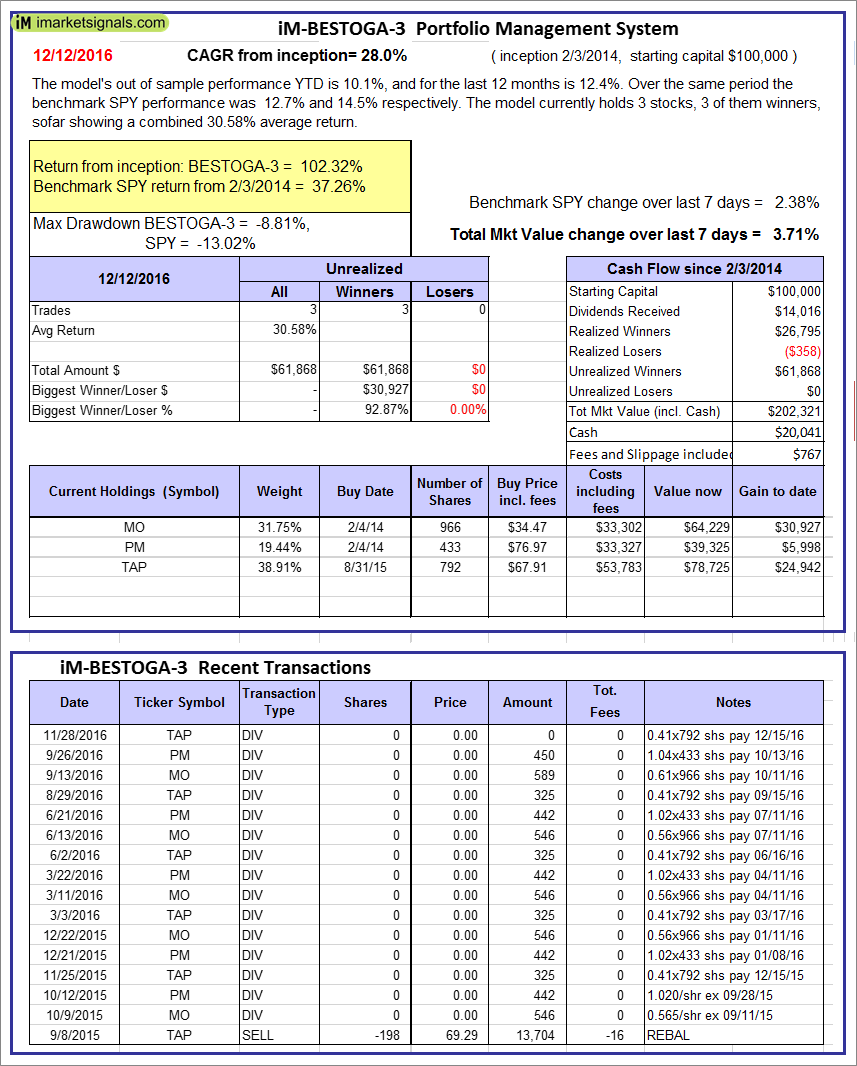 |
iM-BESTOGA-3: The model’s out of sample performance YTD is 10.1%, and for the last 12 months is 12.4%. Over the same period the benchmark SPY performance was 12.7% and 14.5% respectively. Over the previous week the market value of iM-BESTOGA-3 gained 3.71% at a time when SPY gained 2.38%. A starting capital of $100,000 at inception on 2/3/2014 would have grown to $202,321 which includes $20,041 cash and excludes $767 spent on fees and slippage. |
 |
iM-Best7(HiD-LoV): The model’s out of sample performance from inception is 5.2%. The benchmark SPY performance over the same period is 8.6%. Over the previous week the market value of iM-BESTOGA-3 gained 2.76% at a time when SPY gained 2.38%. A starting capital of $100,000 at inception on 2/3/2014 would have grown to $105,180 which includes $334 cash and excludes $271 spent on fees and slippage. |
 |
iM-Best10(Short Russell3000): The model’s performance YTD is -39.2%, and for the last 12 months is -37.9%. Over the same period the benchmark SPY performance was 12.7% and 14.5% respectively. Over the previous week the market value of iM-Best10(Short Russell3000) gained -2.66% at a time when SPY gained 2.38%. Over the period 2/3/2014 to 12/12/2016 the starting capital of $100,000 would have grown to $8,639 which includes $17,013 cash and excludes $1,596 spent on fees and slippage. |
 |
iM-BestogaX5-System: The model’s out of sample performance from inception is -0.4%. The benchmark SPY performance over the same period is 12.5%. Over the previous week the market value of iM-Best8(S&P 500)Tax-Eff. gained 1.39% at a time when SPY gained 2.38%. A starting capital of $100,000 at inception on 1/2/2009 would have grown to $99,625 which includes $20,171 cash and excludes $336 spent on fees and slippage. |
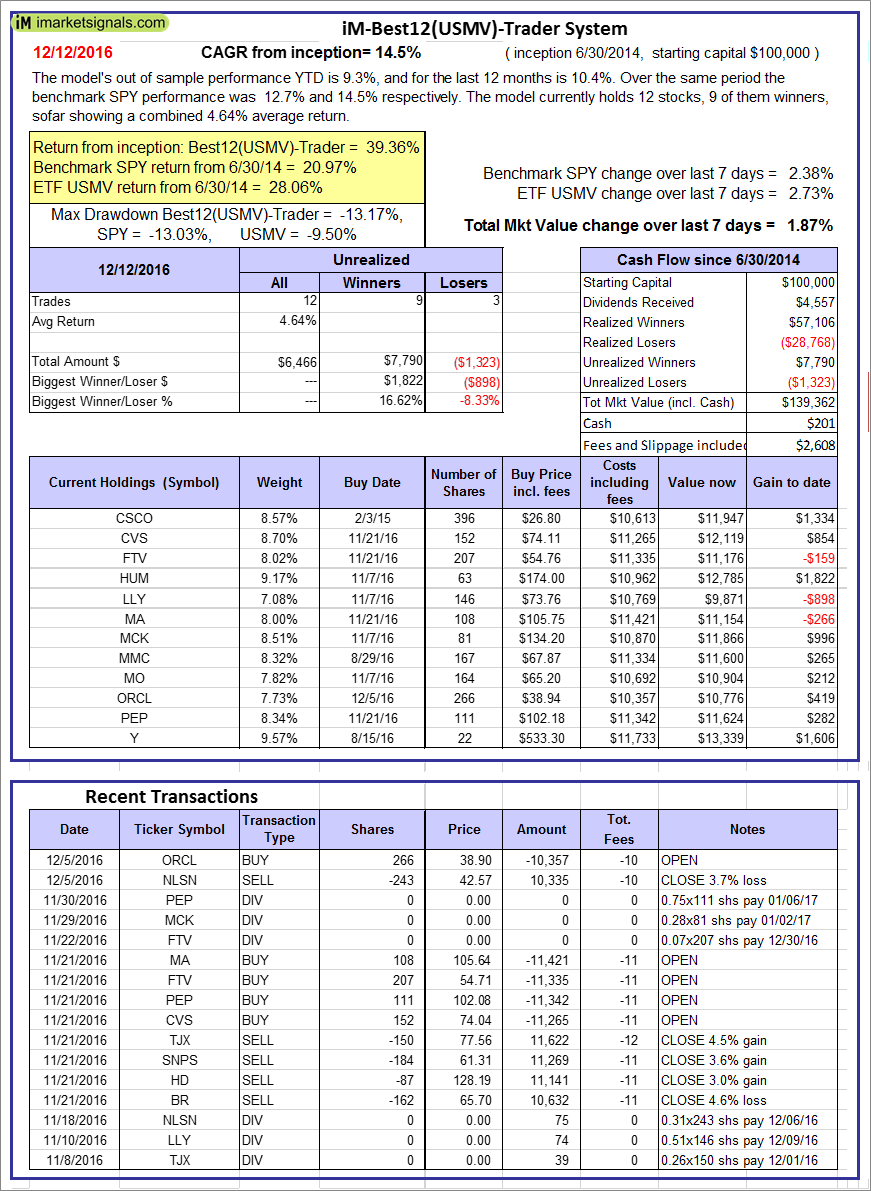 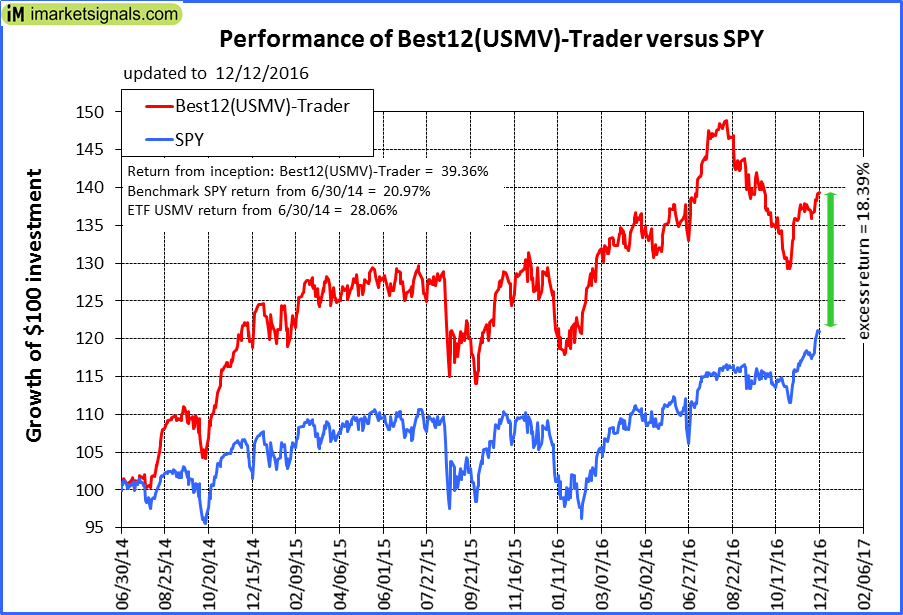 |
iM-Best12(USMV)-Trader: The model’s out of sample performance YTD is 9.3%, and for the last 12 months is 10.4%. Over the same period the benchmark SPY performance was 12.7% and 14.5% respectively. Since inception, on 7/1/2014, the model gained 39.36% while the benchmark SPY gained 20.97% and the ETF USMV gained 28.06% over the same period. Over the previous week the market value of iM-Best12(USMV)-Trader gained 1.87% at a time when SPY gained 2.38%. A starting capital of $100,000 at inception on 7/1/2014 would have grown to $139,362 which includes $201 cash and excludes $2,608 spent on fees and slippage. |
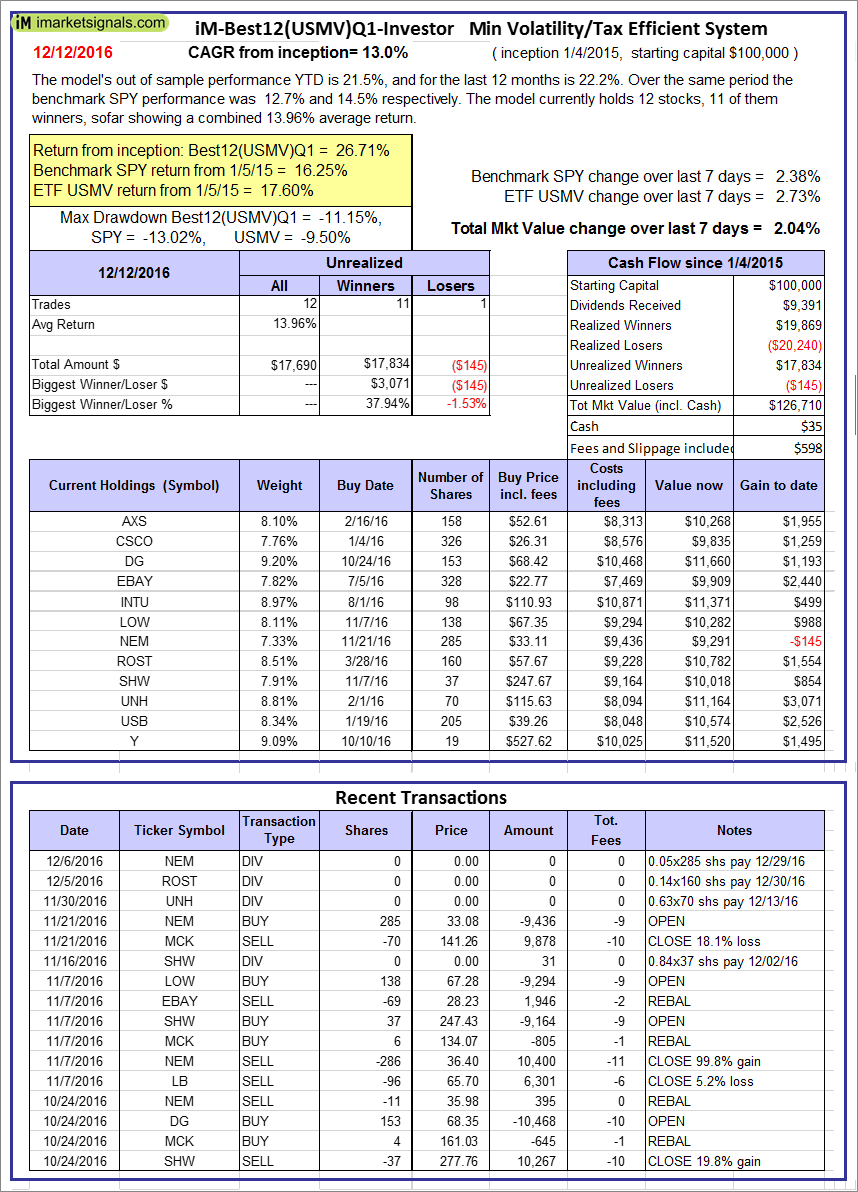 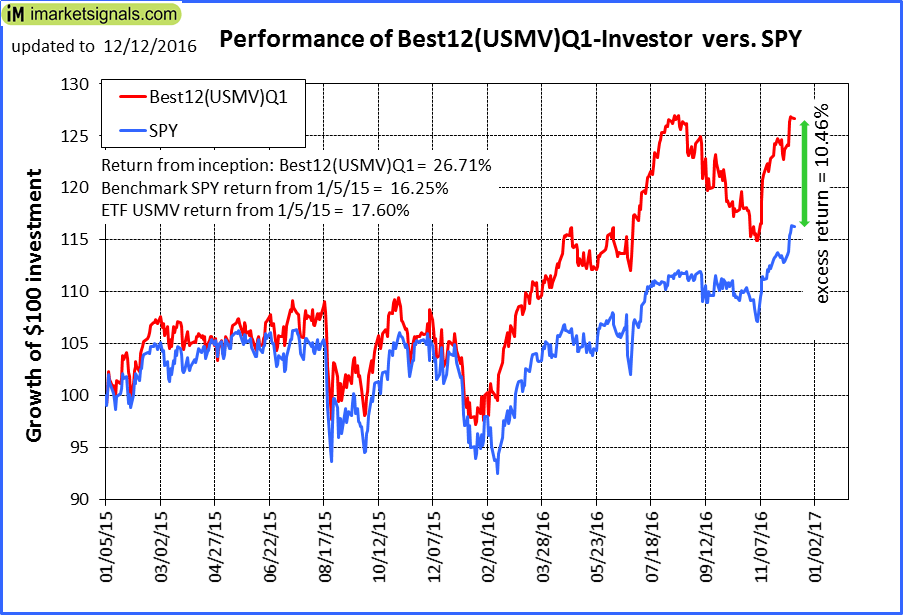 |
iM-Best12(USMV)Q1-Investor: The model’s out of sample performance YTD is 21.5%, and for the last 12 months is 22.2%. Over the same period the benchmark SPY performance was 12.7% and 14.5% respectively. Since inception, on 1/5/2015, the model gained 26.71% while the benchmark SPY gained 16.25% and the ETF USMV gained 17.60% over the same period. Over the previous week the market value of iM-Best12(USMV)Q1 gained 2.04% at a time when SPY gained 2.38%. A starting capital of $100,000 at inception on 1/5/2015 would have grown to $126,710 which includes $35 cash and excludes $598 spent on fees and slippage. |
 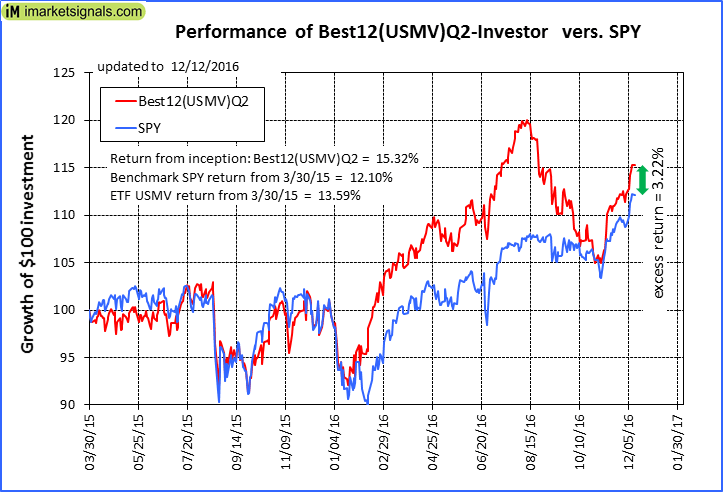 |
iM-Best12(USMV)Q2-Investor: The model’s out of sample performance YTD is 15.9%, and for the last 12 months is 17.4%. Over the same period the benchmark SPY performance was 12.7% and 14.5% respectively. Since inception, on 3/31/2015, the model gained 15.32% while the benchmark SPY gained 12.10% and the ETF USMV gained 13.59% over the same period. Over the previous week the market value of iM-Best12(USMV)Q2 gained 2.36% at a time when SPY gained 2.38%. A starting capital of $100,000 at inception on 3/31/2015 would have grown to $115,319 which includes $143 cash and excludes $515 spent on fees and slippage. |
 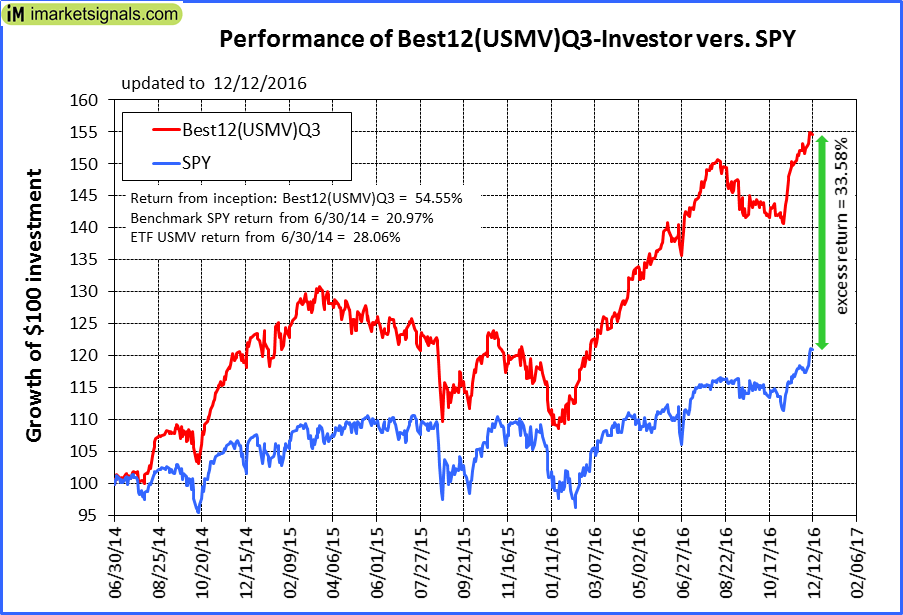 |
iM-Best12(USMV)Q3-Investor: The model’s out of sample performance YTD is 31.8%, and for the last 12 months is 32.7%. Over the same period the benchmark SPY performance was 12.7% and 14.5% respectively. Since inception, on 7/1/2014, the model gained 54.55% while the benchmark SPY gained 20.97% and the ETF USMV gained 28.06% over the same period. Over the previous week the market value of iM-Best12(USMV)Q3 gained 1.07% at a time when SPY gained 2.38%. A starting capital of $100,000 at inception on 7/1/2014 would have grown to $154,550 which includes -$180 cash and excludes $865 spent on fees and slippage. |
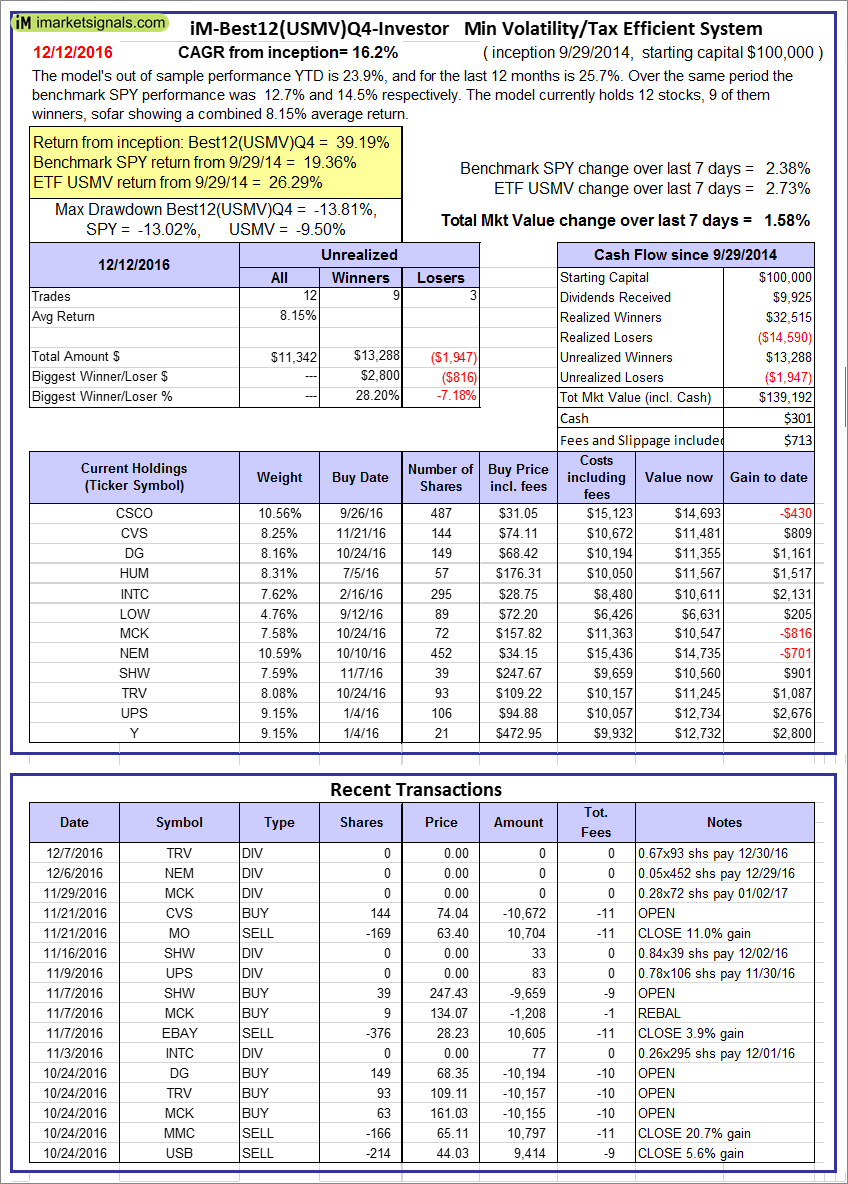 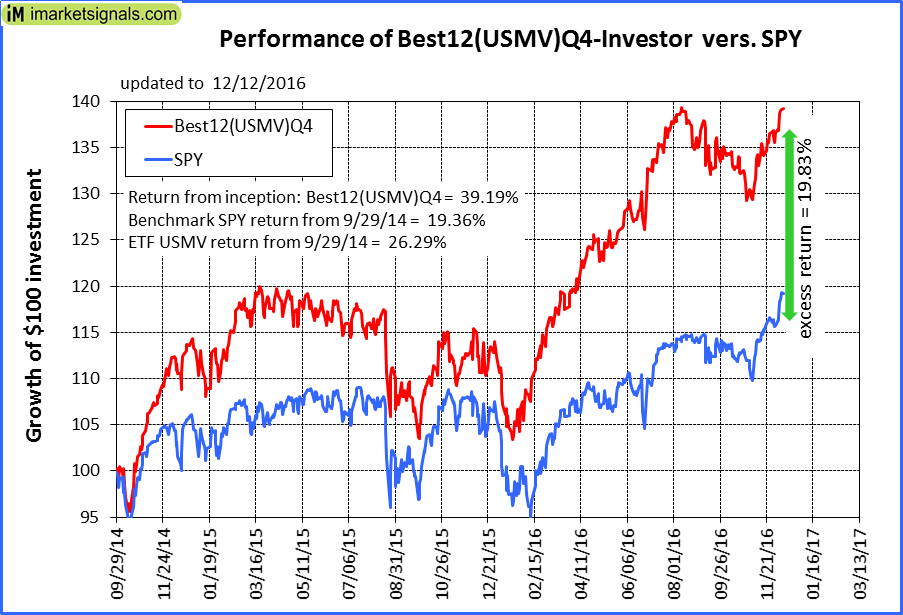 |
iM-Best12(USMV)Q4-Investor: Since inception, on 9/30/2014, the model gained 39.19% while the benchmark SPY gained 19.36% and the ETF USMV gained 26.29% over the same period. Over the previous week the market value of iM-Best12(USMV)Q4 gained 1.58% at a time when SPY gained 2.38%. A starting capital of $100,000 at inception on 9/30/2014 would have grown to $139,192 which includes $301 cash and excludes $713 spent on fees and slippage. |
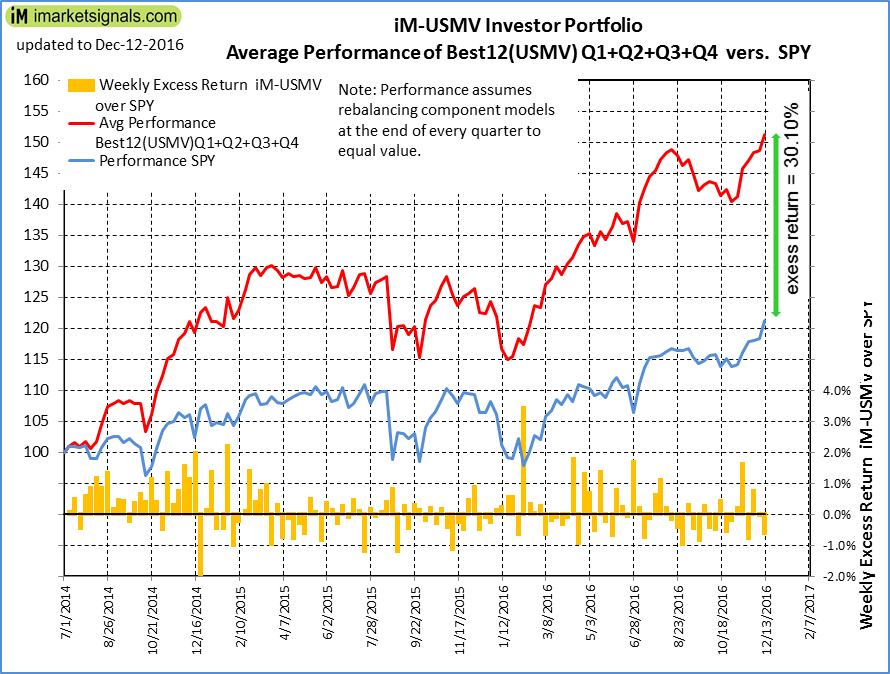 |
Average Performance of iM-Best12(USMV)Q1+Q2+Q3+Q4-Investor resulted in an excess return of 30.10% over SPY. (see iM-USMV Investor Portfolio) |
 |
iM-Best(Short): The model’s out of sample performance YTD is -9.1%, and for the last 12 months is -9.1%. Over the same period the benchmark SPY performance was 12.7% and 14.5% respectively. Over the previous week the market value of iM-Best(Short) gained -0.60% at a time when SPY gained 2.38%. Over the period 1/2/2009 to 12/12/2016 the starting capital of $100,000 would have grown to $95,202 which includes $113,880 cash and excludes $20,888 spent on fees and slippage. |
iM-Best Reports – 12/12/2016
Posted in pmp SPY-SH
Leave a Reply
You must be logged in to post a comment.