
Bond-market:
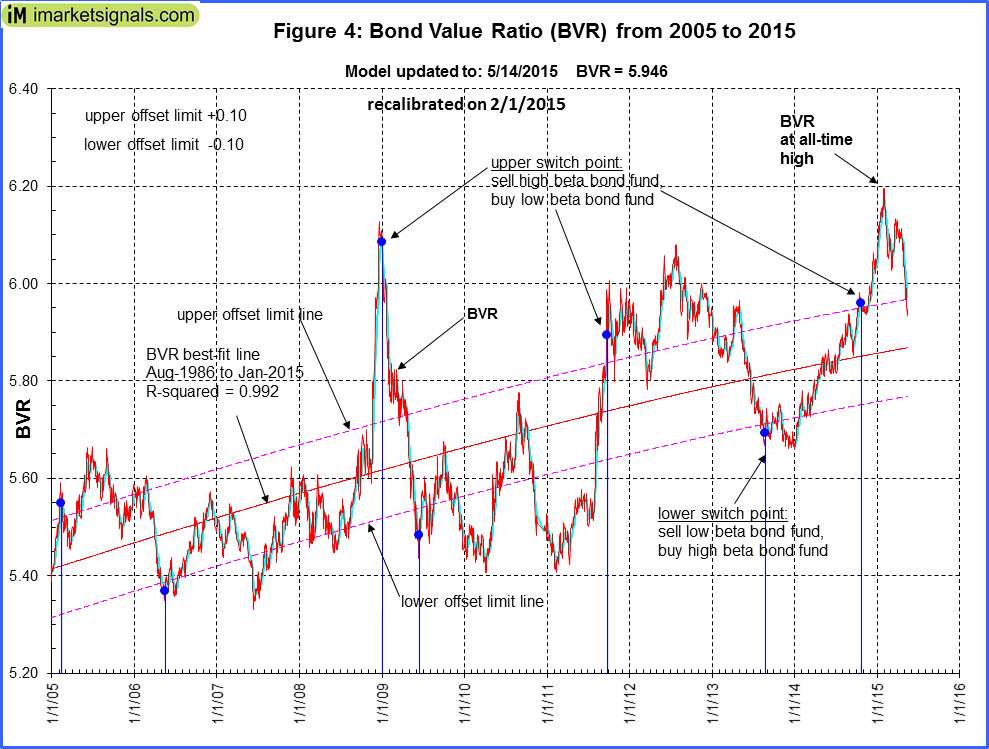
The BVR-model avoids high beta bonds (long-bonds) and also intermediate duration bonds.
The Bond Value Ratio is shown in Fig 4. The BVR is down from last week’s level. According to the model, only when BVR turns upward after having been lower than the lower offset-line should one consider long bonds again. The upward sloping graph indicates that long bonds have gained from January 2014 to end of January 2015. It would appear that BVR has peaked end of January 2015.
The Yield Curve:
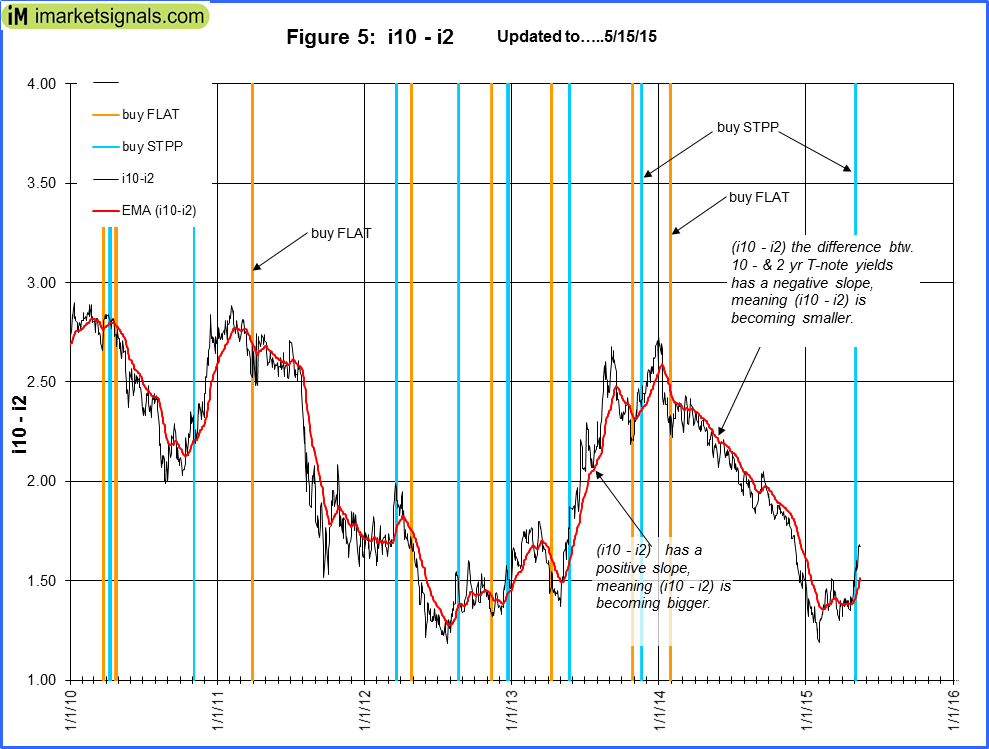 The yield curve model shows the declining trend from Jan-2014 of the 10-year and 2-year Treasuries yield spread. Figure 5 charts (i10 – i2)) and it would appear that the spread has formed a trough. FLAT and STPP are ETNs. STPP profits from a steepening yield curve and FLAT increases in value when the yield curve flattens. This model confirms the direction of the BVR.
Last week a buy STPP signal was generated.
Gold:
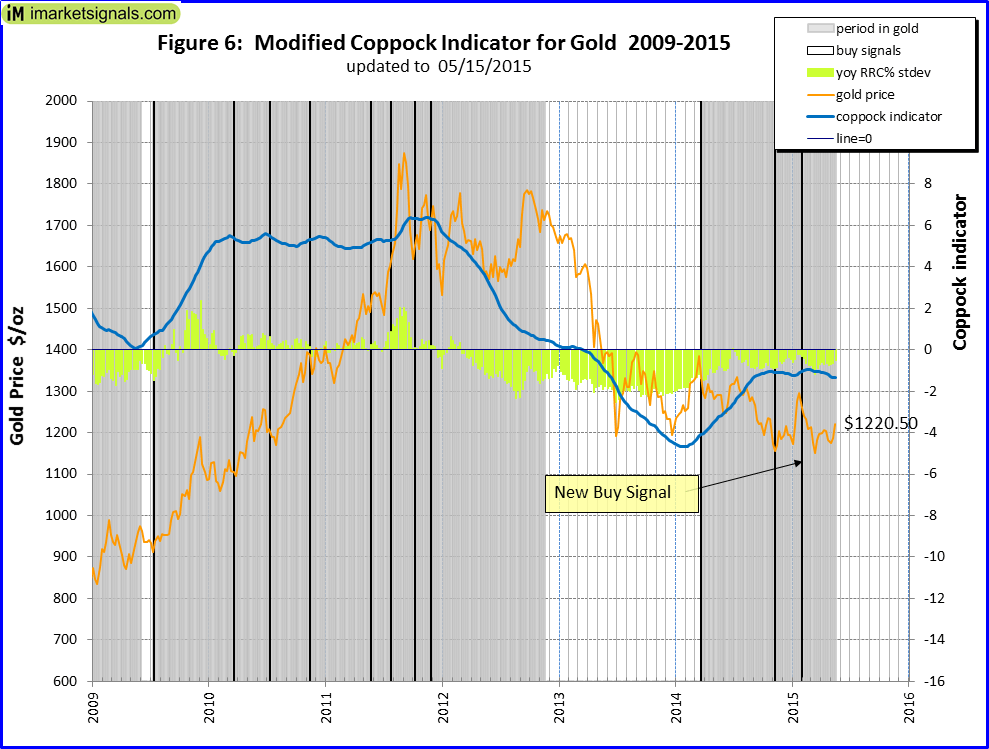 The modified Coppock Gold indicator shown in Fig 6. and is now invested.
This indicator is described in Is it Time to Buy Gold Again? – Wait for the buy signal …….
Silver:
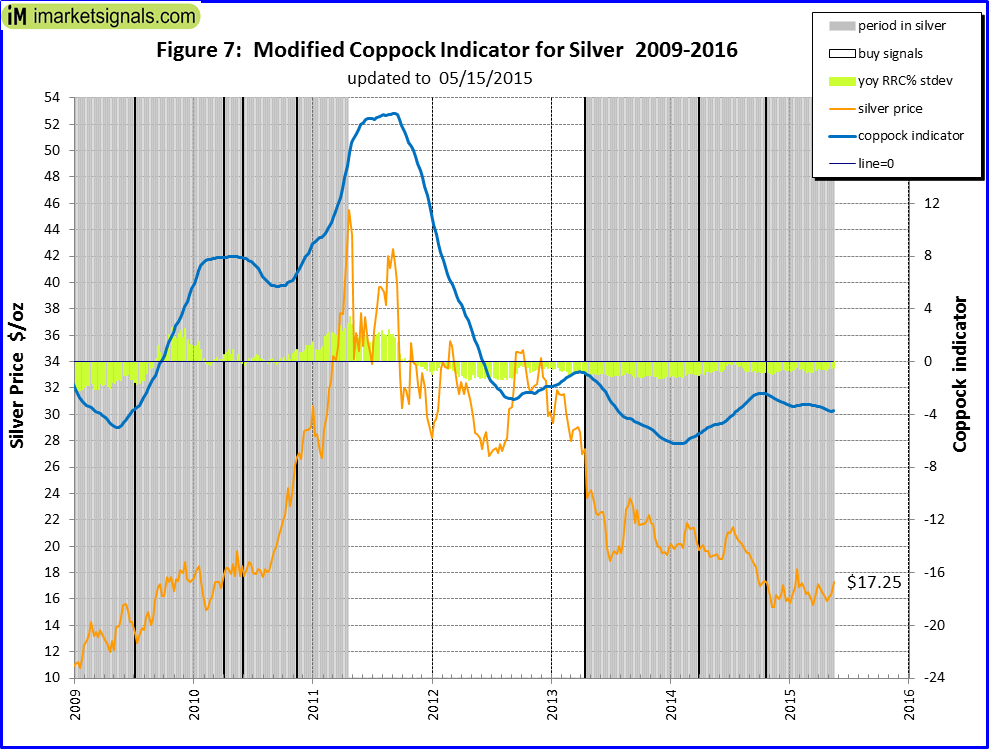 The modified Coppock Silver indicator shown in Fig 7 and is currently invested.
This indicator is described in Silver – Better Than Gold: A Modified Coppock Indicator for Silver.
Leave a Reply
You must be logged in to post a comment.