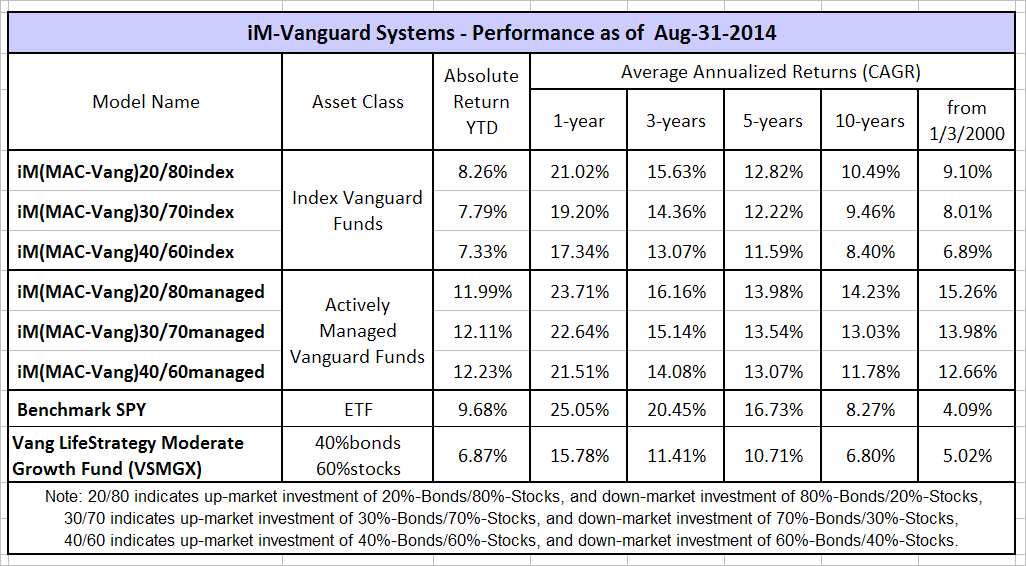
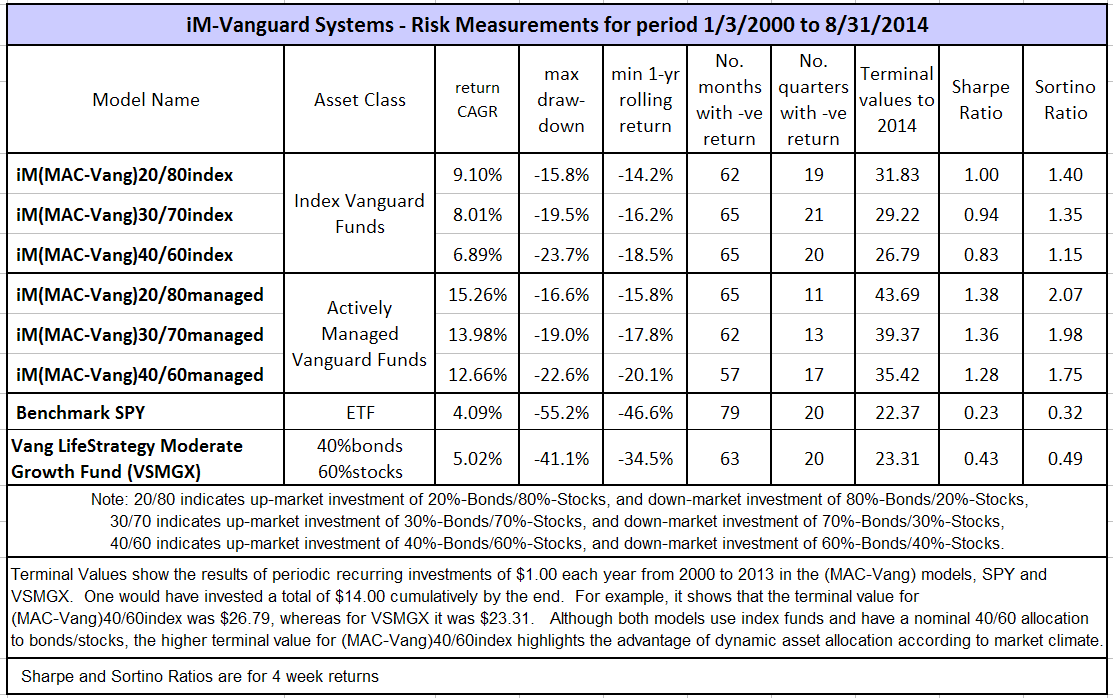
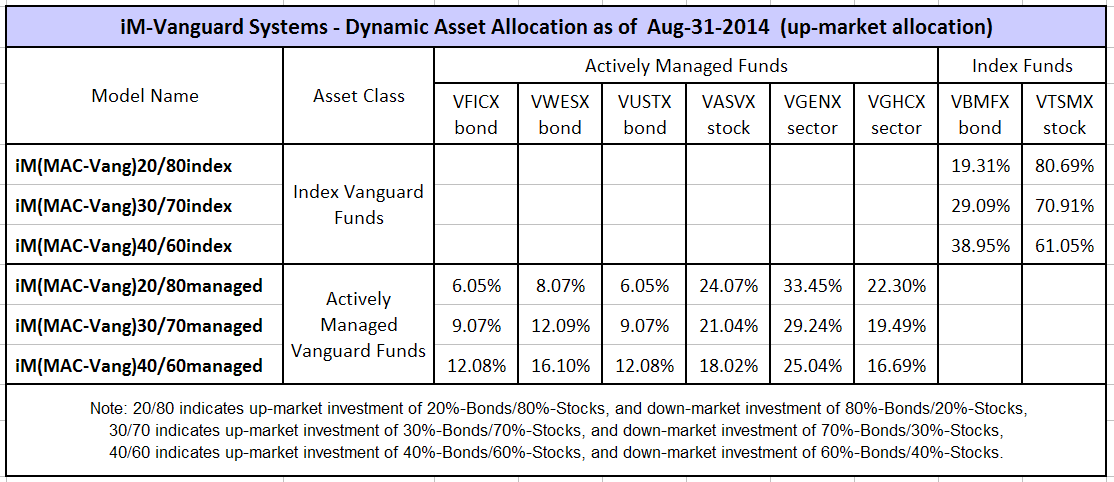
We have shown that high returns can be obtained from Vanguard funds with a dynamic asset allocation strategy. This article lists the performance and risk measures for six iM(MAC-Vang) models with various asset allocations which use a combination of Vanguard bond- and stock-funds, and switch assets according to stock-market climate.
Stock-market timing model
The dynamic asset allocation strategy requires some stock-market timing. During up-market periods more money is allocated to stock funds than bond funds, and during down-market periods more money is allocated to bond funds than stock funds.
The up- and down-market periods come from the MAC-US (backtested over 65 years), or alternatively the Best(MAC-UPRO) will provide nearly the same signal dates: up-market periods are indicated when the model is invested in UPRO. From 2000 to 2014 the models signaled only 5 down-market periods and 6 up-market periods, including the current up-market period.
Performance, risk measurements and asset allocation
In the tables below one can compare returns and risk measurements for six models using Vanguard index- and actively managed funds with different asset allocation percentages. It is apparent that the (MAC-Vang)20/80managed shows the best performance and has the lowest risk measurements.
If one wanted for convenience only use the two index funds, the Total Bond Market Index Fund (VBMFX) and the Total Stock Market Index Fund (VTSMX), then (MAC-Vang)20/80index would appear the best choice.
If one were uncertain whether the MAC-US will perform as well in the future as it did in the past, then one could consider the (MAC-Vang)40/60managed or the (MAC-Vang)40/60index models. They have a dynamic 40/60 bond/stock mix and their performance and risk measurements can be directly compared with those of the Vanguard LifeStrategy Fund VSMGX, which has a static 40/60 bond/stock mix.
Conclusion
Investors in Vanguard funds can achieve good returns with less risk by following a simple market timing strategy to decide on the asset allocation for their investment. A dynamic asset allocation strategy dependent on stock-market climate is the key to better returns.


Georg –
This is helpful to see the comparisons. I’d love to see the comparisons to all of the models, including COMP-IBH, BCI, regular MAC, Best3 etc. The returns for each of the years in the last 10 would be helpful as well. I always like to see how each strategy performs in years like 2008/2009 and the 2011. That adds another dimension to MaxDD and min 1-yr rolling return. It would be awesome if you could compile a chart of spreadsheet showing this.
Thanks,
Joel
Do u sent a rebalance alert in regards to the vanguard active 20/80 when conditions change thanx
The allocations for the Vanguard models are published every week on Friday and emails are sent to subscribers who ticked the box to receive the Friday email notification.
It would be nice to see the comparison at the end of August 2015, since the one shown above is more than a year old.
Thank you.
Please see my reply to the previous comment. The latest monthly performance can be viewed here but the allocation percentages are available to members with a bronze subscription.