
As the popularity of investing according to computerized algorithms increases, the question “When is it best to trade?” arises. Each investor has a different answers and opinion when it is best to trade. We approach this subject analytically to find a mathematical generated answer that is void of any emotions. We took two algorithmic trading models, both trading in highly liquid ETFs, and analyzed the return generated when traded at opening, closing and randomly between the day’s high and low prices. Our conclusion: there is no best time of day when to trade; it is model dependent and only by doing a statistical analysis can a recommendation for a particular model be made.
Method
A MS Excel workbook was set up to calculate the profit and loss of a model’s trading history using historic prices and dividends. All profits and dividends were reinvested. The worksheet has the limitation that only one ETF can be held at any time. The performance of the model was calculated when:
- Trading at opening price,
- trading at closing price,
- buying at opening and selling at closing price,
- selling at closing and buying at opening price,
- trading at a random price between the days’ high and low. This was repeated 2000 times to obtain data for near life like trading, which can be statistically analyzed.
Contrary to web based trading simulations that include a fixed percentage slippage from the day’s closing price, no slippage was applied to the trades. However, for each transaction a $10 fee was included.
Analyzing a Low Turnover ETF Switcher
On a web-based trading simulation platform we developed a model, Best(SPY-TLT), that switches between SPY (SPDR® S&P 500® ETF) and TLT (iShares 20 Plus Year Treasury Bond ETF) depending on market direction.
The market timing rules use volatility, risk premium, earnings estimates together with moving average cross-overs and includes the following parameters:
- Daily close of CBOE Volatility Index – VIX,
- weekly estimate S&P500 Risk Premium – which is the difference between the Current Estimated Earnings Yield of the S&P500 and the Treasury 10-yr Note Yield,
- weekly evaluation of the Current Year Earnings Per Share Estimate of the S&P500,
- and the daily closing price of SPY adjusted for dividends.
This model algorithm generates over weekends a recommended trade to be executed on Mondays. In the fourteen years (Jan 2000 to Dec 2013) the simulation resulted in 63 completed trades, i.e. an average of 9 transactions each year, which approximates to an average annual portfolio turnover of 450%. The results of our investigation are listed in Table 1 and shown graphically in Figure 1.
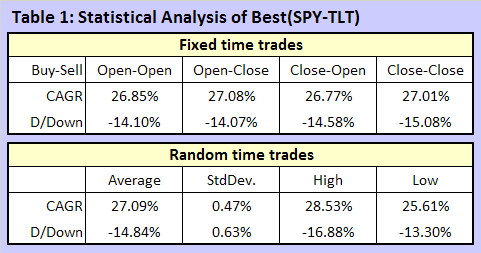
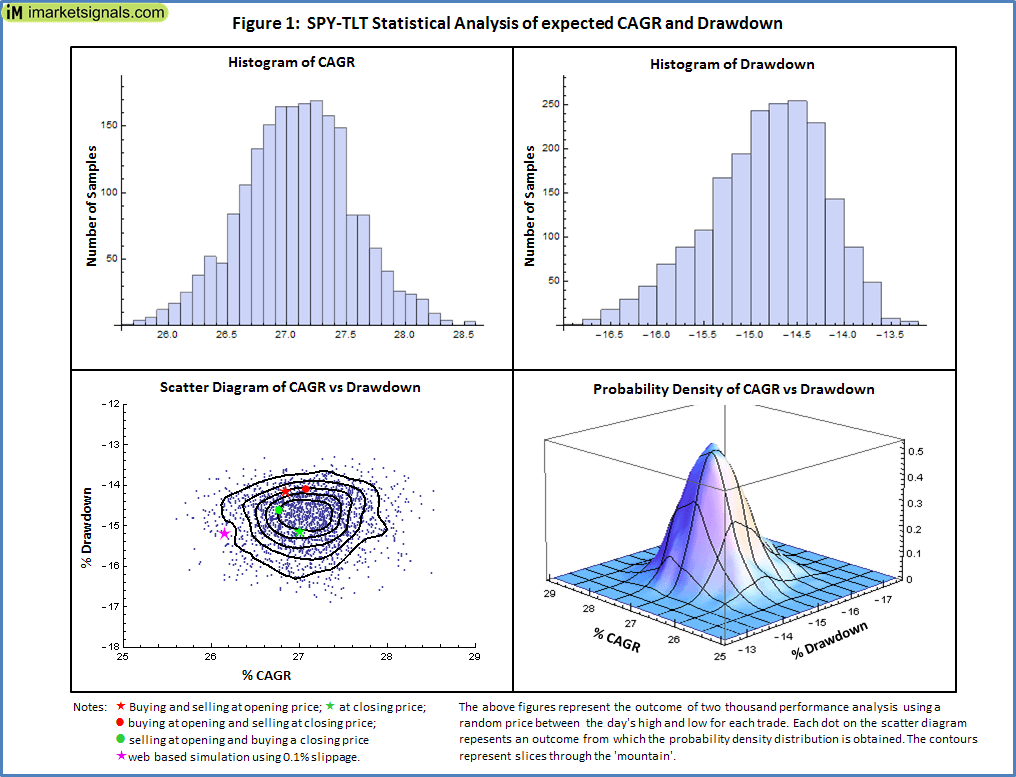
In Figure 1 the resulting compounded average annual growth rate (CAGR) and maximum drawdown of two thousand simulated trades are shown in the two histograms. The analysis is enhanced with a scatter diagram of CAGR vs. drawdown in a form of a scatter plot (one point for each simulation run) and the evaluation of it to give a smoothed probability density in a 3D view. The scatter diagram indicates a small variance in CAGR and drawdown and the investor is given a very good idea of what to expect from the model according to his trading practice.
What happens if we add some volatility to this model by replacing SPY with SSO (ProShares Ultra two times daily S&P500 ETF)? The results are listed in Table 2 and shown graphically in Figure 2.
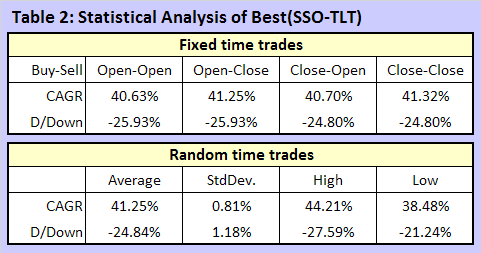
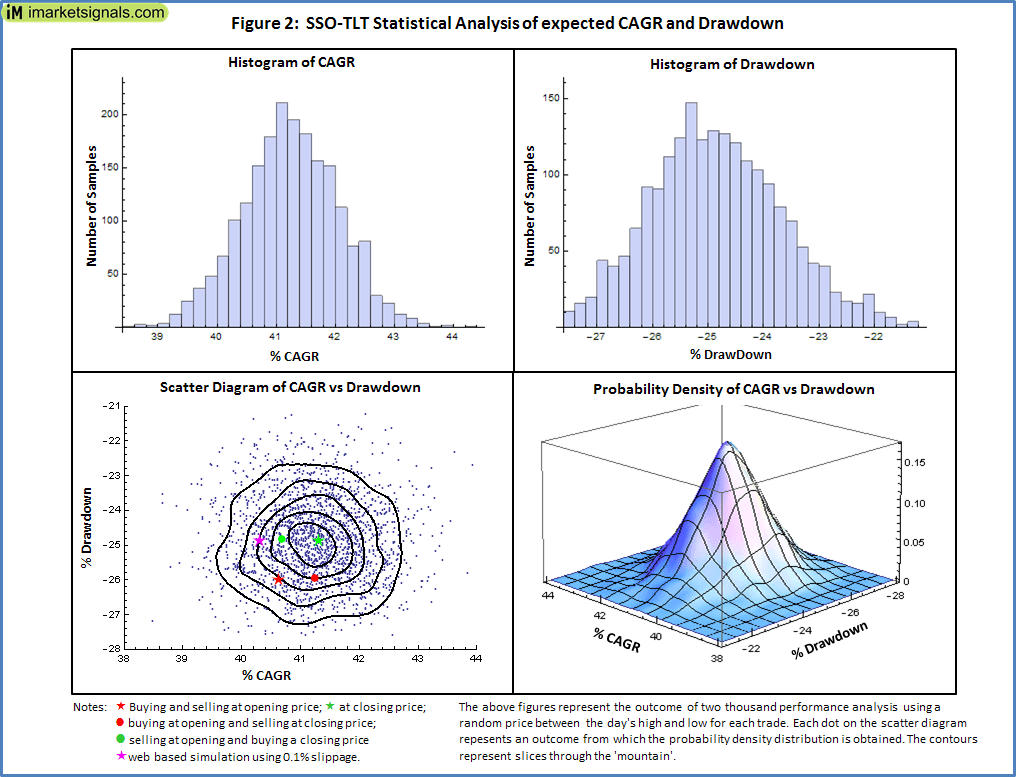
As expected the variance in CAGR and drawdown increases with the added volatility. (When comparing the probability distribution please note that the ‘mountain’ in the latter case is rather flat when compared to the first case, note the vertical scales)
Conclusion.
There is no conclusive answer to the question “Is there a best time to trade?” However, it would be wise to follow closely the declared price (open or close) the model uses for its simulated performance calculation.
How would the variance in performance be effected by the number of holdings, stock type, and turnover of trading model? More sophisticated methods than spreadsheet applications are needed to analyze this, and could be answered if web trading platforms perform a study similar to the above presentation. Not only will it give an investor a better idea what to expect from the model, it will also give a further criterion for evaluating it.
Footnote
The low turnover ETF switcher is described in iM-Best(SSO-TLT) Switching System. Furthermore, you can download the MS Excel Workbook.
Getting an open price is “easy”, but how do you assure getting a closing price? Issuing trade orders at precisely x seconds before the close? I assume that the trades and history in Best 8 use open, open. Is that correct?
Thanks. I appreciate your work and information.
Bill
Best8+ uses next open price for its trades.