
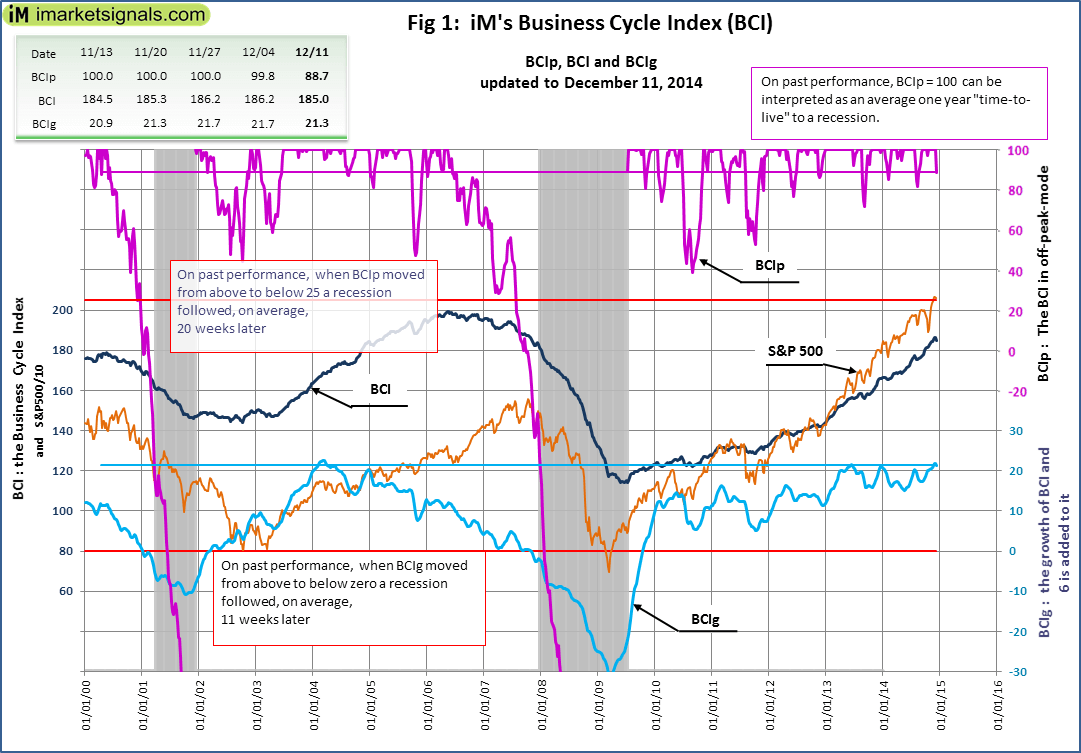
Knowing when the U.S. Economy is heading for recession is paramount for successful investment decisions. Our weekly Business Cycle Index (BCI) would have provided early reliably warnings for the past seven recessions. The BCI at 185.0 is down from last week’s downwards revised 186.2. No recession is signaled by both the derived indicators; BCIg, expressed to one decimal place at 21.3 is down from last week’s 21.7, and BCIp at 88.7 indicates that, for this business cycle, BCI is slightly down from it’s previous peak.
The downturn of BCI is mainly explained by the sharp rise (+142,000) in the continued claims of the insured unemployed.
Figure 1 plots BCIp, BCI, BCIg and the S&P500 together with the thresholds (red lines) that need to be crossed to be able to call a recession.
The BCI uses the below listed economic data, and combining the components for the index in “real time”, i.e. the data is only incorporated into the index at its publication date :
- 10-year treasury yield (daily)
- 3-month treasury bill yield (daily)
- S&P500 (daily)
- Continues Claims Seasonally Adjusted (weekly)
- All Employees: Total Private Industries (monthly)
- New houses for sale (monthly)
- New houses sold (monthly)
The 6-month smoothed annualized growth rate of series is a well-established method to extract an indicator from the series. We use this method to obtain BCIg, i.e. the calculated growth rate with 6.0 added to it, which generates, on past performance, an average 11 week leading recession signal when BCIg falls below zero. Further, the index BCI retreats from its cyclic peak prior to a recession in a well-defined manner allowing the extraction of the alternate indicator BCIp (and its variant BCIw) from which, on average, 20 week leading recession signal is generated when BCIp falls below 25. More details can be found here (BCI and BCIg), here (BCIp) and here (BCIw).
Figure 2 plots the history of BCI, BCIg, and the LOG(S&P500) since July 1967, and Figure 3 plots the history of BCIp, i.e 44 years of history which include seven recessions, each which the BCIg and BCIp managed to indicate timely, the weeks lead to recessions are indicated on the plots.

