Summary:
The IBH stock market model is out of the market. The MAC stock market model is invested, the bond market model avoids high beta (long) bonds and intermediate duration bonds as well, the yield curve is trending steeper, and gold and silver models are not invested. The recession indicator COMP is almost unchanged from last week’s level.
Stock-market:
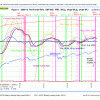 The IBH-model is out of the market as shown in Fig. 1.
A sell signal was generated two weeks ago when the WLIg_shortEMA moved below the WLIg_longEMA. The WLI has lately not been very stable which is the reason for the frequent buy and sell signals since 2009. One of the WLI component , M2, seems to impair the WLI, as discussed in Why is M2 Still a Component of ECRI’s WLI?.
A sell signal was generated last week when the WLIg_shortEMA moved below the WLIg_longEMA. The WLI has lately not been very stable which is the reason for the frequent buy and sell signals since 2009.
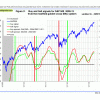
MAC Fig 2 shows the spreads of the moving averages, both being at approximately the same level as last week, but they may be in the process of forming a top. The sell spread (red graph) has to move below the zero line for a sell signal.
Bond-market:
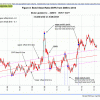 The BVR-model avoids high beta bonds (long-bonds) and also intermediate duration bonds.
The Bond Value Ratio is shown in Fig 3. The BVR is at about the same level as last week, but the trend is downwards. In the longer term BVR will reach the long-term trendline and long-bond investors will have suffered considerable losses by then. This model was recently recalibrated to take the latest few months of data into account when calculating the best fit line. The upper and lower offset limit lines have been adjusted as well,
The Yield Curve:
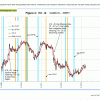 The yield curve model shows the steepening trend, but seems to be making an interim mini-top.
Figure 4 charts (i10 – i2). The trend is up now as one can see. FLAT and STPP are ETNs. STPP profits from a steepening yield curve and FLAT increases in value when the yield curve flattens. This model confirms the direction of the BVR.
Recession:
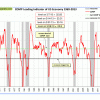 In Fig 5 one can see that COMP is more or less at the same level as last week. It is still far away from signaling recession.
Comp can be used for stock market exit timing as discussed in this articleThe Use of Recession Indicators in Stock Market Timing.
Gold:
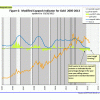 There is no buy-signal from the modified Coppock Gold indicator shown in Fig 6.
This model has been out of Gold since Nov-26-2012. Gold would have to make a sustained move to $1700 and higher over the next few weeks for a buy signal according to my projections. This indicator is described inIs it Time to Buy Gold Again? – Wait for the buy signal …….
Silver:
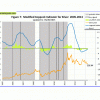 There is no buy-signal from the modified Coppock Silver indicator shown in Fig 7.
This model has been out of Silver since Apr-25-2011. This indicator is described inSilver – Better Than Gold: A Modified Coppock Indicator for Silver

Leave a Reply
You must be logged in to post a comment.