Australian employers must pay at least 9% of workers’ annual salary into their superannuation accounts. Because the Government wants people to save for their retirement, they provide tax breaks and other incentives to help grow super savings over time. There is a wide choice of funds available, but most people seem to select, and stay, in a balanced multi-sector fund. A better way to allocate one’s savings and maximize returns is to use the signals from MAC-Australia, with buy signals triggering shifts from fixed interest investments to equity funds, and sell signals triggering shifts back to safer, interest producing bond funds. It’s that simple.
My original MAC system, a model for automatic asset allocation (described in Beyond the Ultimate Death Cross), is based on cross-overs of moving averages of the S&P 500 index. I have modified this model using the Australian All Ordinary Index (AAOI) instead of the S&P 500 index, and selected appropriate parameters to maximize returns for this model. This was done by calculating the probabilities for market gains and losses following MAC signals using likelihood ratios.
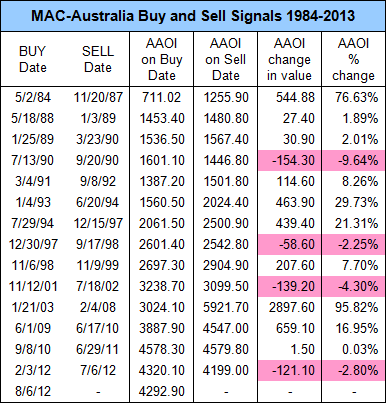
There were 15 buy signals from 1984 to 2013; they are listed in appendix A together with 14 corresponding sell signals.
The results are impressive. Starting in 1984, an asset allocation strategy based on the MAC-system provided historical investment results 2.0 times higher and less risky than a buy-and-hold (B&H) investment in an Australia All Ordinaries (AAOI) index fund, all with dividends reinvested. The compound average annual growth rate (CAGR) was 13.94% for the MAC system versus 11.24% for buy-and-hold of the AAOI index fund.
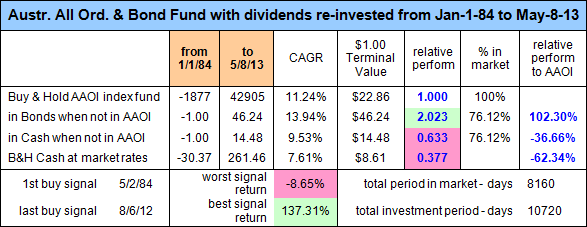
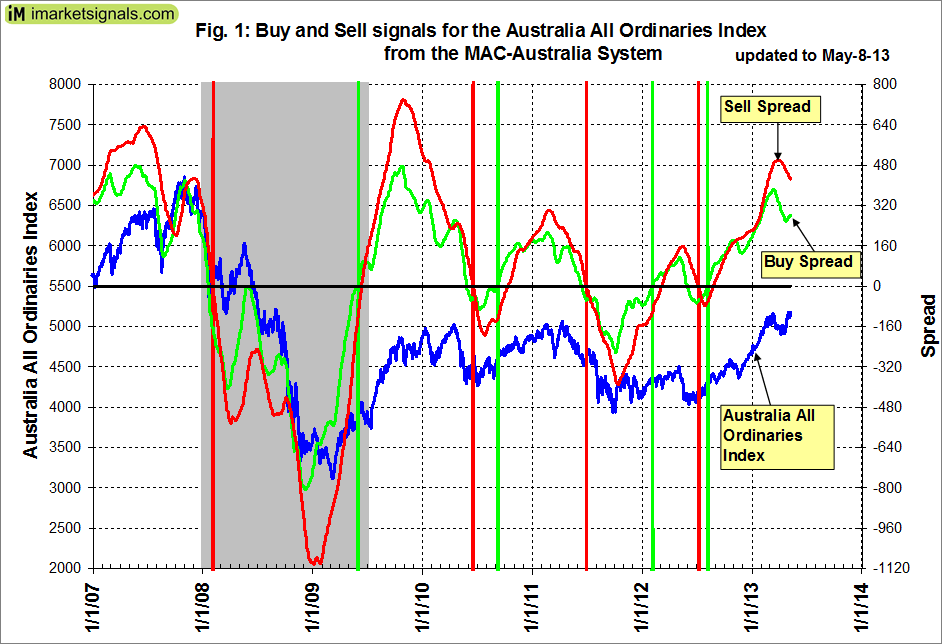
Figure 1 shows the AAOI from 2007 onwards with the buy- and sell-spreads of the moving averages, the green and red graphs respectively. A buy signal is generated when the green graph moves from below to above zero, and a sell signal occurs when the red graph moves from above to below zero. Since the last buy signal on August 6, 2012 the AAOI has gained 20.6% to May 8, 2013. A sell signal will only emerge when the red sell spread graph moves below zero again.
I did not find sufficiently long-time data for an Australian index fund. For my financial analysis I used the historic daily data of the AAOI from 1984 onwards and constructed a hypothetical stock index fund that closely matched the published annualized total returns after management costs of the Vanguard Australian Shares Index Fund.
For the interest producing investment I used the 10-year Australian government bond yields and derived an index fund from them whose returns closely matched the total returns after management costs of the Vanguard Australian Fixed Interest Index Fund.
Investment results for Superannuation funds
I used AustralianSuper funds for which daily rates are available on the fund manager’s website from July 2008 onwards from which one can calculate daily values. This period starts in the great recession and one can see from inspecting the fund manager’s data that all the funds, except fixed interest funds, lost value initially. The MAC-Australia model exited the stock market on Feb-4-2008 and signaled an investment in fixed interest funds then until the buy signal for equity funds appeared again on Jun-1-2009. Thus, on Jul-1-2008 the model was invested in the fixed interest fund.
The following AustralianSuper funds were used for this analysis, and their compound average annual growth rates (CAGR) from July 2008 to May 2013 are shown in the table below:
- Balanced (60% Equity, 12% Fixed Interest, 28% Other – Assets approx. $34,000M)
- Australian Fixed Interest (100% Domestic Fixed Interest – Assets $573M)
- Australian Sustainable Shares (100% Domestic Equity – Assets $328M)
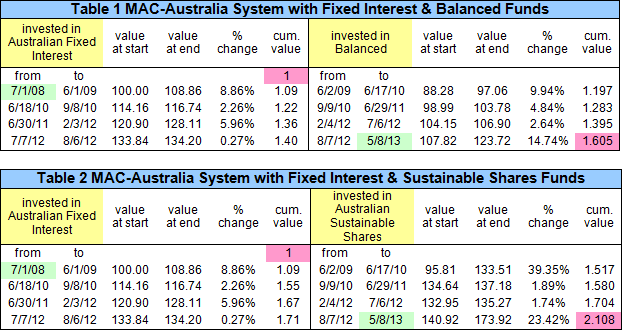
Also shown in the last two rows of the table are the returns obtained when using the MAC system of switching between fixed interest and equity funds.

One can see the significant improvement of returns when the MAC system of investing is applied. Table 1 and 2 lists the MAC investment periods for equity or fixed interest exposure for paired Fixed-Interest/Balanced, and Fixed-Interest/Australian-Sustainable-Shares funds. As one can see there was never a loss for any investment period of any combination during the last 5 years, although the start date of the investment was during the great recession. See Appendix B for financial-year and trailing-year returns.
Conclusion
A Morningstar-Australia listing shows that the 10 largest funds are all multi-sector funds with net assets ranging from $34B to $6B, with the AustralianSuper Balanced fund being the largest. It is evident from the large assets of these funds relative to the much smaller assets of specific sector funds, that most savers allocate their retirement savings to multi-sector funds.
For example, the AustralianSuper Balanced fund is the default option if no selection is made by the saver. This fund only produced an average annual of 4.50% return over the last 5 years. By pairing this fund with the Australian Fixed Interest fund and applying the MAC system one would have increased this return to 10.24%, and at the same time reduced one’s risk exposure, evidenced by the Sharpe ratios in the table showing the financial-year returns in Appendix B.
Similarly, pairing the Australian Sustainable Shares fund with the Australian Fixed Interest fund and applying the MAC system would have provided an average annual of 16.61% return over the last 5 years, instead of the lower 12.44% return for a continuous investment in the share fund, also with less investment risk.
The MAC-Australia model is published on our website and is updated weekly. Access to our site is currently free. At this time the model signals an exposure to equities, but the moving average spreads seem to have peaked, possibly forecasting a declining market. Investors can periodically check this model to see whether it has signaled a move from equities to fixed interest investments. However, past performance is not an indication of future performance. The model’s buy signals may result in losses, as they have during four previous equity exposure periods.
Appendix A
Appendix B
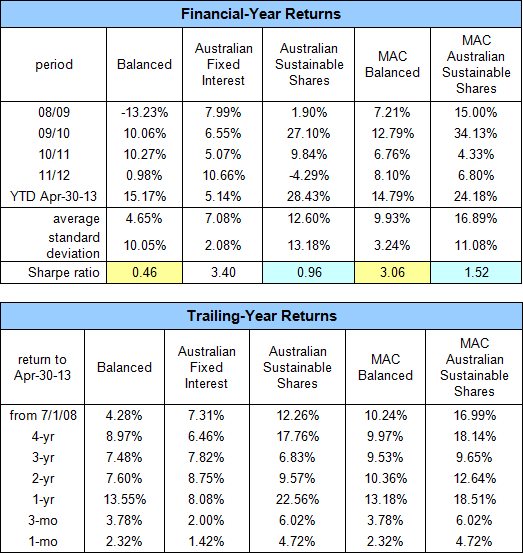
Returns for period longer than 1 year are annualized. Returns are to April-30-2013 to coincide with current Morningside’s published returns.

Thank you, I learn a lot when I read this site
Great work – love reading it
Very good. Thanks.
You should introduce to http://www.thebull.com.au for more Australian readers.
Thanks for the suggestion, will do