
  |
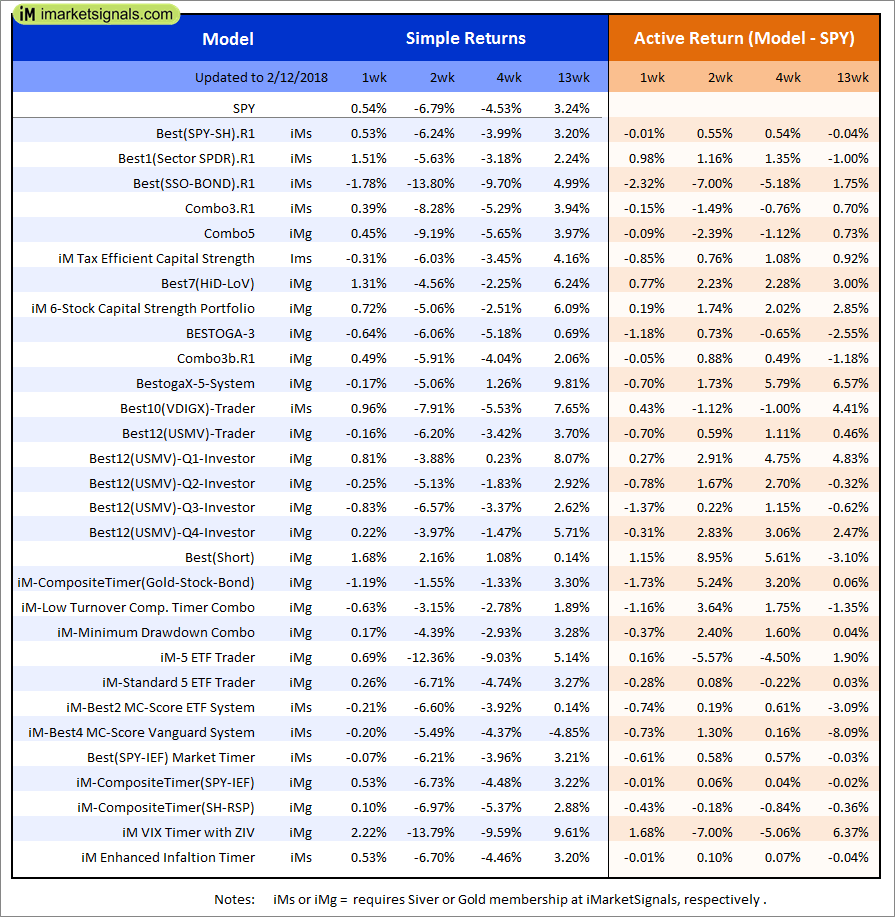
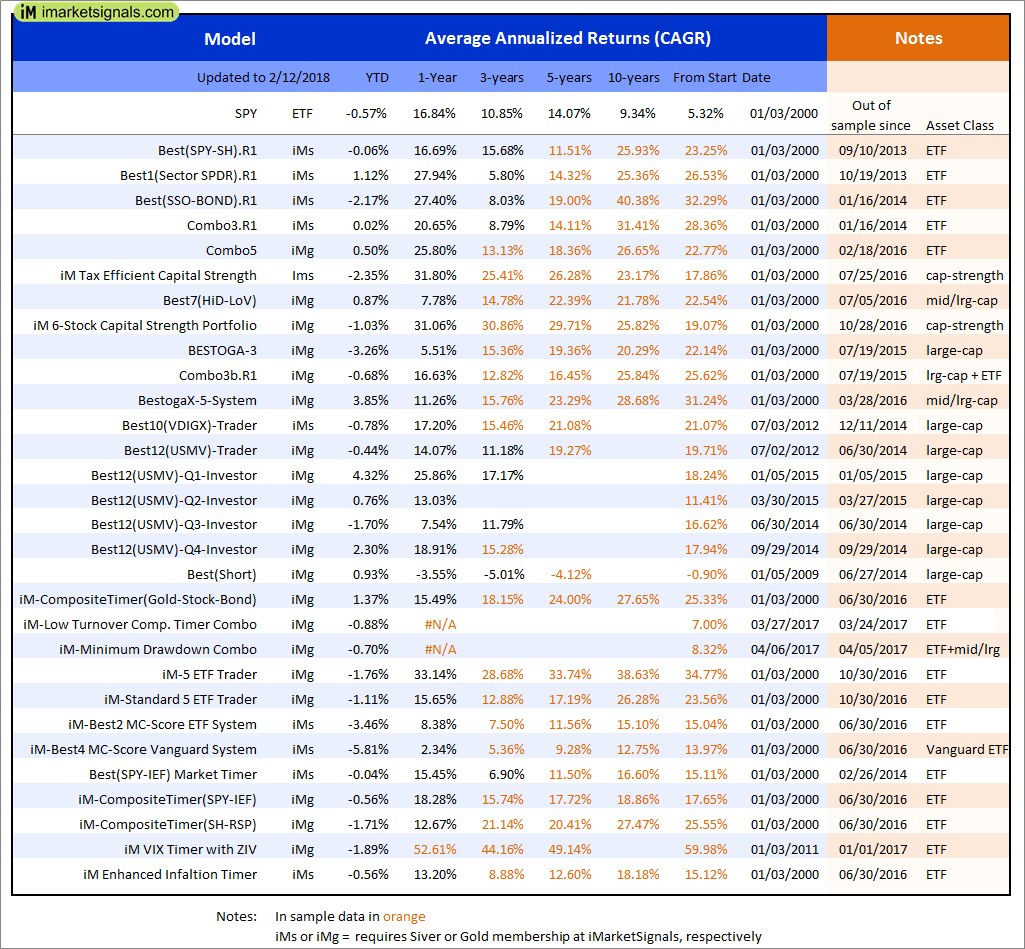
Out of sample performance summary of our models for the past 1, 2, 4 and 13 week periods. The active active return indicates how the models over- or underperformed the benchmark ETF SPY. Also the YTD, and the 1-, 3-, 5- and 10-year annualized returns are shown in the second table |
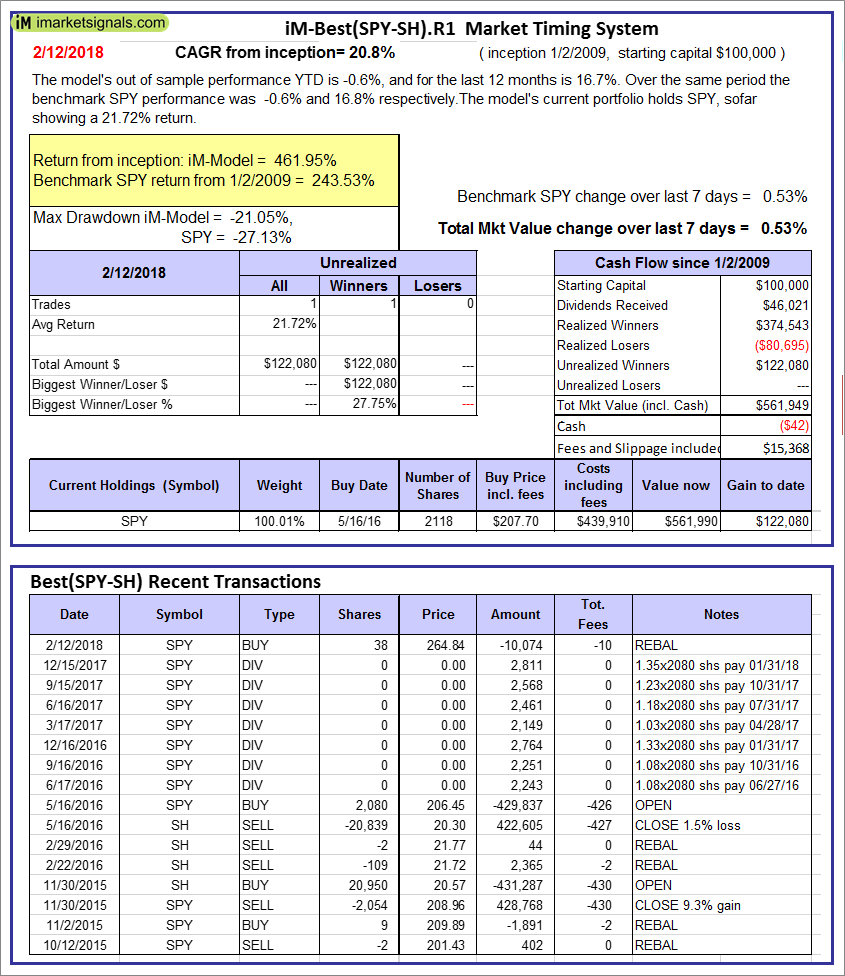 |
iM-Best(SPY-SH).R1: The model’s out of sample performance YTD is -0.6%, and for the last 12 months is 16.7%. Over the same period the benchmark SPY performance was -0.6% and 16.8% respectively. Over the previous week the market value of Best(SPY-SH) gained 0.53% at a time when SPY gained 0.53%. A starting capital of $100,000 at inception on 1/2/2009 would have grown to $561,949 which includes -$42 cash and excludes $15,368 spent on fees and slippage. |
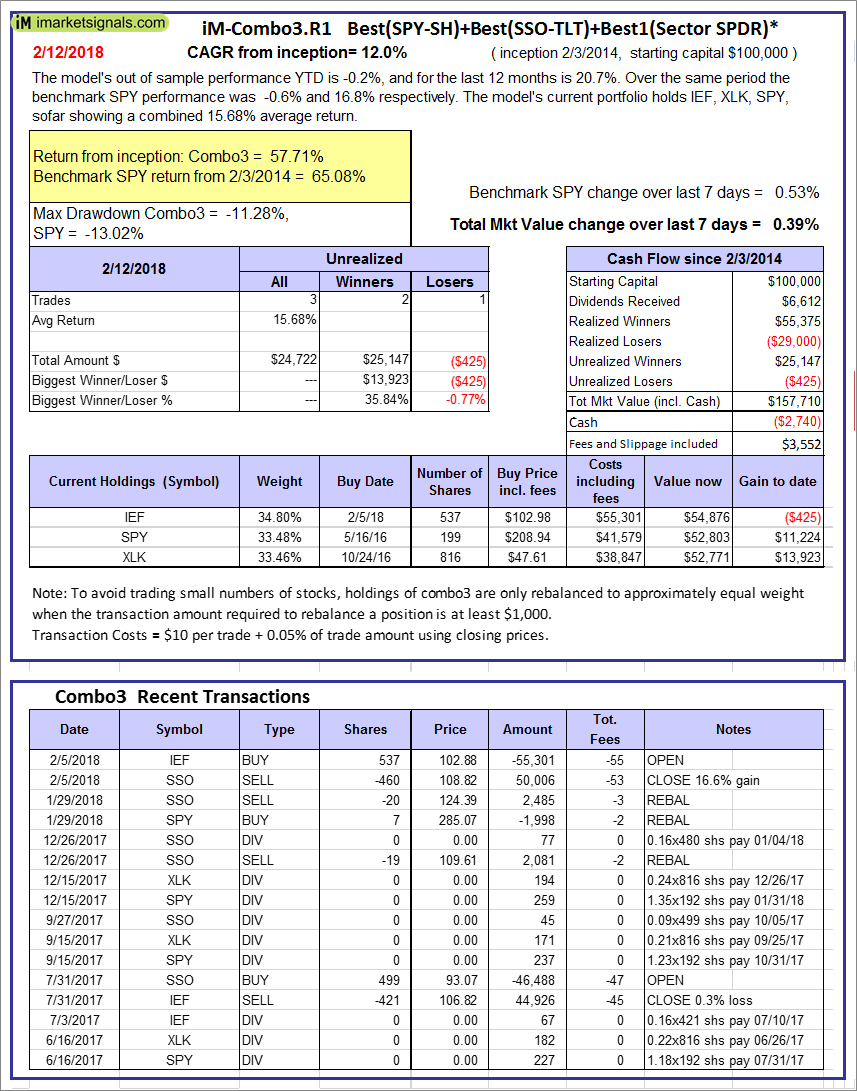 |
iM-Combo3.R1: The model’s out of sample performance YTD is -0.2%, and for the last 12 months is 20.7%. Over the same period the benchmark SPY performance was -0.6% and 16.8% respectively. Over the previous week the market value of iM-Combo3.R1 gained 0.39% at a time when SPY gained 0.53%. A starting capital of $100,000 at inception on 2/3/2014 would have grown to $157,710 which includes -$2,740 cash and excludes $3,552 spent on fees and slippage. |
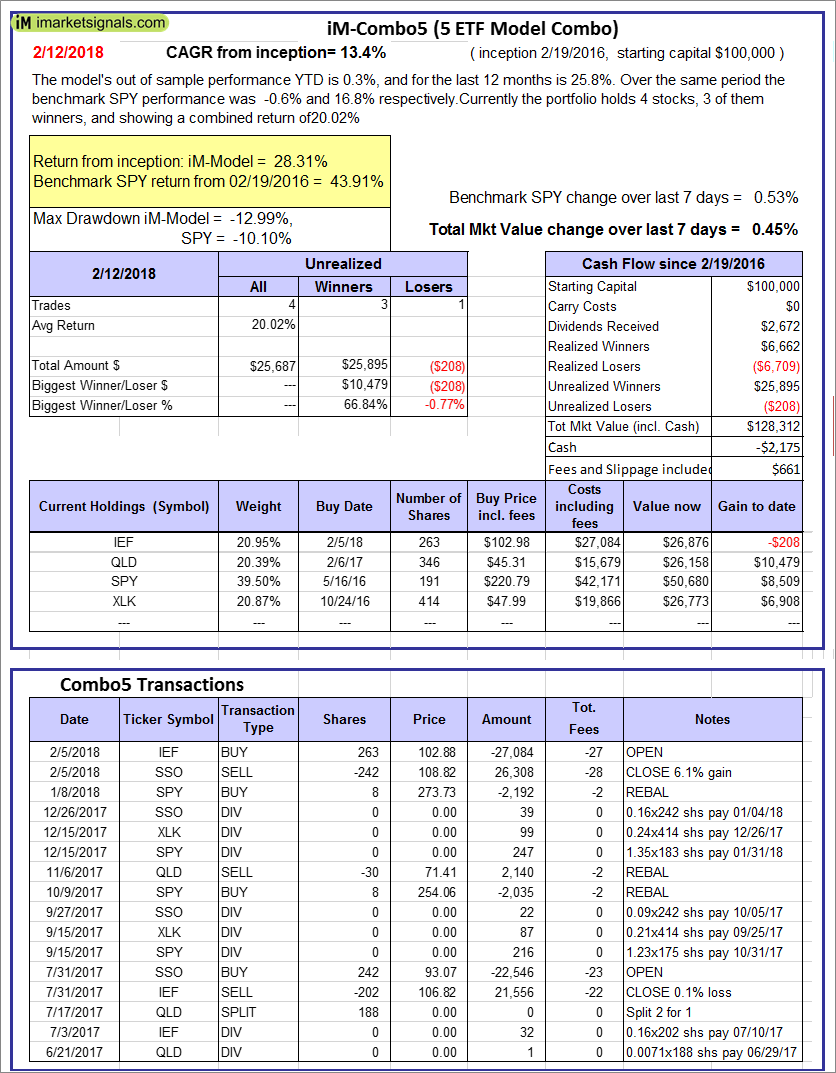 |
iM-Combo5: The model’s out of sample performance YTD is 0.3%, and for the last 12 months is 25.8%. Over the same period the benchmark SPY performance was -0.6% and 16.8% respectively. Over the previous week the market value of iM-Combo5 gained 0.45% at a time when SPY gained 0.53%. A starting capital of $100,000 at inception on 2/22/2016 would have grown to $128,312 which includes -$2,175 cash and excludes $661 spent on fees and slippage. |
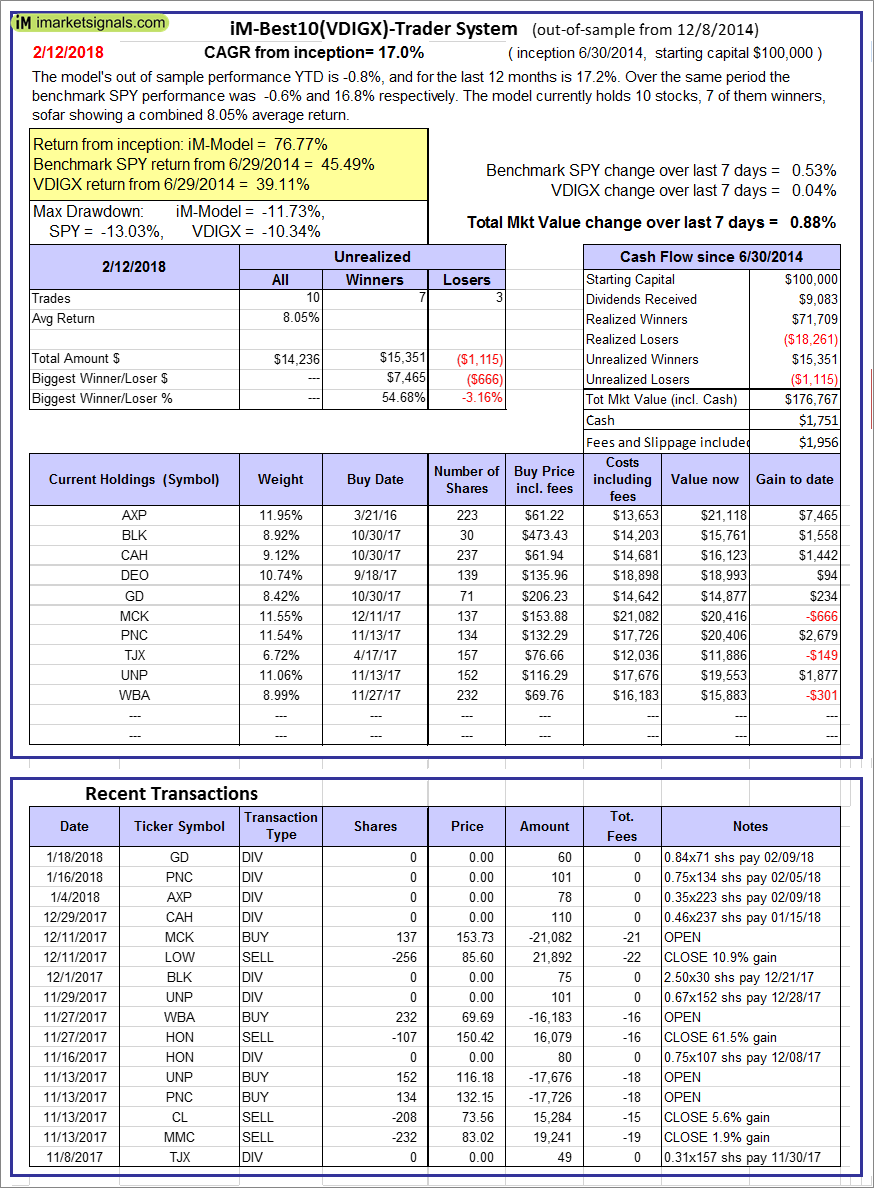  |
iM-Best10(VDIGX)-Trader: The model’s out of sample performance YTD is -0.8%, and for the last 12 months is 17.2%. Over the same period the benchmark SPY performance was -0.6% and 16.8% respectively. Since inception, on 7/1/2014, the model gained 76.77% while the benchmark SPY gained 45.49% and VDIGX gained 39.11% over the same period. Over the previous week the market value of iM-Best10(VDIGX) gained 0.88% at a time when SPY gained 0.53%. A starting capital of $100,000 at inception on 7/1/2014 would have grown to $176,767 which includes $1,751 cash and excludes $1,956 spent on fees and slippage. |
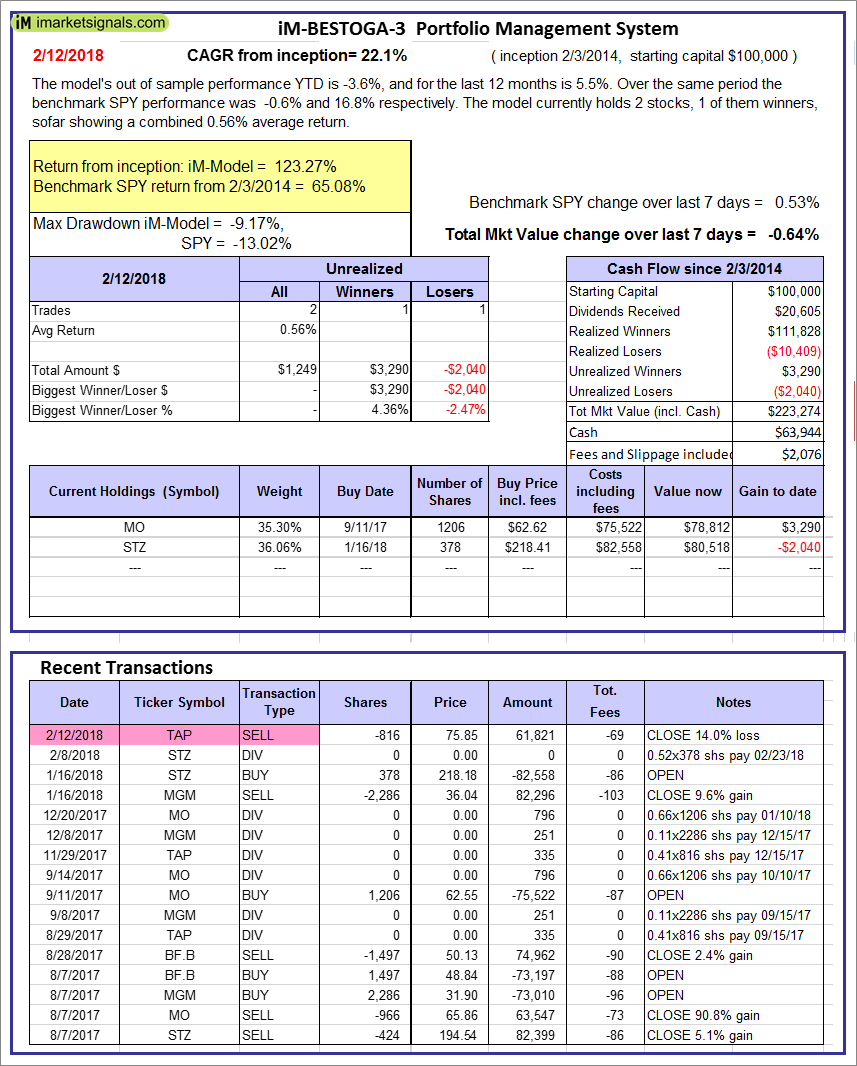 |
iM-BESTOGA-3: The model’s out of sample performance YTD is -3.6%, and for the last 12 months is 5.5%. Over the same period the benchmark SPY performance was -0.6% and 16.8% respectively. Over the previous week the market value of iM-BESTOGA-3 gained -0.64% at a time when SPY gained 0.53%. A starting capital of $100,000 at inception on 2/3/2014 would have grown to $223,274 which includes $63,944 cash and excludes $2,076 spent on fees and slippage. |
 |
iM-Best7(HiD-LoV): The model’s out of sample performance YTD is 0.1%, and for the last 12 months is 7.8%. Over the same period the benchmark SPY performance was -0.6% and 16.8% respectively. Over the previous week the market value of iM-BESTOGA-3 gained 1.31% at a time when SPY gained 0.53%. A starting capital of $100,000 at inception on 6/30/2016 would have grown to $113,471 which includes $153 cash and excludes $1,627 spent on fees and slippage. |
 |
iM 6-Stock Capital Strength Portfolio: The model’s out of sample performance YTD is -1.3%, and for the last 12 months is 31.1%. Over the same period the benchmark SPY performance was -0.6% and 16.8% respectively. Over the previous week the market value of the iM 6-Stock Capital Strength Portfolio gained 0.59% at a time when SPY gained 0.53%. A starting capital of $100,000 at inception on 10/28/2016 would have grown to $149,482 which includes $596 cash and excludes $630 spent on fees and slippage. |
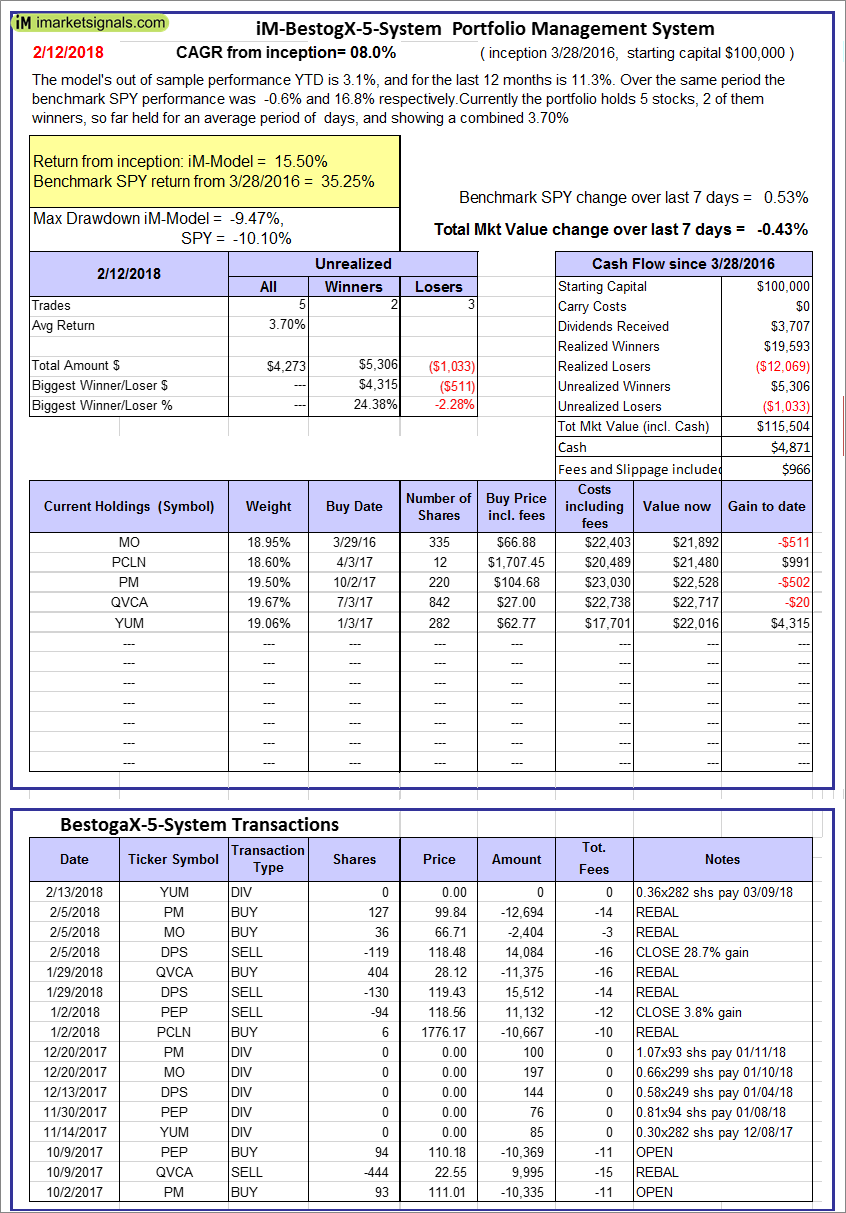 |
iM-BestogaX5-System: The model’s out of sample performance YTD is 3.1%, and for the last 12 months is 11.3%. Over the same period the benchmark SPY performance was -0.6% and 16.8% respectively. Over the previous week the market value of iM-BestogaX5-System gained -0.43% at a time when SPY gained 0.53%. A starting capital of $100,000 at inception on 3/28/2016 would have grown to $115,504 which includes $4,871 cash and excludes $966 spent on fees and slippage. |
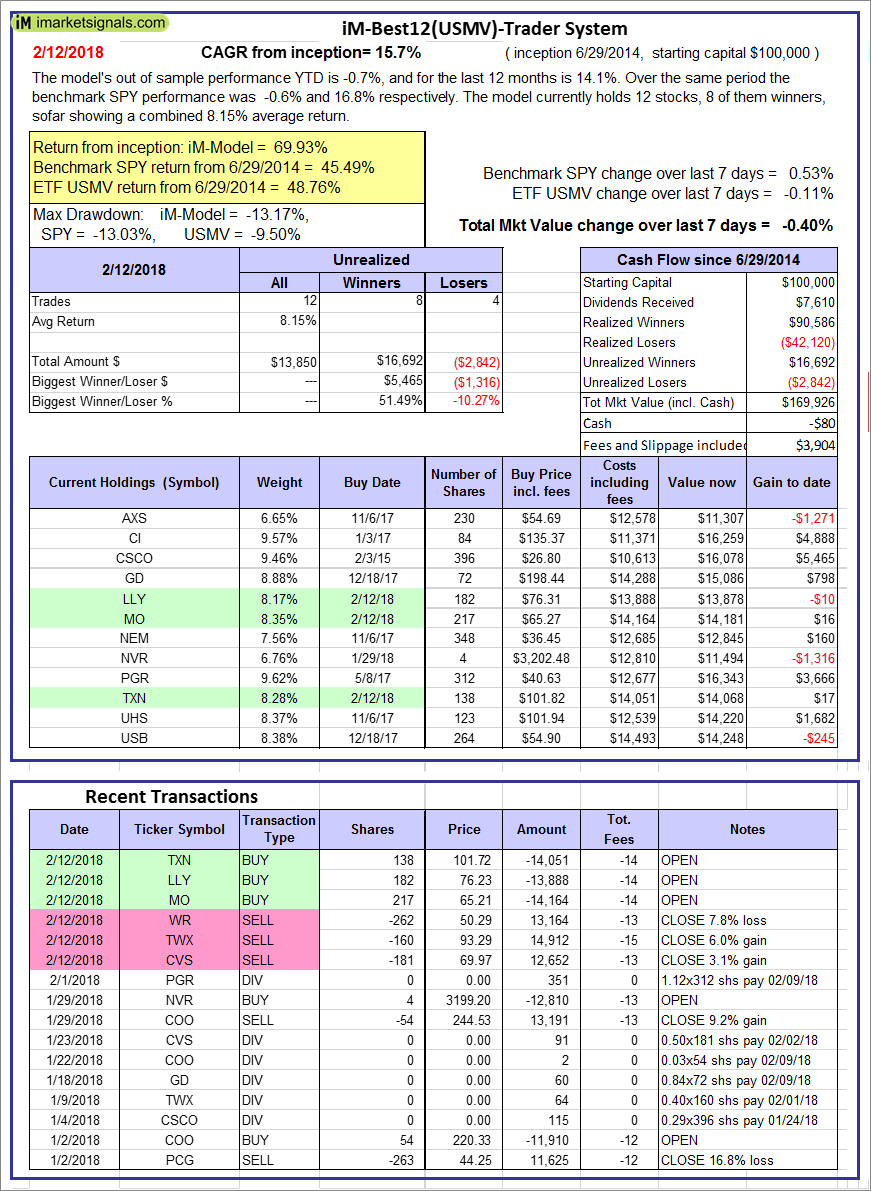 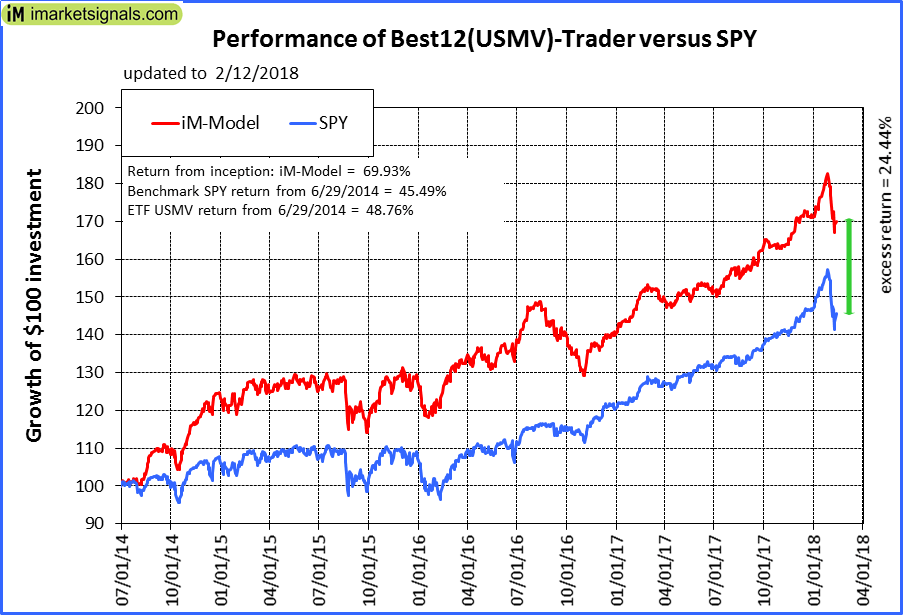 |
iM-Best12(USMV)-Trader: The model’s out of sample performance YTD is -0.7%, and for the last 12 months is 14.1%. Over the same period the benchmark SPY performance was -0.6% and 16.8% respectively. Since inception, on 6/30/2014, the model gained 69.93% while the benchmark SPY gained 45.49% and the ETF USMV gained 48.76% over the same period. Over the previous week the market value of iM-Best12(USMV)-Trader gained -0.40% at a time when SPY gained 0.53%. A starting capital of $100,000 at inception on 6/30/2014 would have grown to $169,926 which includes -$80 cash and excludes $3,904 spent on fees and slippage. |
 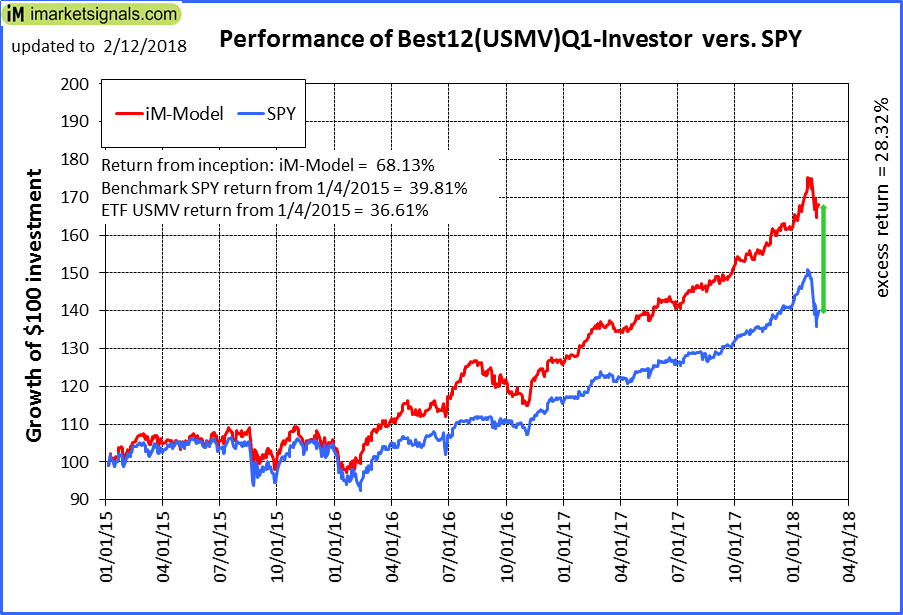 |
iM-Best12(USMV)Q1-Investor: The model’s out of sample performance YTD is 4.2%, and for the last 12 months is 25.9%. Over the same period the benchmark SPY performance was -0.6% and 16.8% respectively. Since inception, on 1/5/2015, the model gained 68.13% while the benchmark SPY gained 39.81% and the ETF USMV gained 36.61% over the same period. Over the previous week the market value of iM-Best12(USMV)Q1 gained 0.81% at a time when SPY gained 0.53%. A starting capital of $100,000 at inception on 1/5/2015 would have grown to $168,092 which includes $423 cash and excludes $986 spent on fees and slippage. |
 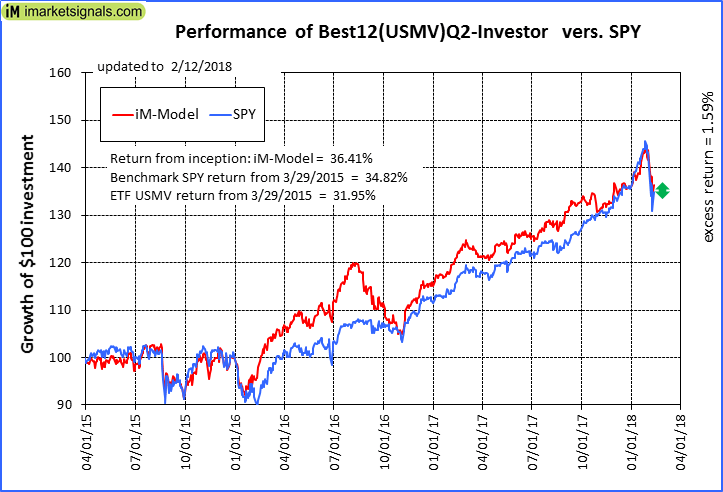 |
iM-Best12(USMV)Q2-Investor: The model’s out of sample performance YTD is 0.6%, and for the last 12 months is 13.0%. Over the same period the benchmark SPY performance was -0.6% and 16.8% respectively. Since inception, on 3/30/2015, the model gained 36.41% while the benchmark SPY gained 34.82% and the ETF USMV gained 31.95% over the same period. Over the previous week the market value of iM-Best12(USMV)Q2 gained -0.24% at a time when SPY gained 0.53%. A starting capital of $100,000 at inception on 3/30/2015 would have grown to $136,381 which includes $1,029 cash and excludes $874 spent on fees and slippage. |
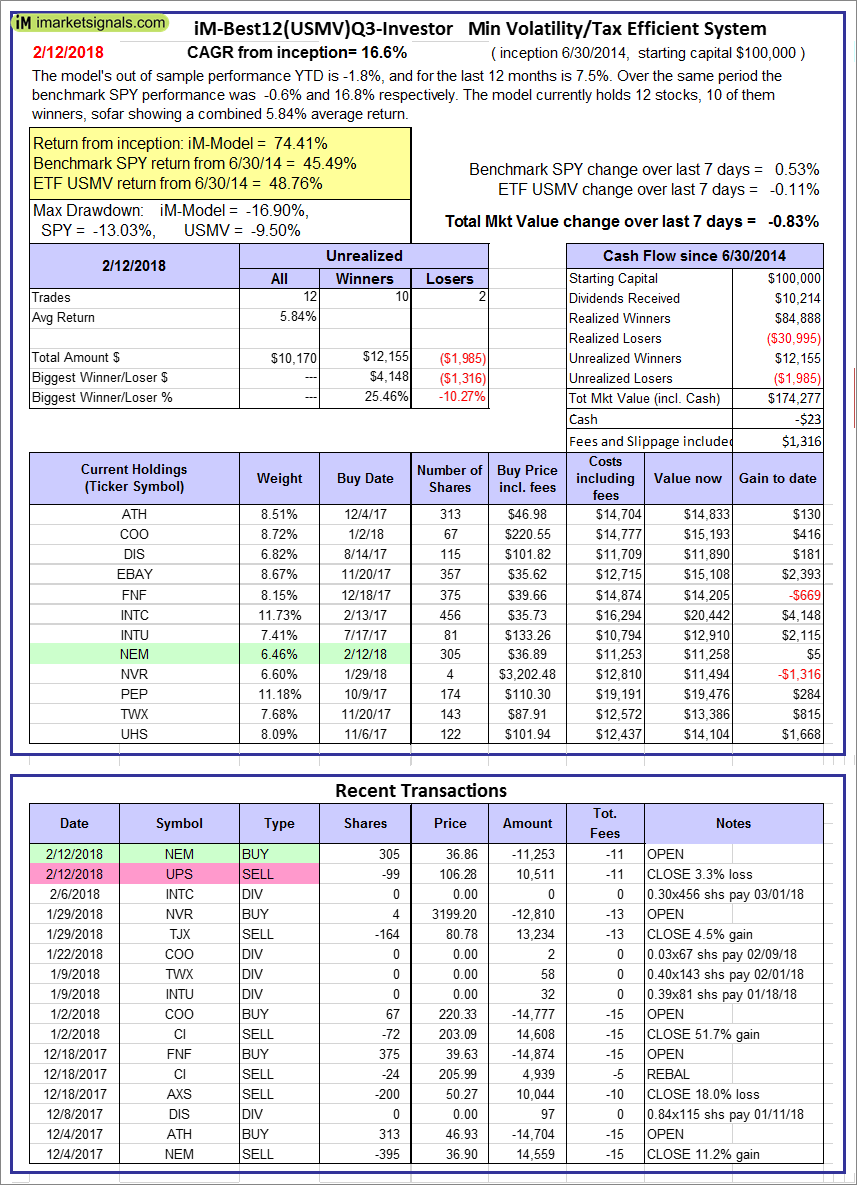 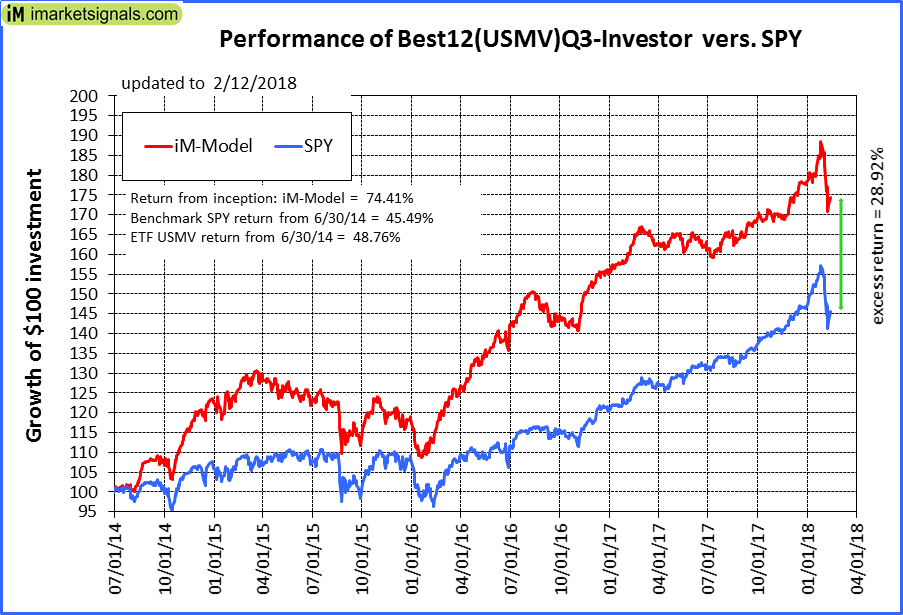 |
iM-Best12(USMV)Q3-Investor: The model’s out of sample performance YTD is -1.8%, and for the last 12 months is 7.5%. Over the same period the benchmark SPY performance was -0.6% and 16.8% respectively. Since inception, on 7/1/2014, the model gained 74.41% while the benchmark SPY gained 45.49% and the ETF USMV gained 48.76% over the same period. Over the previous week the market value of iM-Best12(USMV)Q3 gained -0.83% at a time when SPY gained 0.53%. A starting capital of $100,000 at inception on 7/1/2014 would have grown to $174,277 which includes -$23 cash and excludes $1,316 spent on fees and slippage. |
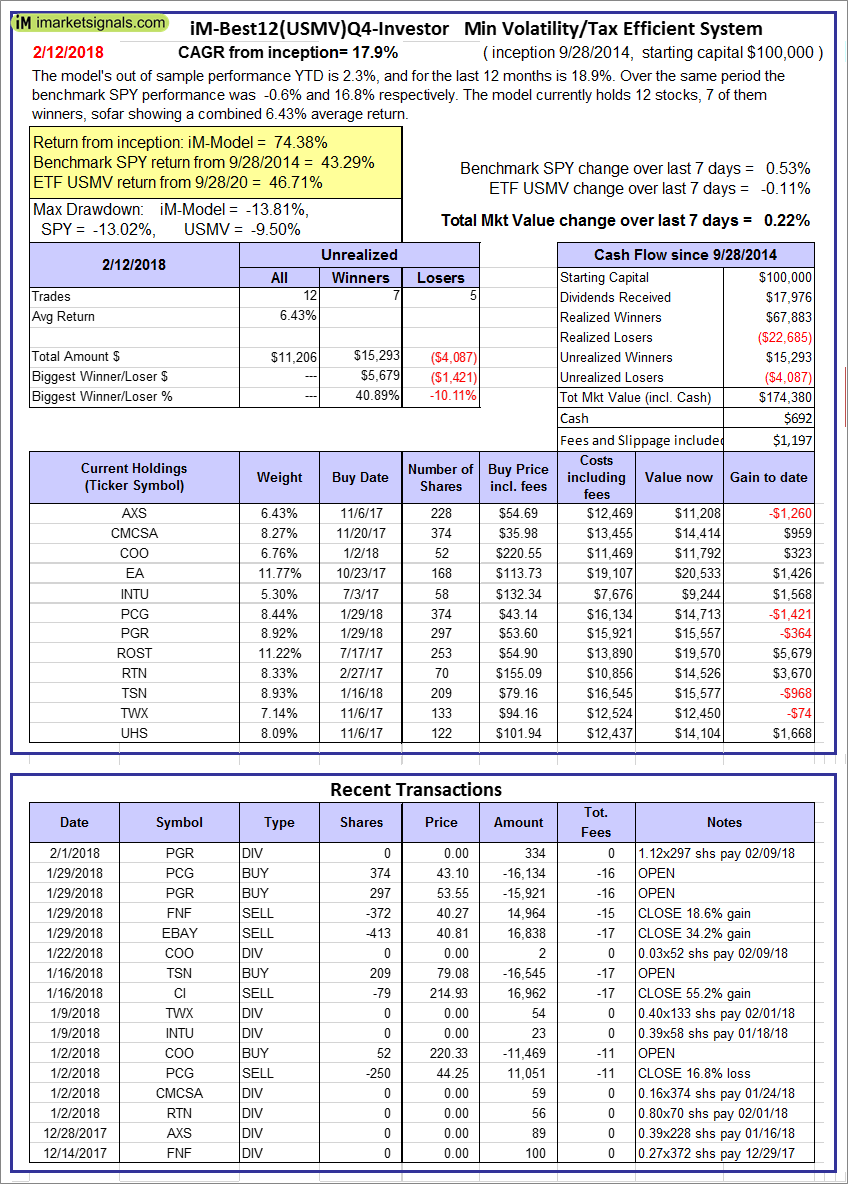 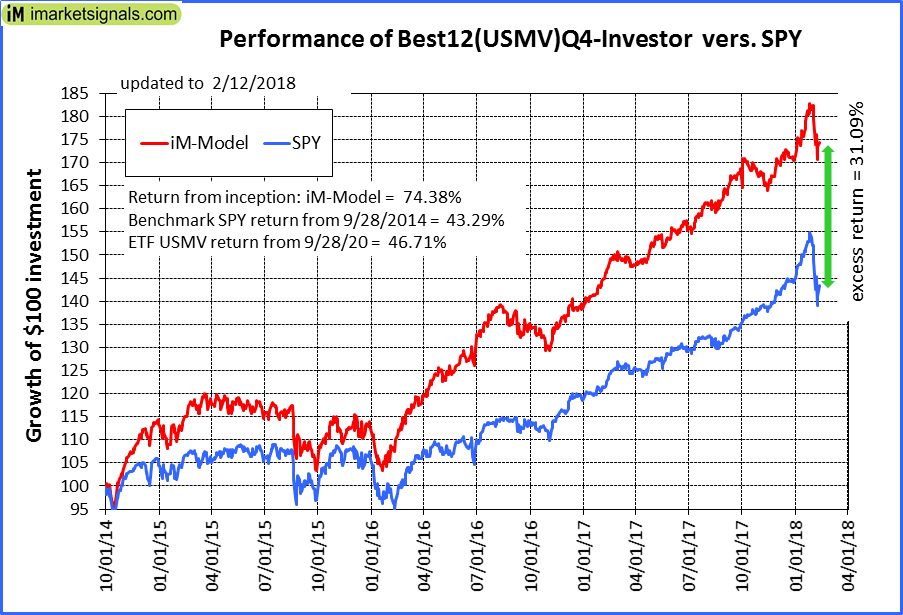 |
iM-Best12(USMV)Q4-Investor: Since inception, on 9/29/2014, the model gained 74.38% while the benchmark SPY gained 43.29% and the ETF USMV gained 46.71% over the same period. Over the previous week the market value of iM-Best12(USMV)Q4 gained 0.22% at a time when SPY gained 0.53%. A starting capital of $100,000 at inception on 9/29/2014 would have grown to $174,380 which includes $692 cash and excludes $1,197 spent on fees and slippage. |
 |
Average Performance of iM-Best12(USMV)Q1+Q2+Q3+Q4-Investor resulted in an excess return of 41.05% over SPY. (see iM-USMV Investor Portfolio) |
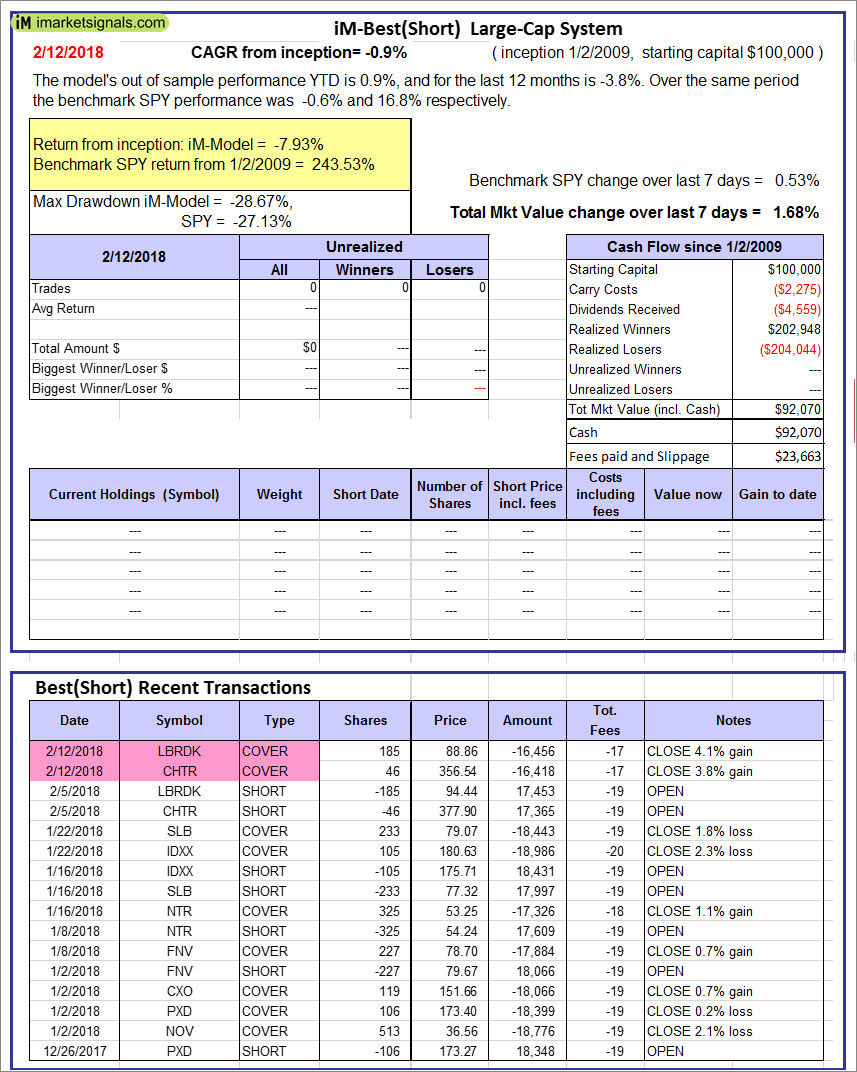 |
iM-Best(Short): The model’s out of sample performance YTD is 0.9%, and for the last 12 months is -3.8%. Over the same period the benchmark SPY performance was -0.6% and 16.8% respectively. Over the previous week the market value of iM-Best(Short) gained 1.68% at a time when SPY gained 0.53%. Over the period 1/2/2009 to 2/12/2018 the starting capital of $100,000 would have grown to $92,070 which includes $92,070 cash and excludes $23,663 spent on fees and slippage. |
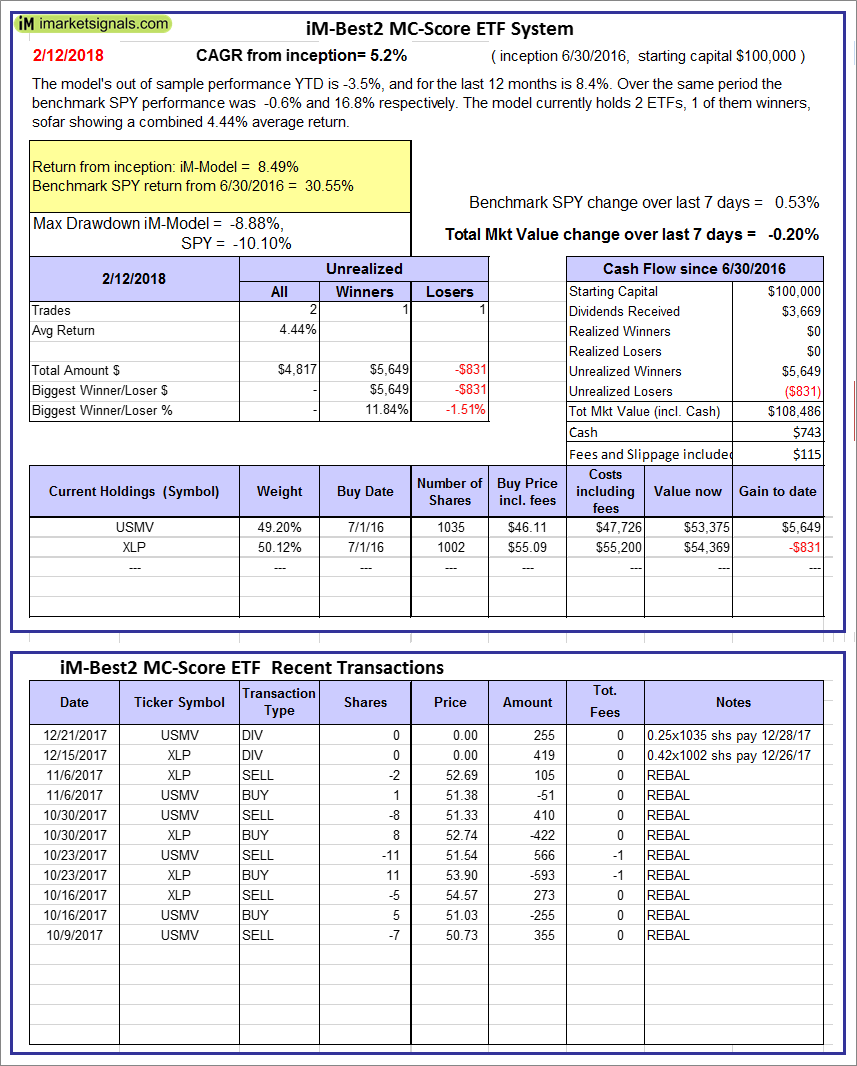 |
iM-Best2 MC-Score ETF System: The model’s out of sample performance YTD is -3.5%, and for the last 12 months is 8.4%. Over the same period the benchmark SPY performance was -0.6% and 16.8% respectively. Over the previous week the market value of the iM-Best2 MC-Score ETF System gained -0.20% at a time when SPY gained 0.53%. A starting capital of $100,000 at inception on 6/30/2016 would have grown to $108,486 which includes $743 cash and excludes $115 spent on fees and slippage. |
 |
iM-Best4 MC-Score Vanguard System: The model’s out of sample performance YTD is -5.8%, and for the last 12 months is 2.3%. Over the same period the benchmark SPY performance was -0.6% and 16.8% respectively. Over the previous week the market value of the iM-Best4 MC-Score Vanguard System gained -0.20% at a time when SPY gained 0.53%. A starting capital of $100,000 at inception on 6/30/2016 would have grown to $104,417 which includes $3,320 cash and excludes $00 spent on fees and slippage. |
 |
iM-Composite (SH-RSP) Timer: The model’s out of sample performance YTD is -1.7%, and for the last 12 months is 12.2%. Over the same period the benchmark SPY performance was -0.6% and 16.8% respectively. Over the previous week the market value of the iM-Composite (SH-RSP) Timer gained 0.10% at a time when SPY gained 0.53%. A starting capital of $100,000 at inception on 6/30/2016 would have grown to $127,825 which includes $2,172 cash and excludes $513 spent on fees and slippage. |
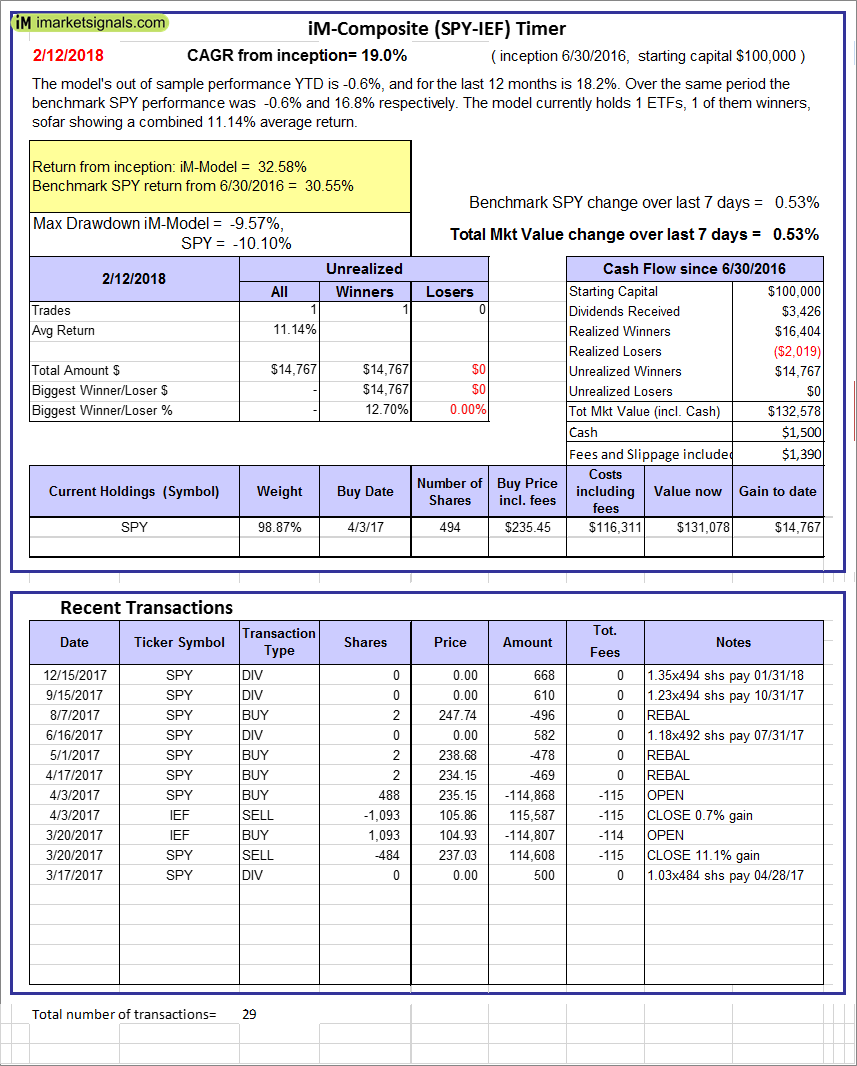 |
iM-Composite (SPY-IEF) Timer: The model’s out of sample performance YTD is -0.6%, and for the last 12 months is 18.2%. Over the same period the benchmark SPY performance was -0.6% and 16.8% respectively. Over the previous week the market value of the iM-Composite (SPY-IEF) Timer gained 0.53% at a time when SPY gained 0.53%. A starting capital of $100,000 at inception on 6/30/2016 would have grown to $132,578 which includes $1,500 cash and excludes $1,390 spent on fees and slippage. |
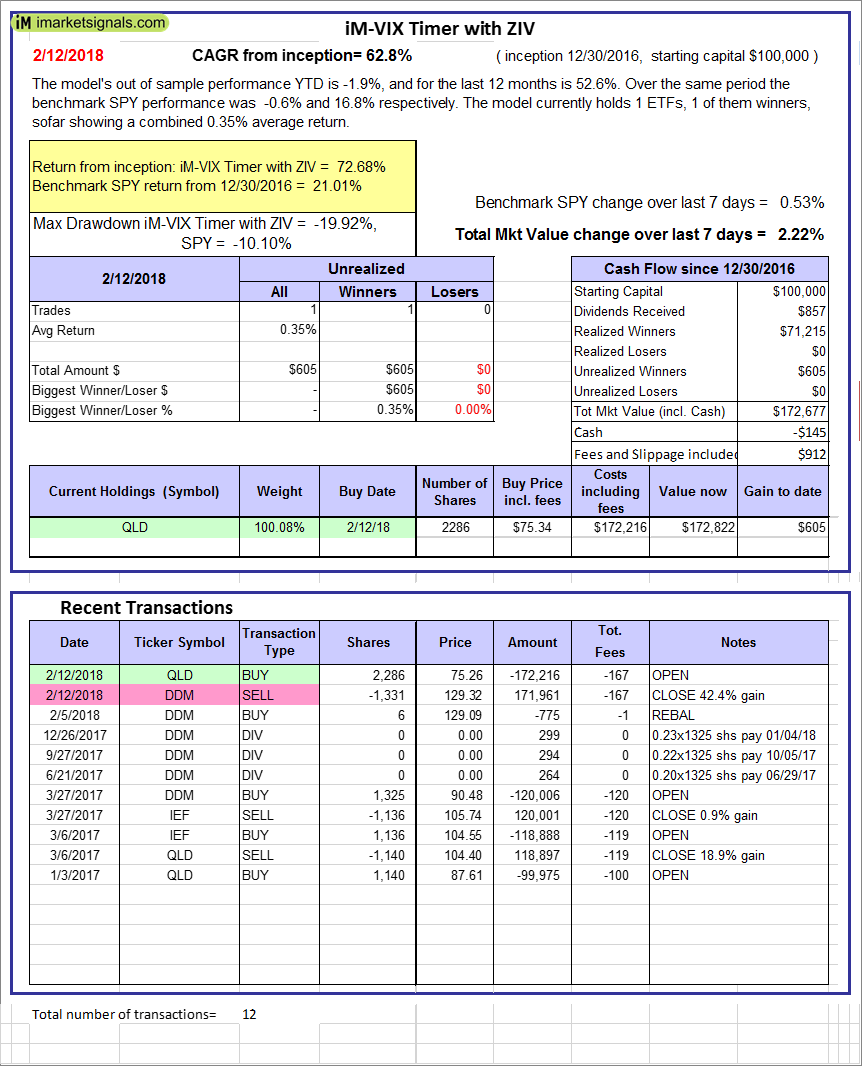 |
iM-VIX Timer with ZIV: The model’s out of sample performance YTD is -1.9%, and for the last 12 months is 52.6%. Over the same period the benchmark SPY performance was -0.6% and 16.8% respectively. Over the previous week the market value of the iM-VIX Timer with ZIV gained 2.22% at a time when SPY gained 0.53%. A starting capital of $100,000 at inception on 6/30/2016 would have grown to $172,677 which includes -$145 cash and excludes $912 spent on fees and slippage. |
 |
iM-Composite(Gold-Stocks-Bond) Timer: The model’s out of sample performance YTD is 1.4%, and for the last 12 months is 15.5%. Over the same period the benchmark SPY performance was -0.6% and 16.8% respectively. Over the previous week the market value of the iM-Composite(Gold-Stocks-Bond) Timer gained -1.19% at a time when SPY gained 0.53%. A starting capital of $100,000 at inception on 6/30/2016 would have grown to $130,484 which includes $53 cash and excludes $1,955 spent on fees and slippage. |
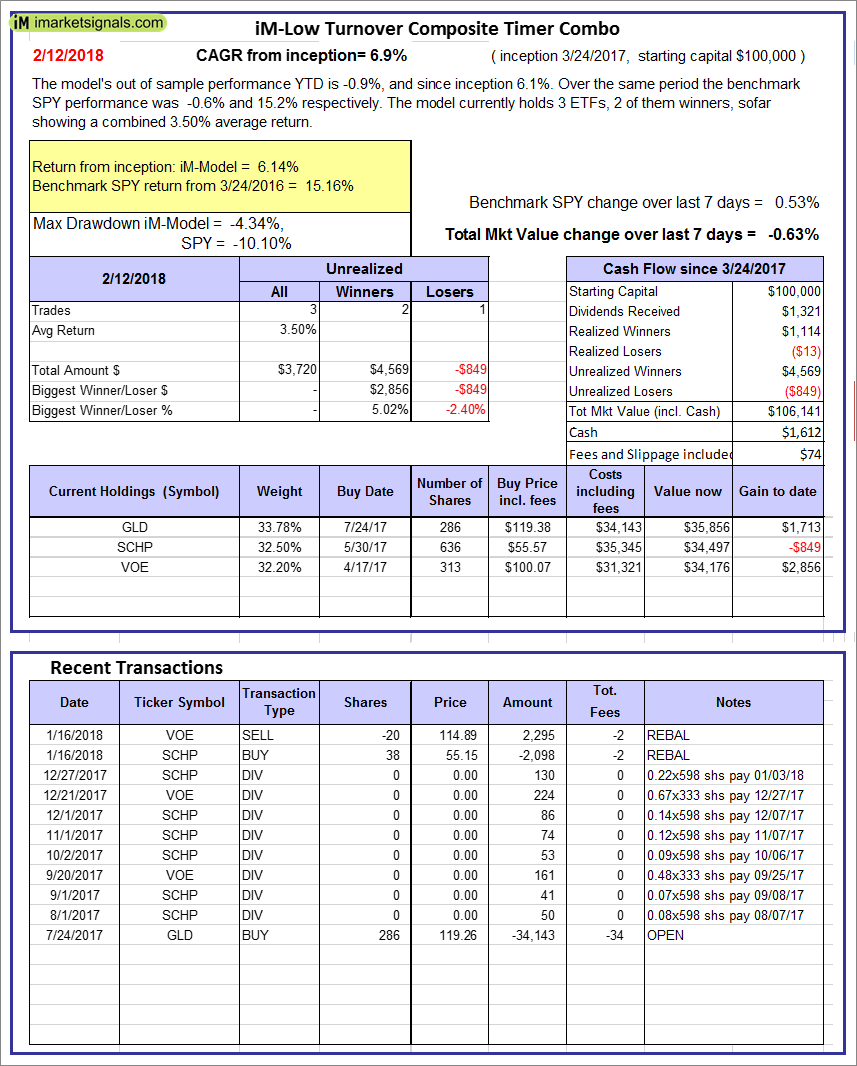 |
iM-Low Turnover Composite Timer Combo: The model’s out of sample performance YTD is -0.9%, and since inception 6.1%. Over the same period the benchmark SPY performance was -0.6% and 15.2% respectively. Over the previous week the market value of the iM-Low Turnover Composite Timer Combo gained -0.63% at a time when SPY gained 0.53%. A starting capital of $100,000 at inception on 3/24/27 would have grown to $106,141 which includes $1,612 cash and excludes $74 spent on fees and slippage. |
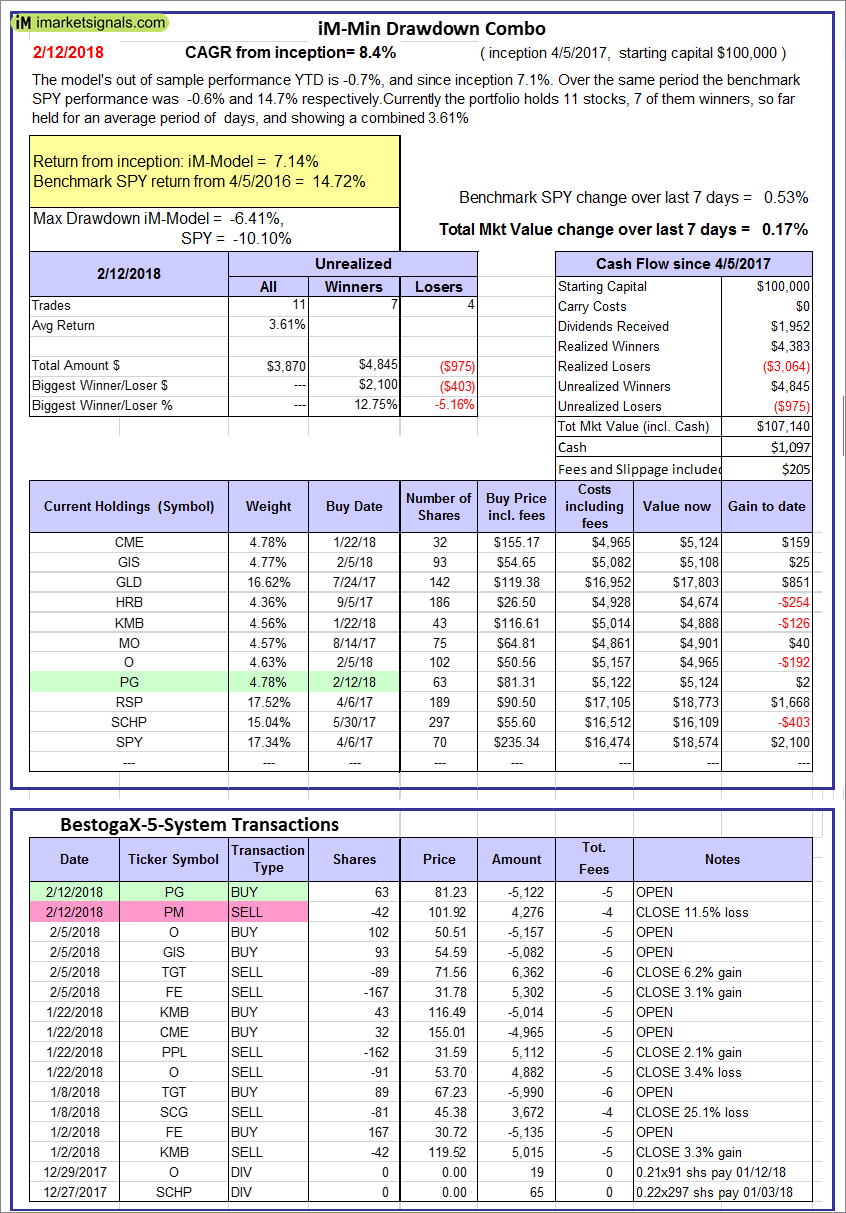 |
iM-Min Drawdown Combo: The model’s out of sample performance YTD is -0.7%, and since inception 7.1%. Over the same period the benchmark SPY performance was -0.6% and 14.7% respectively. Over the previous week the market value of the iM-Min Drawdown Combo gained 0.17% at a time when SPY gained 0.53%. A starting capital of $100,000 at inception on 4/5/2017 would have grown to $107,140 which includes $1,097 cash and excludes $205 spent on fees and slippage. |
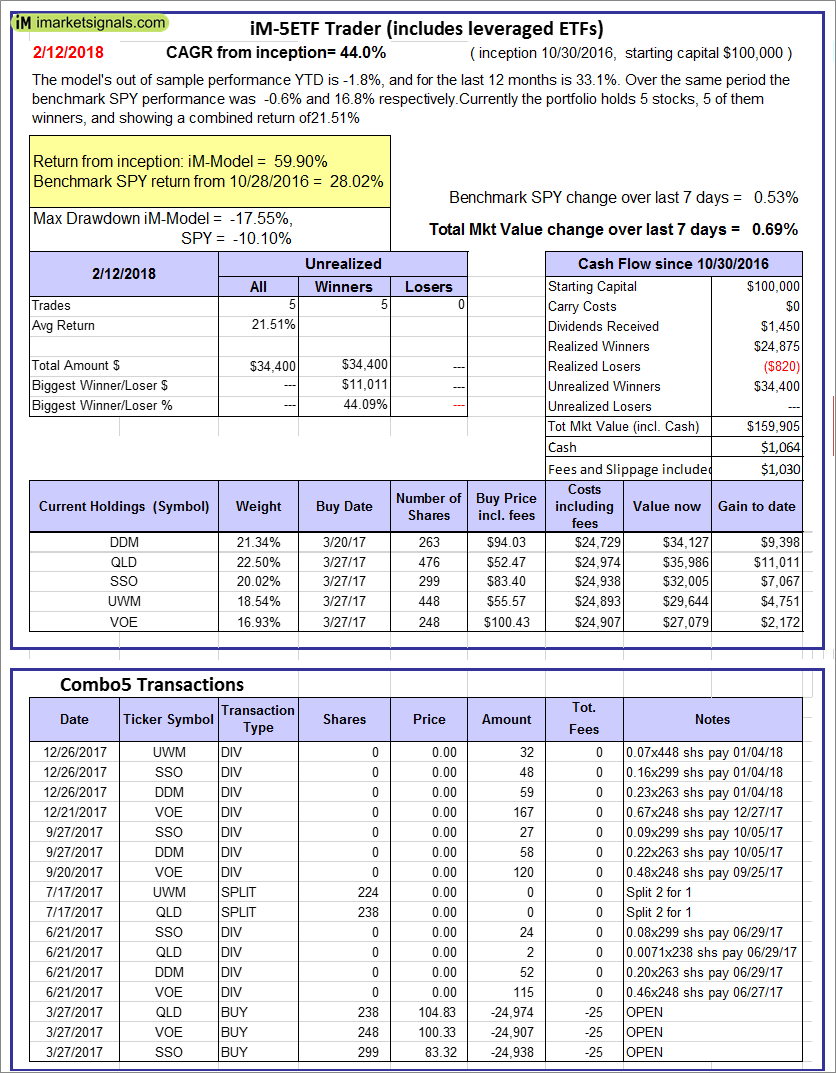 |
iM-5ETF Trader (includes leveraged ETFs): The model’s out of sample performance YTD is -1.8%, and for the last 12 months is 33.1%. Over the same period the benchmark SPY performance was -0.6% and 16.8% respectively. Over the previous week the market value of the iM-5ETF Trader (includes leveraged ETFs) gained 0.69% at a time when SPY gained 0.53%. A starting capital of $100,000 at inception on 10/30/2016 would have grown to $159,905 which includes $1,064 cash and excludes $1,030 spent on fees and slippage. |
 |
iM-Standard 5ETF Trader (excludes leveraged ETFs): The model’s out of sample performance YTD is -1.1%, and for the last 12 months is 15.6%. Over the same period the benchmark SPY performance was -0.6% and 16.8% respectively. Over the previous week the market value of the iM-Standard 5ETF Trader (excludes leveraged ETFs) gained 0.26% at a time when SPY gained 0.53%. A starting capital of $100,000 at inception on 10/30/2016 would have grown to $124,231 which includes $2,002 cash and excludes $880 spent on fees and slippage. |
iM-Best Reports – 2/12/2018
Posted in pmp SPY-SH
Leave a Reply
You must be logged in to post a comment.