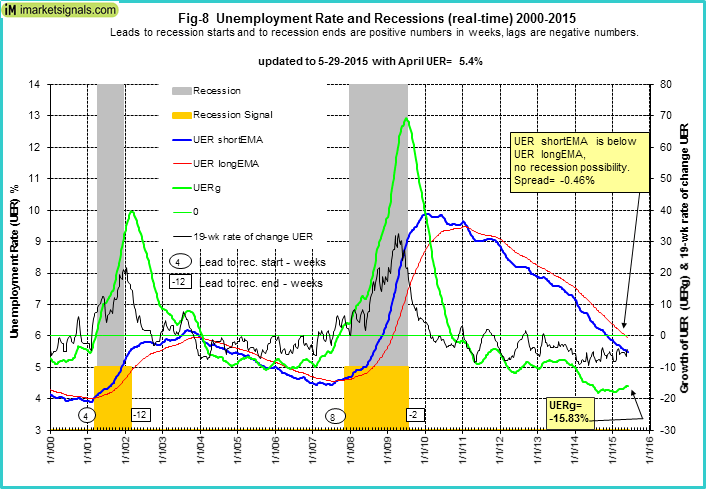
A reliable source for recession forecasting is the unemployment rate, which can provide signals for the beginnings and ends of recessions. The unemployment rate model (article link), updated with the April figure of 5.4%, does not signal a recession now.
The model relies on four indicators to signal recessions:
- A short 12-period and a long 60-period exponential moving average (EMA) of the unemployment rate (UER),
- The 8-month smoothed annualized growth rate of the UER (UERg).
- The 19-week rate of change of the UER.
The criteria for the model to signal the start of recessions are given in the original article and repeated in the Appendix.
Referring to the chart below, and looking at the end portion of it, one can see that none of the conditions for a recession start are currently present.
- The UER is not forming a trough and its short EMA is well below its long EMA – the blue and red graphs, respectively, the spread being -0.46%.
- UERg is currently at a low level, minus 15.83% – the green graph.
- Also the 19-week rate of change of the UER is now at minus 4.3%, far below the critical level of plus 8% – the black graph.
For a recession signal, the short EMA of the UER would have to form a trough and then cross its long EMA to the upside. Alternatively, the UERg graph would have to turn upwards and rise above zero, or the 19-week rate of change of the UER would have to be above 8%. Currently the trajectories of the unemployment rate’s short- and long EMA are still downwards – none having a positive slope, UERg is far below zero, and the 19-week rate of change of the UER is also way below the critical level.
Based on the historic patterns of the unemployment rate indicators prior to recessions one can reasonably conclude that the U.S. economy is not likely to go into recession anytime soon.
Appendix
The model signals the start of a recession when any one of the following three conditions occurs:
- The short exponential moving average (EMA) of the unemployment rate (UER) rises and crosses the long EMA to the upside, and the difference between the two EMAs is at least 0.07.
- The unemployment rate growth rate (UERg) rises above zero, while the long EMA of the unemployment rate has a positive slope, and the difference between the long EMA at that time and the long EMA 10 weeks before is greater than 0.025.
- The 19-week rate of change of the UER is greater than 8.0%, while simultaneously the long EMA of the UER has a positive slope and the difference between the long EMA at the time and the long EMA 10 weeks earlier is greater than 0.015.


Leave a Reply
You must be logged in to post a comment.