
  |
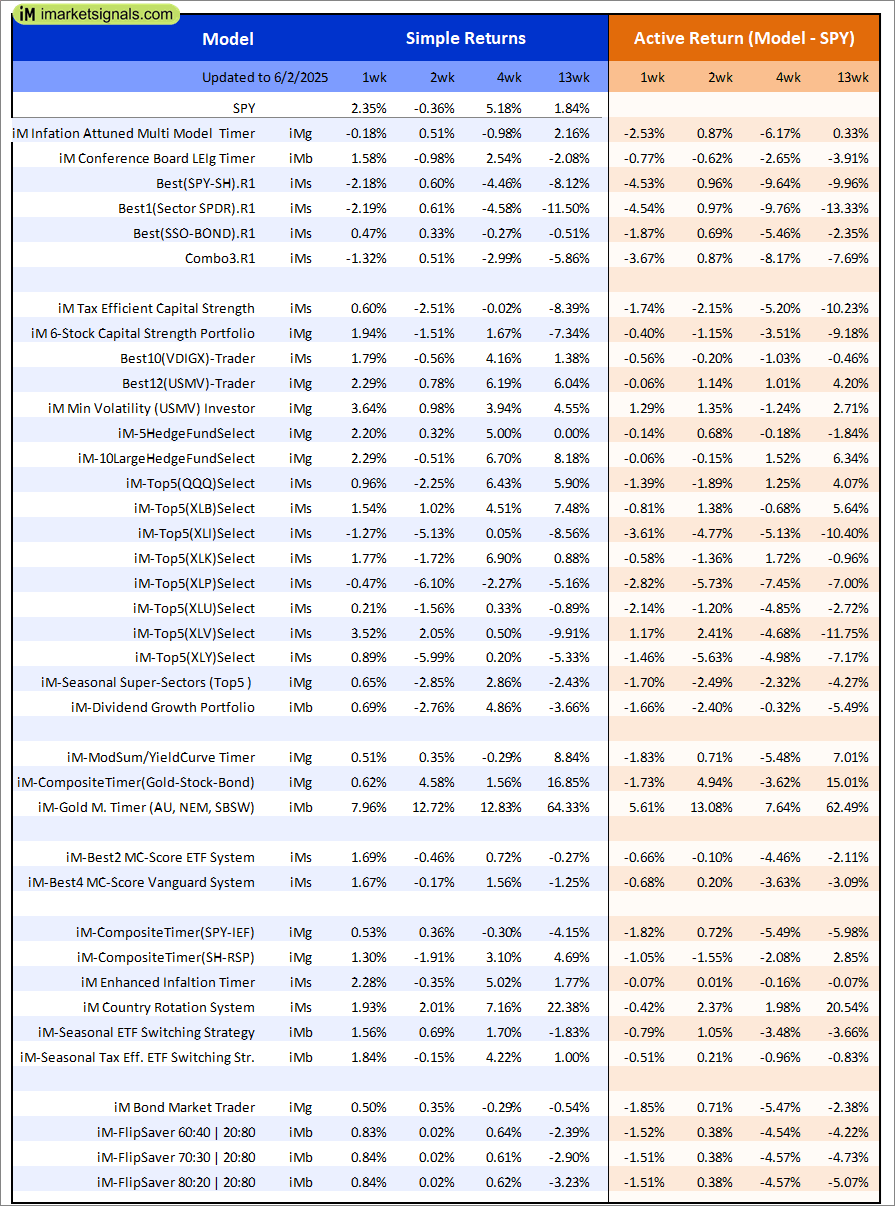
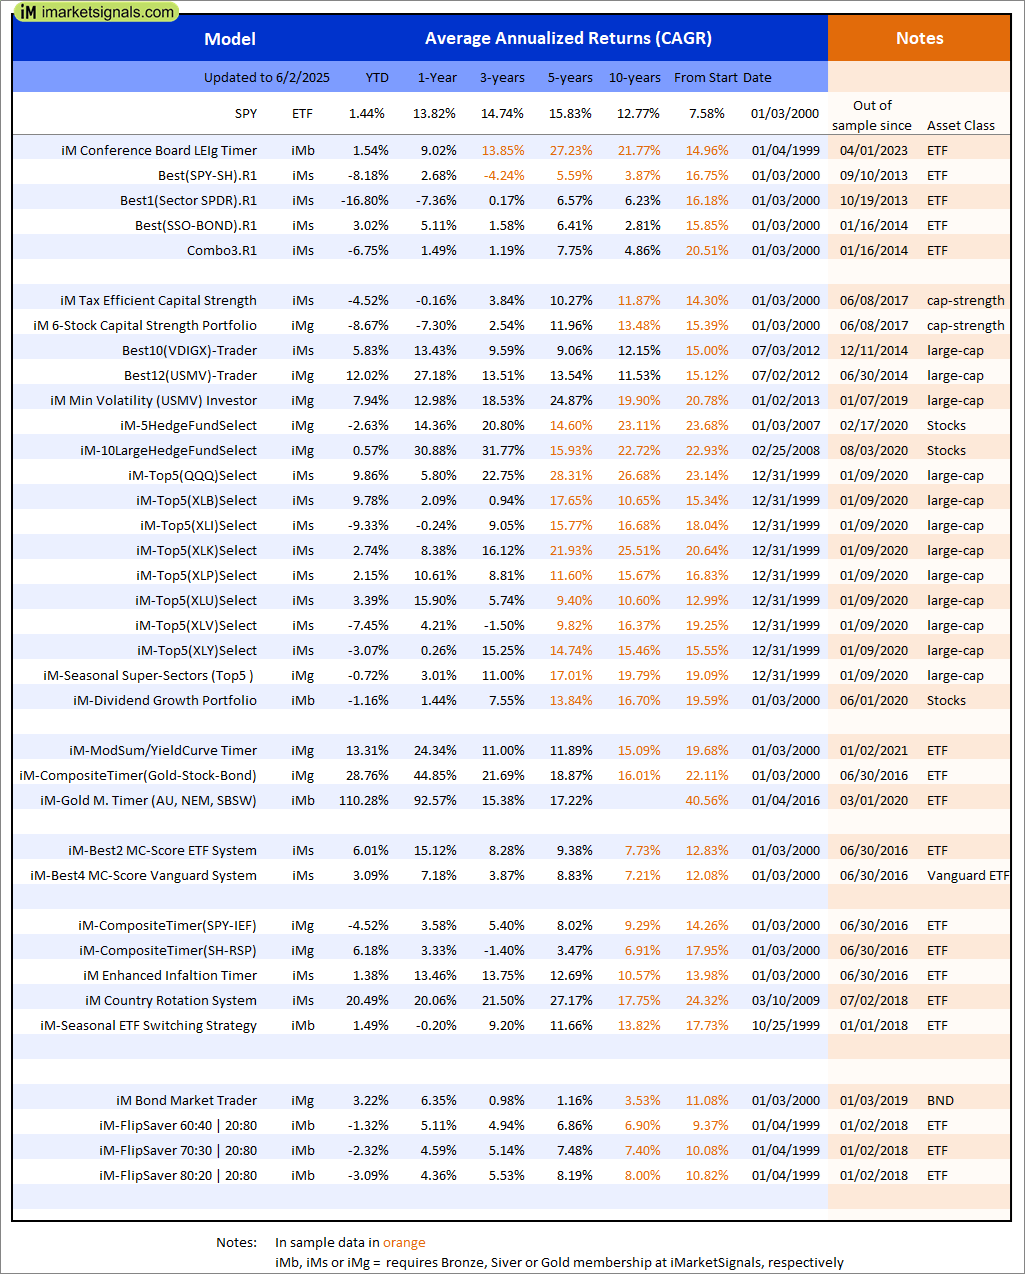
Out of sample performance summary of our models for the past 1, 2, 4 and 13 week periods. The active active return indicates how the models over- or underperformed the benchmark ETF SPY. Also the YTD, and the 1-, 3-, 5- and 10-year annualized returns are shown in the second table |
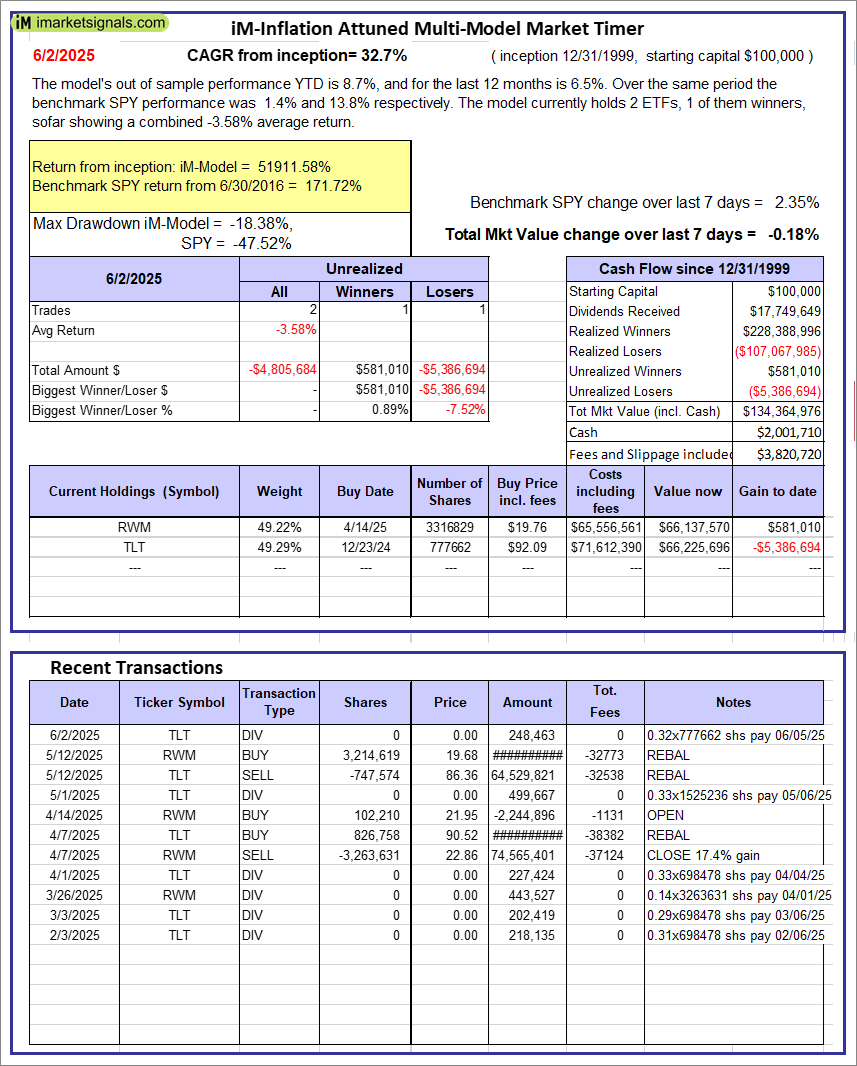 |
iM-Inflation Attuned Multi-Model Market Timer: The model’s out of sample performance YTD is 8.7%, and for the last 12 months is 6.5%. Over the same period the benchmark SPY performance was 1.4% and 13.8% respectively. Over the previous week the market value of the iM-Inflation Attuned Multi-Model Market Timer gained -0.18% at a time when SPY gained 2.35%. A starting capital of $100,000 at inception on 3/24/2017 would have grown to $134,364,976 which includes $2,001,710 cash and excludes $3,820,720 spent on fees and slippage. |
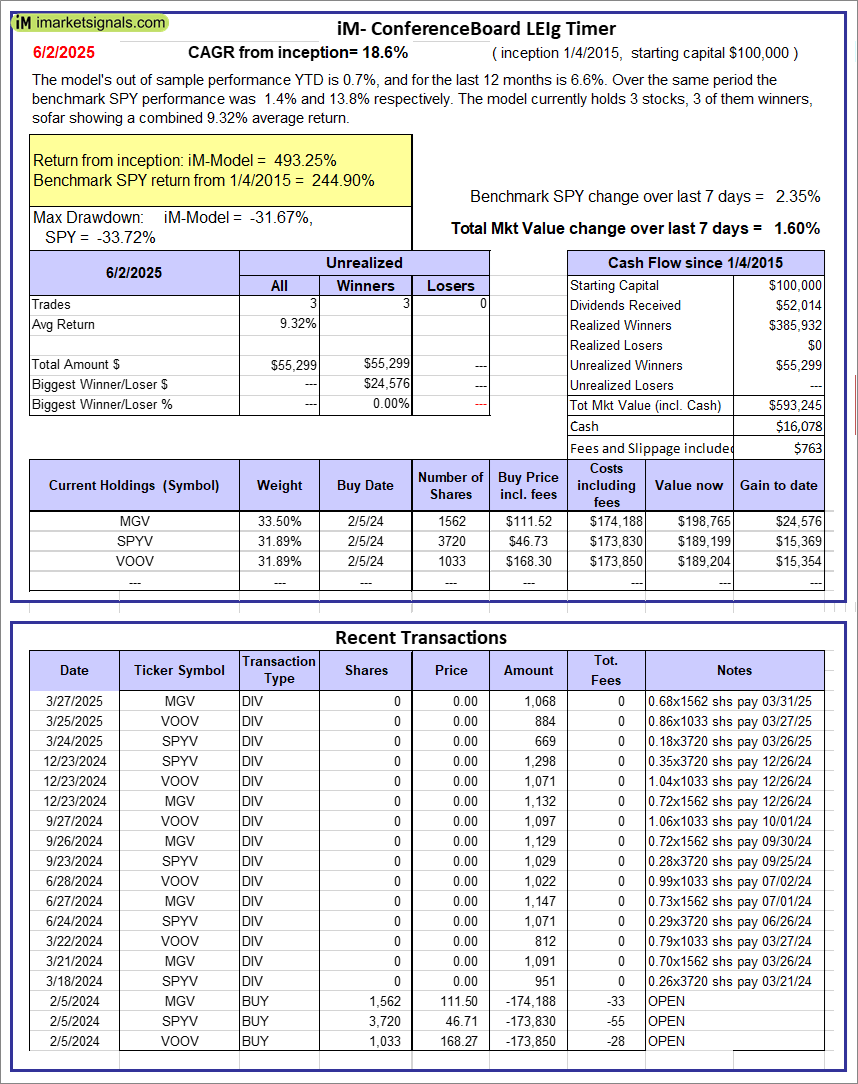 |
iM-Conference Board LEIg Timer: The model’s performance YTD is 14.3%, and for the last 12 months is 7.3%. Over the same period the benchmark SPY performance was 20.1% and 9.4% respectively. Over the previous week the market value of the iM-Conference Board LEIg Timer gained 1.60% at a time when SPY gained 2.35%. A starting capital of $100,000 at inception on 4/5/2017 would have grown to $593,245 which includes $16,078 cash and excludes $763 spent on fees and slippage. |
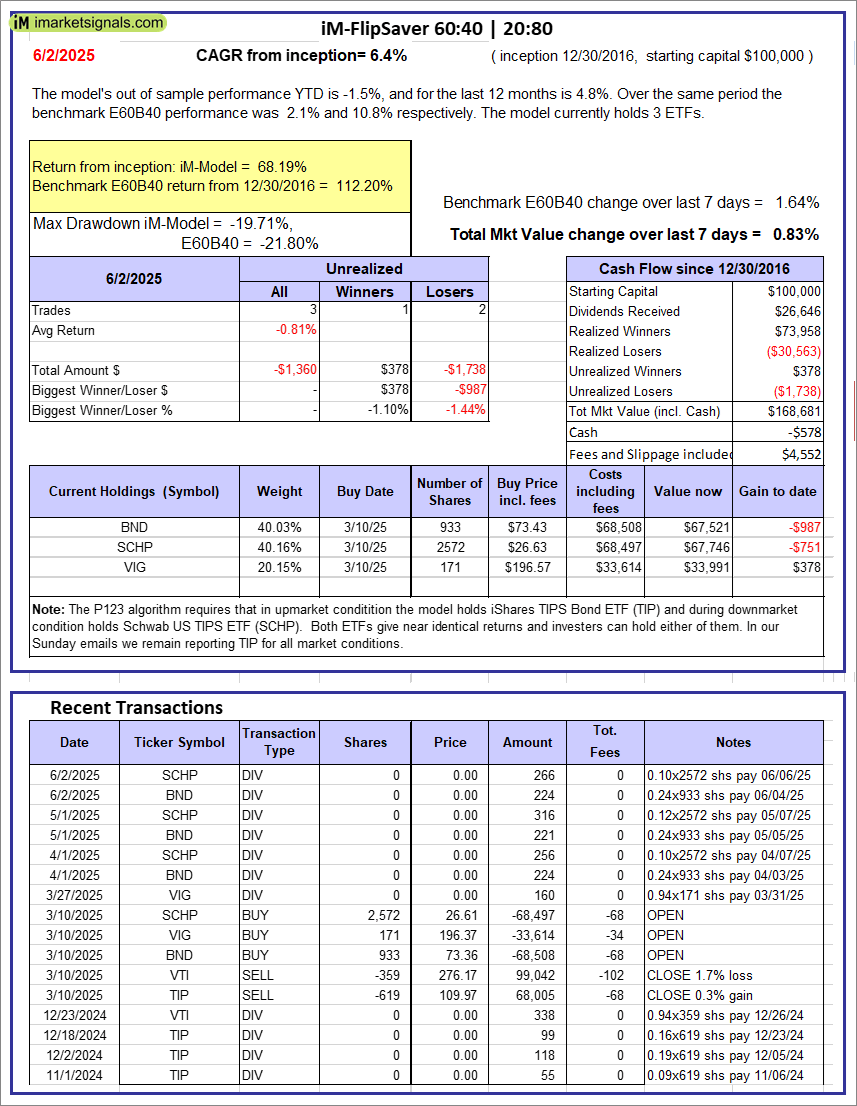 |
iM-FlipSaver 60:40 | 20:80 – 2017: The model’s out of sample performance YTD is -1.5%, and for the last 12 months is 4.8%. Over the same period the benchmark E60B40 performance was 2.1% and 10.8% respectively. Over the previous week the market value of iM-FlipSaver 80:20 | 20:80 gained 0.83% at a time when SPY gained 1.64%. A starting capital of $100,000 at inception on 7/16/2015 would have grown to $168,681 which includes -$578 cash and excludes $4,552 spent on fees and slippage. |
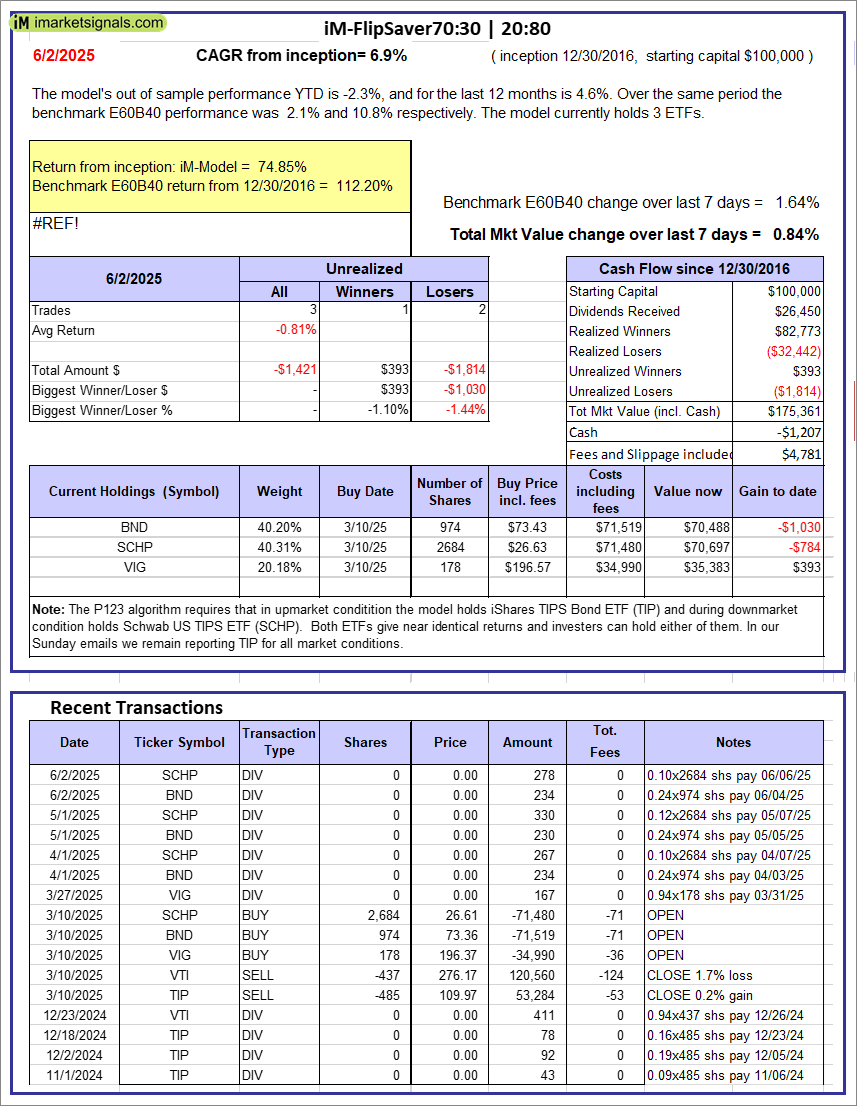 |
iM-FlipSaver 70:30 | 20:80 – 2017: The model’s out of sample performance YTD is -2.3%, and for the last 12 months is 4.6%. Over the same period the benchmark E60B40 performance was 2.1% and 10.8% respectively. Over the previous week the market value of iM-FlipSaver 70:30 | 20:80 gained 0.84% at a time when SPY gained 1.64%. A starting capital of $100,000 at inception on 7/15/2015 would have grown to $175,361 which includes -$1,207 cash and excludes $4,781 spent on fees and slippage. |
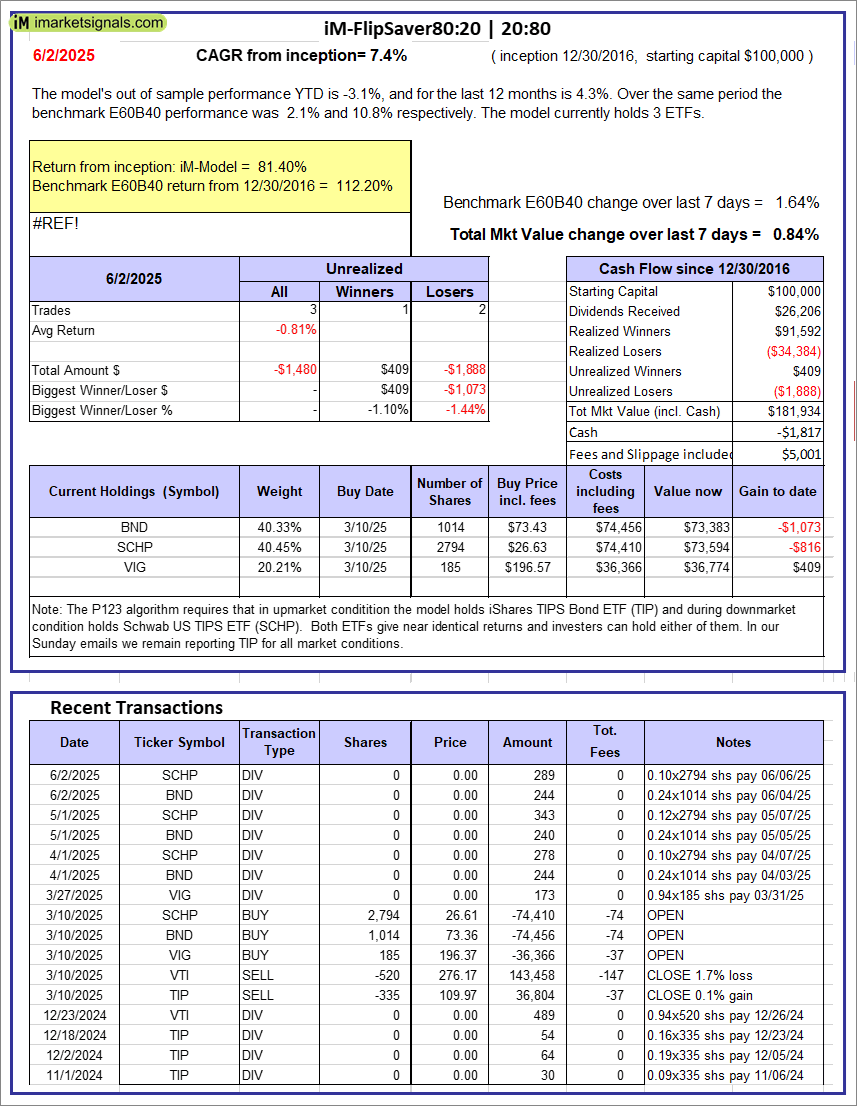 |
iM-FlipSaver 80:20 | 20:80 – 2017: The model’s out of sample performance YTD is -3.1%, and for the last 12 months is 4.3%. Over the same period the benchmark E60B40 performance was 2.1% and 10.8% respectively. Over the previous week the market value of iM-FlipSaver 80:20 | 20:80 gained 0.84% at a time when SPY gained 1.64%. A starting capital of $100,000 at inception on 1/2/2017 would have grown to $181,934 which includes -$1,817 cash and excludes $5,001 spent on fees and slippage. |
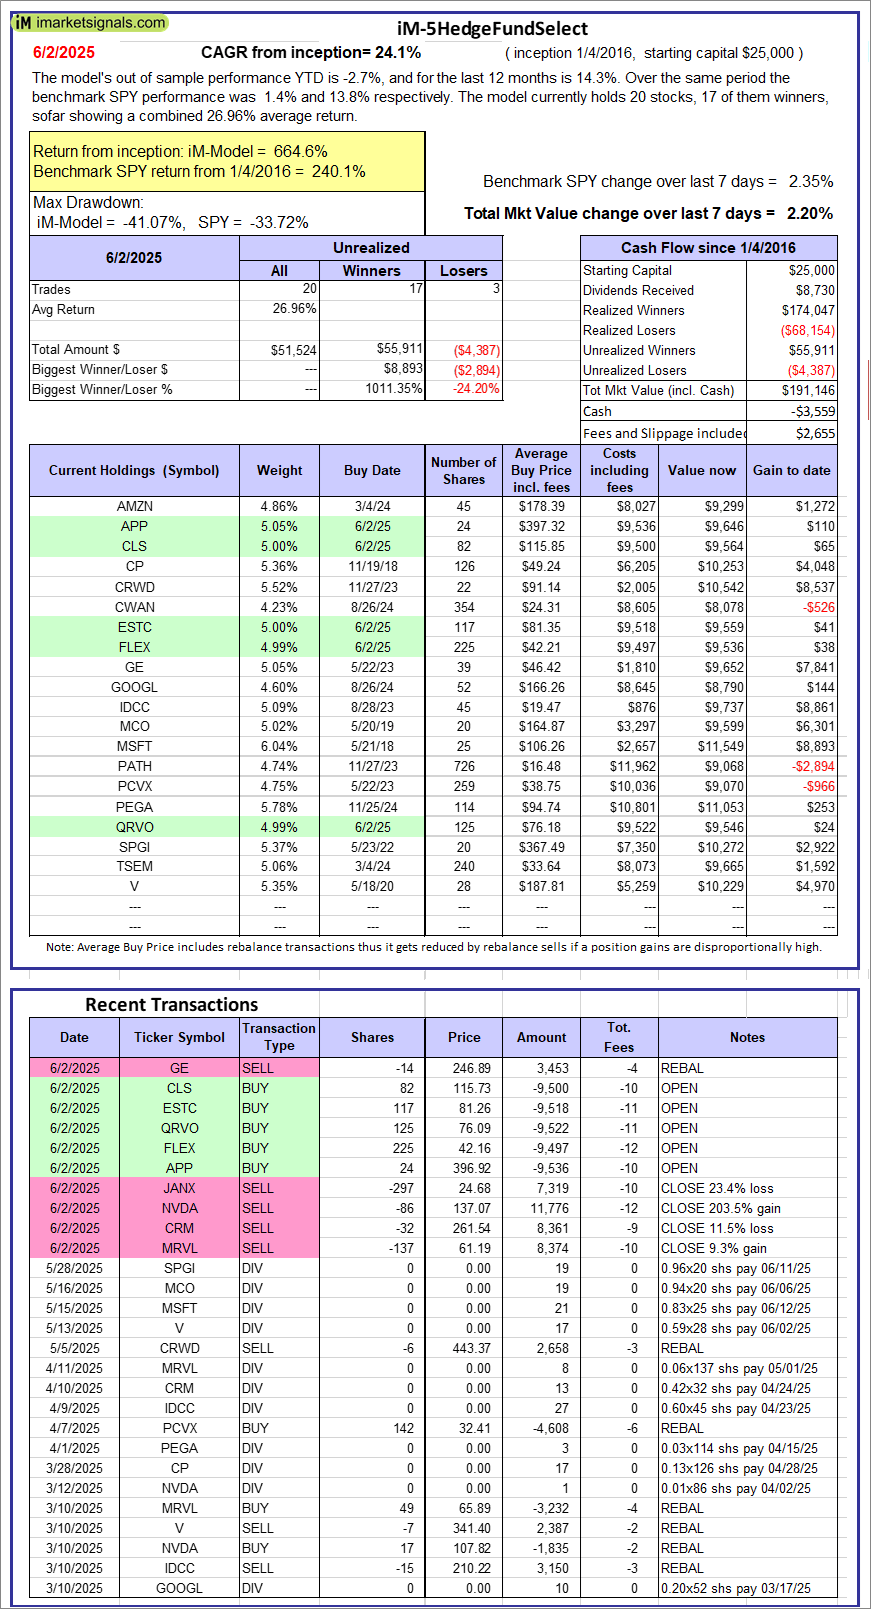 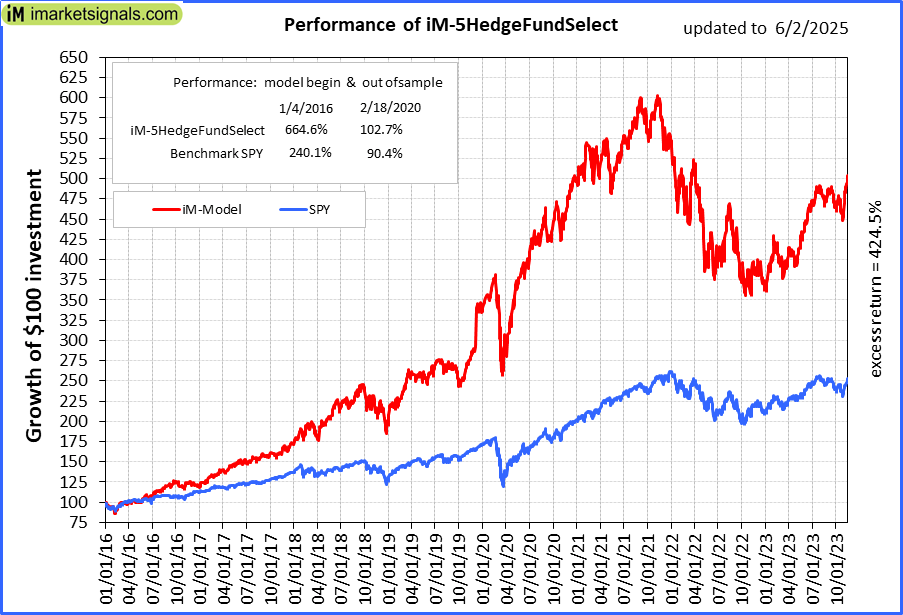 |
iM-5HedgeFundSelect: Since inception, on 1/5/2016, the model gained 664.59% while the benchmark SPY gained 240.07% over the same period. Over the previous week the market value of iM-5HedgeFundSelect gained 2.20% at a time when SPY gained 2.35%. A starting capital of $25,000 at inception on 1/5/2016 would have grown to $191,146 which includes -$3,559 cash and excludes $2,655 spent on fees and slippage. |
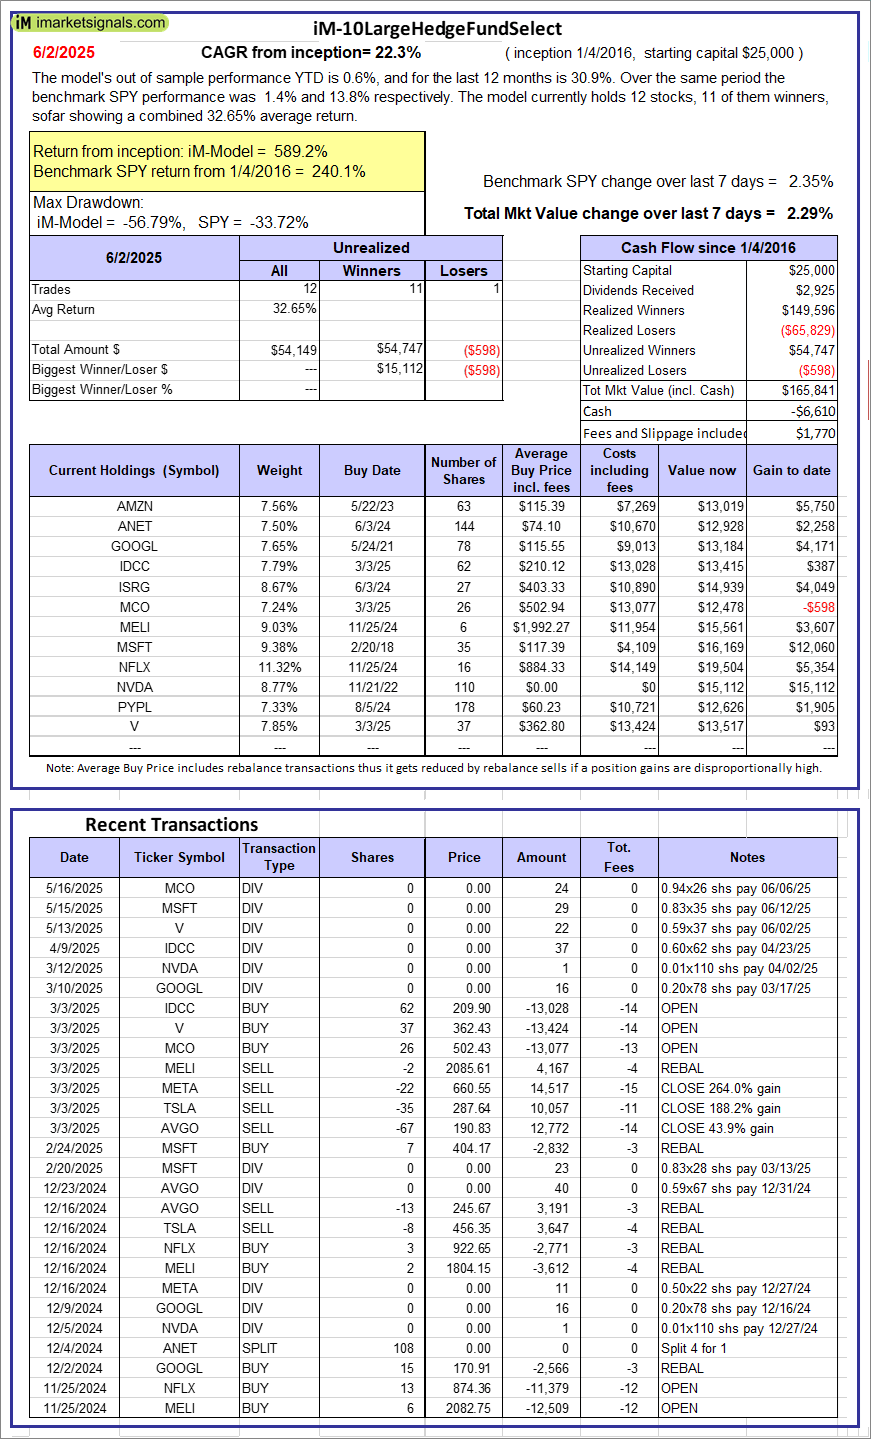 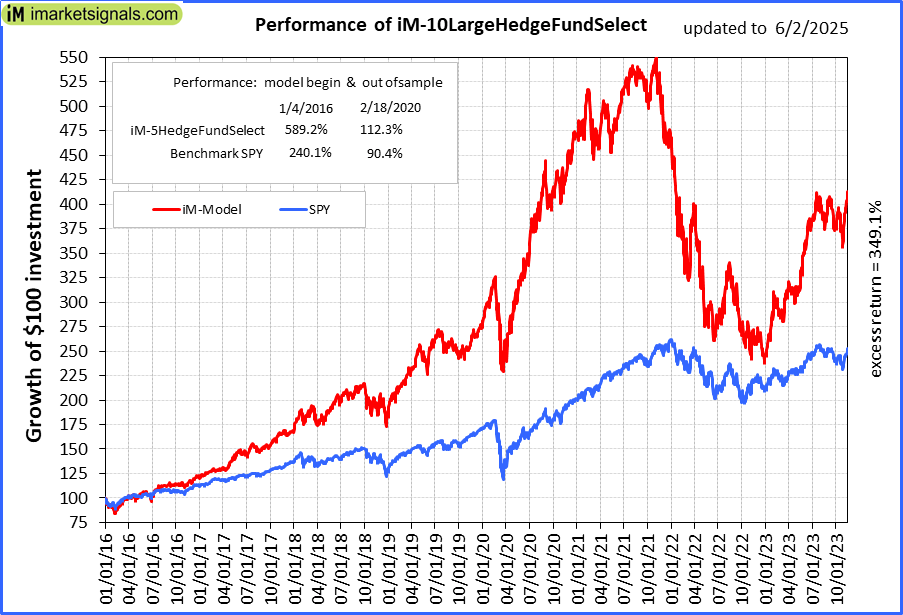 |
iM-10LargeHedgeFundSelect: Since inception, on 1/5/2016, the model gained 589.16% while the benchmark SPY gained 240.07% over the same period. Over the previous week the market value of iM-10LargeHedgeFundSelect gained 2.29% at a time when SPY gained 2.35%. A starting capital of $25,000 at inception on 1/5/2016 would have grown to $165,841 which includes -$6,610 cash and excludes $1,770 spent on fees and slippage. |
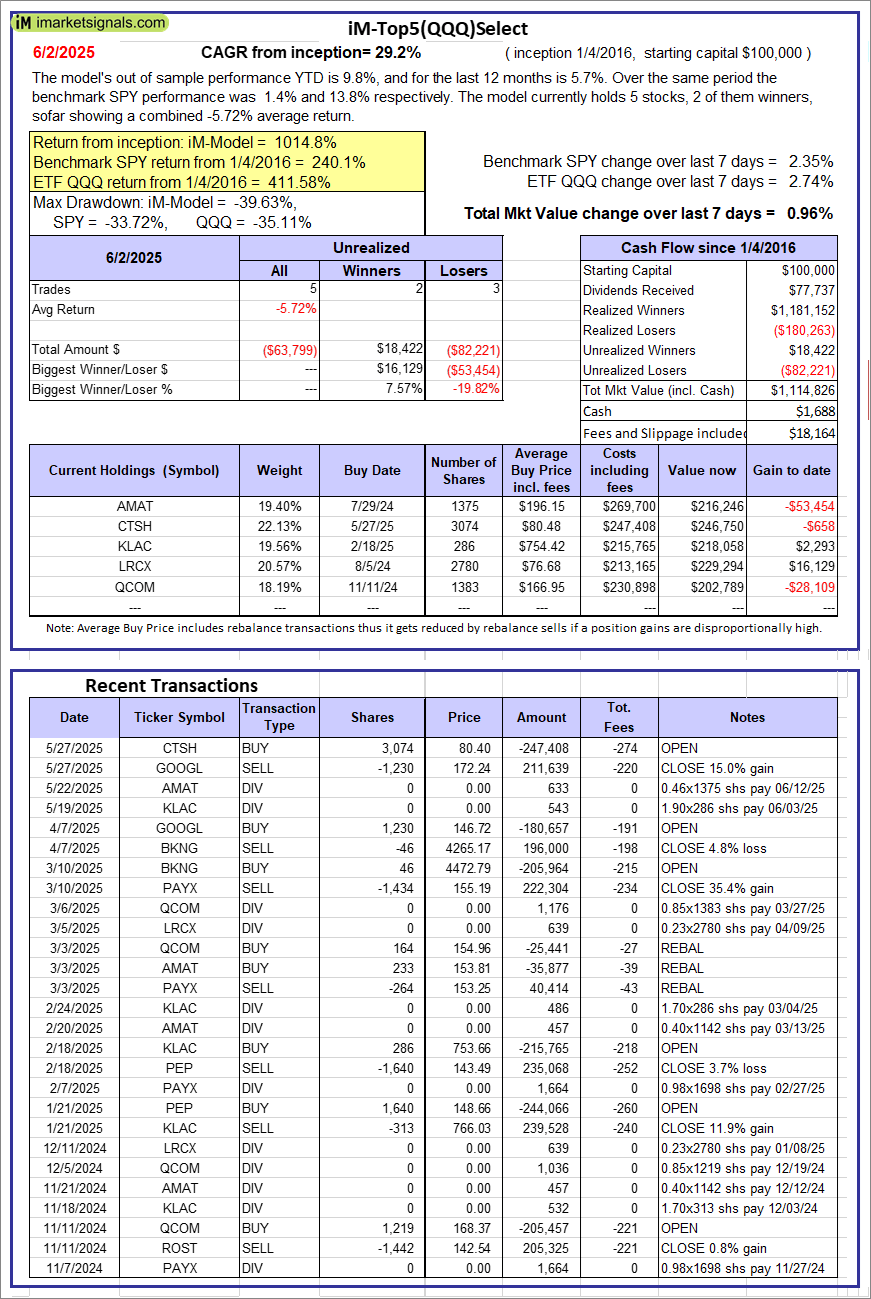 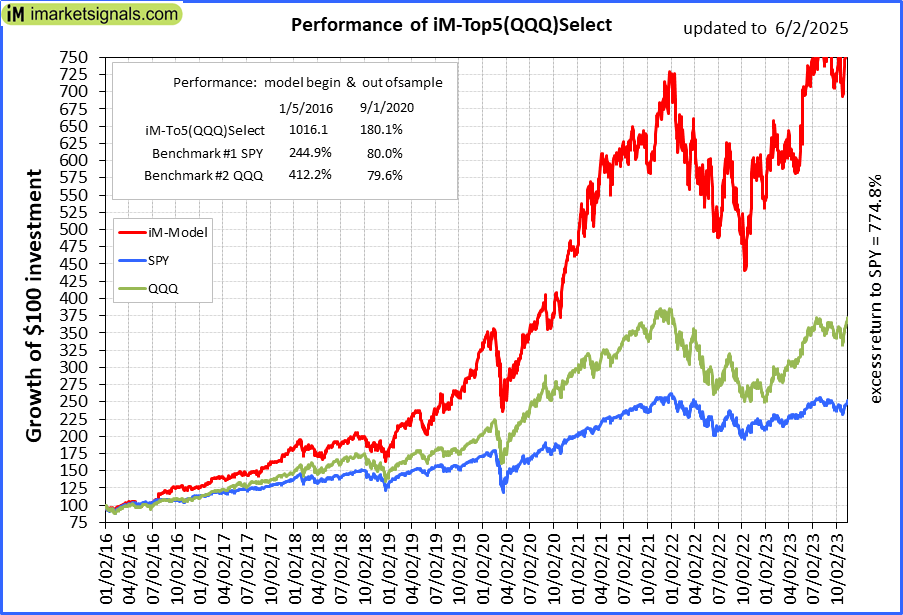 |
iM-Top5(QQQ)Select: Since inception, on 1/5/2016, the model gained 1014.83% while the benchmark SPY gained 240.07% over the same period. Over the previous week the market value of iM-Top5(QQQ)Select gained 0.96% at a time when SPY gained 2.35%. A starting capital of $100,000 at inception on 1/5/2016 would have grown to $1,114,826 which includes $1,688 cash and excludes $18,164 spent on fees and slippage. |
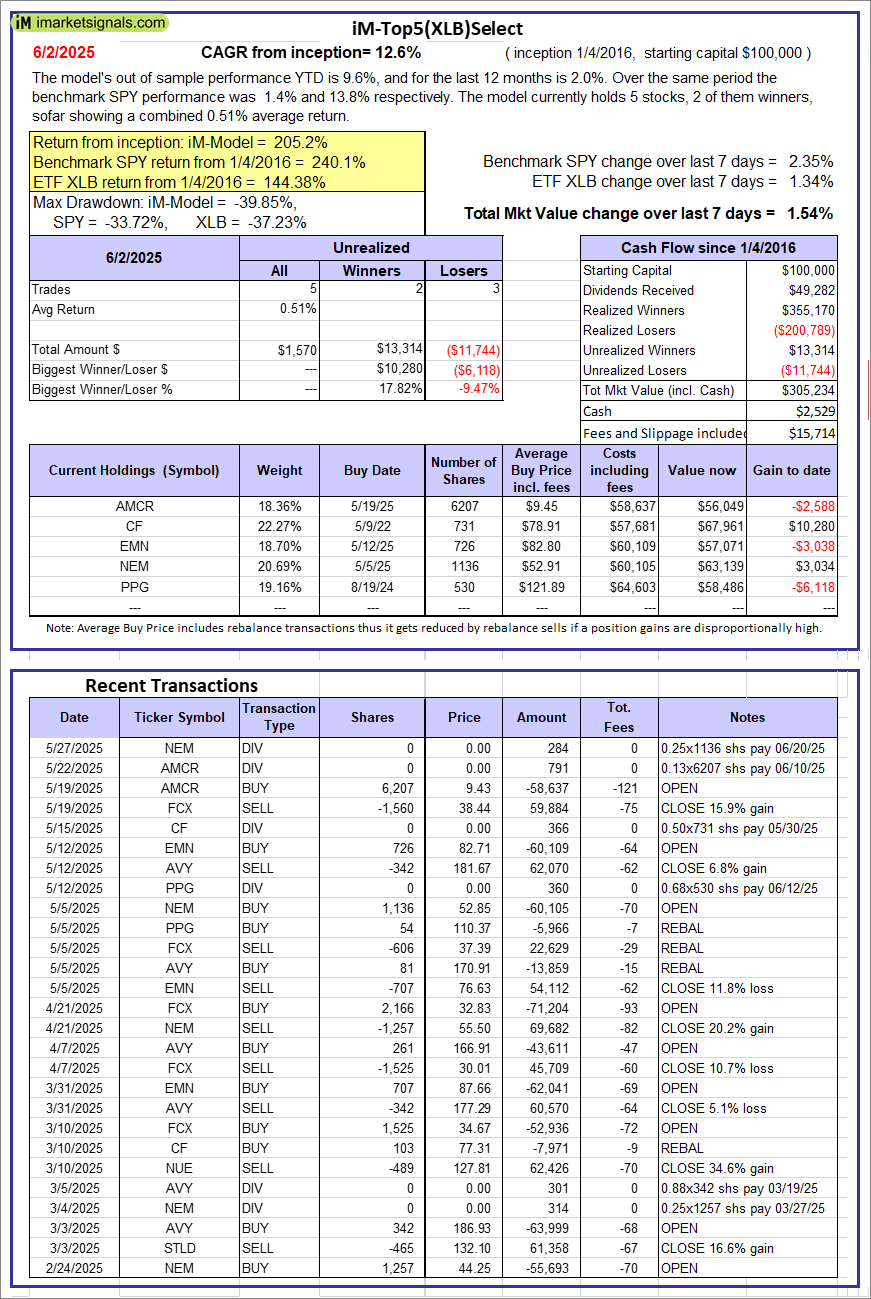 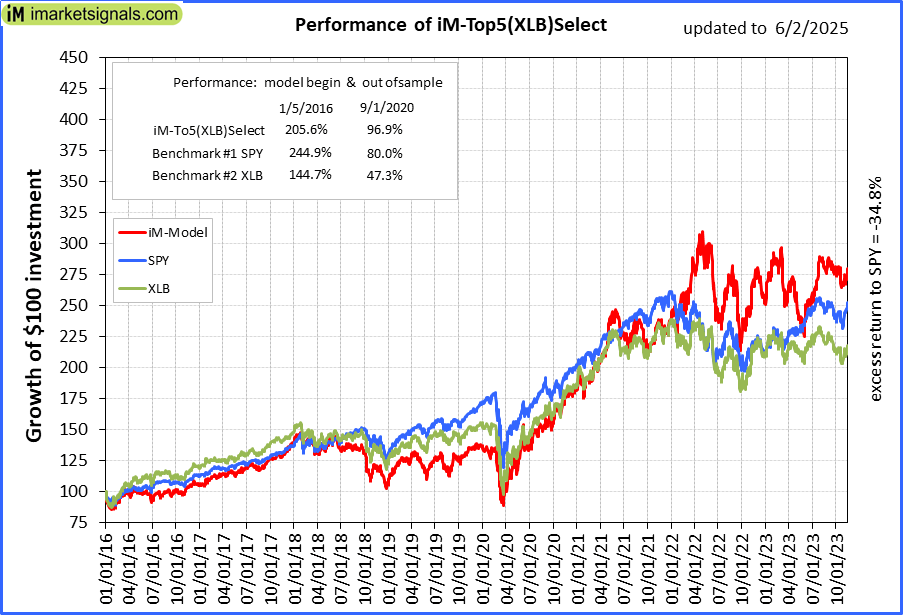 |
iM-Top5(XLB)Select: Since inception, on 1/5/2016, the model gained 205.23% while the benchmark SPY gained 240.07% over the same period. Over the previous week the market value of iM-Top5(XLB)Select gained 1.54% at a time when SPY gained 2.35%. A starting capital of $100,000 at inception on 1/5/2016 would have grown to $305,234 which includes $2,529 cash and excludes $15,714 spent on fees and slippage. |
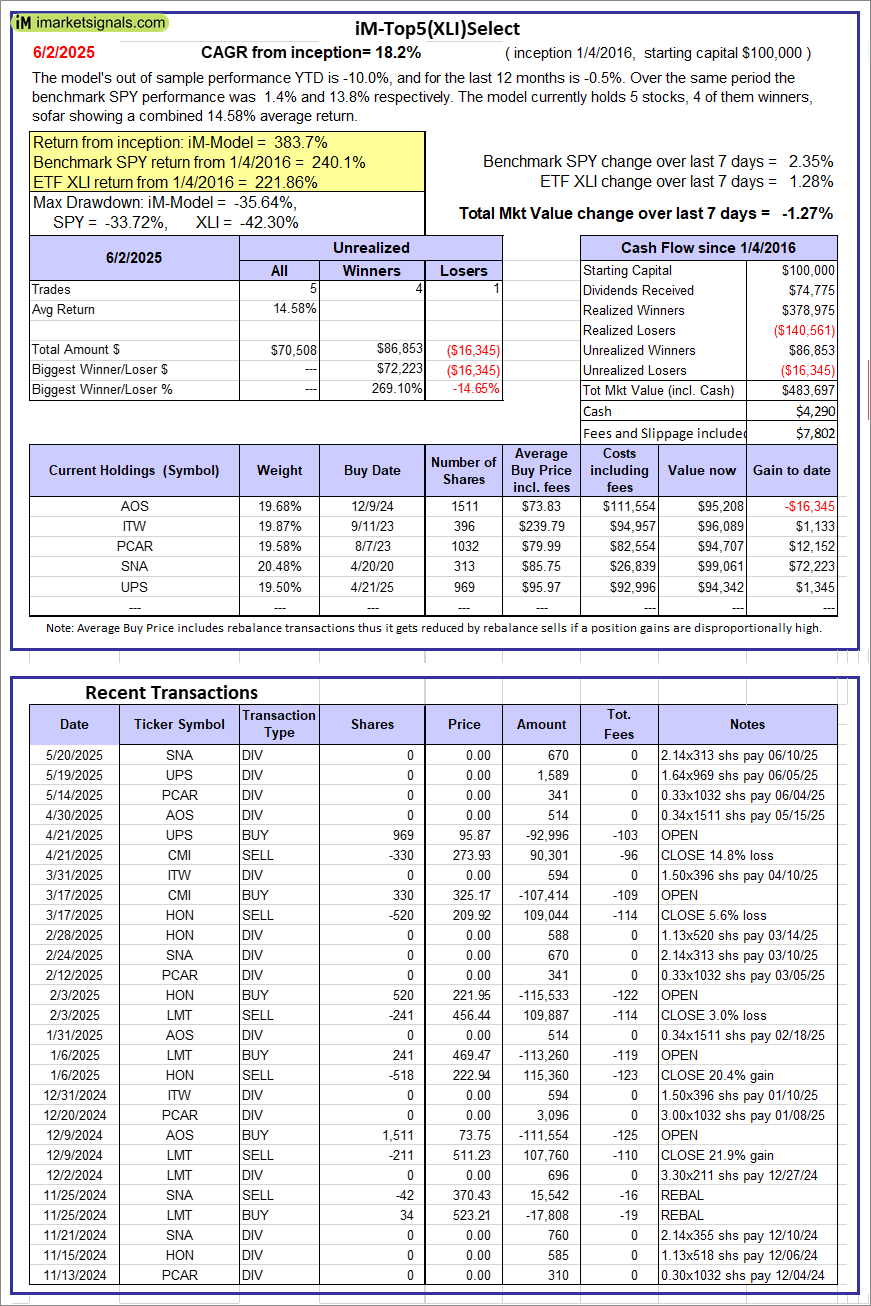 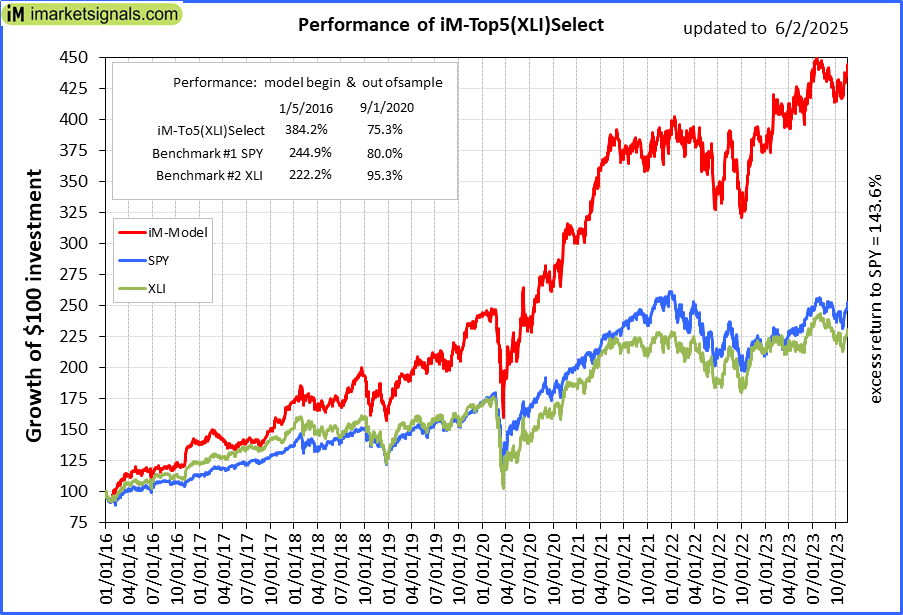 |
iM-Top5(XLI)Select: Since inception, on 1/5/2016, the model gained 383.70% while the benchmark SPY gained 240.07% over the same period. Over the previous week the market value of iM-Top5(XLI)Select gained -1.27% at a time when SPY gained 2.35%. A starting capital of $100,000 at inception on 1/5/2016 would have grown to $483,697 which includes $4,290 cash and excludes $7,802 spent on fees and slippage. |
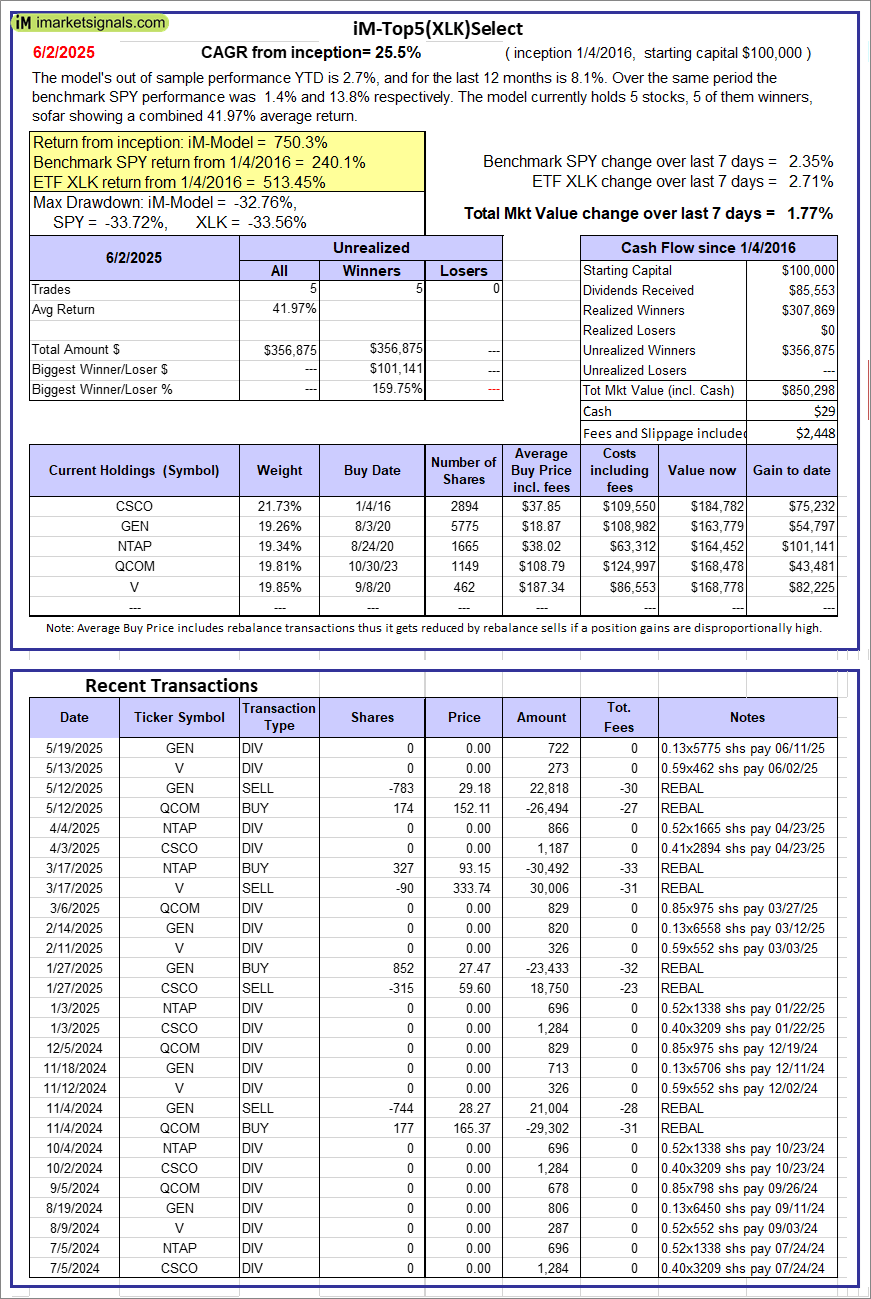 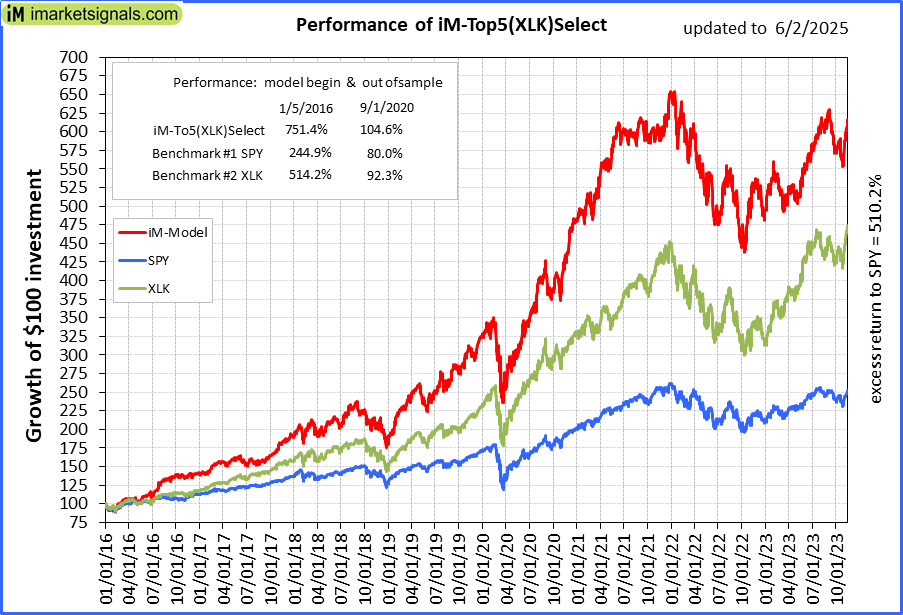 |
iM-Top5(XLK)Select: Since inception, on 1/5/2016, the model gained 750.30% while the benchmark SPY gained 240.07% over the same period. Over the previous week the market value of iM-Top5(XLK)Select gained 1.77% at a time when SPY gained 2.35%. A starting capital of $100,000 at inception on 1/5/2016 would have grown to $850,298 which includes $29 cash and excludes $2,448 spent on fees and slippage. |
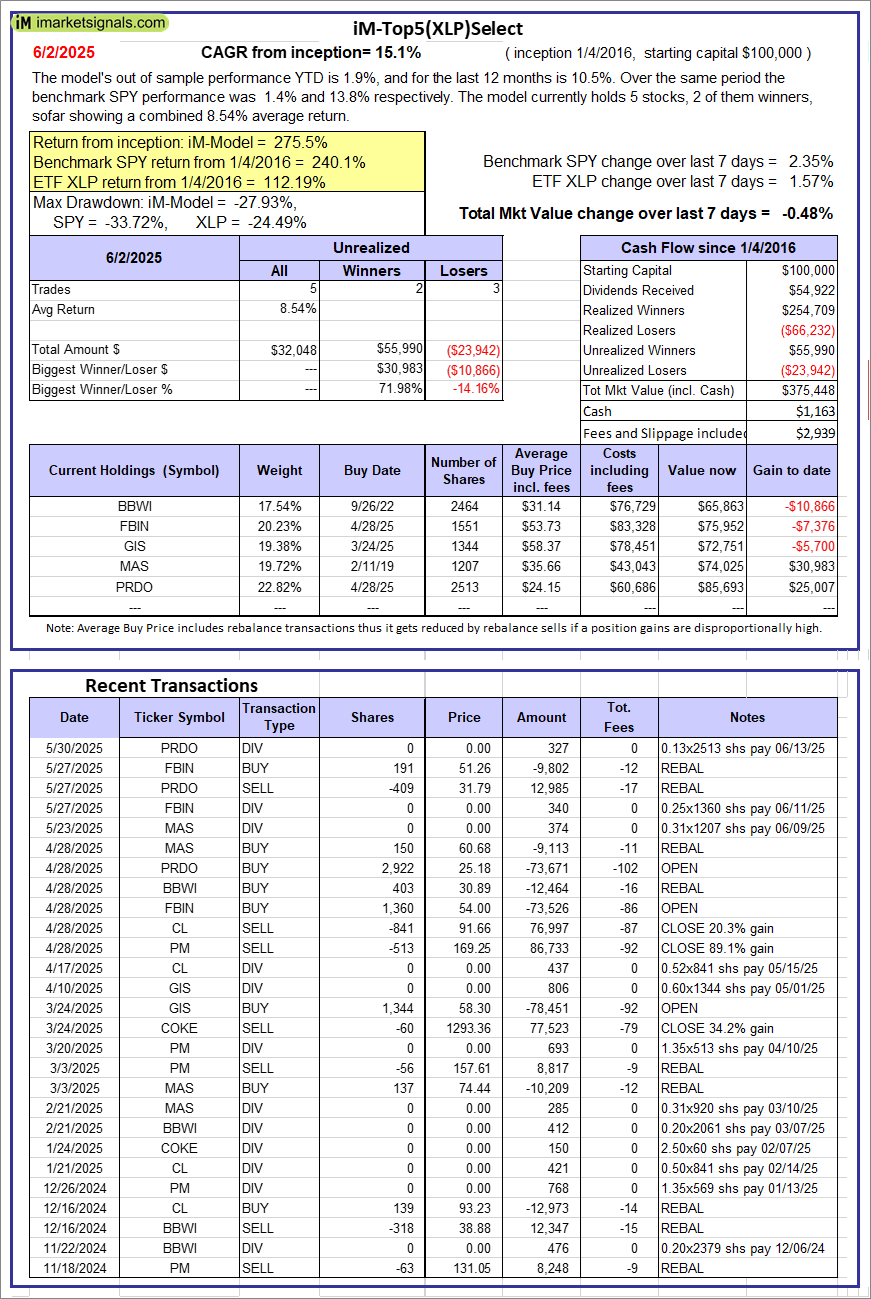 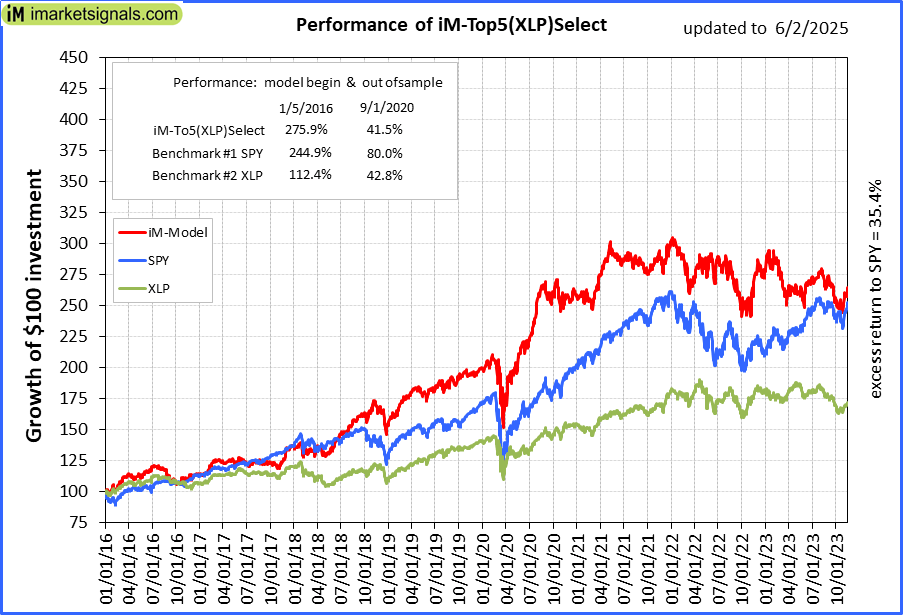 |
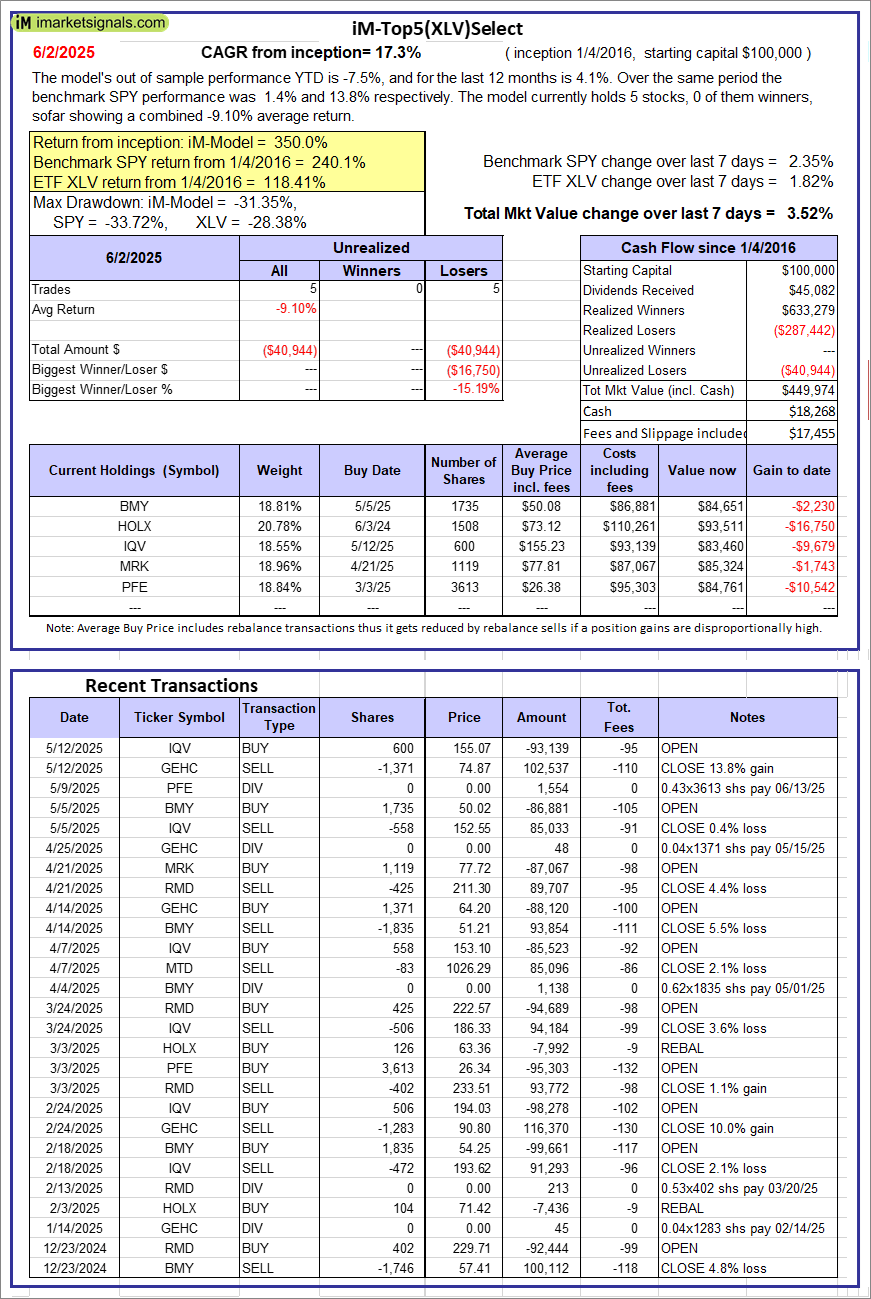
iM-Top5(XLP)Select: Since inception, on 1/5/2016, the model gained 275.45% while the benchmark SPY gained 240.07% over the same period. Over the previous week the market value of iM-Top5(XLP)Select gained -0.48% at a time when SPY gained 2.35%. A starting capital of $100,000 at inception on 1/5/2016 would have grown to $375,448 which includes $1,163 cash and excludes $2,939 spent on fees and slippage. |
 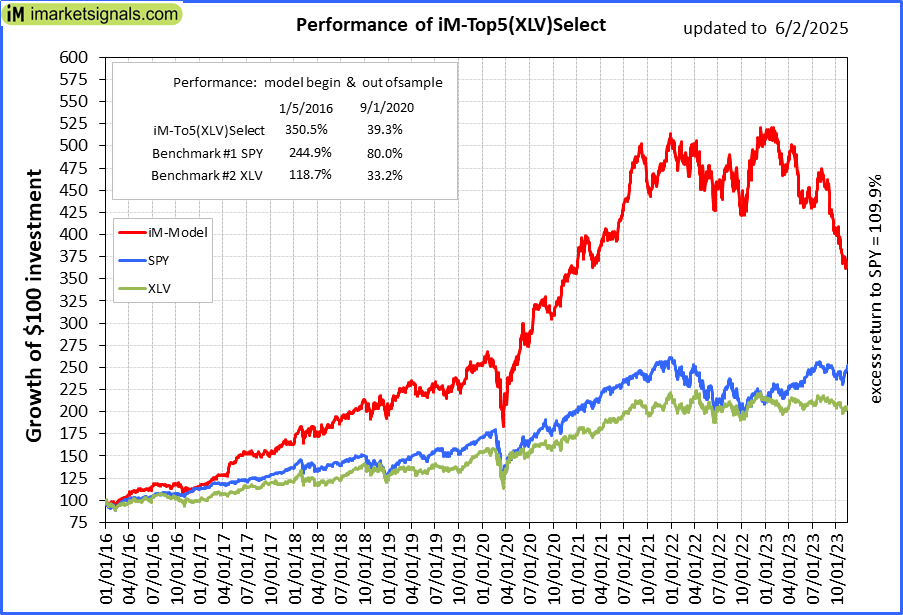 |
iM-Top5(XLV)Select: Since inception, on 1/5/2016, the model gained 349.97% while the benchmark SPY gained 240.07% over the same period. Over the previous week the market value of iM-Top5(XLV)Select gained 3.52% at a time when SPY gained 2.35%. A starting capital of $100,000 at inception on 1/5/2016 would have grown to $449,974 which includes $18,268 cash and excludes $17,455 spent on fees and slippage. |
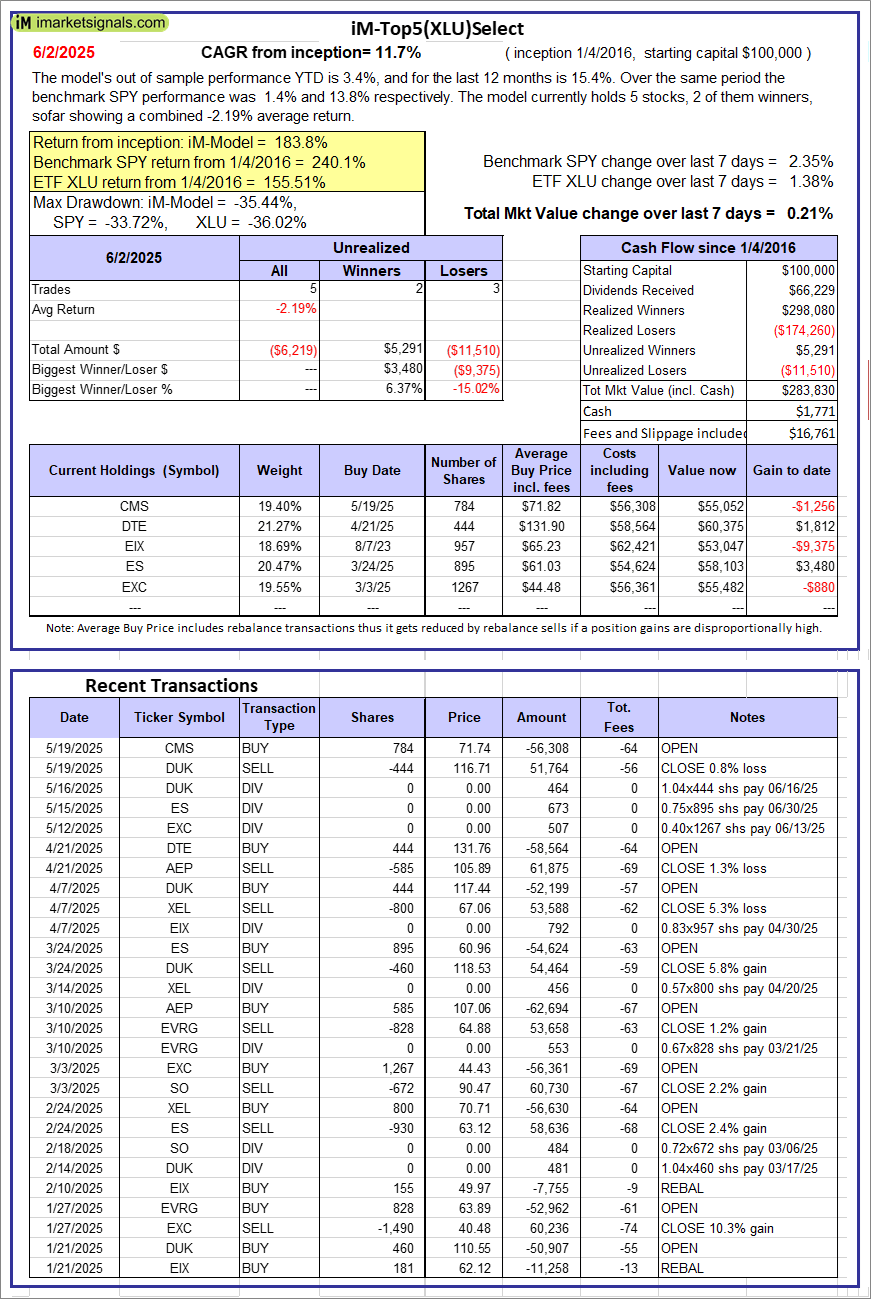 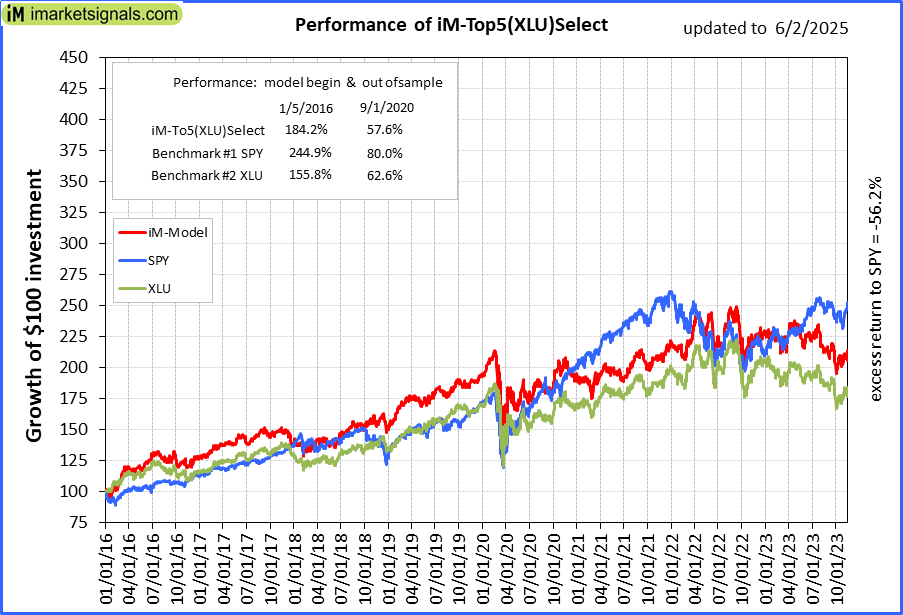 |
iM-Top5(XLU)Select: Since inception, on 1/5/2016, the model gained 183.83% while the benchmark SPY gained 240.07% over the same period. Over the previous week the market value of iM-Top5(XLU)Select gained 0.21% at a time when SPY gained 2.35%. A starting capital of $100,000 at inception on 1/5/2016 would have grown to $283,830 which includes $1,771 cash and excludes $16,761 spent on fees and slippage. |
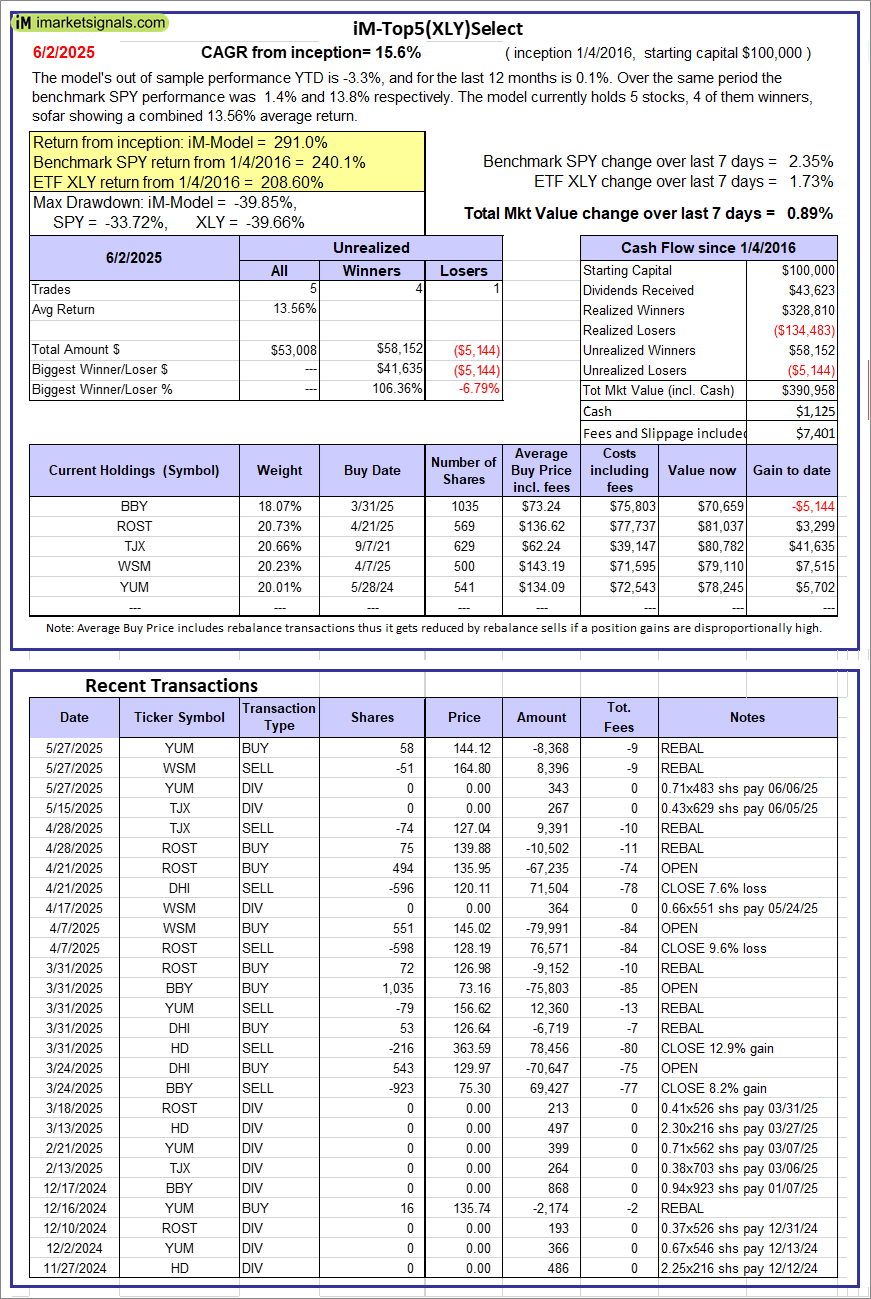 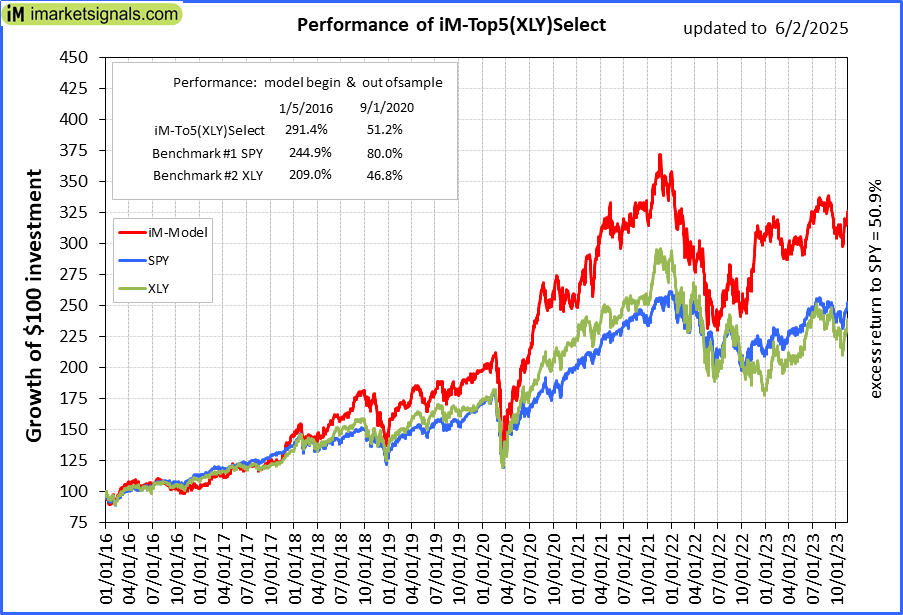 |
iM-Top5(XLY)Select: Since inception, on 1/5/2016, the model gained 290.96% while the benchmark SPY gained 240.07% over the same period. Over the previous week the market value of iM-Top5(XLY)Select gained 0.89% at a time when SPY gained 2.35%. A starting capital of $100,000 at inception on 1/5/2016 would have grown to $390,958 which includes $1,125 cash and excludes $7,401 spent on fees and slippage. |
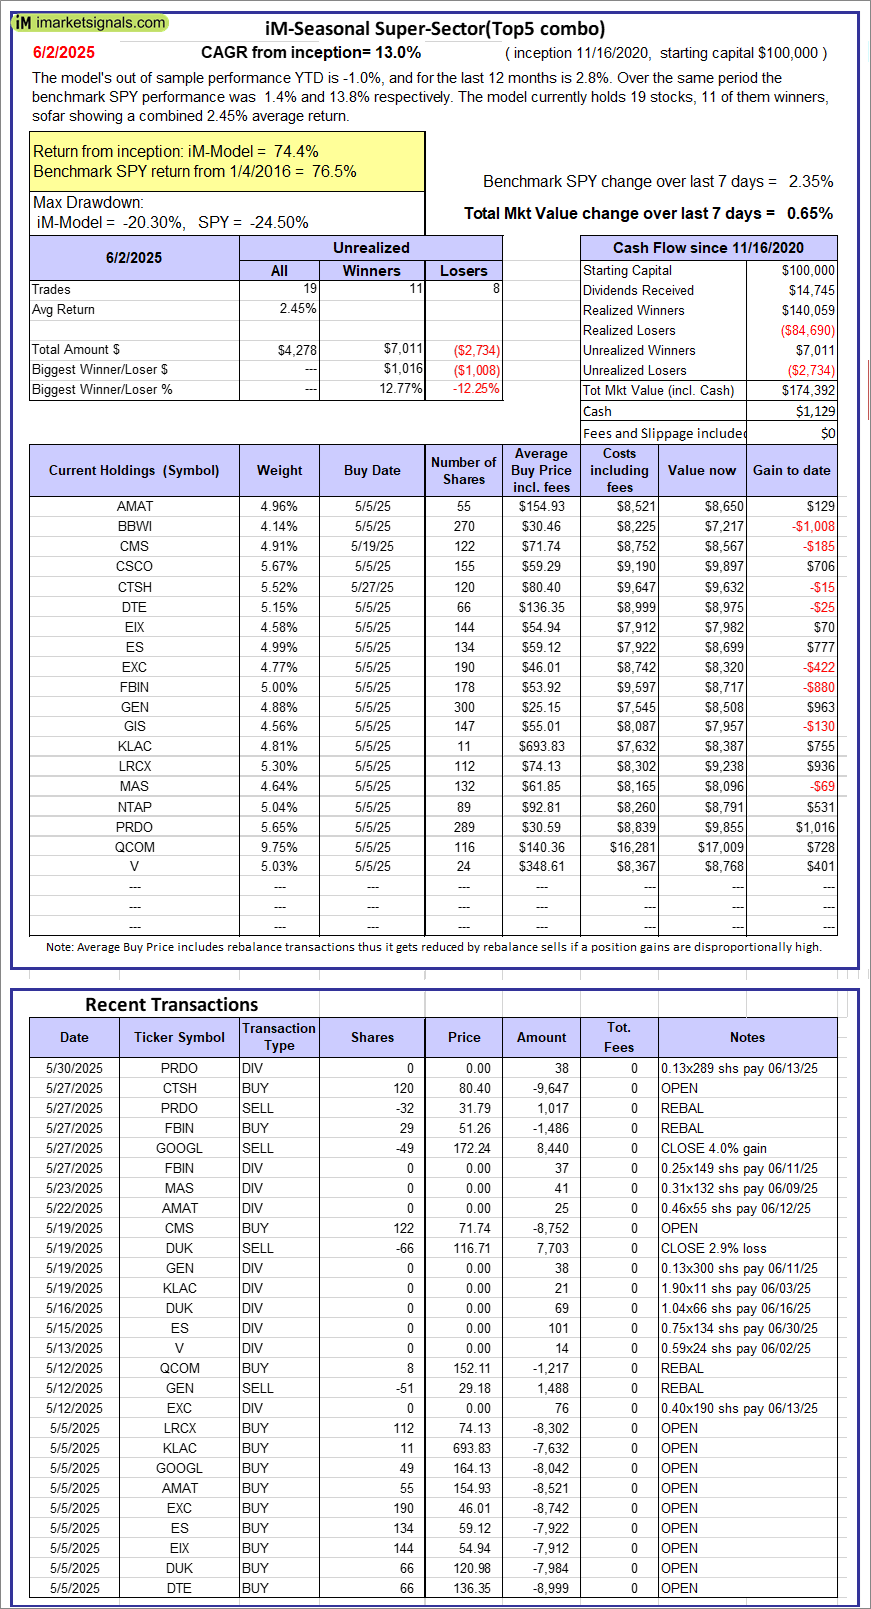 |
iM-Seasonal Super-Sectors (Top5 combo) : Since inception, on 11/17/2020, the model gained 74.39% while the benchmark SPY gained 76.53% over the same period. Over the previous week the market value of iM-Seasonal Super-Sectors (Top5 combo) gained 0.65% at a time when SPY gained 2.35%. A starting capital of $100,000 at inception on 11/17/2020 would have grown to $174,392 which includes $1,129 cash and excludes $00 spent on fees and slippage. |
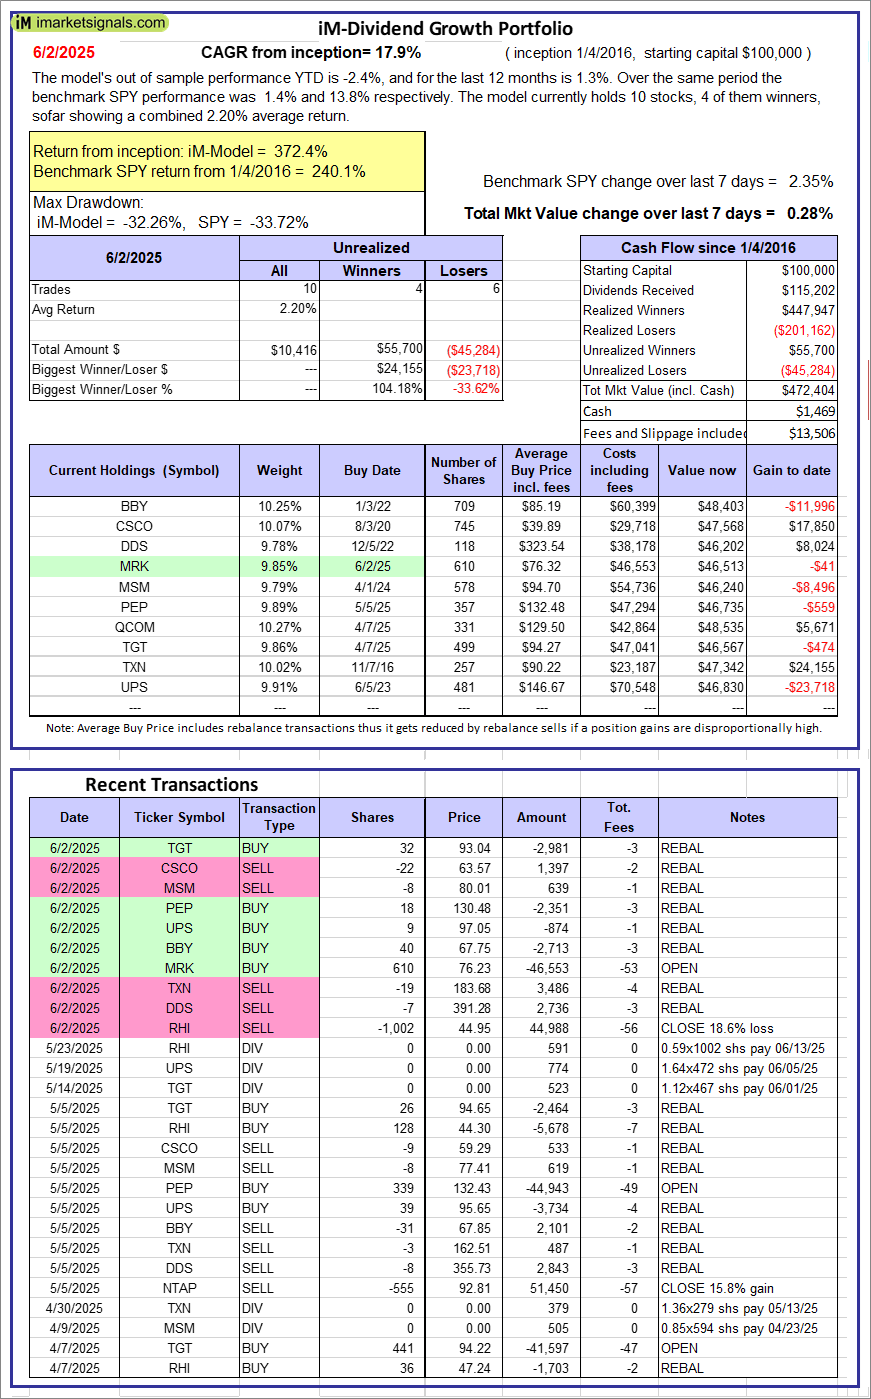 |
iM-Dividend Growth Portfolio: The model’s out of sample performance YTD is -2.4%, and for the last 12 months is 1.3%. Over the same period the benchmark SPY performance was 1.4% and 13.8% respectively. Over the previous week the market value of the iM-Dividend Growth Portfolio gained 0.28% at a time when SPY gained 2.35%. A starting capital of $100,000 at inception on 6/30/2016 would have grown to $472,404 which includes $1,469 cash and excludes $13,506 spent on fees and slippage. |
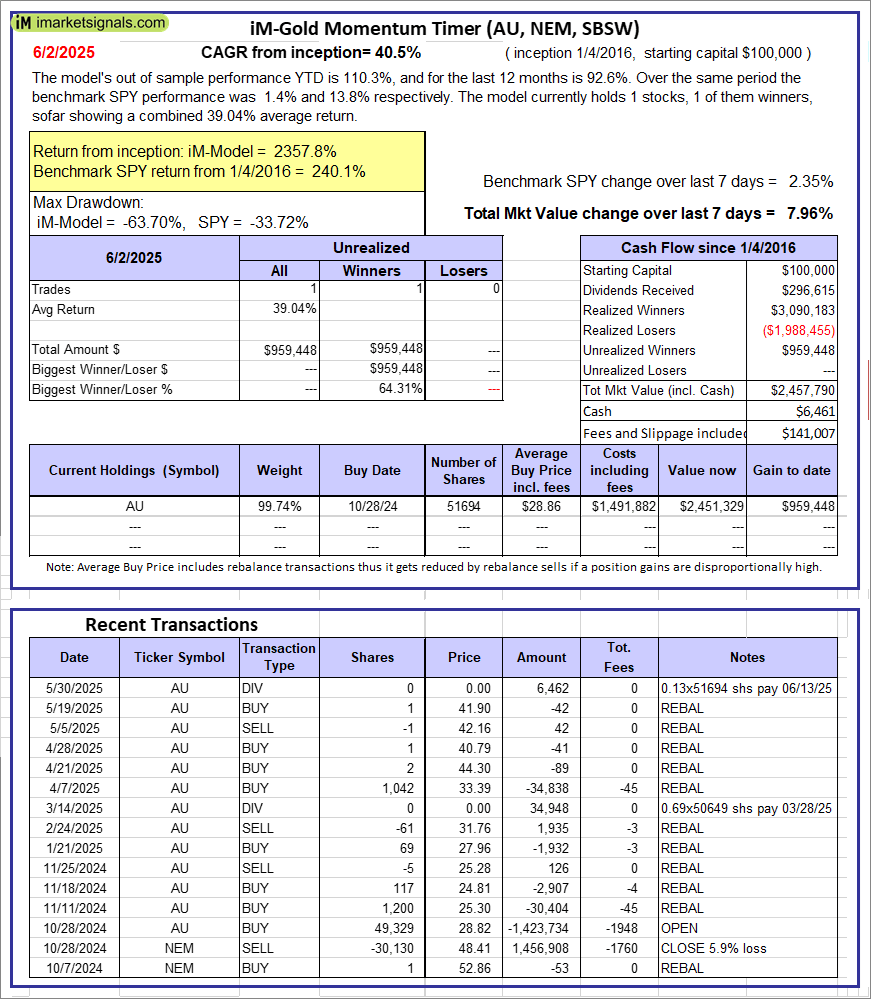 |
iM-Gold Momentum Timer (AU, NEM, SBSW): The model’s out of sample performance YTD is 110.3%, and for the last 12 months is 92.6%. Over the same period the benchmark SPY performance was 1.4% and 13.8% respectively. Over the previous week the market value of iM-Gold Momentum Timer (AU, NEM, SBSW) gained 7.96% at a time when SPY gained 2.35%. A starting capital of $100,000 at inception on 6/30/2016 would have grown to $6,461 which includes $141,007 cash and excludes Gain to date spent on fees and slippage. |
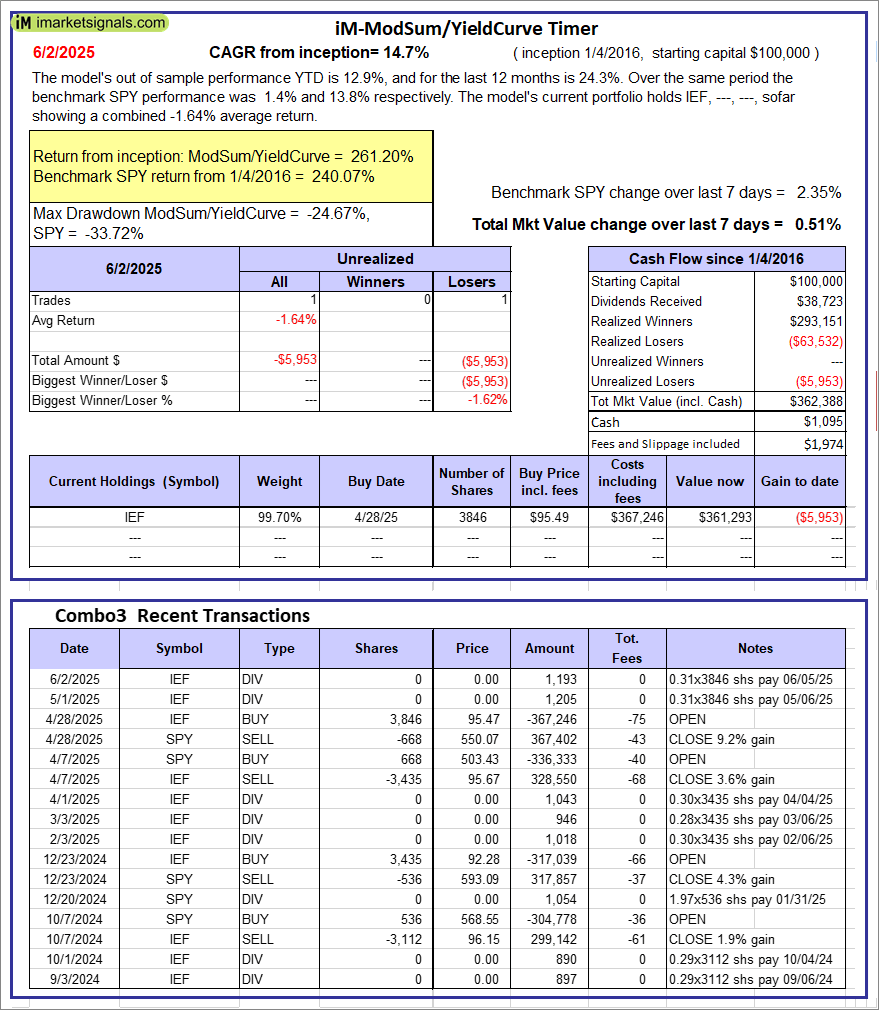 |
iM-ModSum/YieldCurve Timer: The model’s out of sample performance YTD is 12.9%, and for the last 12 months is 24.3%. Over the same period the benchmark SPY performance was 1.4% and 13.8% respectively. Over the previous week the market value of iM-PortSum/YieldCurve Timer gained 0.51% at a time when SPY gained 2.35%. A starting capital of $100,000 at inception on 1/1/2016 would have grown to $362,388 which includes $1,095 cash and excludes $1,974 spent on fees and slippage. |
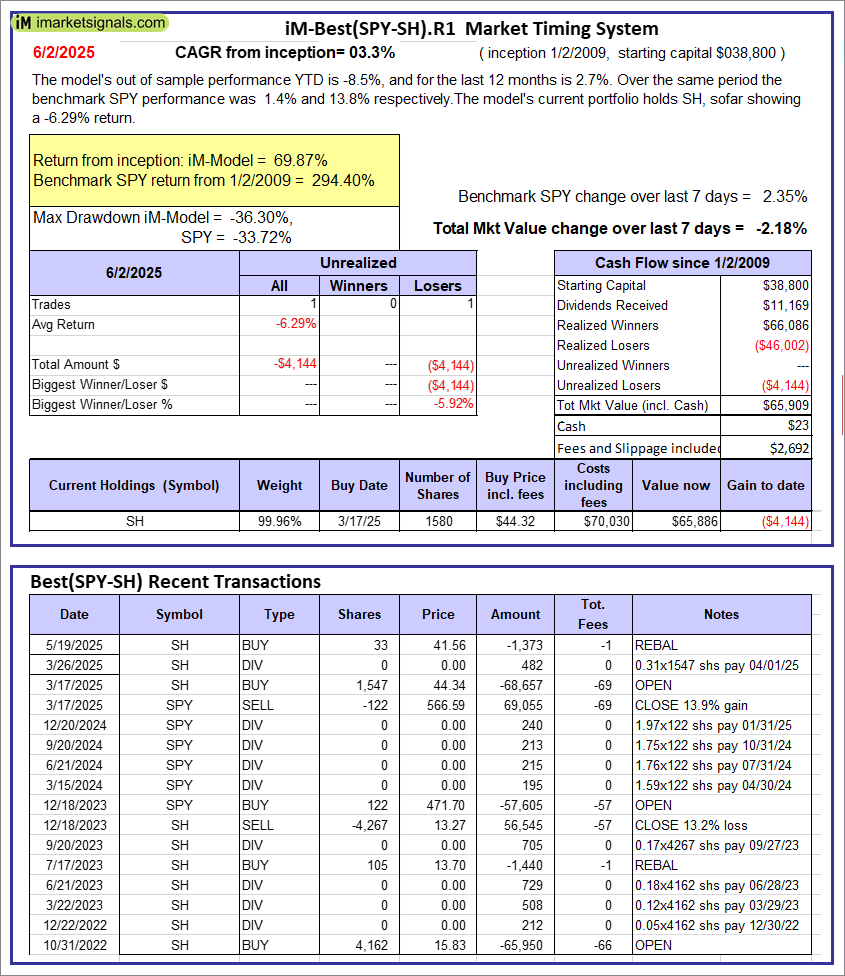 |
iM-Best(SPY-SH).R1: The model’s out of sample performance YTD is -8.5%, and for the last 12 months is 2.7%. Over the same period the benchmark SPY performance was 1.4% and 13.8% respectively. Over the previous week the market value of Best(SPY-SH) gained -2.18% at a time when SPY gained 2.35%. A starting capital of $100,000 at inception on 1/2/2009 would have grown to $65,909 which includes $23 cash and excludes $2,692 spent on fees and slippage. |
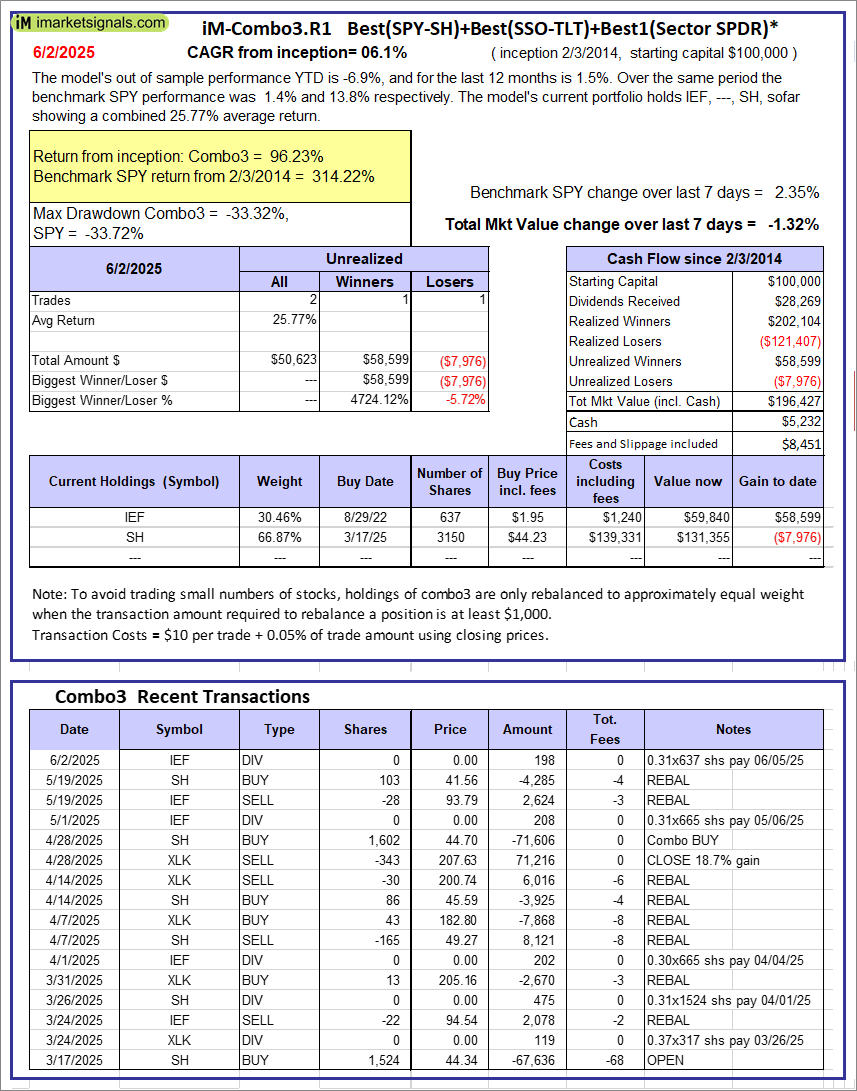 |
iM-Combo3.R1: The model’s out of sample performance YTD is -6.9%, and for the last 12 months is 1.5%. Over the same period the benchmark SPY performance was 1.4% and 13.8% respectively. Over the previous week the market value of iM-Combo3.R1 gained -1.32% at a time when SPY gained 2.35%. A starting capital of $100,000 at inception on 2/3/2014 would have grown to $196,427 which includes $5,232 cash and excludes $8,451 spent on fees and slippage. |
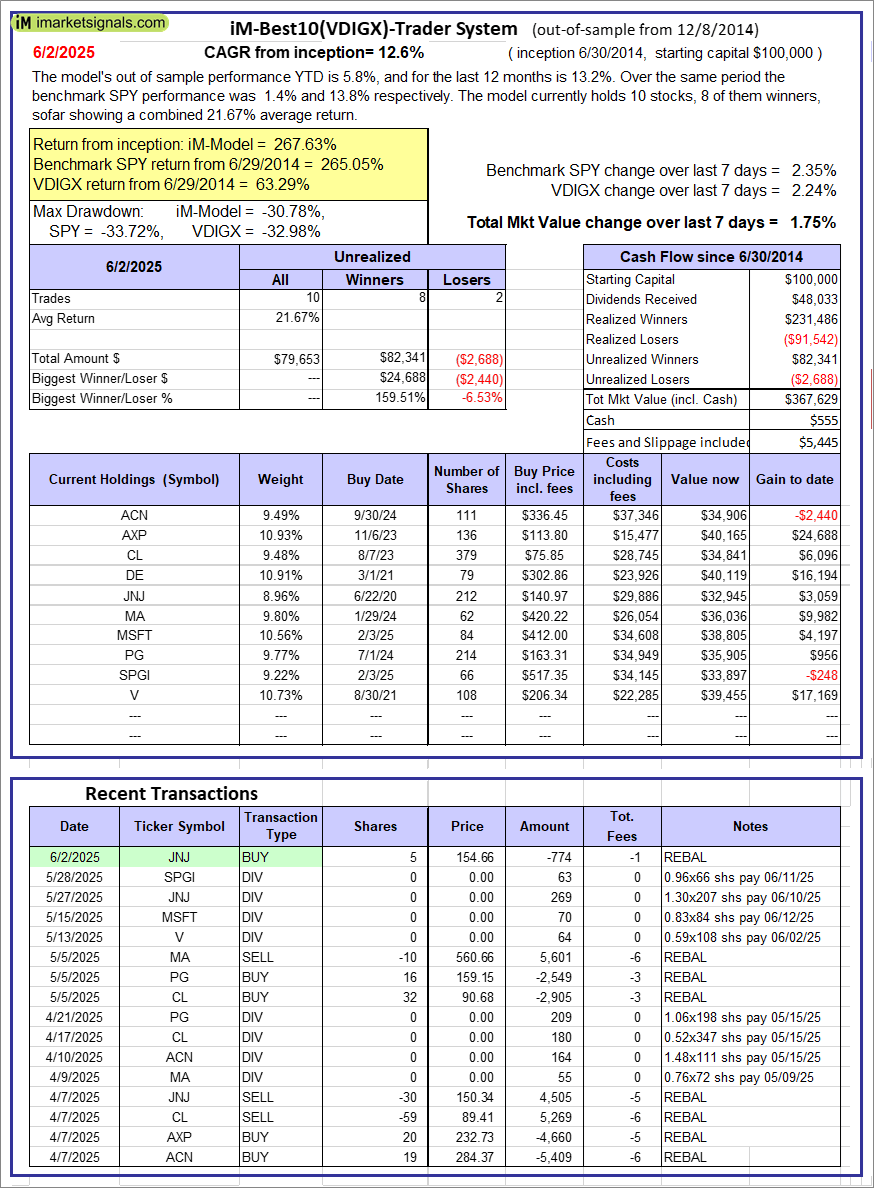 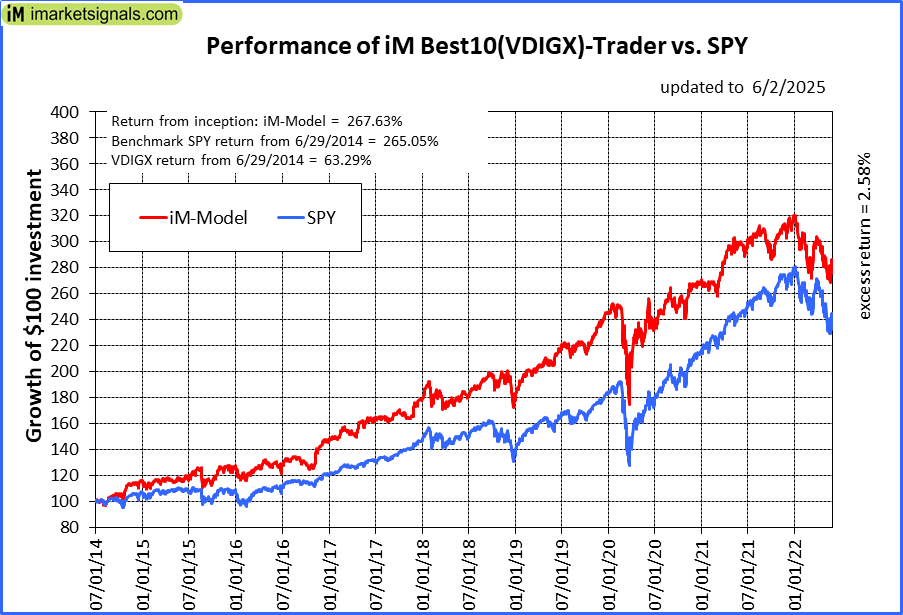 |
iM-Best10(VDIGX)-Trader: The model’s out of sample performance YTD is 5.8%, and for the last 12 months is 13.2%. Over the same period the benchmark SPY performance was 1.4% and 13.8% respectively. Since inception, on 7/1/2014, the model gained 267.63% while the benchmark SPY gained 265.05% and VDIGX gained 63.29% over the same period. Over the previous week the market value of iM-Best10(VDIGX) gained 1.75% at a time when SPY gained 2.35%. A starting capital of $100,000 at inception on 7/1/2014 would have grown to $367,629 which includes $555 cash and excludes $5,445 spent on fees and slippage. |
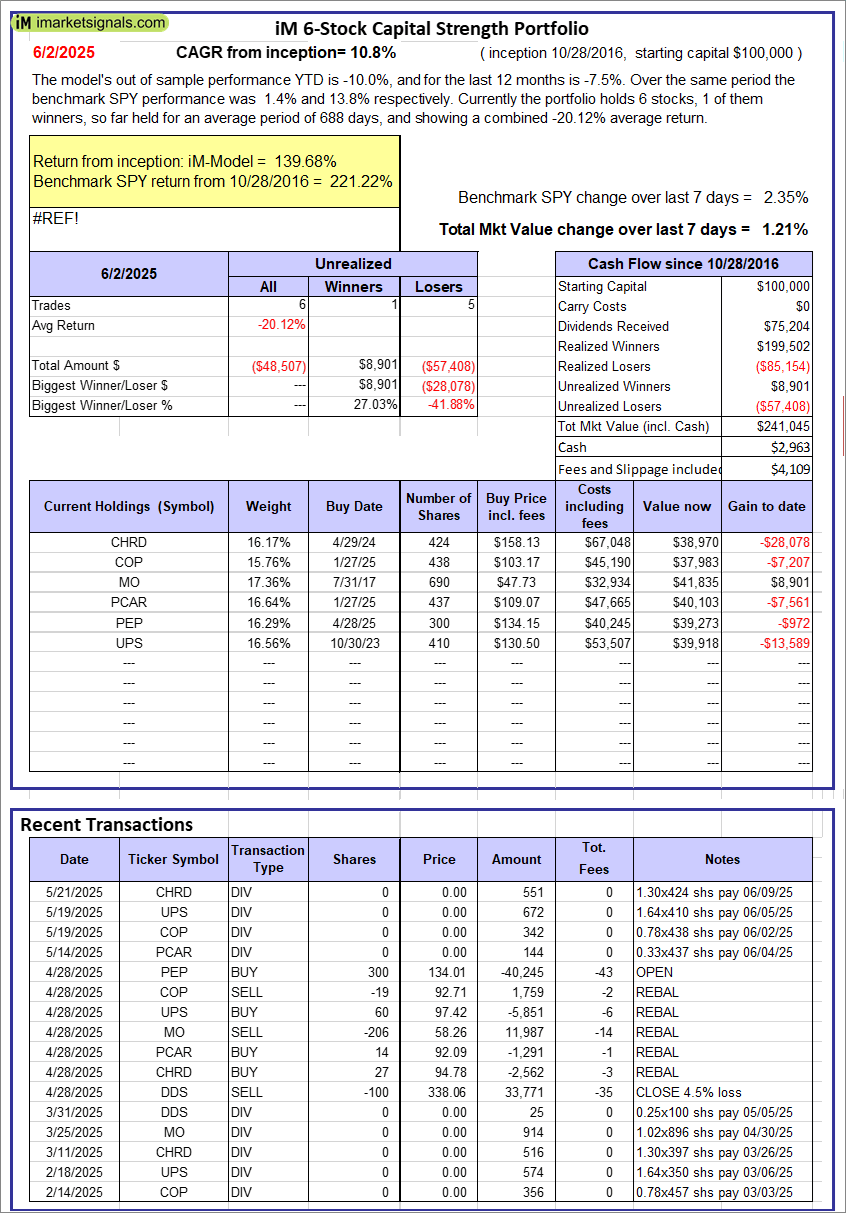 |
iM 6-Stock Capital Strength Portfolio: The model’s out of sample performance YTD is -10.0%, and for the last 12 months is -7.5%. Over the same period the benchmark SPY performance was 1.4% and 13.8% respectively. Over the previous week the market value of the iM 6-Stock Capital Strength Portfolio gained 1.21% at a time when SPY gained 2.35%. A starting capital of $100,000 at inception on 10/28/2016 would have grown to $241,045 which includes $2,963 cash and excludes $4,109 spent on fees and slippage. |
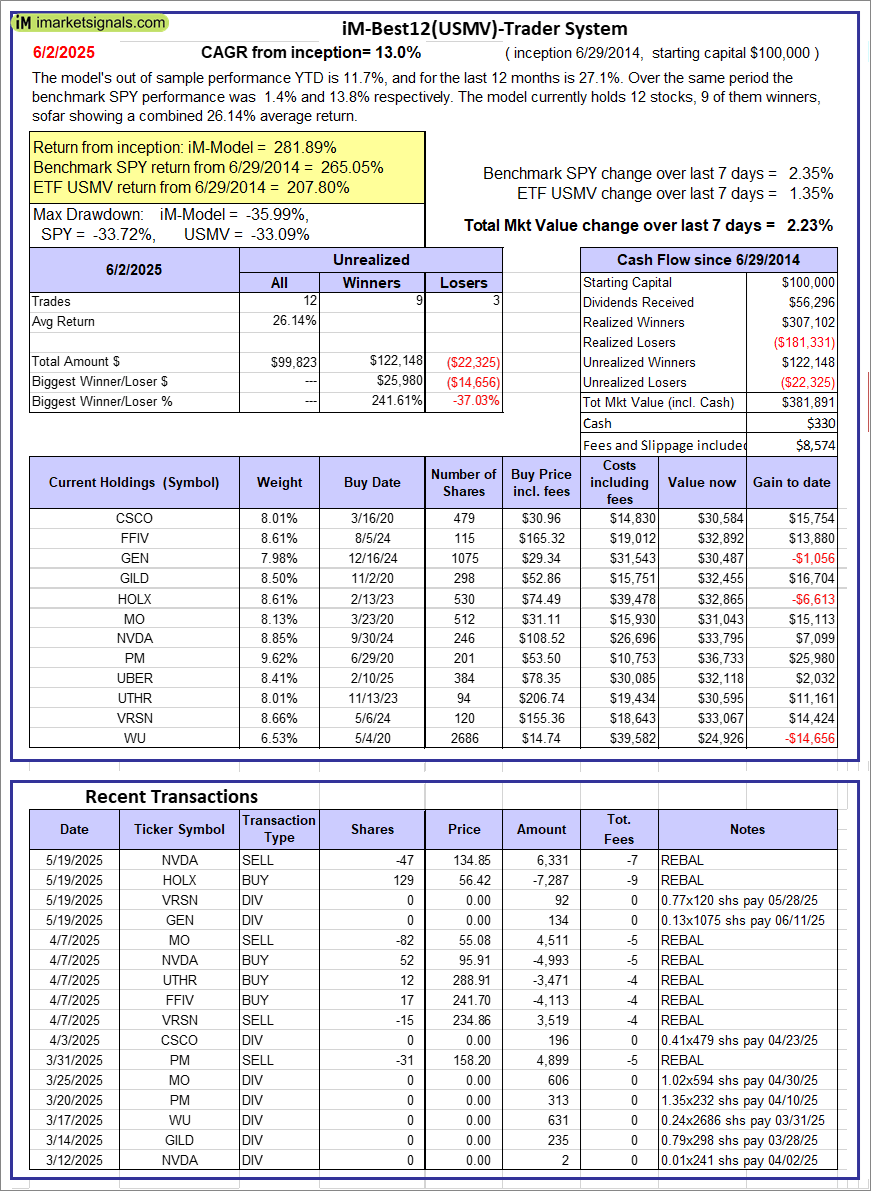 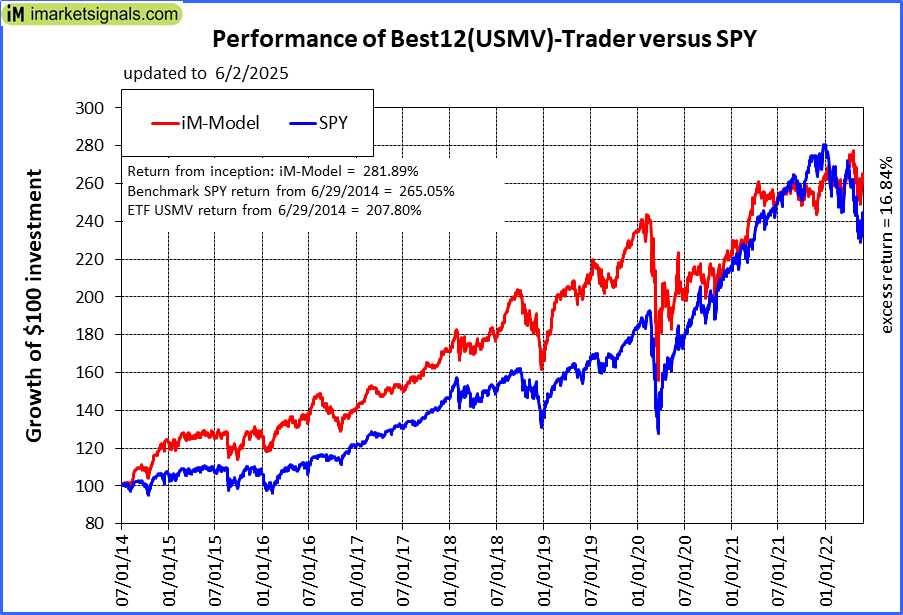 |
iM-Best12(USMV)-Trader: The model’s out of sample performance YTD is 11.7%, and for the last 12 months is 27.1%. Over the same period the benchmark SPY performance was 1.4% and 13.8% respectively. Since inception, on 6/30/2014, the model gained 281.89% while the benchmark SPY gained 265.05% and the ETF USMV gained 207.80% over the same period. Over the previous week the market value of iM-Best12(USMV)-Trader gained 2.23% at a time when SPY gained 2.35%. A starting capital of $100,000 at inception on 6/30/2014 would have grown to $381,891 which includes $330 cash and excludes $8,574 spent on fees and slippage. |
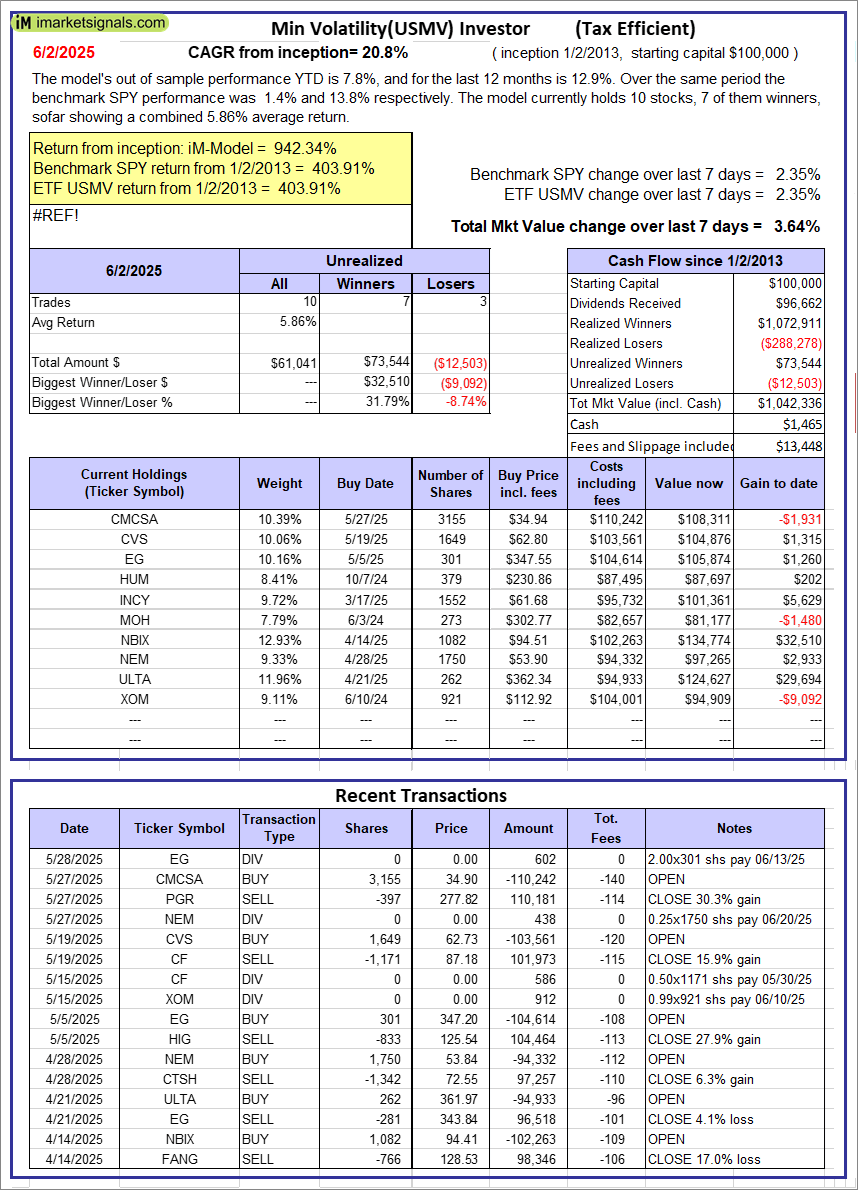 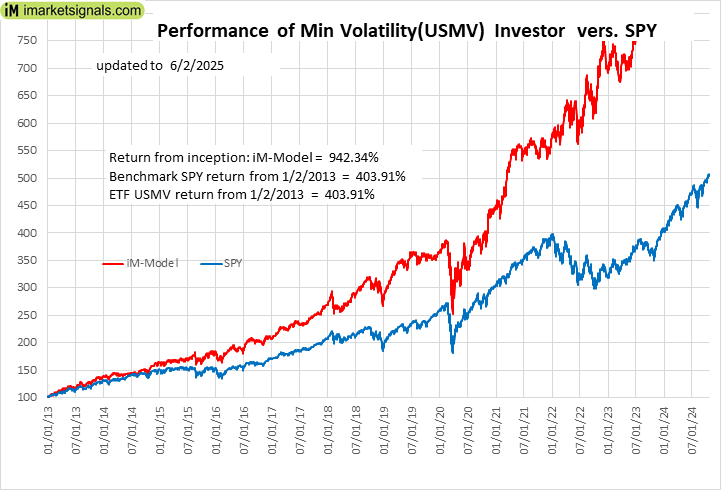 |
iM-Min Volatility(USMV) Investor (Tax Efficient): The model’s out of sample performance YTD is 7.8%, and for the last 12 months is 12.9%. Over the same period the benchmark SPY performance was 1.4% and 13.8% respectively. Since inception, on 1/3/2013, the model gained 942.34% while the benchmark SPY gained 403.91% and the ETF USMV gained 403.91% over the same period. Over the previous week the market value of iM-Best12(USMV)Q1 gained 3.64% at a time when SPY gained 2.35%. A starting capital of $100,000 at inception on 1/3/2013 would have grown to $1,042,336 which includes $1,465 cash and excludes $13,448 spent on fees and slippage. |
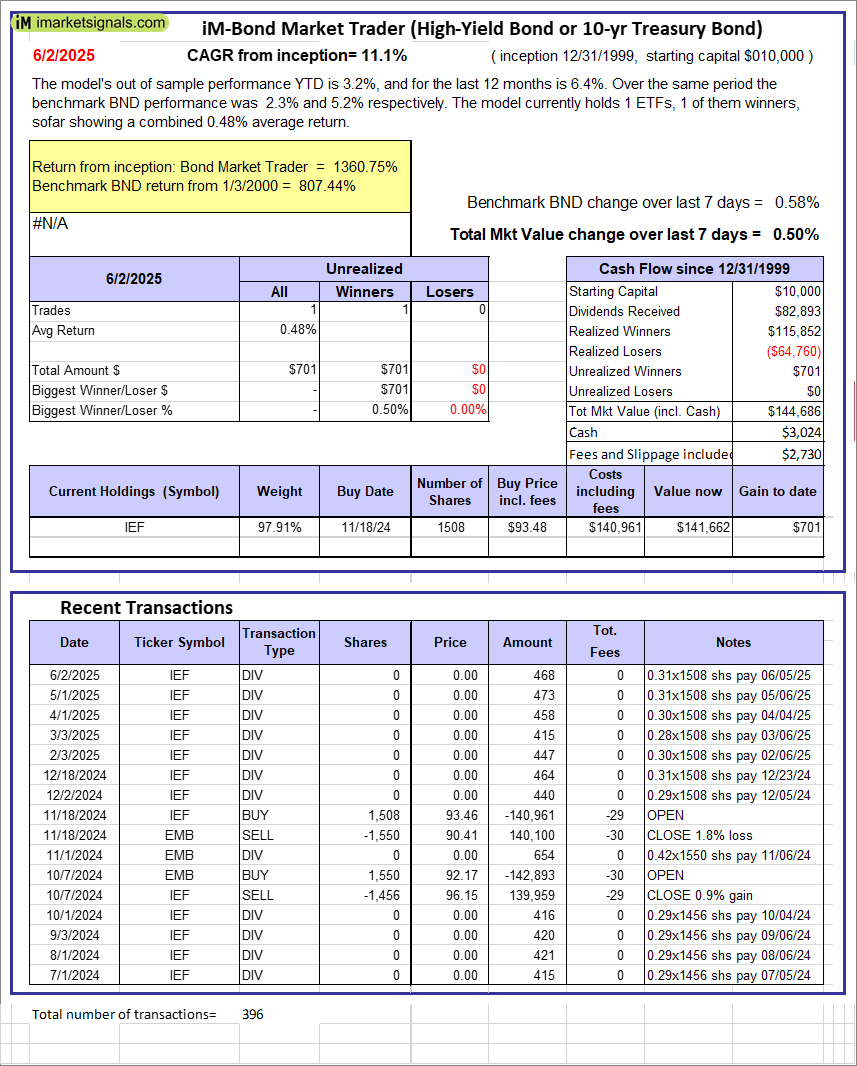 |
iM-Bond Market Trader (High-Yield Bond or 10-yr Treasury Bond): The model’s out of sample performance YTD is 3.2%, and for the last 12 months is 6.4%. Over the same period the benchmark BND performance was 2.3% and 5.2% respectively. Over the previous week the market value of the iM-Bond Market Trader (High-Yield Bond or 10-yr Treasury Bond) gained 0.50% at a time when BND gained 0.58%. A starting capital of $10,000 at inception on 1/3/2000 would have grown to $144,686 which includes $3,024 cash and excludes $2,730 spent on fees and slippage. |
|
|
iM-ModSum/YieldCurve Timer: The model’s out of sample performance YTD is 12.9%, and for the last 12 months is 24.3%. Over the same period the benchmark SPY performance was 1.4% and 13.8% respectively. Over the previous week the market value of iM-PortSum/YieldCurve Timer gained 0.51% at a time when SPY gained 2.35%. A starting capital of $100,000 at inception on 1/1/2016 would have grown to $362,388 which includes $1,095 cash and excludes $1,974 spent on fees and slippage. |
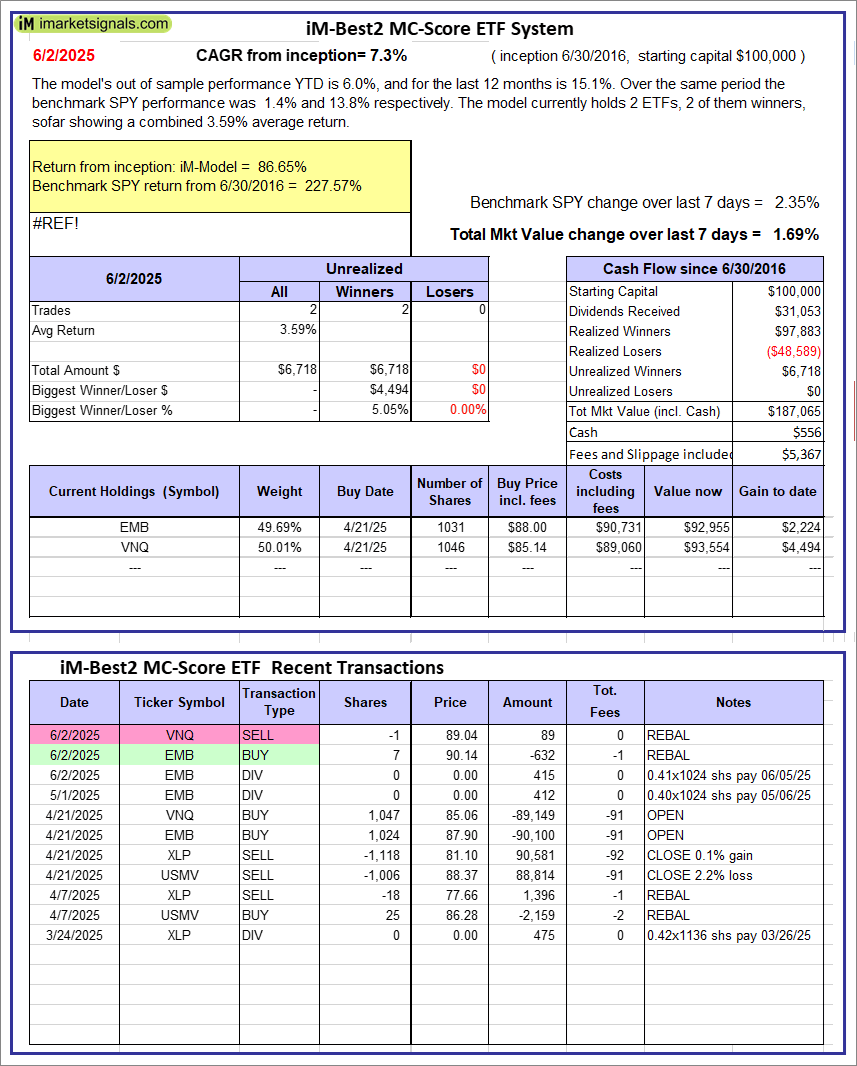 |
iM-Best2 MC-Score ETF System: The model’s out of sample performance YTD is 6.0%, and for the last 12 months is 15.1%. Over the same period the benchmark SPY performance was 1.4% and 13.8% respectively. Over the previous week the market value of the iM-Best2 MC-Score ETF System gained 1.69% at a time when SPY gained 2.35%. A starting capital of $100,000 at inception on 6/30/2016 would have grown to $187,065 which includes $556 cash and excludes $5,367 spent on fees and slippage. |
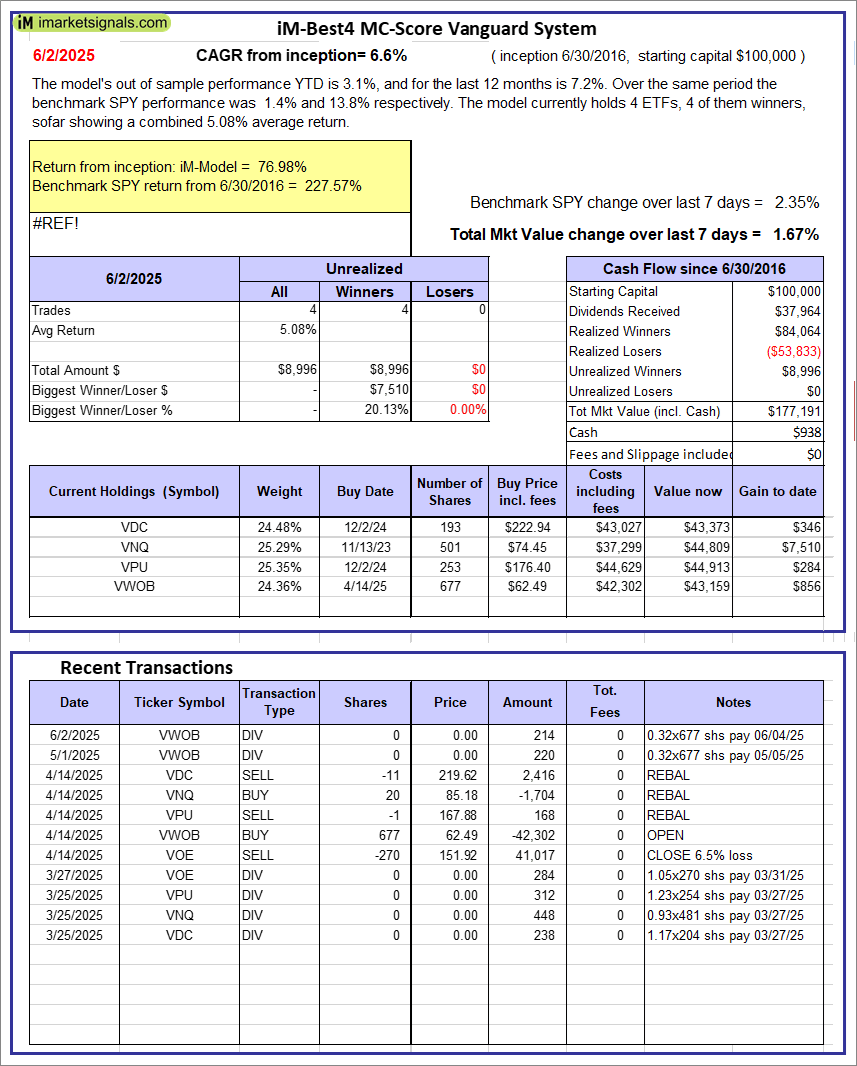 |
iM-Best4 MC-Score Vanguard System: The model’s out of sample performance YTD is 3.1%, and for the last 12 months is 7.2%. Over the same period the benchmark SPY performance was 1.4% and 13.8% respectively. Over the previous week the market value of the iM-Best4 MC-Score Vanguard System gained 1.67% at a time when SPY gained 2.35%. A starting capital of $100,000 at inception on 6/30/2016 would have grown to $177,191 which includes $938 cash and excludes $00 spent on fees and slippage. |
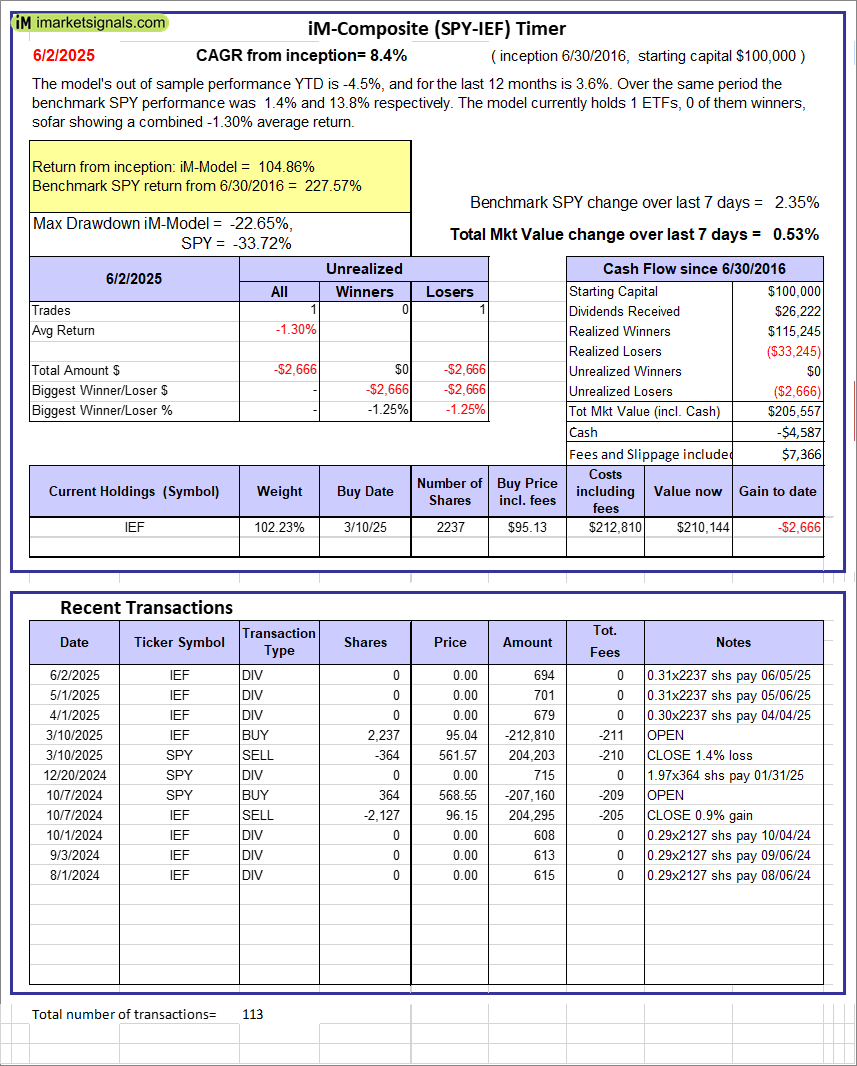 |
iM-Composite (SPY-IEF) Timer: The model’s out of sample performance YTD is -4.5%, and for the last 12 months is 3.6%. Over the same period the benchmark SPY performance was 1.4% and 13.8% respectively. Over the previous week the market value of the iM-Composite (SPY-IEF) Timer gained 0.53% at a time when SPY gained 2.35%. A starting capital of $100,000 at inception on 6/30/2016 would have grown to $205,557 which includes -$4,587 cash and excludes $7,366 spent on fees and slippage. |
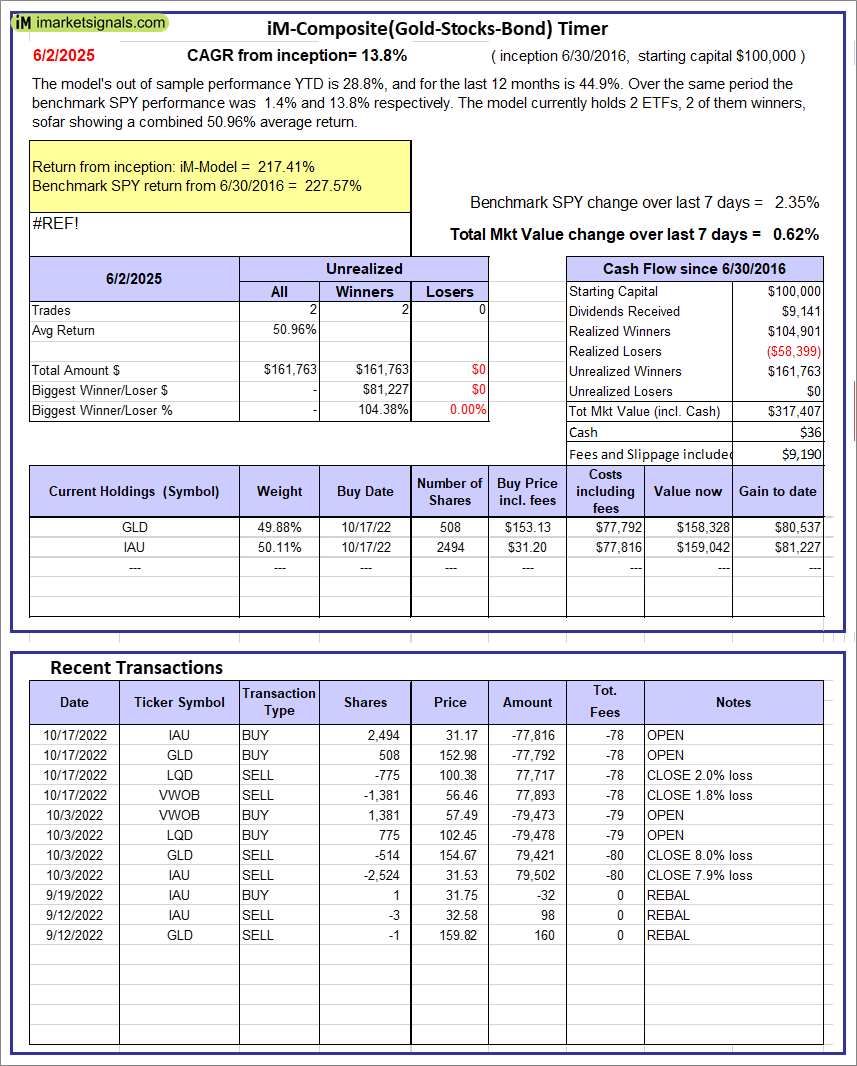 |
iM-Composite(Gold-Stocks-Bond) Timer: The model’s out of sample performance YTD is 28.8%, and for the last 12 months is 44.9%. Over the same period the benchmark SPY performance was 1.4% and 13.8% respectively. Over the previous week the market value of the iM-Composite(Gold-Stocks-Bond) Timer gained 0.62% at a time when SPY gained 2.35%. A starting capital of $100,000 at inception on 6/30/2016 would have grown to $317,407 which includes $36 cash and excludes $9,190 spent on fees and slippage. |
iM-Best Reports – 6/3/2025
Posted in pmp SPY-SH
Leave a Reply
You must be logged in to post a comment.