
  |
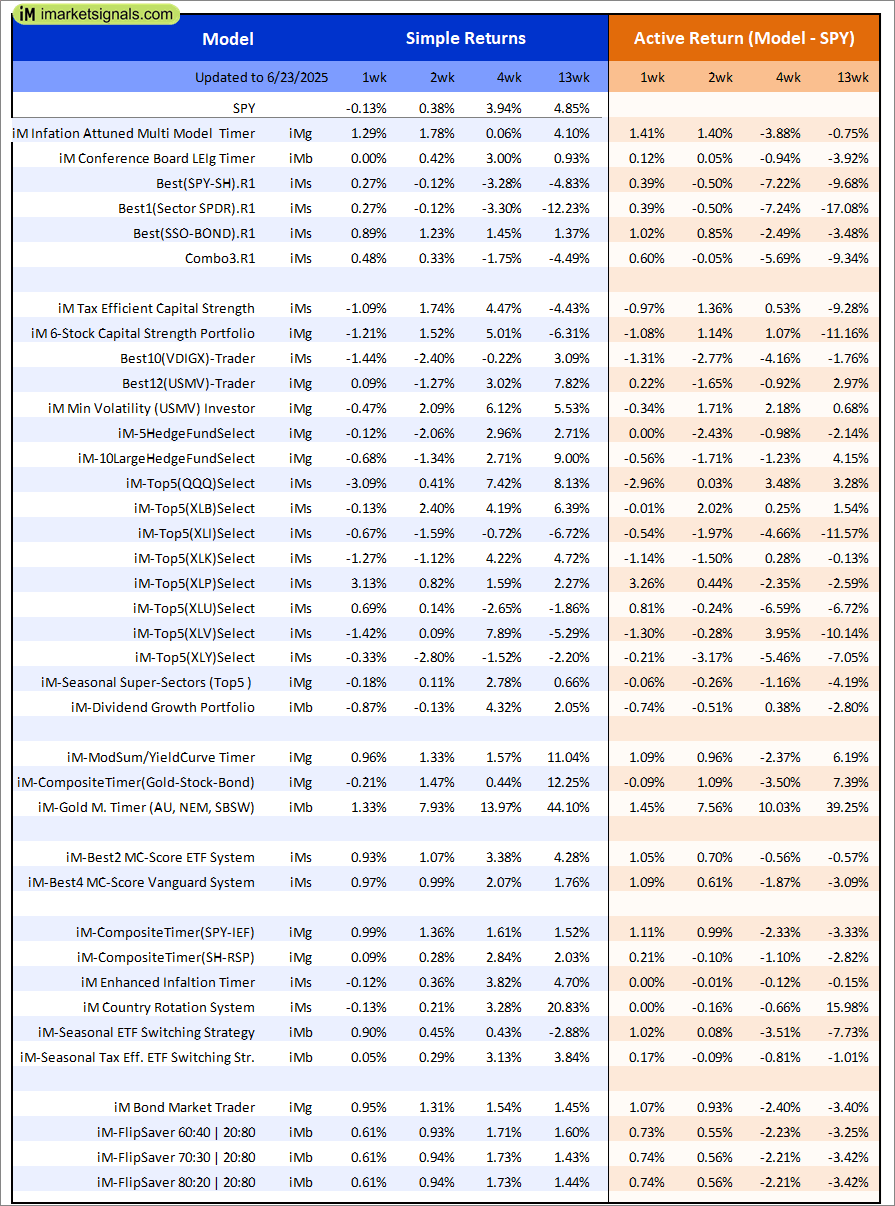
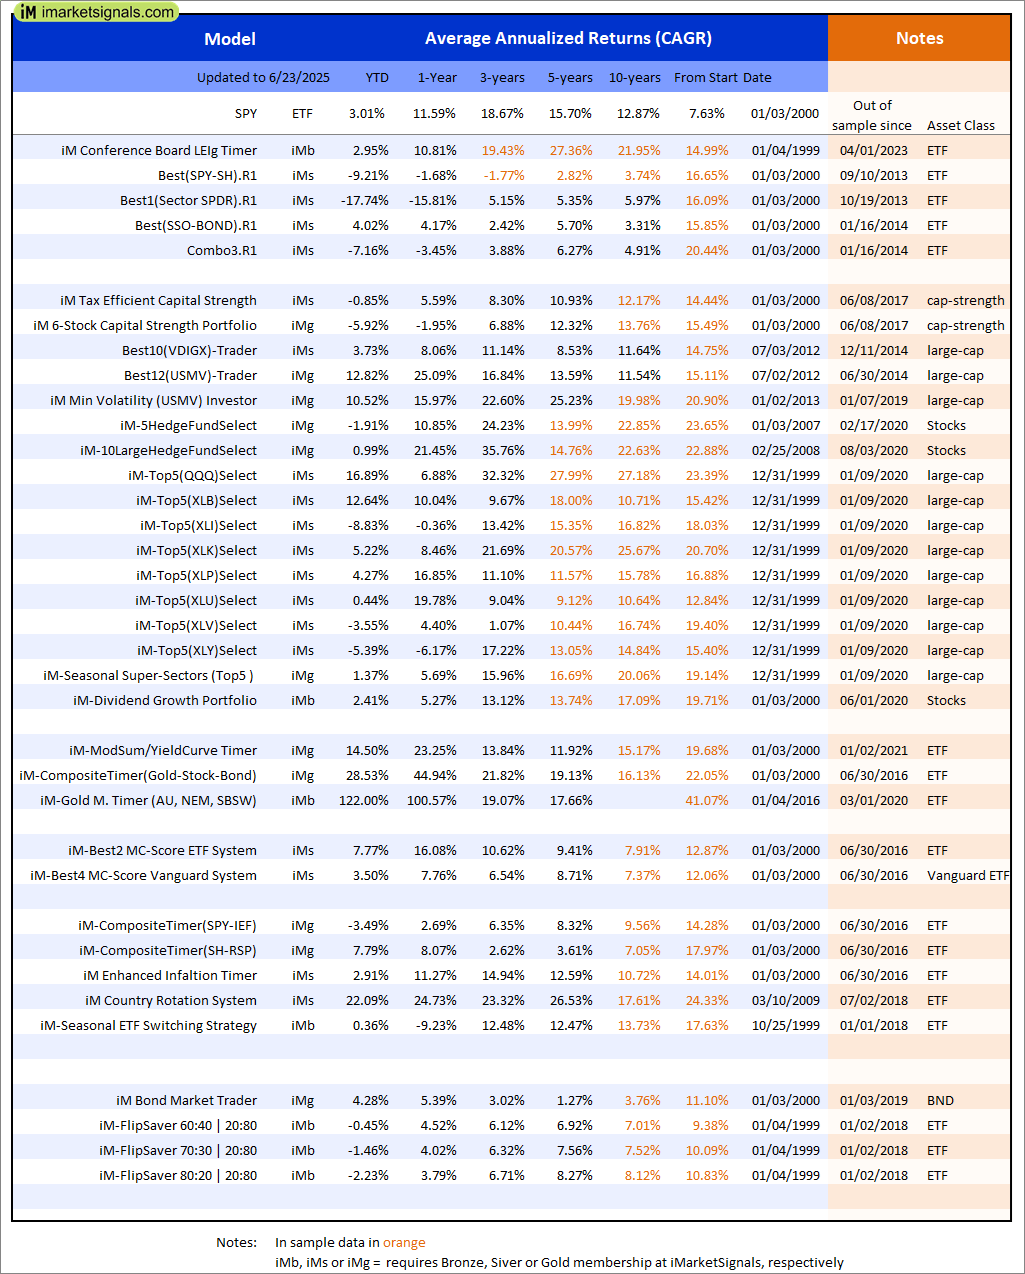
Out of sample performance summary of our models for the past 1, 2, 4 and 13 week periods. The active active return indicates how the models over- or underperformed the benchmark ETF SPY. Also the YTD, and the 1-, 3-, 5- and 10-year annualized returns are shown in the second table |
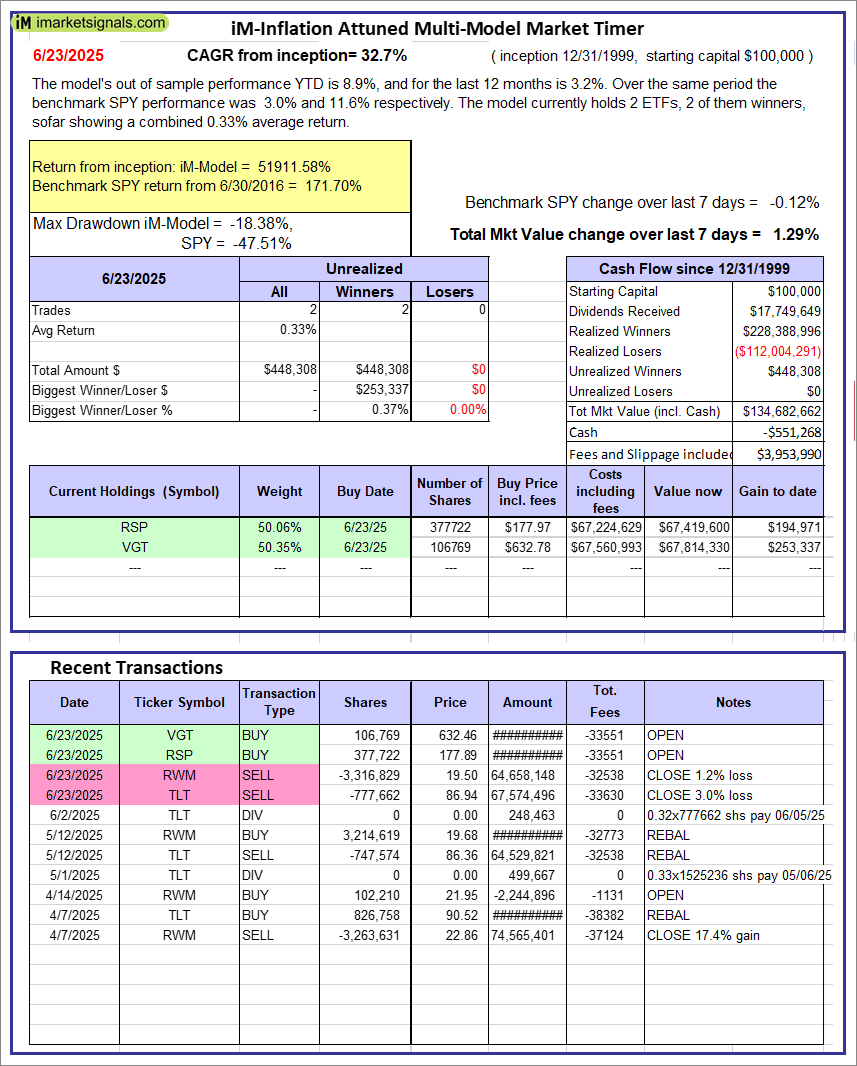 |
iM-Inflation Attuned Multi-Model Market Timer: The model’s out of sample performance YTD is 8.9%, and for the last 12 months is 3.2%. Over the same period the benchmark SPY performance was 3.0% and 11.6% respectively. Over the previous week the market value of the iM-Inflation Attuned Multi-Model Market Timer gained 1.29% at a time when SPY gained -0.12%. A starting capital of $100,000 at inception on 3/24/2017 would have grown to $134,682,662 which includes -$551,268 cash and excludes $3,953,990 spent on fees and slippage. |
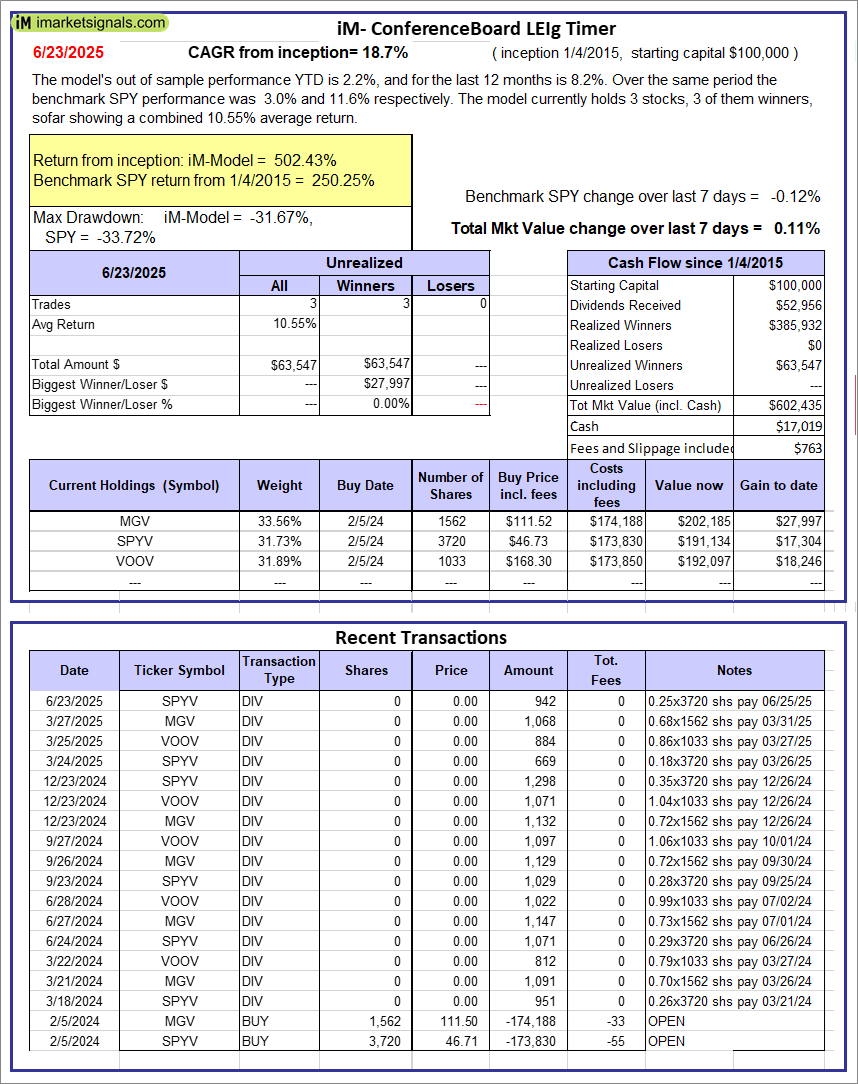 |
iM-Conference Board LEIg Timer: The model’s performance YTD is 14.3%, and for the last 12 months is 7.3%. Over the same period the benchmark SPY performance was 20.1% and 9.4% respectively. Over the previous week the market value of the iM-Conference Board LEIg Timer gained 0.11% at a time when SPY gained -0.12%. A starting capital of $100,000 at inception on 4/5/2017 would have grown to $602,435 which includes $17,019 cash and excludes $763 spent on fees and slippage. |
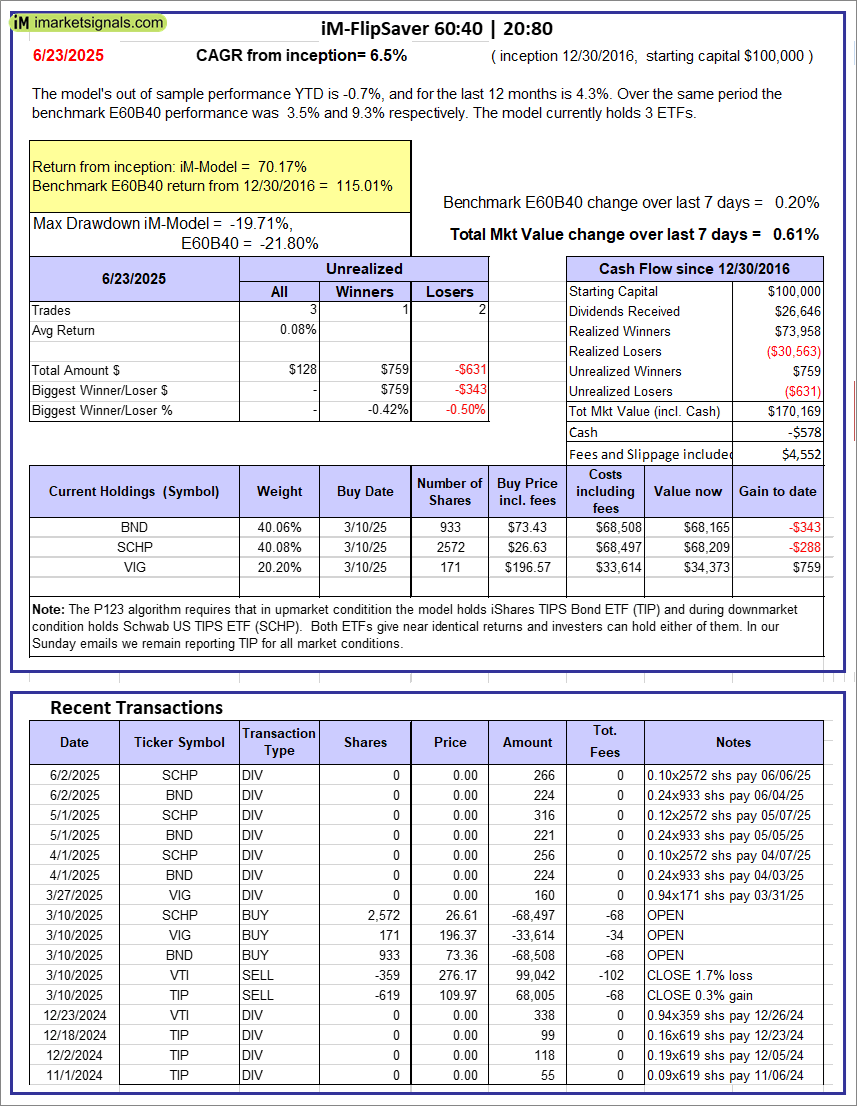 |
iM-FlipSaver 60:40 | 20:80 – 2017: The model’s out of sample performance YTD is -0.7%, and for the last 12 months is 4.3%. Over the same period the benchmark E60B40 performance was 3.5% and 9.3% respectively. Over the previous week the market value of iM-FlipSaver 80:20 | 20:80 gained 0.61% at a time when SPY gained 0.20%. A starting capital of $100,000 at inception on 7/16/2015 would have grown to $170,169 which includes -$578 cash and excludes $4,552 spent on fees and slippage. |
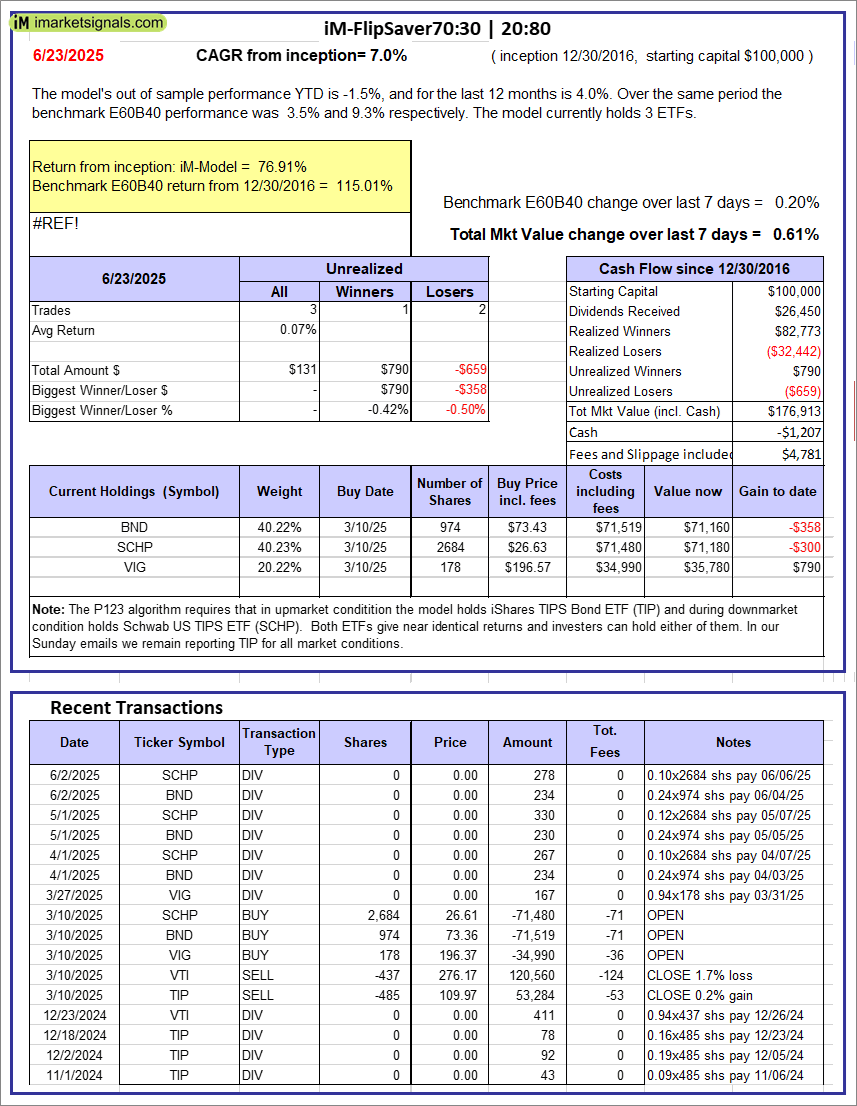 |
iM-FlipSaver 70:30 | 20:80 – 2017: The model’s out of sample performance YTD is -1.5%, and for the last 12 months is 4.0%. Over the same period the benchmark E60B40 performance was 3.5% and 9.3% respectively. Over the previous week the market value of iM-FlipSaver 70:30 | 20:80 gained 0.61% at a time when SPY gained 0.20%. A starting capital of $100,000 at inception on 7/15/2015 would have grown to $176,913 which includes -$1,207 cash and excludes $4,781 spent on fees and slippage. |
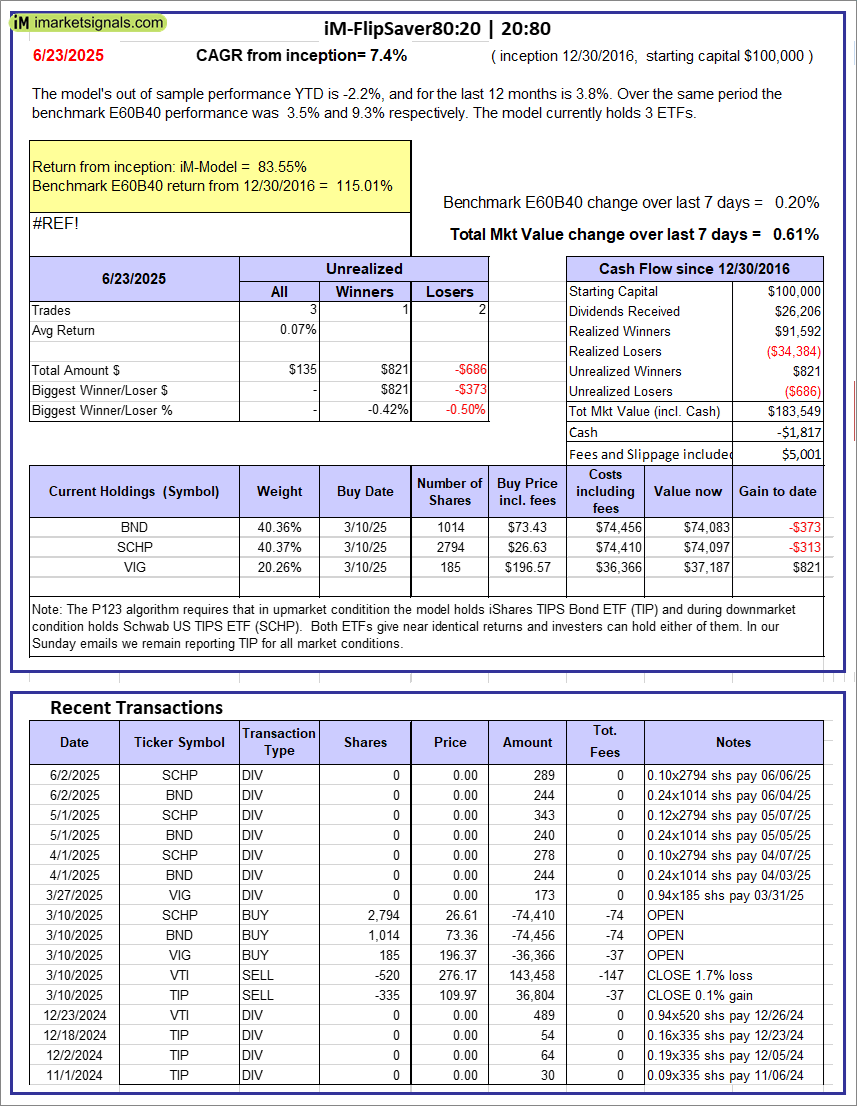 |
iM-FlipSaver 80:20 | 20:80 – 2017: The model’s out of sample performance YTD is -2.2%, and for the last 12 months is 3.8%. Over the same period the benchmark E60B40 performance was 3.5% and 9.3% respectively. Over the previous week the market value of iM-FlipSaver 80:20 | 20:80 gained 0.61% at a time when SPY gained 0.20%. A starting capital of $100,000 at inception on 1/2/2017 would have grown to $183,549 which includes -$1,817 cash and excludes $5,001 spent on fees and slippage. |
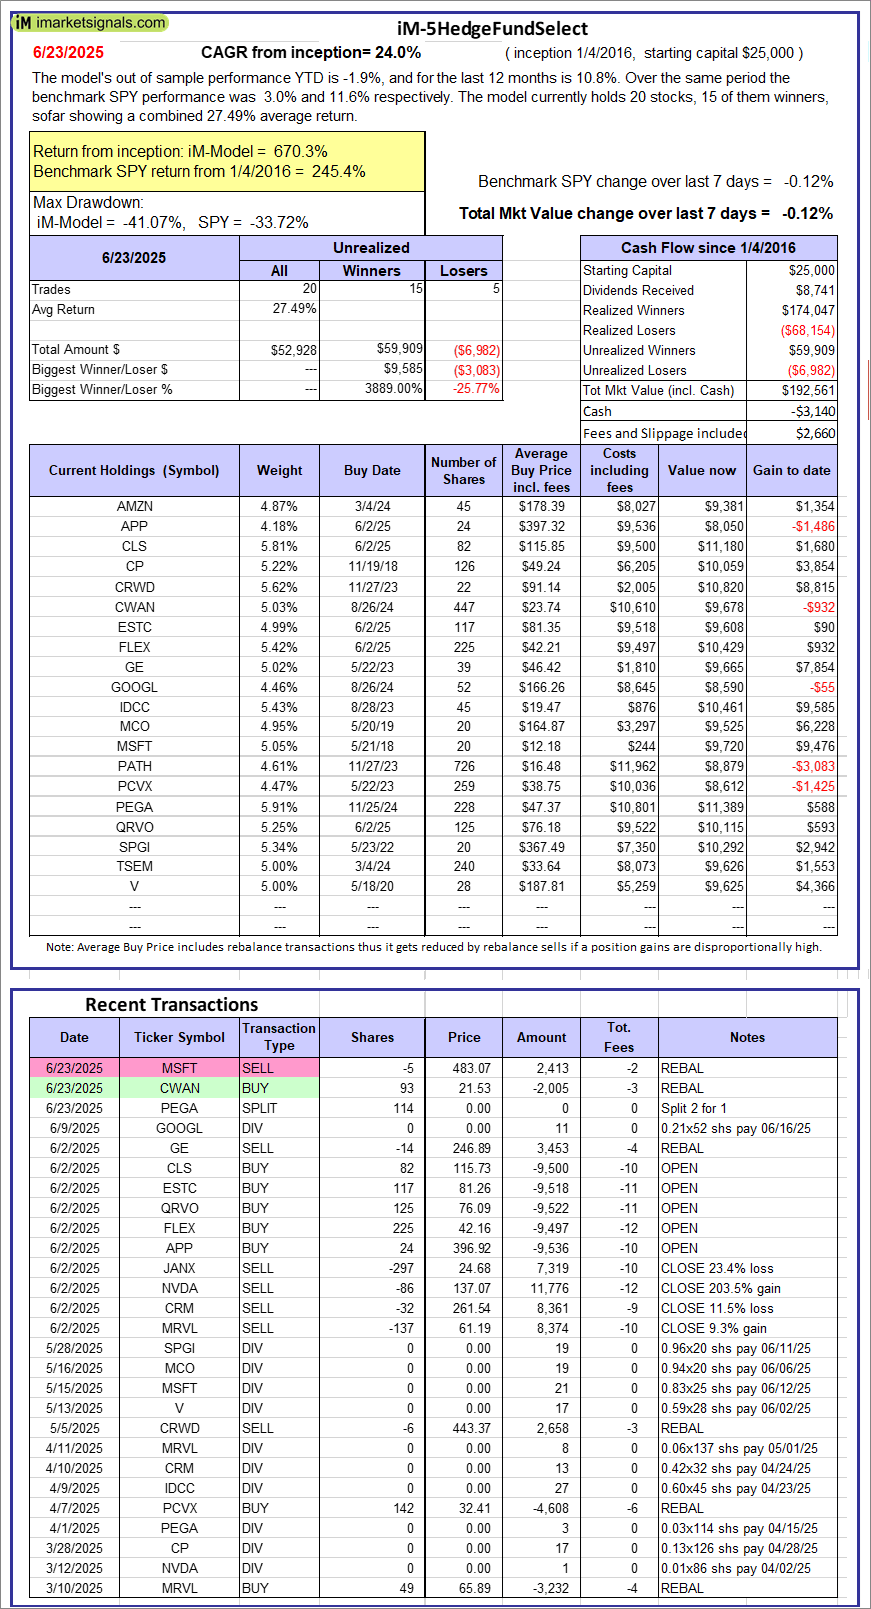 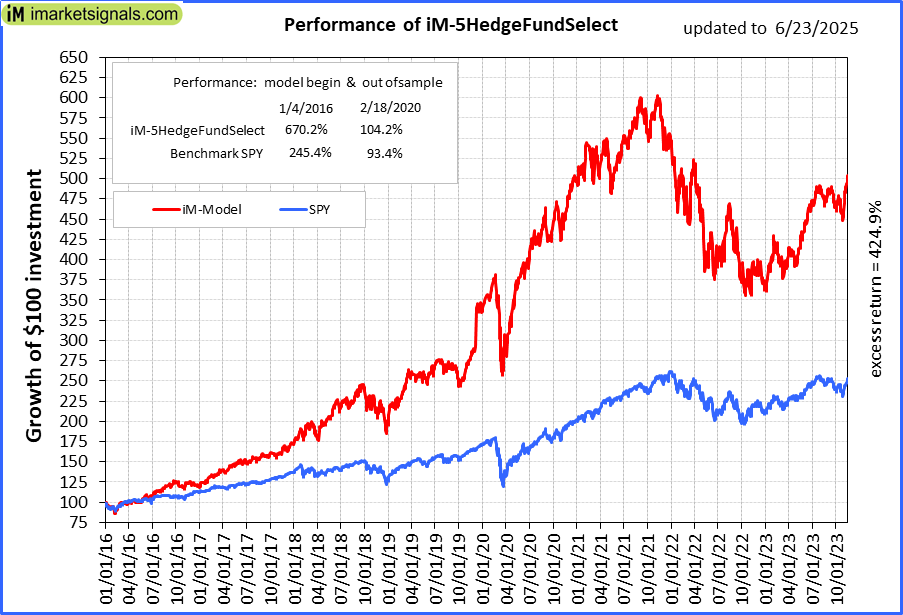 |
iM-5HedgeFundSelect: Since inception, on 1/5/2016, the model gained 670.25% while the benchmark SPY gained 245.35% over the same period. Over the previous week the market value of iM-5HedgeFundSelect gained -0.12% at a time when SPY gained -0.12%. A starting capital of $25,000 at inception on 1/5/2016 would have grown to $192,561 which includes -$3,140 cash and excludes $2,660 spent on fees and slippage. |
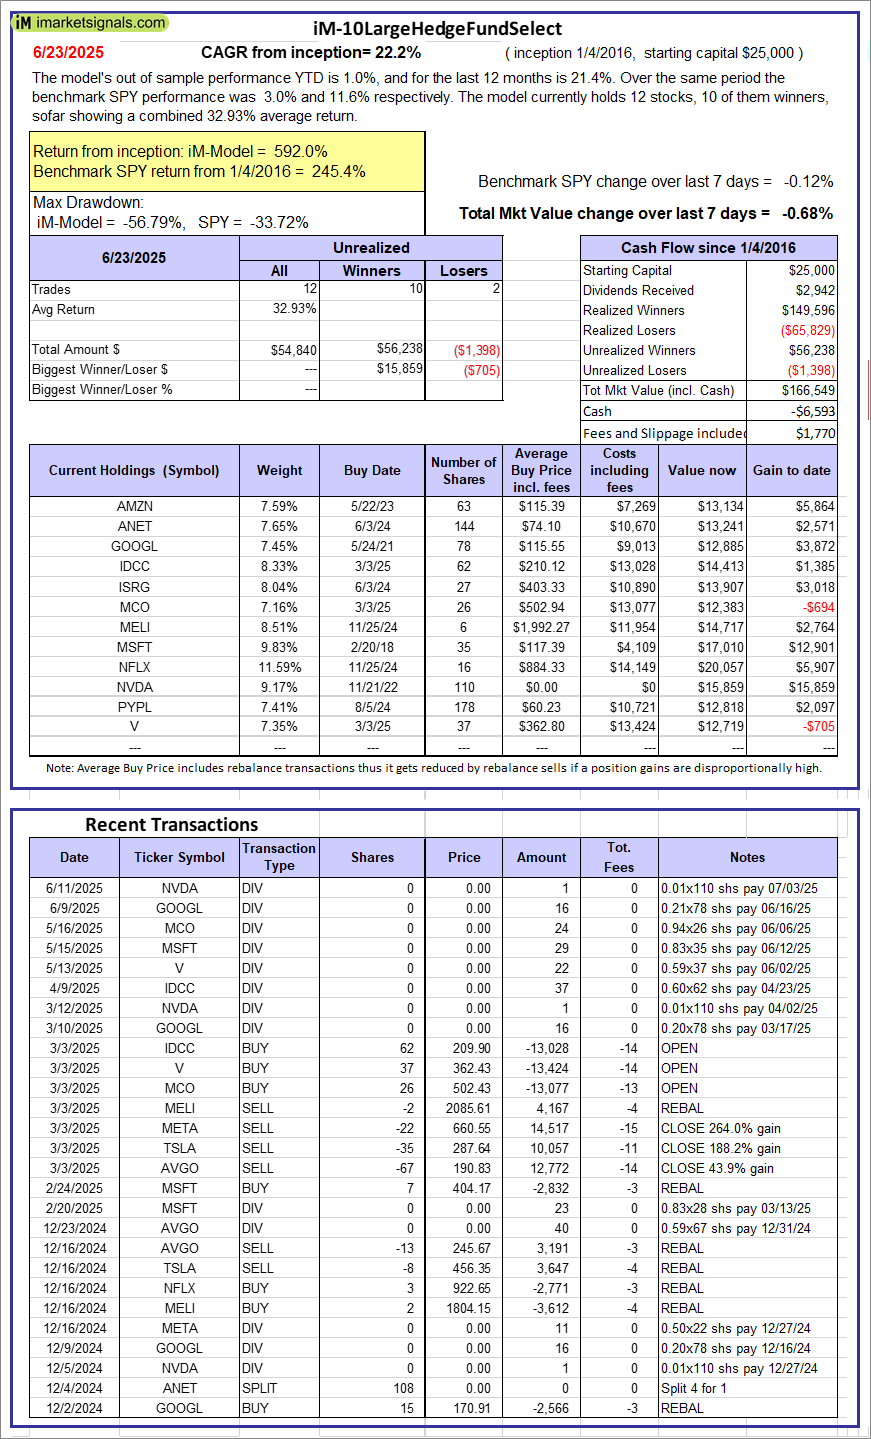 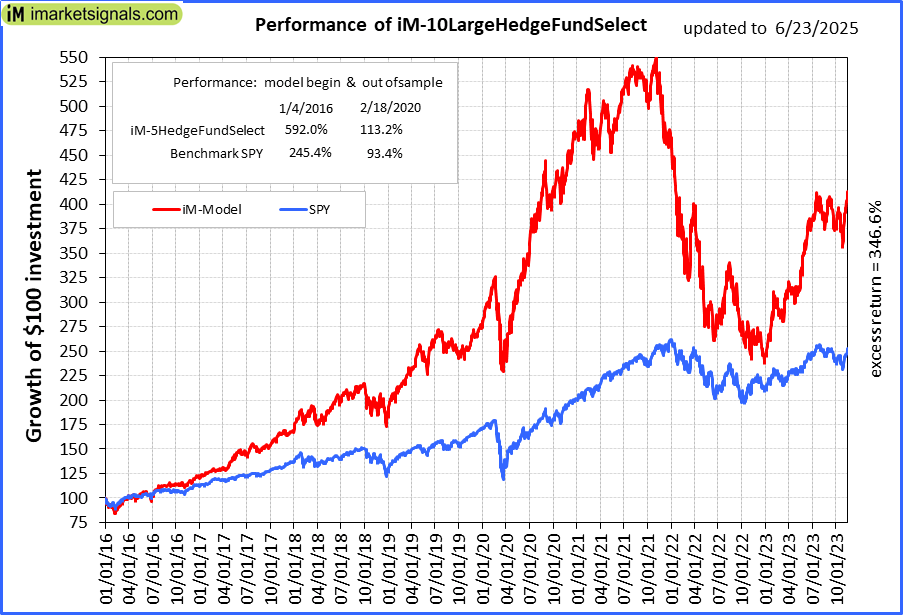 |
iM-10LargeHedgeFundSelect: Since inception, on 1/5/2016, the model gained 591.99% while the benchmark SPY gained 245.35% over the same period. Over the previous week the market value of iM-10LargeHedgeFundSelect gained -0.68% at a time when SPY gained -0.12%. A starting capital of $25,000 at inception on 1/5/2016 would have grown to $166,549 which includes -$6,593 cash and excludes $1,770 spent on fees and slippage. |
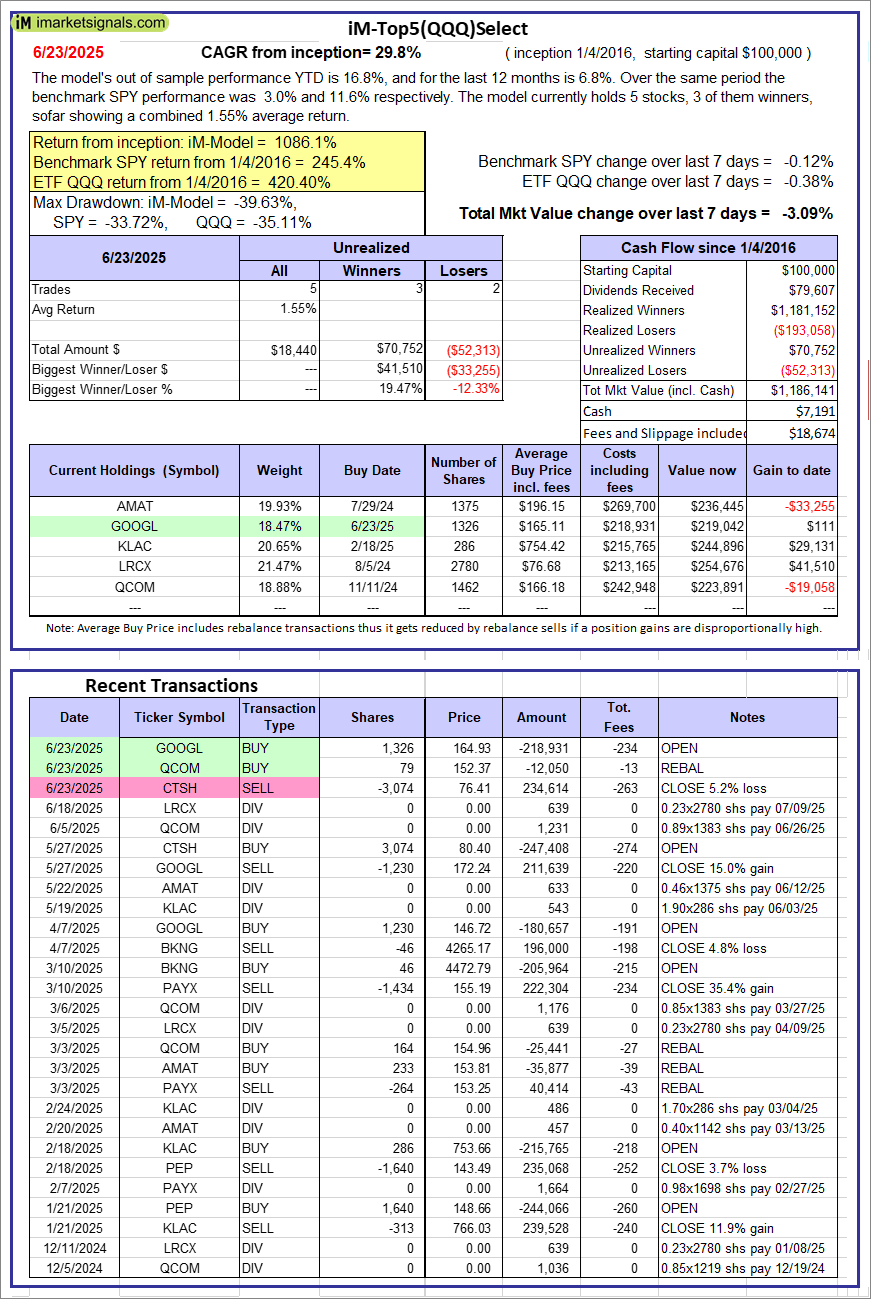 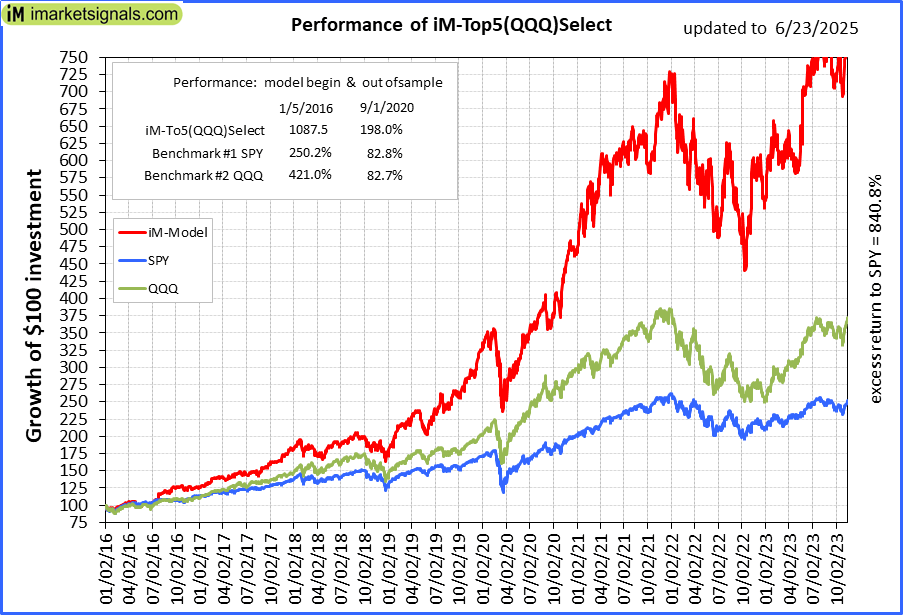 |
iM-Top5(QQQ)Select: Since inception, on 1/5/2016, the model gained 1086.14% while the benchmark SPY gained 245.35% over the same period. Over the previous week the market value of iM-Top5(QQQ)Select gained -3.09% at a time when SPY gained -0.12%. A starting capital of $100,000 at inception on 1/5/2016 would have grown to $1,186,141 which includes $7,191 cash and excludes $18,674 spent on fees and slippage. |
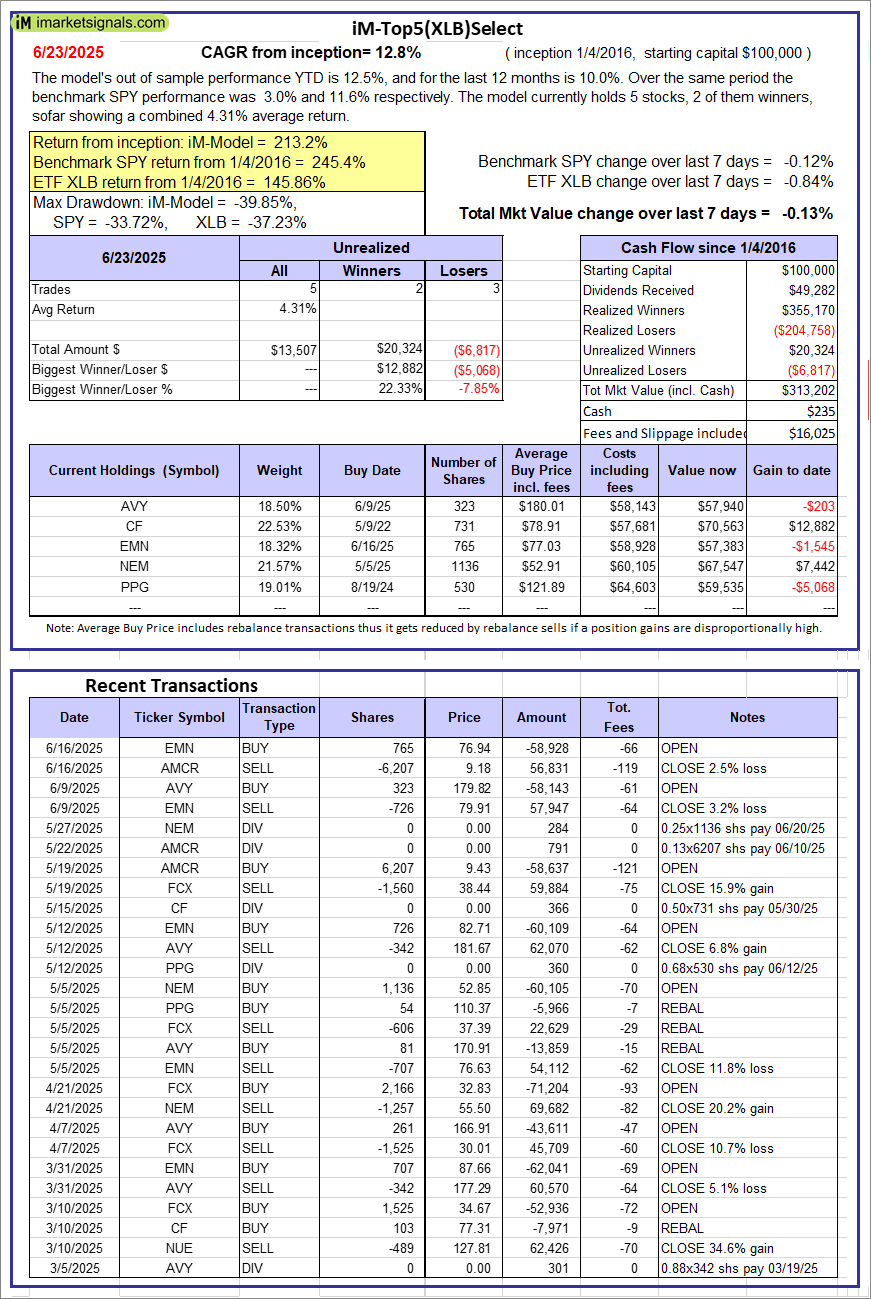  |
iM-Top5(XLB)Select: Since inception, on 1/5/2016, the model gained 213.20% while the benchmark SPY gained 245.35% over the same period. Over the previous week the market value of iM-Top5(XLB)Select gained -0.13% at a time when SPY gained -0.12%. A starting capital of $100,000 at inception on 1/5/2016 would have grown to $313,202 which includes $235 cash and excludes $16,025 spent on fees and slippage. |
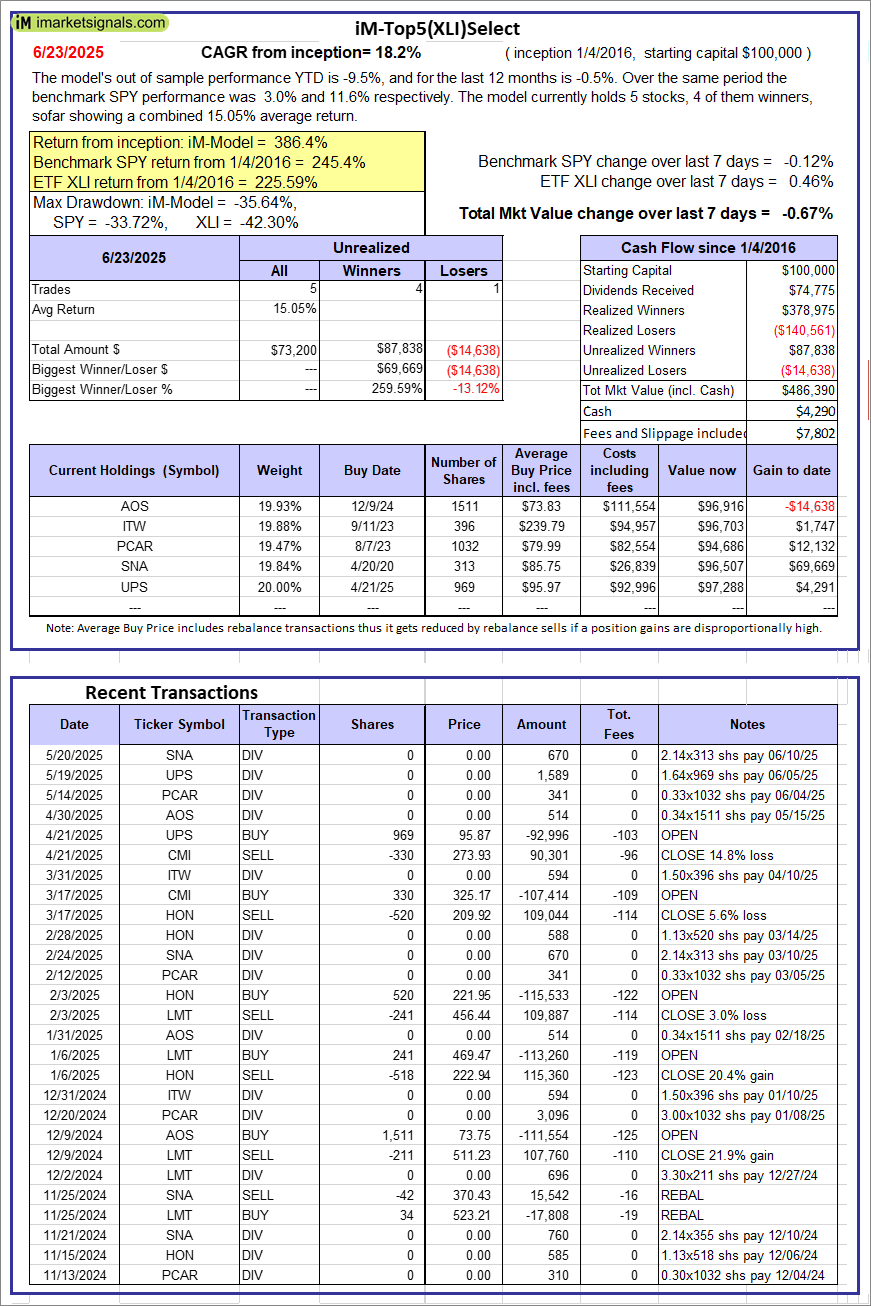 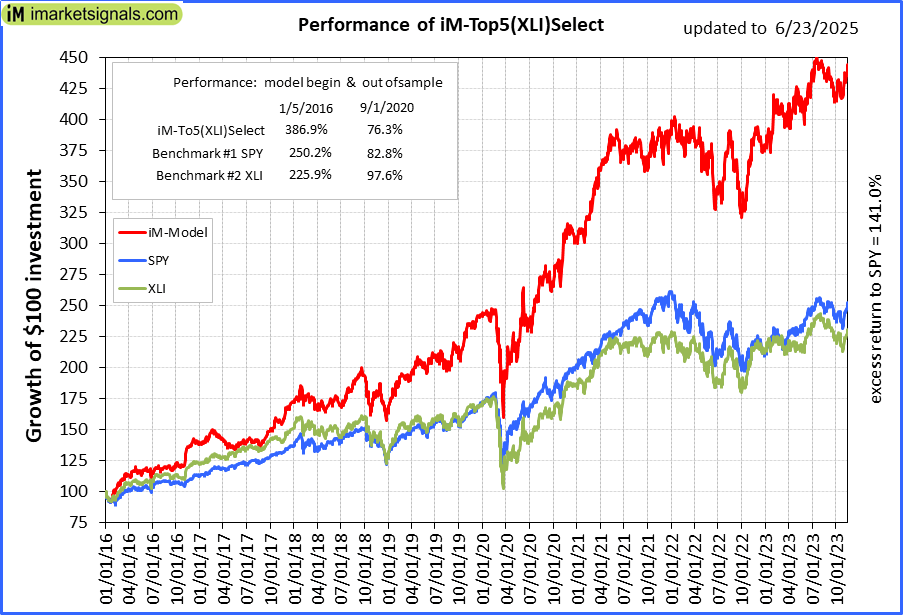 |
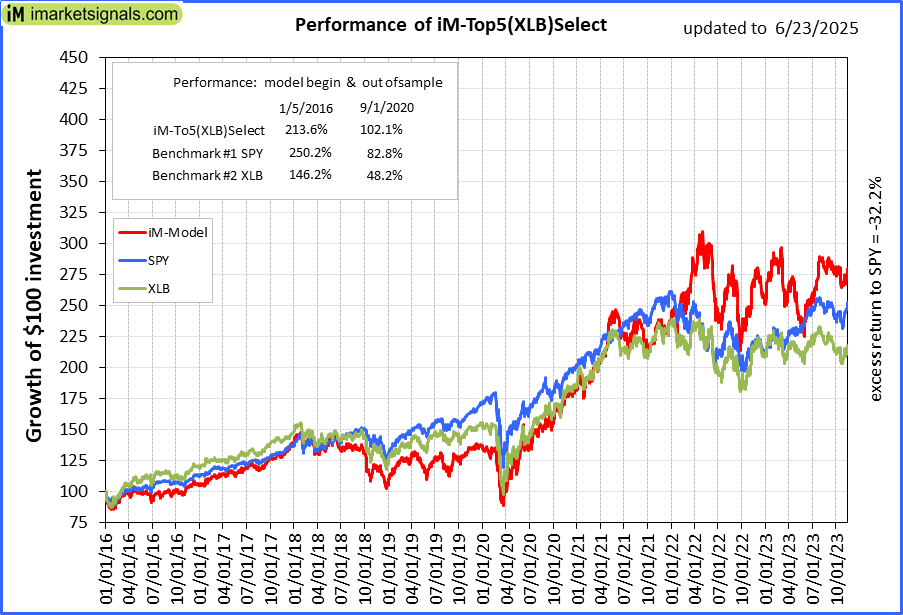
iM-Top5(XLI)Select: Since inception, on 1/5/2016, the model gained 386.39% while the benchmark SPY gained 245.35% over the same period. Over the previous week the market value of iM-Top5(XLI)Select gained -0.67% at a time when SPY gained -0.12%. A starting capital of $100,000 at inception on 1/5/2016 would have grown to $486,390 which includes $4,290 cash and excludes $7,802 spent on fees and slippage. |
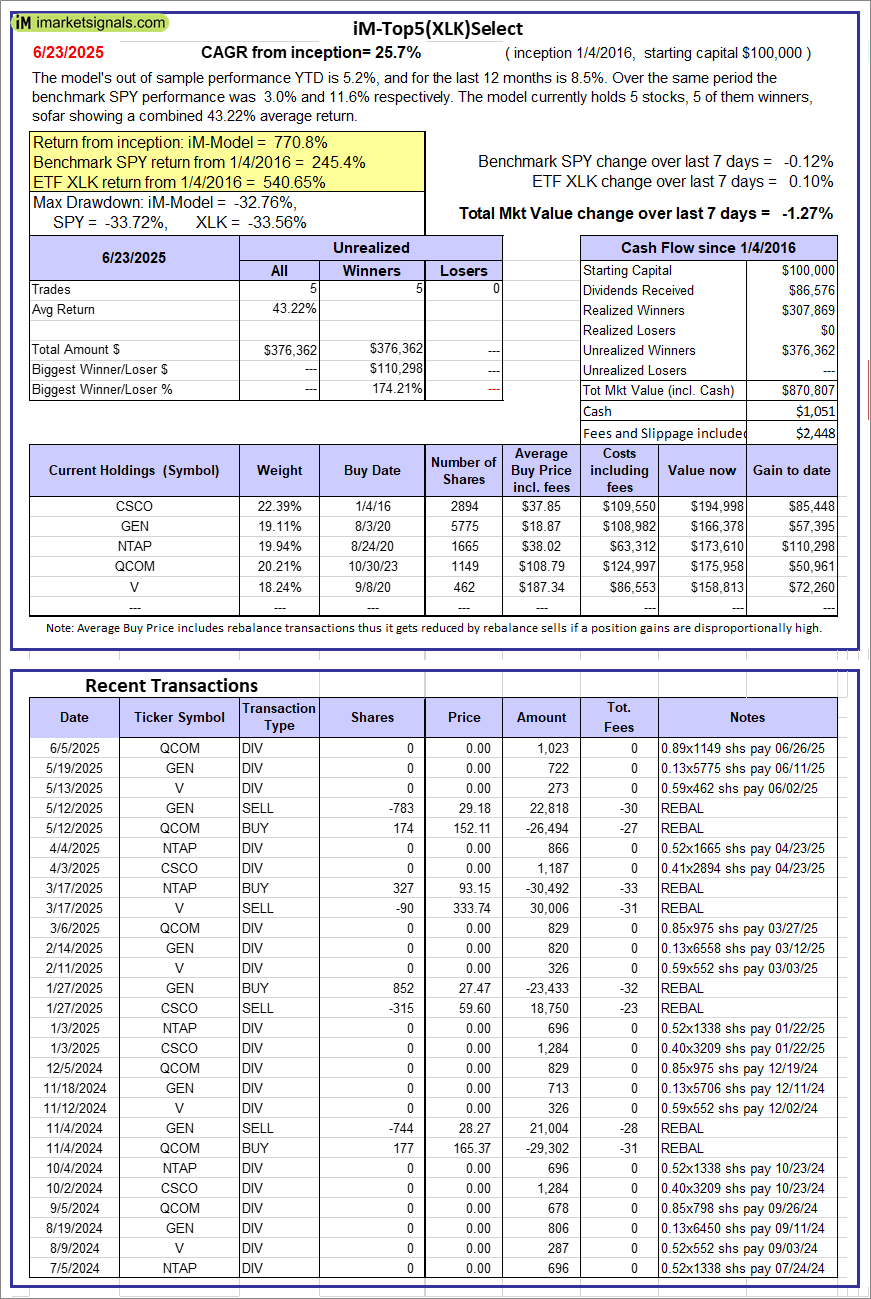 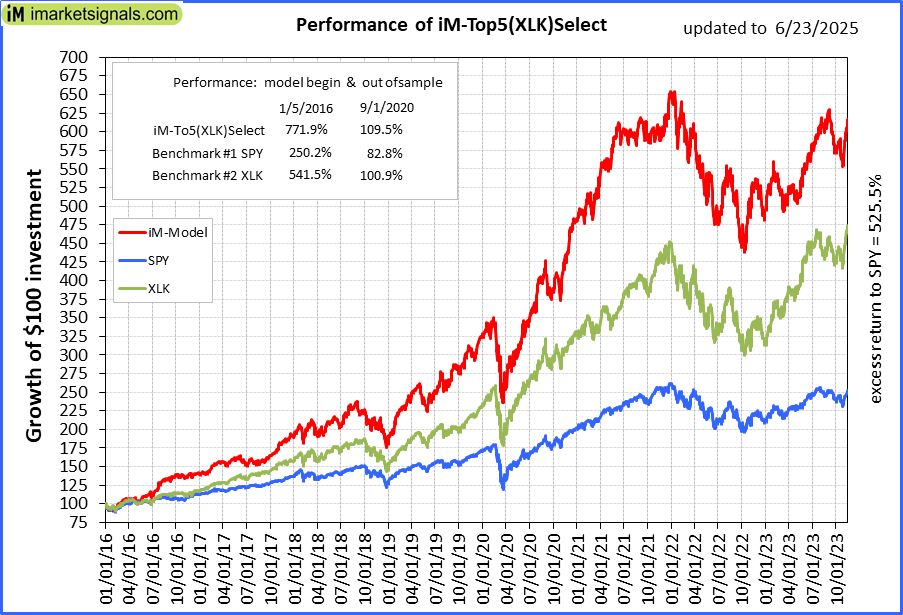 |
iM-Top5(XLK)Select: Since inception, on 1/5/2016, the model gained 770.81% while the benchmark SPY gained 245.35% over the same period. Over the previous week the market value of iM-Top5(XLK)Select gained -1.27% at a time when SPY gained -0.12%. A starting capital of $100,000 at inception on 1/5/2016 would have grown to $870,807 which includes $1,051 cash and excludes $2,448 spent on fees and slippage. |
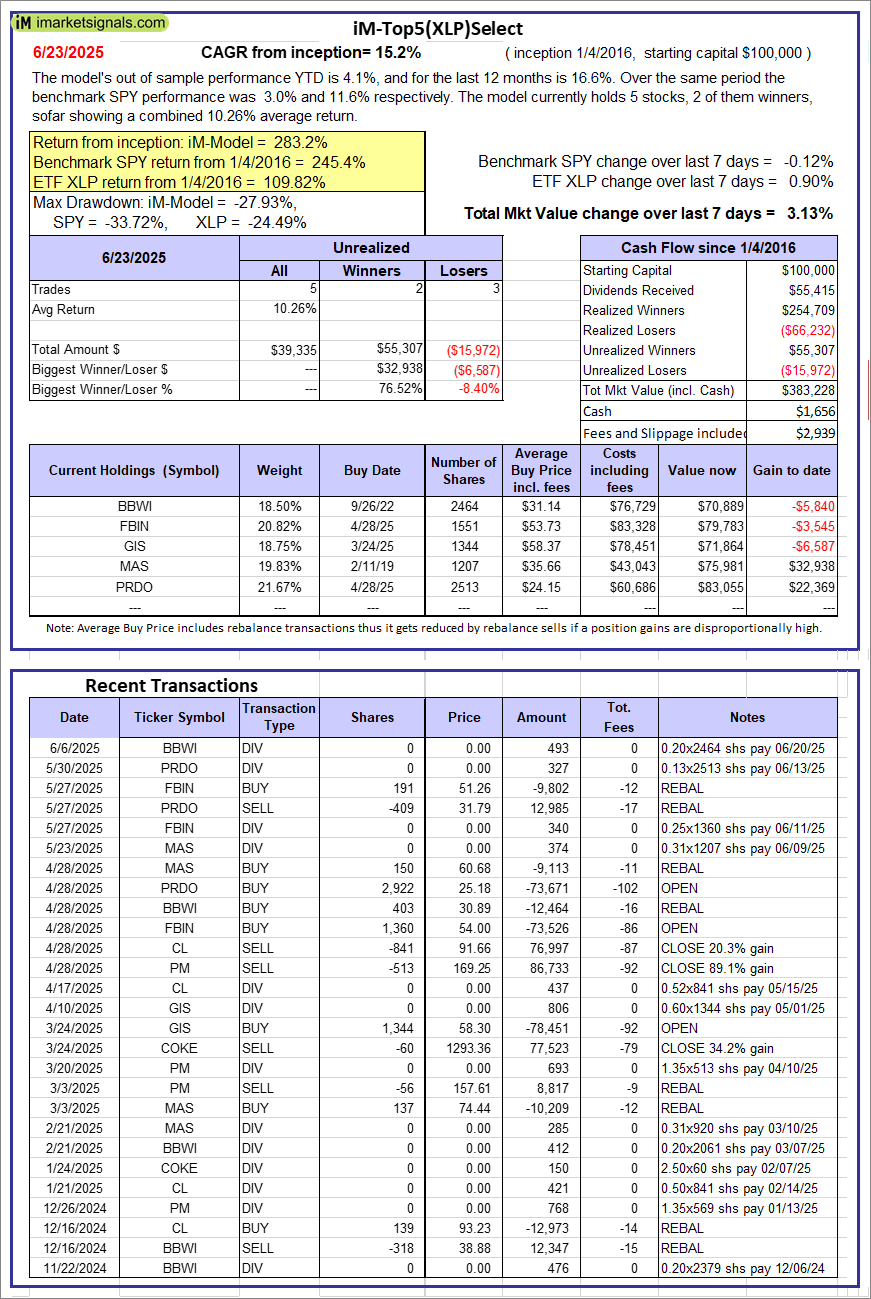 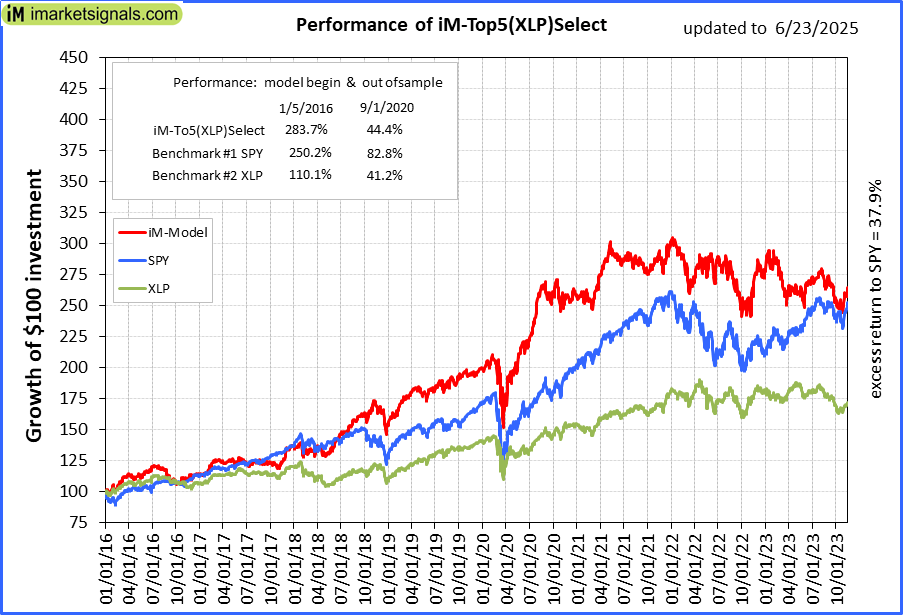 |
iM-Top5(XLP)Select: Since inception, on 1/5/2016, the model gained 283.23% while the benchmark SPY gained 245.35% over the same period. Over the previous week the market value of iM-Top5(XLP)Select gained 3.13% at a time when SPY gained -0.12%. A starting capital of $100,000 at inception on 1/5/2016 would have grown to $383,228 which includes $1,656 cash and excludes $2,939 spent on fees and slippage. |
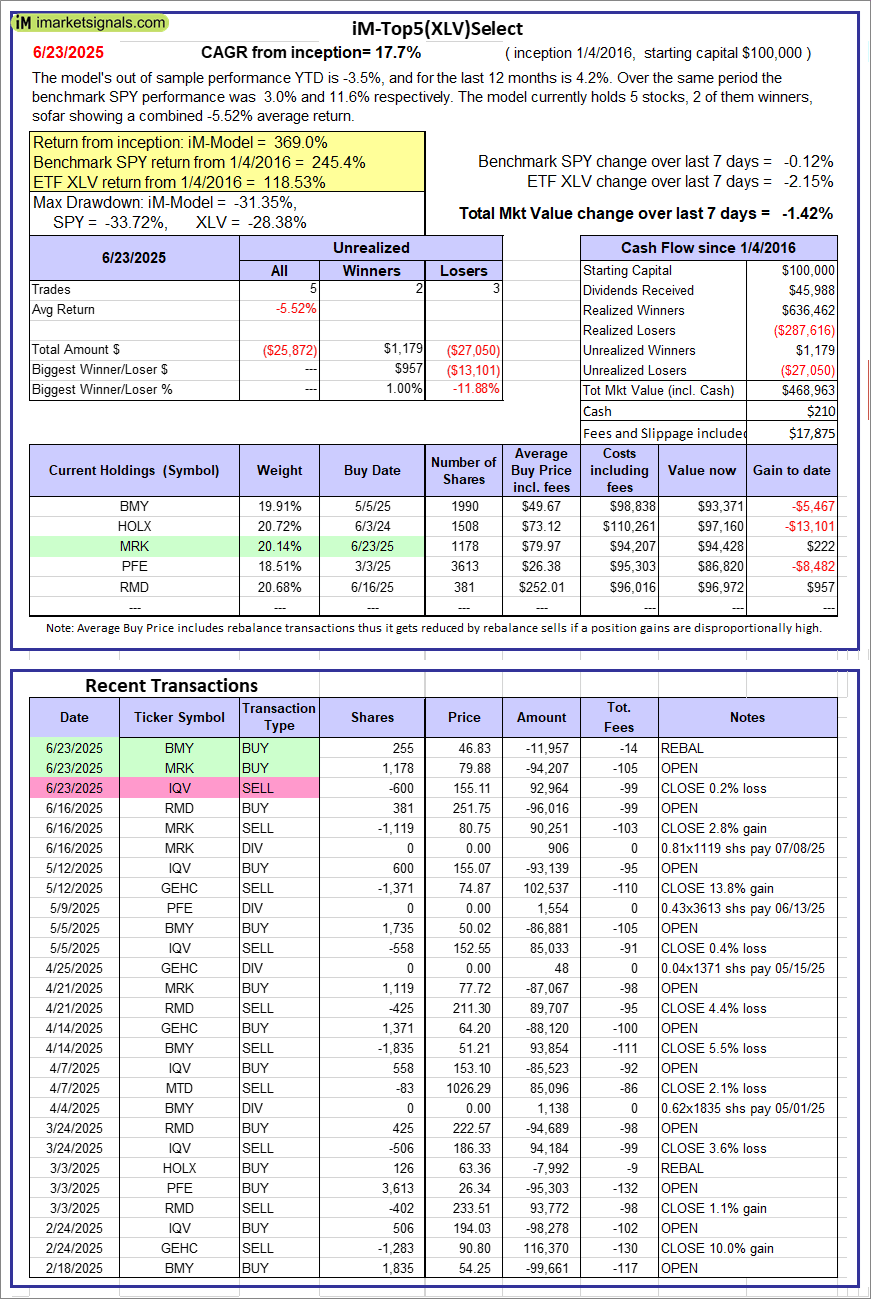 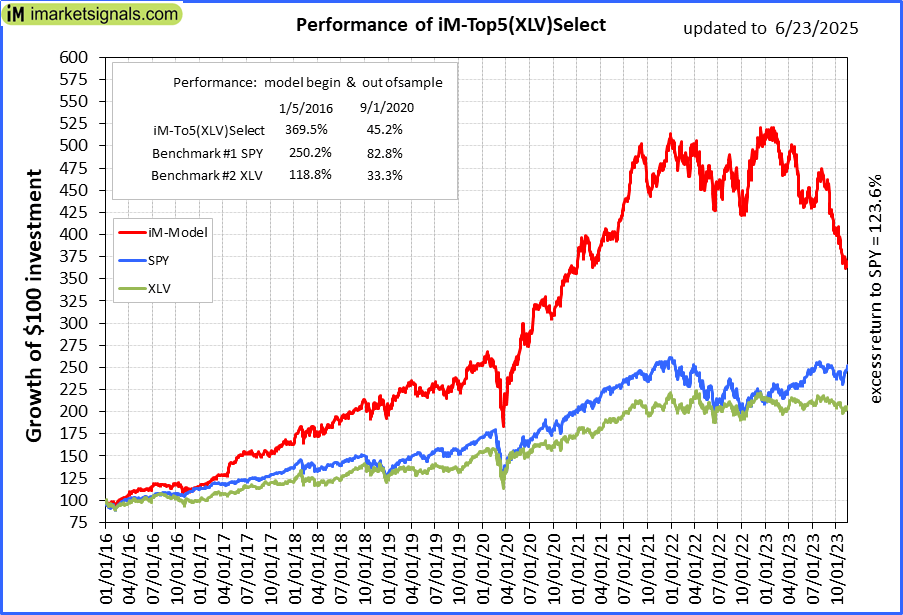 |
iM-Top5(XLV)Select: Since inception, on 1/5/2016, the model gained 368.96% while the benchmark SPY gained 245.35% over the same period. Over the previous week the market value of iM-Top5(XLV)Select gained -1.42% at a time when SPY gained -0.12%. A starting capital of $100,000 at inception on 1/5/2016 would have grown to $468,963 which includes $210 cash and excludes $17,875 spent on fees and slippage. |
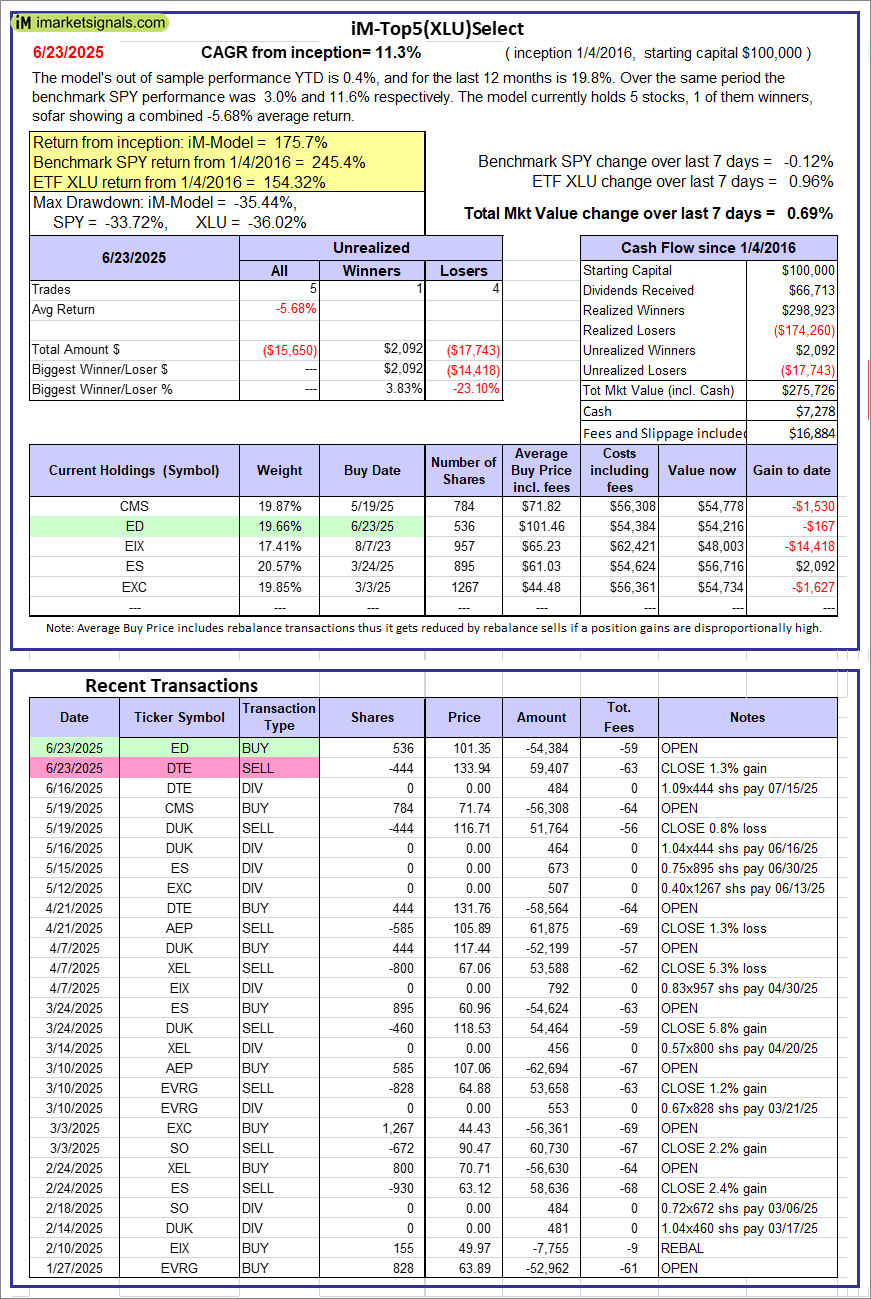 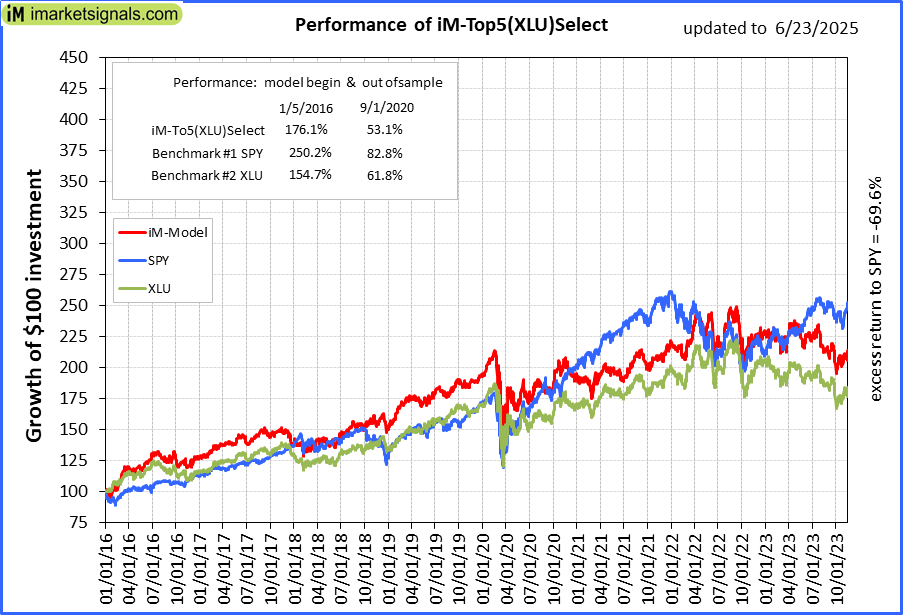 |
iM-Top5(XLU)Select: Since inception, on 1/5/2016, the model gained 175.73% while the benchmark SPY gained 245.35% over the same period. Over the previous week the market value of iM-Top5(XLU)Select gained 0.69% at a time when SPY gained -0.12%. A starting capital of $100,000 at inception on 1/5/2016 would have grown to $275,726 which includes $7,278 cash and excludes $16,884 spent on fees and slippage. |
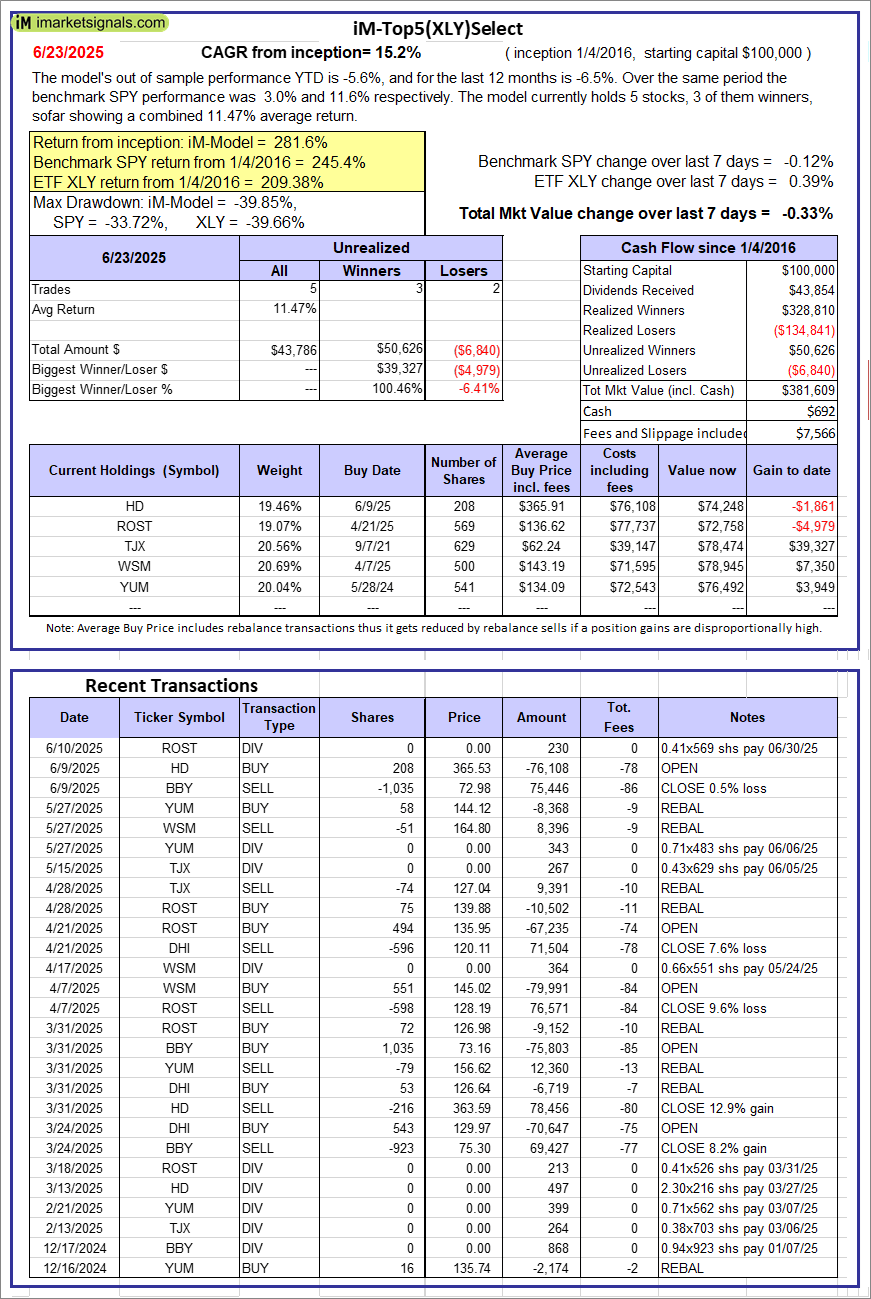 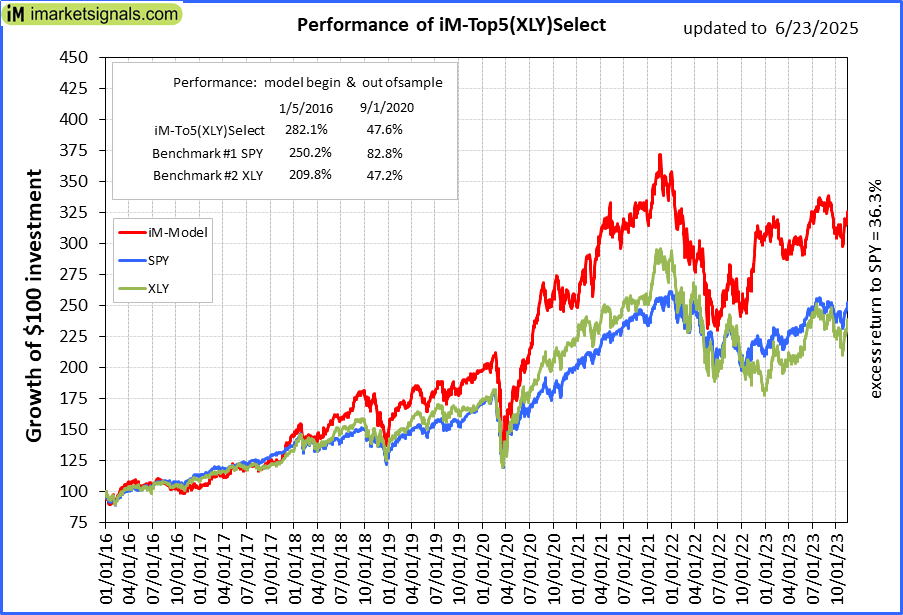 |
iM-Top5(XLY)Select: Since inception, on 1/5/2016, the model gained 281.61% while the benchmark SPY gained 245.35% over the same period. Over the previous week the market value of iM-Top5(XLY)Select gained -0.33% at a time when SPY gained -0.12%. A starting capital of $100,000 at inception on 1/5/2016 would have grown to $381,609 which includes $692 cash and excludes $7,566 spent on fees and slippage. |
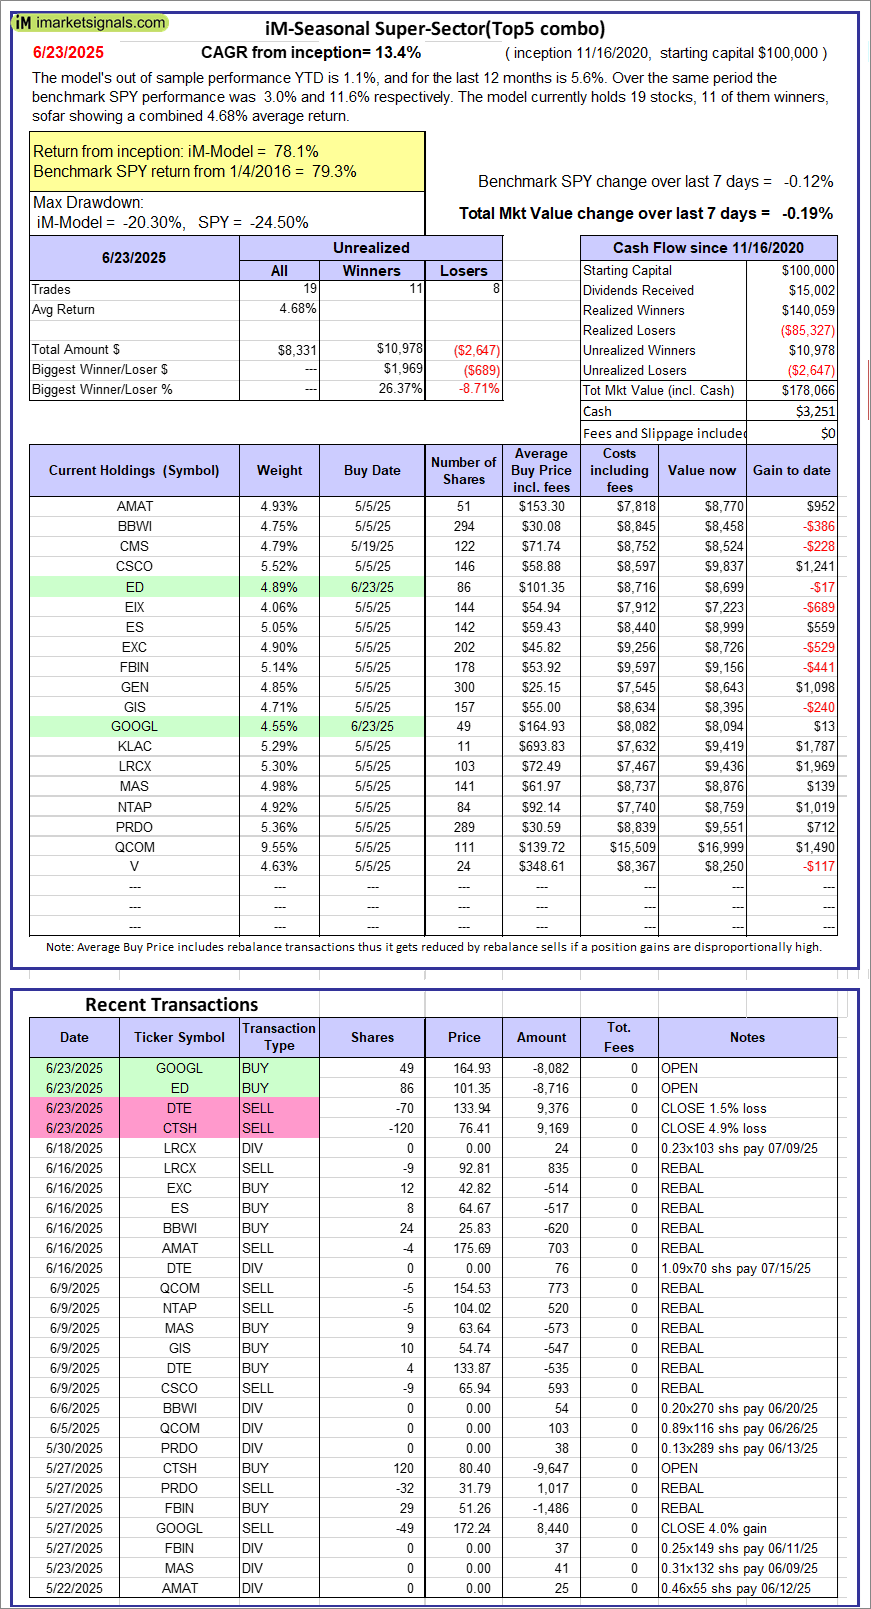 |
iM-Seasonal Super-Sectors (Top5 combo) : Since inception, on 11/17/2020, the model gained 78.07% while the benchmark SPY gained 79.27% over the same period. Over the previous week the market value of iM-Seasonal Super-Sectors (Top5 combo) gained -0.19% at a time when SPY gained -0.12%. A starting capital of $100,000 at inception on 11/17/2020 would have grown to $178,066 which includes $3,251 cash and excludes $00 spent on fees and slippage. |
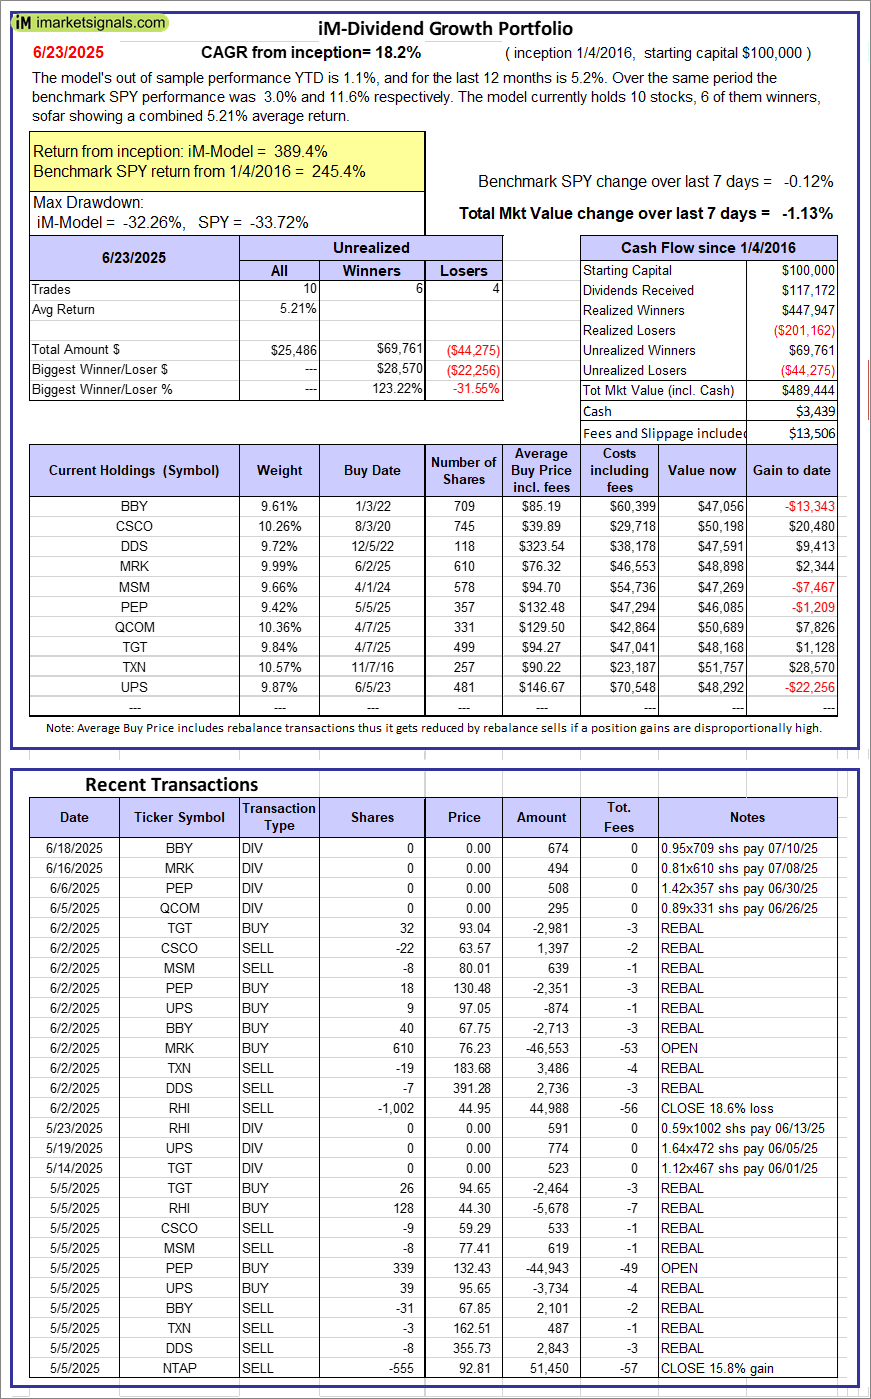 |
iM-Dividend Growth Portfolio: The model’s out of sample performance YTD is 1.1%, and for the last 12 months is 5.2%. Over the same period the benchmark SPY performance was 3.0% and 11.6% respectively. Over the previous week the market value of the iM-Dividend Growth Portfolio gained -1.13% at a time when SPY gained -0.12%. A starting capital of $100,000 at inception on 6/30/2016 would have grown to $489,444 which includes $3,439 cash and excludes $13,506 spent on fees and slippage. |
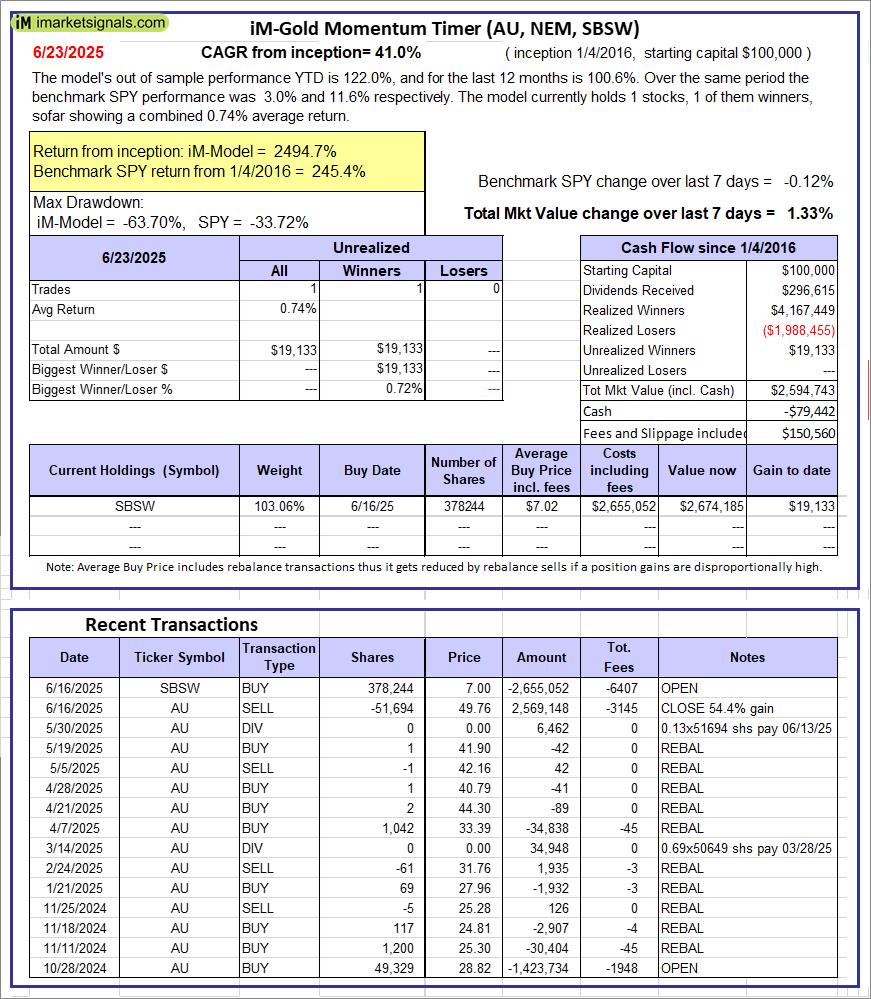 |
iM-Gold Momentum Timer (AU, NEM, SBSW): The model’s out of sample performance YTD is 122.0%, and for the last 12 months is 100.6%. Over the same period the benchmark SPY performance was 3.0% and 11.6% respectively. Over the previous week the market value of iM-Gold Momentum Timer (AU, NEM, SBSW) gained 1.33% at a time when SPY gained -0.12%. A starting capital of $100,000 at inception on 6/30/2016 would have grown to -$79,442 which includes $150,560 cash and excludes Gain to date spent on fees and slippage. |
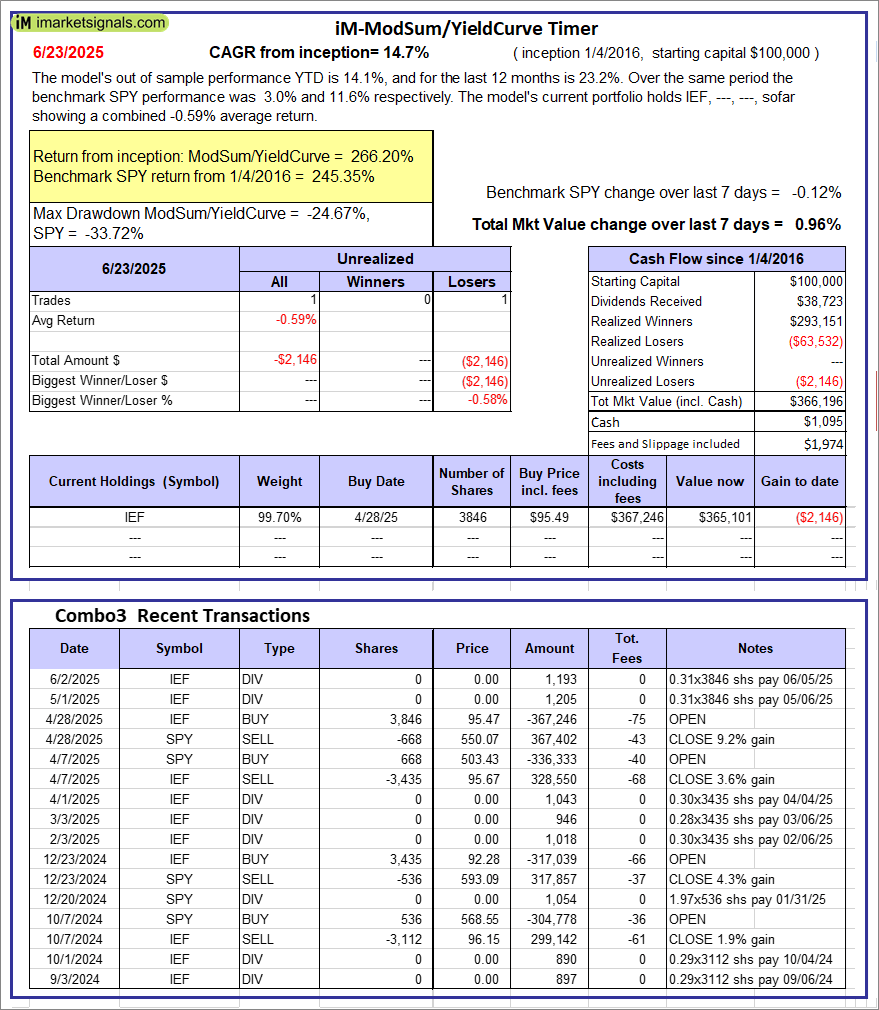 |
iM-ModSum/YieldCurve Timer: The model’s out of sample performance YTD is 14.1%, and for the last 12 months is 23.2%. Over the same period the benchmark SPY performance was 3.0% and 11.6% respectively. Over the previous week the market value of iM-PortSum/YieldCurve Timer gained 0.96% at a time when SPY gained -0.12%. A starting capital of $100,000 at inception on 1/1/2016 would have grown to $366,196 which includes $1,095 cash and excludes $1,974 spent on fees and slippage. |
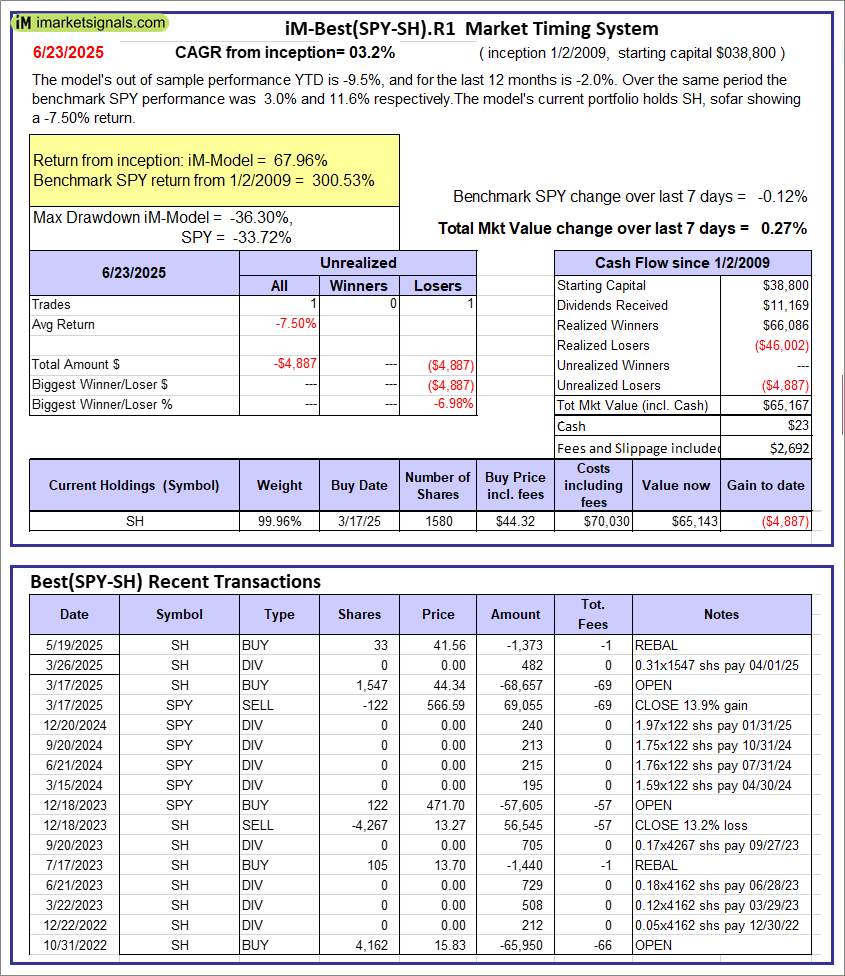 |
iM-Best(SPY-SH).R1: The model’s out of sample performance YTD is -9.5%, and for the last 12 months is -2.0%. Over the same period the benchmark SPY performance was 3.0% and 11.6% respectively. Over the previous week the market value of Best(SPY-SH) gained 0.27% at a time when SPY gained -0.12%. A starting capital of $100,000 at inception on 1/2/2009 would have grown to $65,167 which includes $23 cash and excludes $2,692 spent on fees and slippage. |
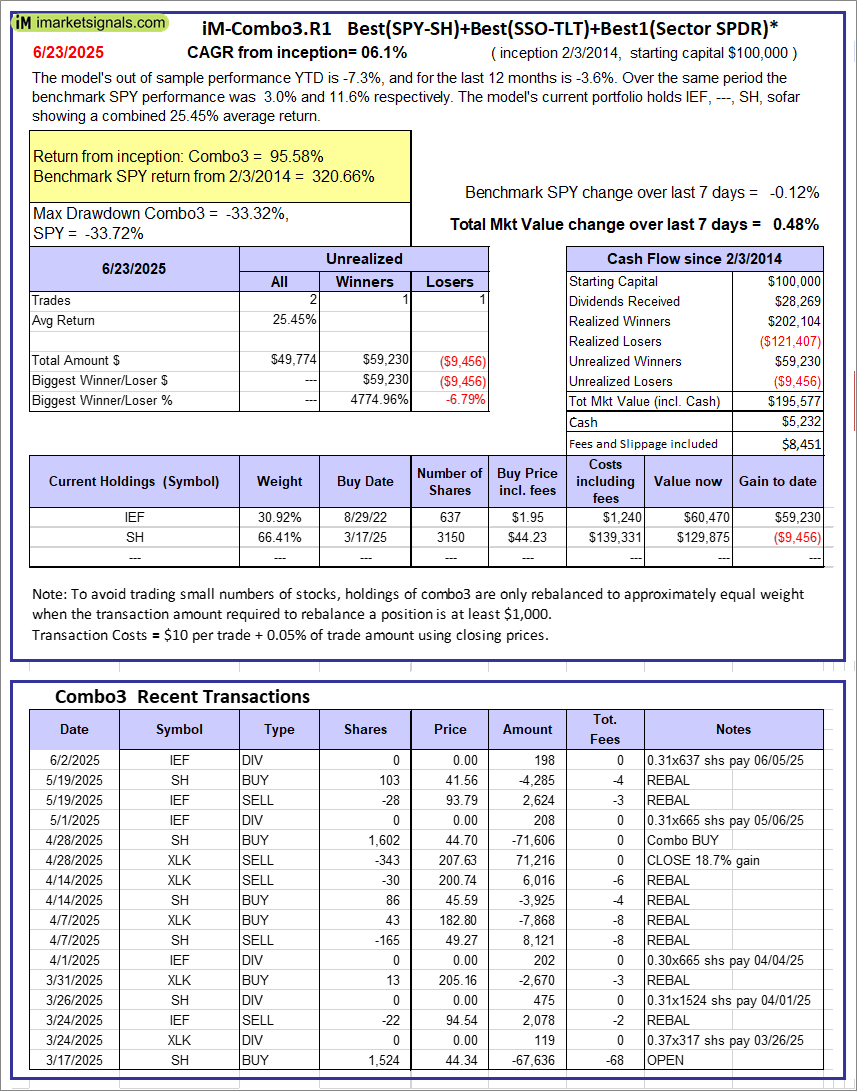 |
iM-Combo3.R1: The model’s out of sample performance YTD is -7.3%, and for the last 12 months is -3.6%. Over the same period the benchmark SPY performance was 3.0% and 11.6% respectively. Over the previous week the market value of iM-Combo3.R1 gained 0.48% at a time when SPY gained -0.12%. A starting capital of $100,000 at inception on 2/3/2014 would have grown to $195,577 which includes $5,232 cash and excludes $8,451 spent on fees and slippage. |
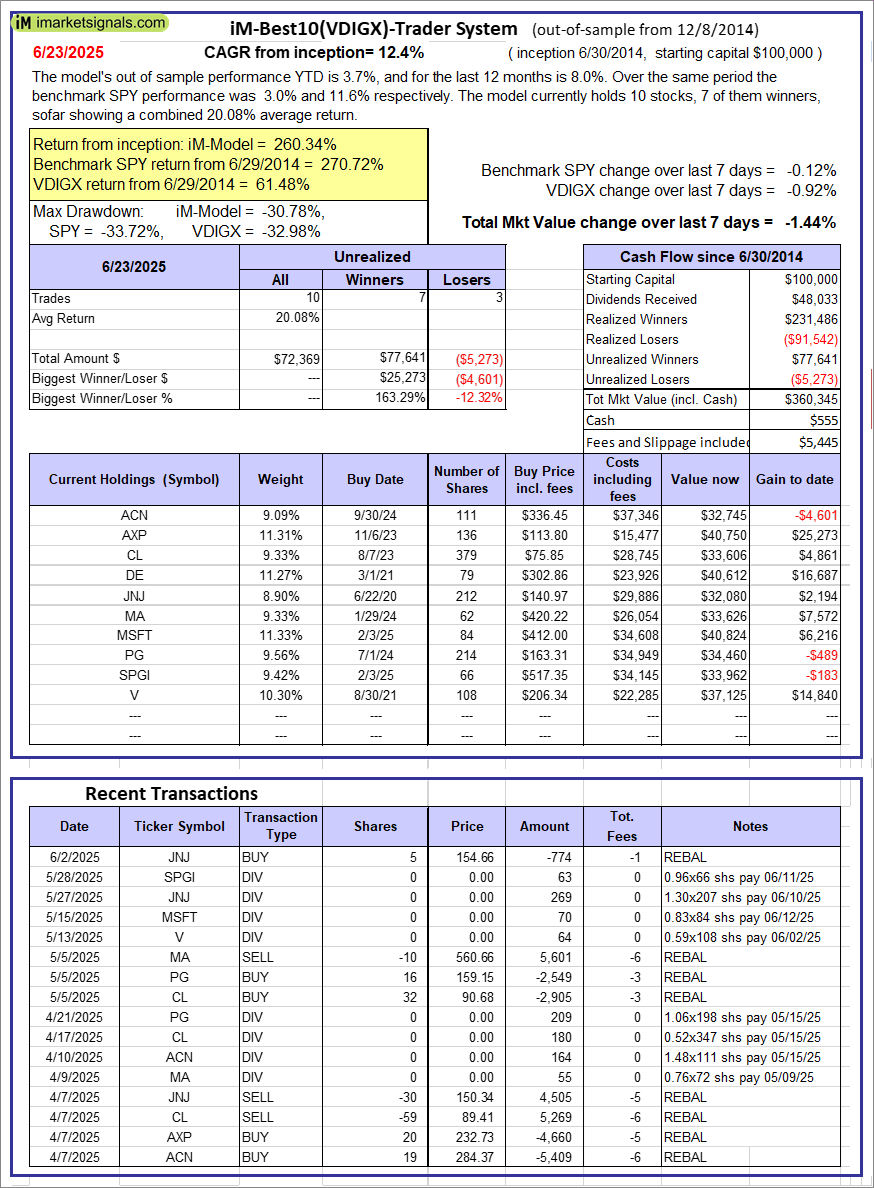 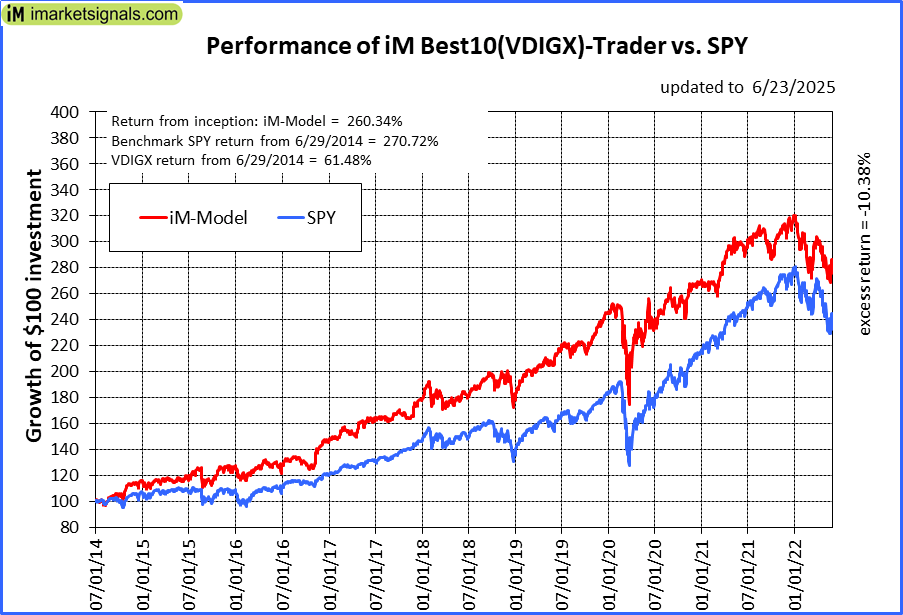 |
iM-Best10(VDIGX)-Trader: The model’s out of sample performance YTD is 3.7%, and for the last 12 months is 8.0%. Over the same period the benchmark SPY performance was 3.0% and 11.6% respectively. Since inception, on 7/1/2014, the model gained 260.34% while the benchmark SPY gained 270.72% and VDIGX gained 61.48% over the same period. Over the previous week the market value of iM-Best10(VDIGX) gained -1.44% at a time when SPY gained -0.12%. A starting capital of $100,000 at inception on 7/1/2014 would have grown to $360,345 which includes $555 cash and excludes $5,445 spent on fees and slippage. |
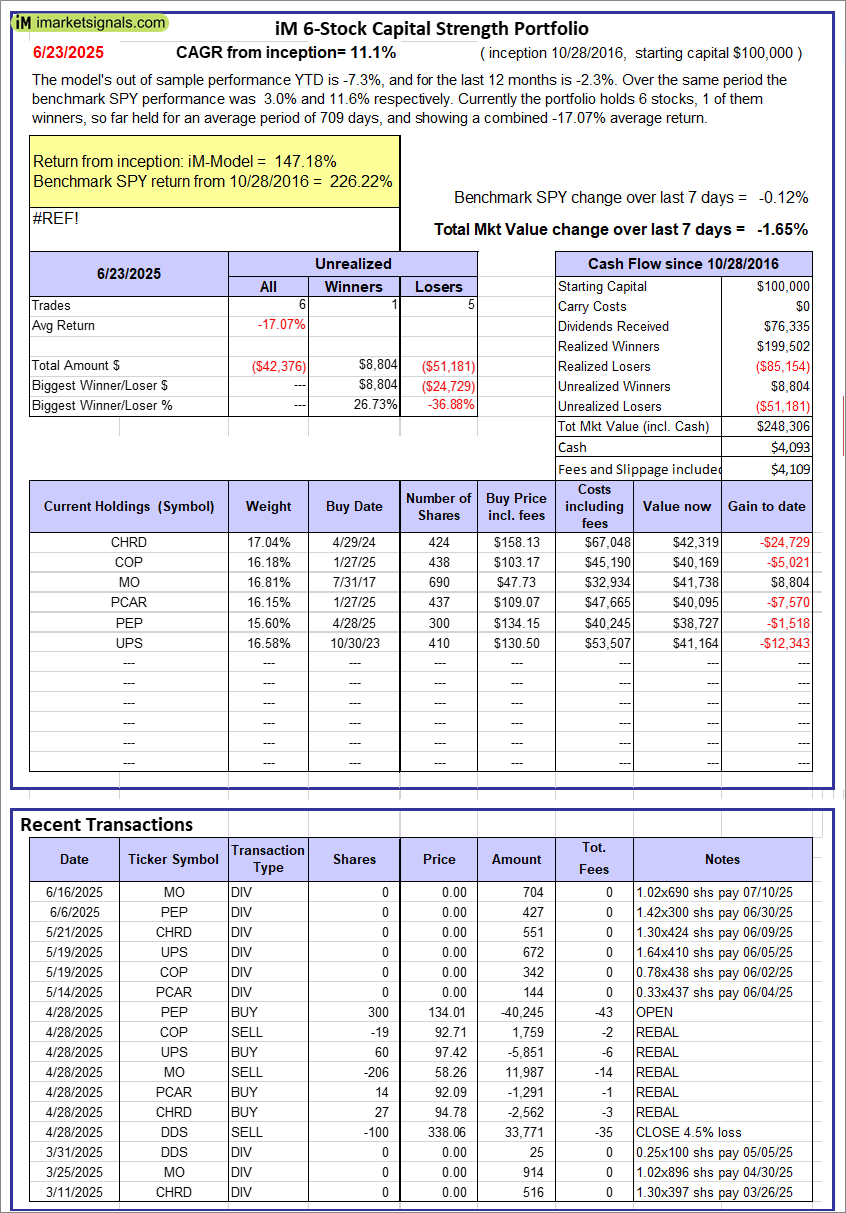 |
iM 6-Stock Capital Strength Portfolio: The model’s out of sample performance YTD is -7.3%, and for the last 12 months is -2.3%. Over the same period the benchmark SPY performance was 3.0% and 11.6% respectively. Over the previous week the market value of the iM 6-Stock Capital Strength Portfolio gained -1.65% at a time when SPY gained -0.12%. A starting capital of $100,000 at inception on 10/28/2016 would have grown to $248,306 which includes $4,093 cash and excludes $4,109 spent on fees and slippage. |
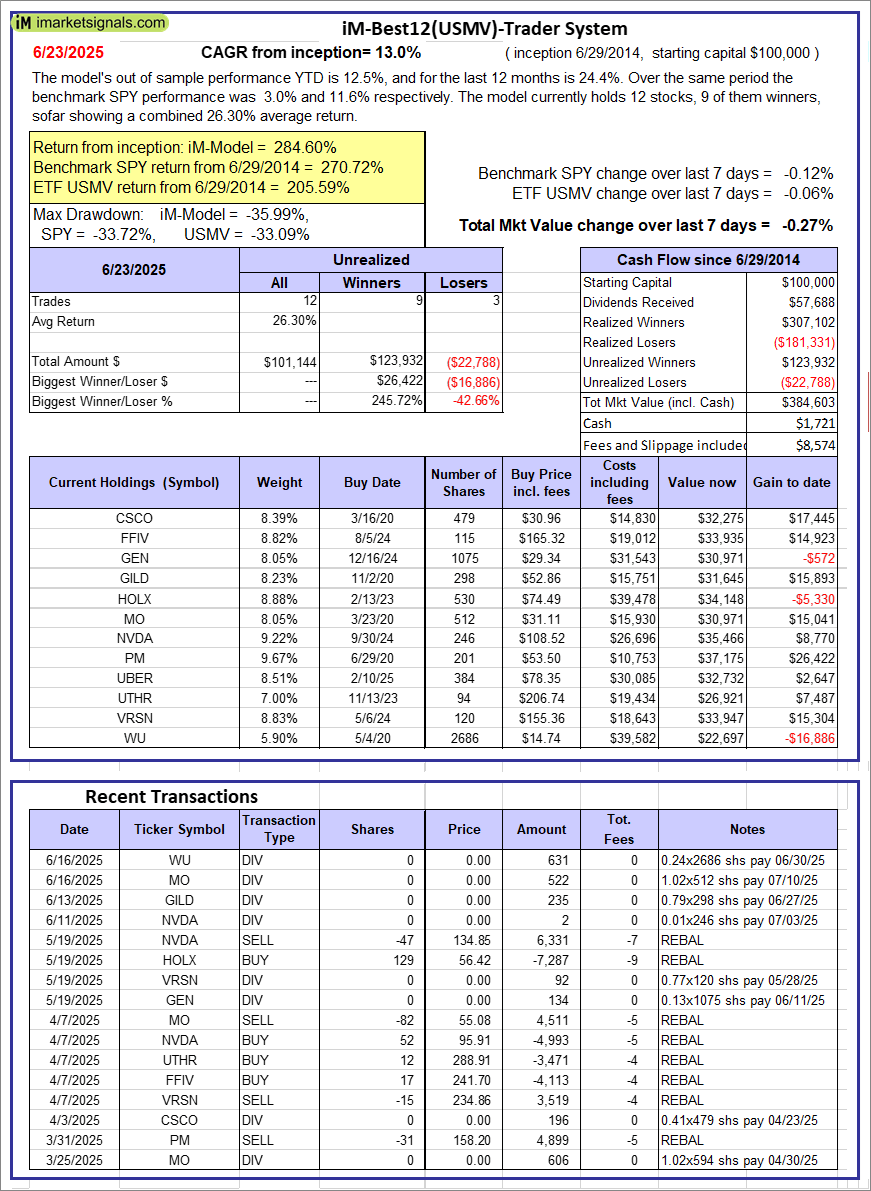 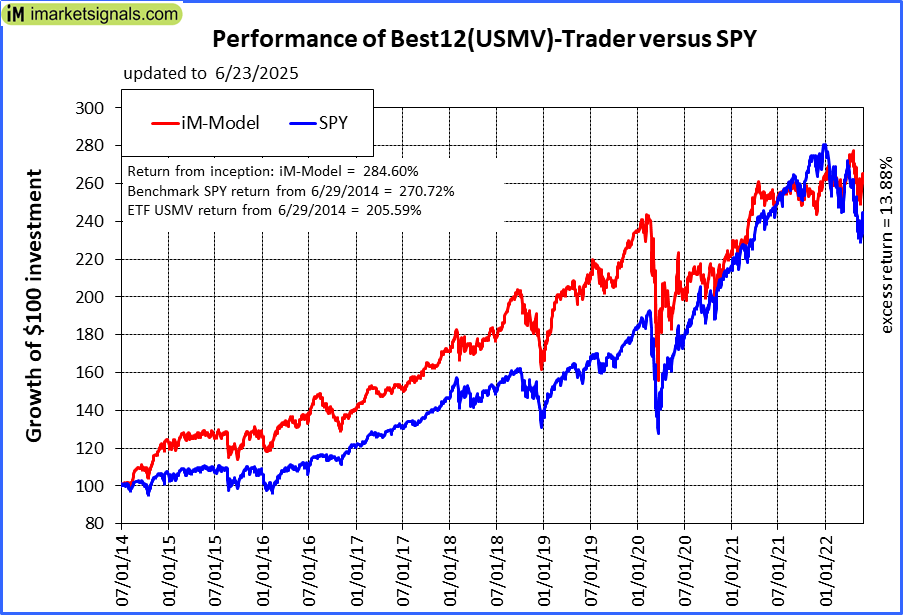 |
iM-Best12(USMV)-Trader: The model’s out of sample performance YTD is 12.5%, and for the last 12 months is 24.4%. Over the same period the benchmark SPY performance was 3.0% and 11.6% respectively. Since inception, on 6/30/2014, the model gained 284.60% while the benchmark SPY gained 270.72% and the ETF USMV gained 205.59% over the same period. Over the previous week the market value of iM-Best12(USMV)-Trader gained -0.27% at a time when SPY gained -0.12%. A starting capital of $100,000 at inception on 6/30/2014 would have grown to $384,603 which includes $1,721 cash and excludes $8,574 spent on fees and slippage. |
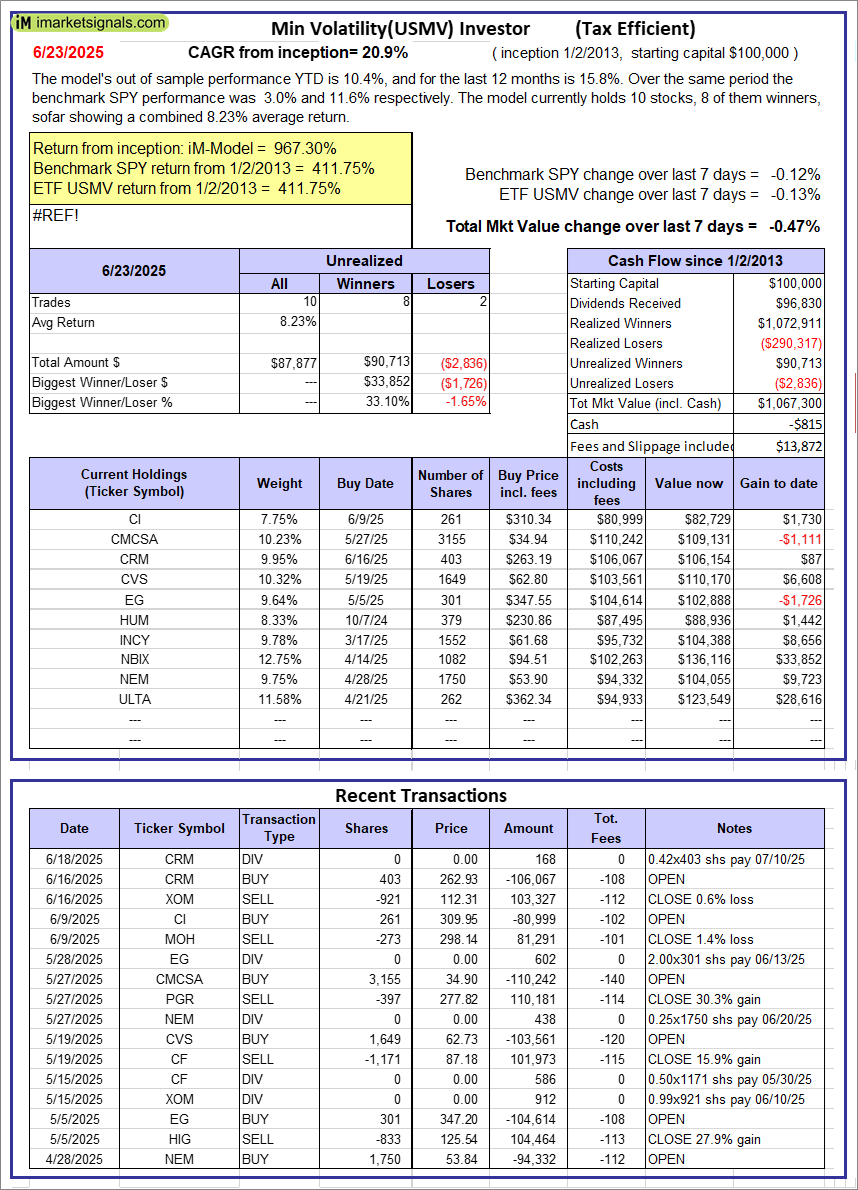 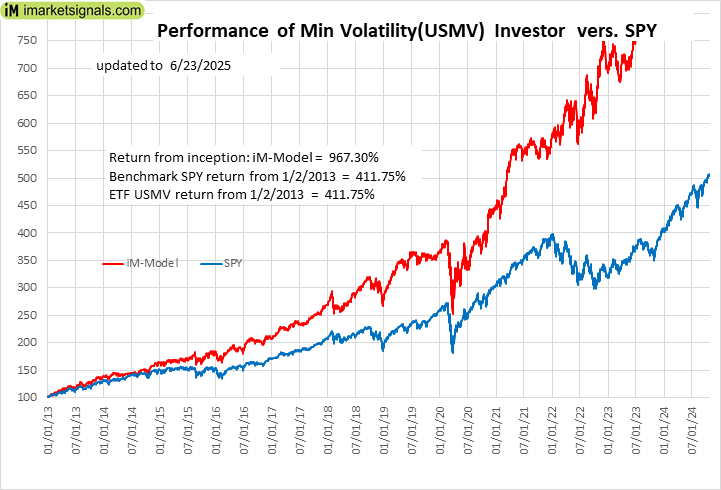 |
iM-Min Volatility(USMV) Investor (Tax Efficient): The model’s out of sample performance YTD is 10.4%, and for the last 12 months is 15.8%. Over the same period the benchmark SPY performance was 3.0% and 11.6% respectively. Since inception, on 1/3/2013, the model gained 967.30% while the benchmark SPY gained 411.75% and the ETF USMV gained 411.75% over the same period. Over the previous week the market value of iM-Best12(USMV)Q1 gained -0.47% at a time when SPY gained -0.12%. A starting capital of $100,000 at inception on 1/3/2013 would have grown to $1,067,300 which includes -$815 cash and excludes $13,872 spent on fees and slippage. |
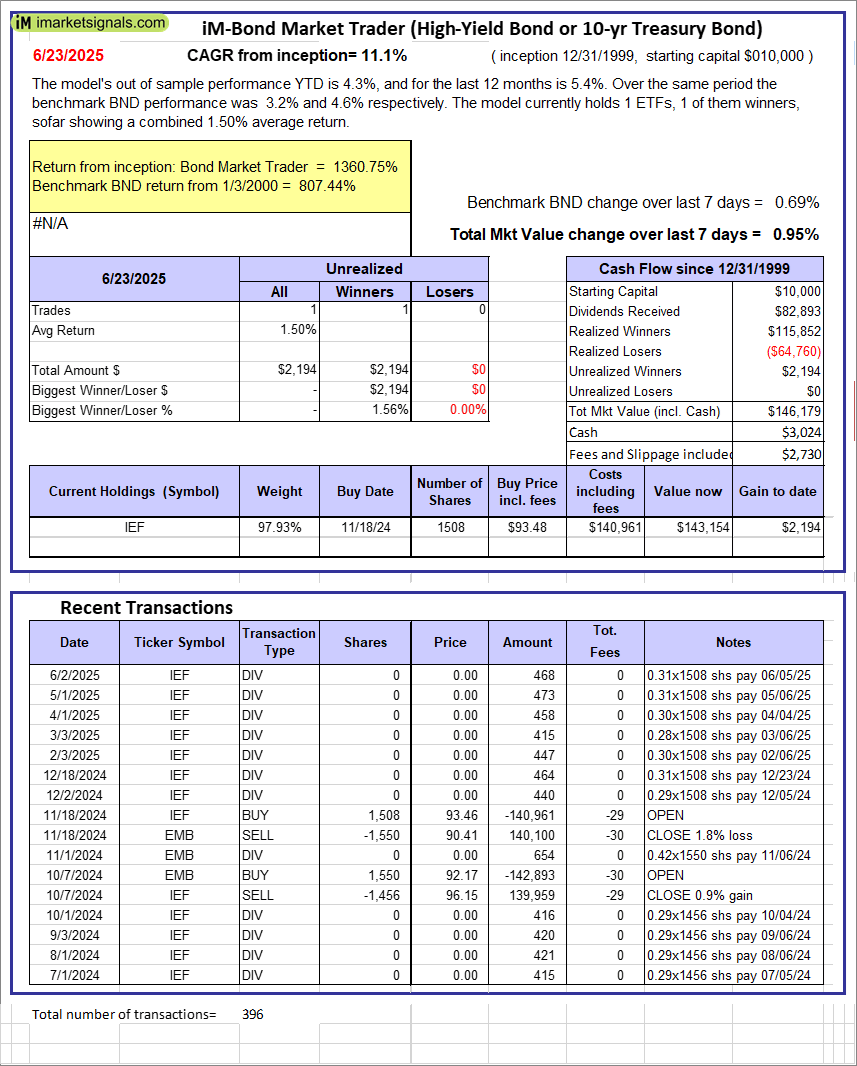 |
iM-Bond Market Trader (High-Yield Bond or 10-yr Treasury Bond): The model’s out of sample performance YTD is 4.3%, and for the last 12 months is 5.4%. Over the same period the benchmark BND performance was 3.2% and 4.6% respectively. Over the previous week the market value of the iM-Bond Market Trader (High-Yield Bond or 10-yr Treasury Bond) gained 0.95% at a time when BND gained 0.69%. A starting capital of $10,000 at inception on 1/3/2000 would have grown to $146,179 which includes $3,024 cash and excludes $2,730 spent on fees and slippage. |
|
|
iM-ModSum/YieldCurve Timer: The model’s out of sample performance YTD is 14.1%, and for the last 12 months is 23.2%. Over the same period the benchmark SPY performance was 3.0% and 11.6% respectively. Over the previous week the market value of iM-PortSum/YieldCurve Timer gained 0.96% at a time when SPY gained -0.12%. A starting capital of $100,000 at inception on 1/1/2016 would have grown to $366,196 which includes $1,095 cash and excludes $1,974 spent on fees and slippage. |
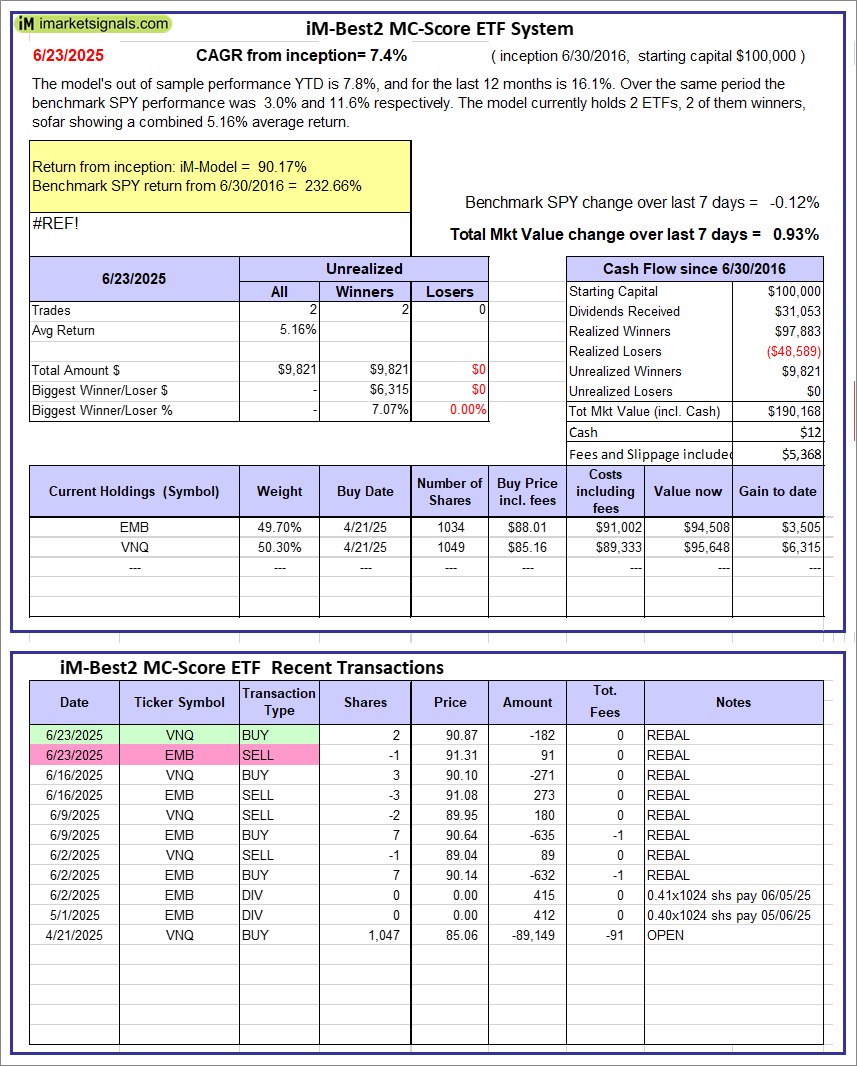 |
iM-Best2 MC-Score ETF System: The model’s out of sample performance YTD is 7.8%, and for the last 12 months is 16.1%. Over the same period the benchmark SPY performance was 3.0% and 11.6% respectively. Over the previous week the market value of the iM-Best2 MC-Score ETF System gained 0.93% at a time when SPY gained -0.12%. A starting capital of $100,000 at inception on 6/30/2016 would have grown to $190,168 which includes $12 cash and excludes $5,368 spent on fees and slippage. |
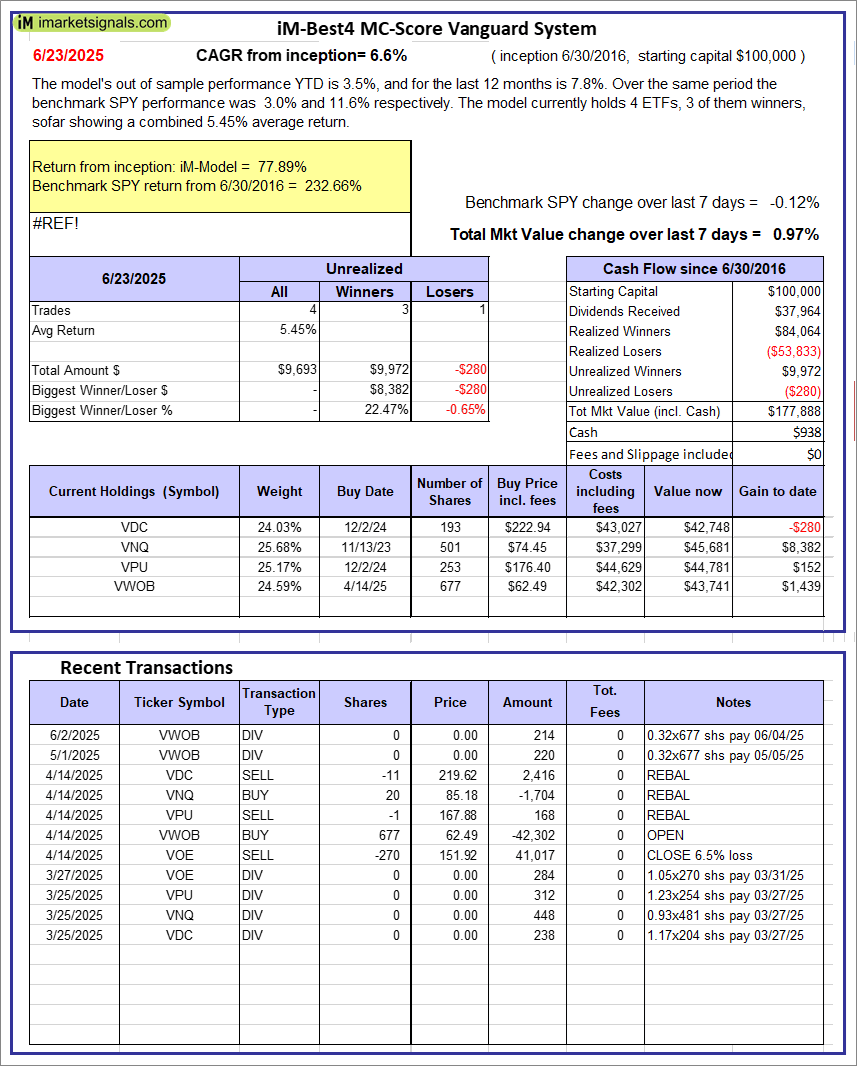 |
iM-Best4 MC-Score Vanguard System: The model’s out of sample performance YTD is 3.5%, and for the last 12 months is 7.8%. Over the same period the benchmark SPY performance was 3.0% and 11.6% respectively. Over the previous week the market value of the iM-Best4 MC-Score Vanguard System gained 0.97% at a time when SPY gained -0.12%. A starting capital of $100,000 at inception on 6/30/2016 would have grown to $177,888 which includes $938 cash and excludes $00 spent on fees and slippage. |
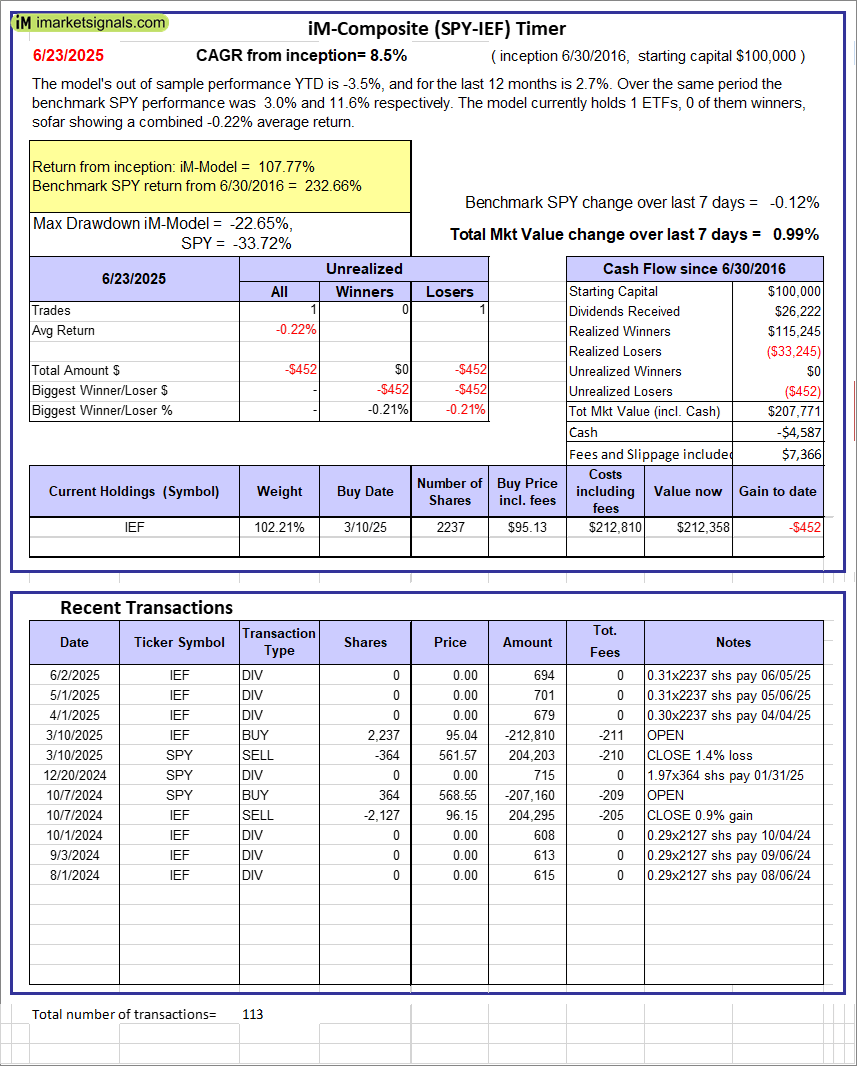 |
iM-Composite (SPY-IEF) Timer: The model’s out of sample performance YTD is -3.5%, and for the last 12 months is 2.7%. Over the same period the benchmark SPY performance was 3.0% and 11.6% respectively. Over the previous week the market value of the iM-Composite (SPY-IEF) Timer gained 0.99% at a time when SPY gained -0.12%. A starting capital of $100,000 at inception on 6/30/2016 would have grown to $207,771 which includes -$4,587 cash and excludes $7,366 spent on fees and slippage. |
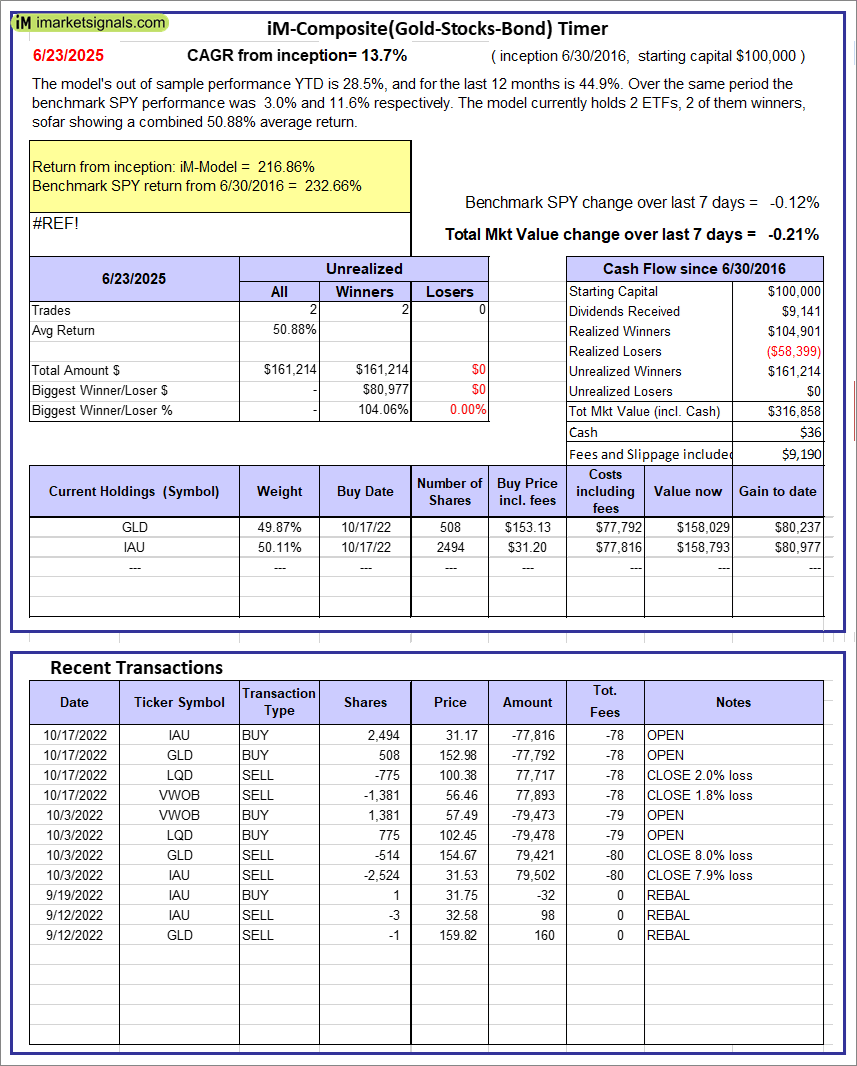 |
iM-Composite(Gold-Stocks-Bond) Timer: The model’s out of sample performance YTD is 28.5%, and for the last 12 months is 44.9%. Over the same period the benchmark SPY performance was 3.0% and 11.6% respectively. Over the previous week the market value of the iM-Composite(Gold-Stocks-Bond) Timer gained -0.21% at a time when SPY gained -0.12%. A starting capital of $100,000 at inception on 6/30/2016 would have grown to $316,858 which includes $36 cash and excludes $9,190 spent on fees and slippage. |
iM-Best Reports – 6/24/2025
Posted in pmp SPY-SH
Leave a Reply
You must be logged in to post a comment.