
  |
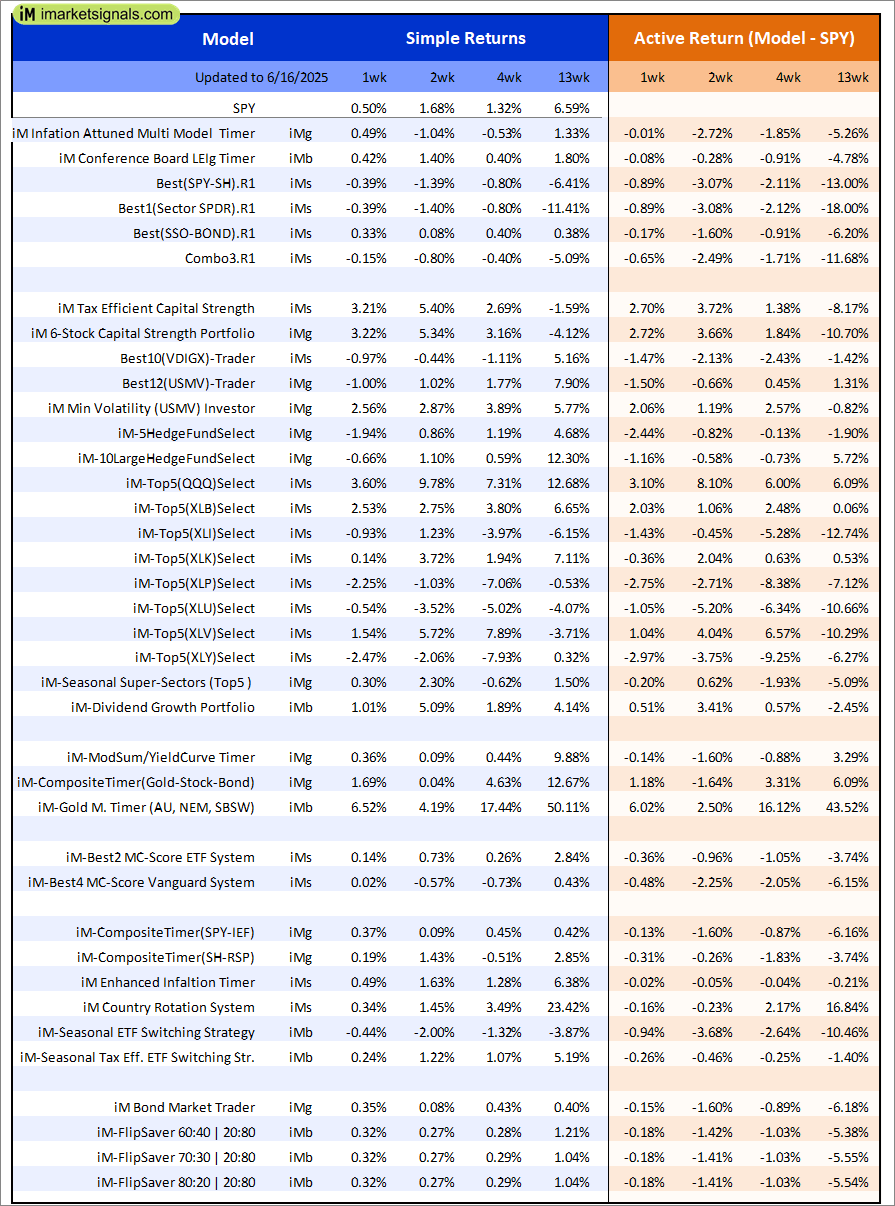
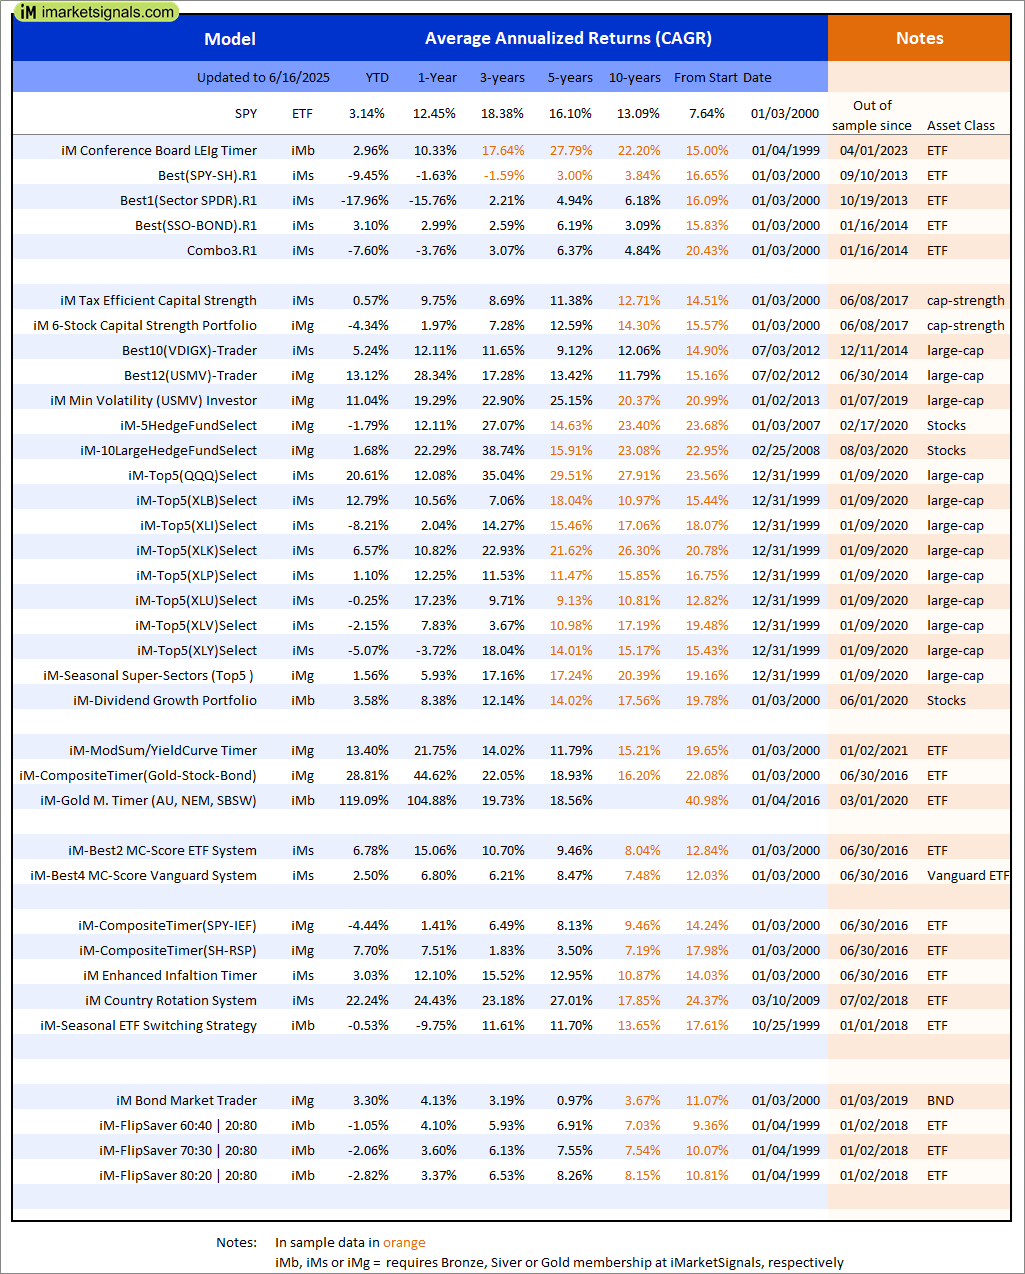
Out of sample performance summary of our models for the past 1, 2, 4 and 13 week periods. The active active return indicates how the models over- or underperformed the benchmark ETF SPY. Also the YTD, and the 1-, 3-, 5- and 10-year annualized returns are shown in the second table |
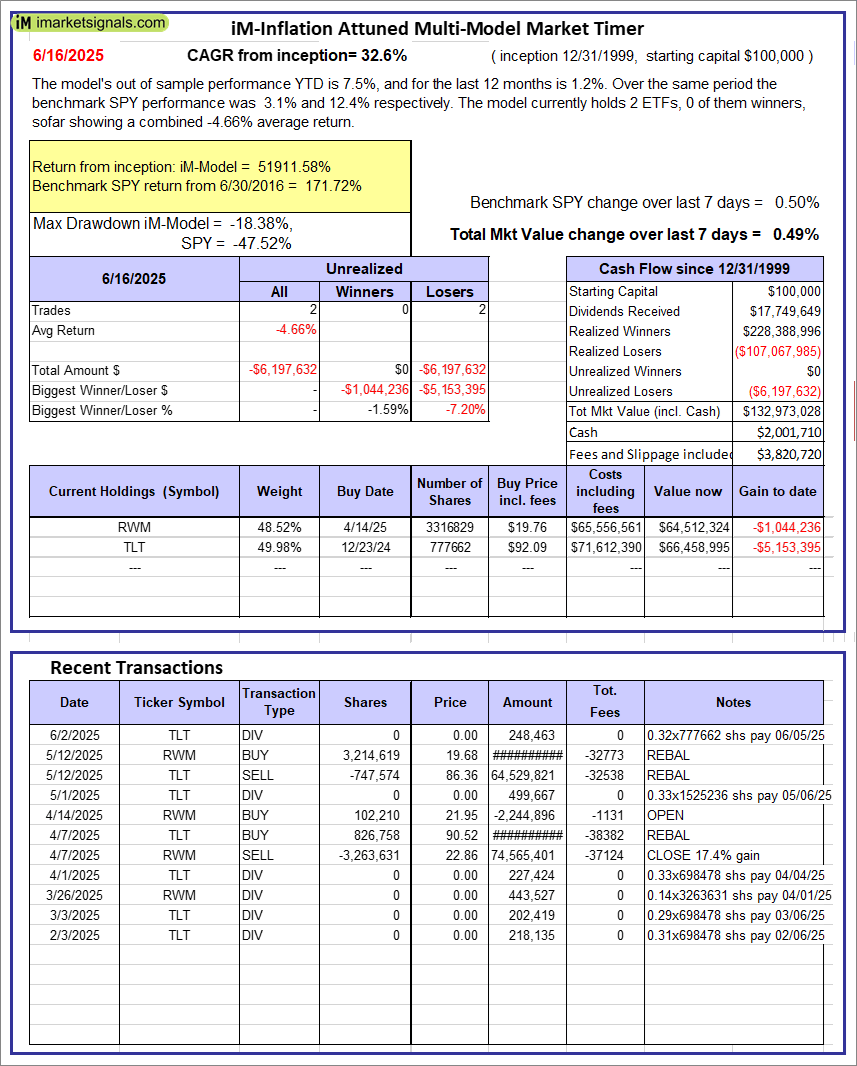 |
iM-Inflation Attuned Multi-Model Market Timer: The model’s out of sample performance YTD is 7.5%, and for the last 12 months is 1.2%. Over the same period the benchmark SPY performance was 3.1% and 12.4% respectively. Over the previous week the market value of the iM-Inflation Attuned Multi-Model Market Timer gained 0.49% at a time when SPY gained 0.50%. A starting capital of $100,000 at inception on 3/24/2017 would have grown to $132,973,028 which includes $2,001,710 cash and excludes $3,820,720 spent on fees and slippage. |
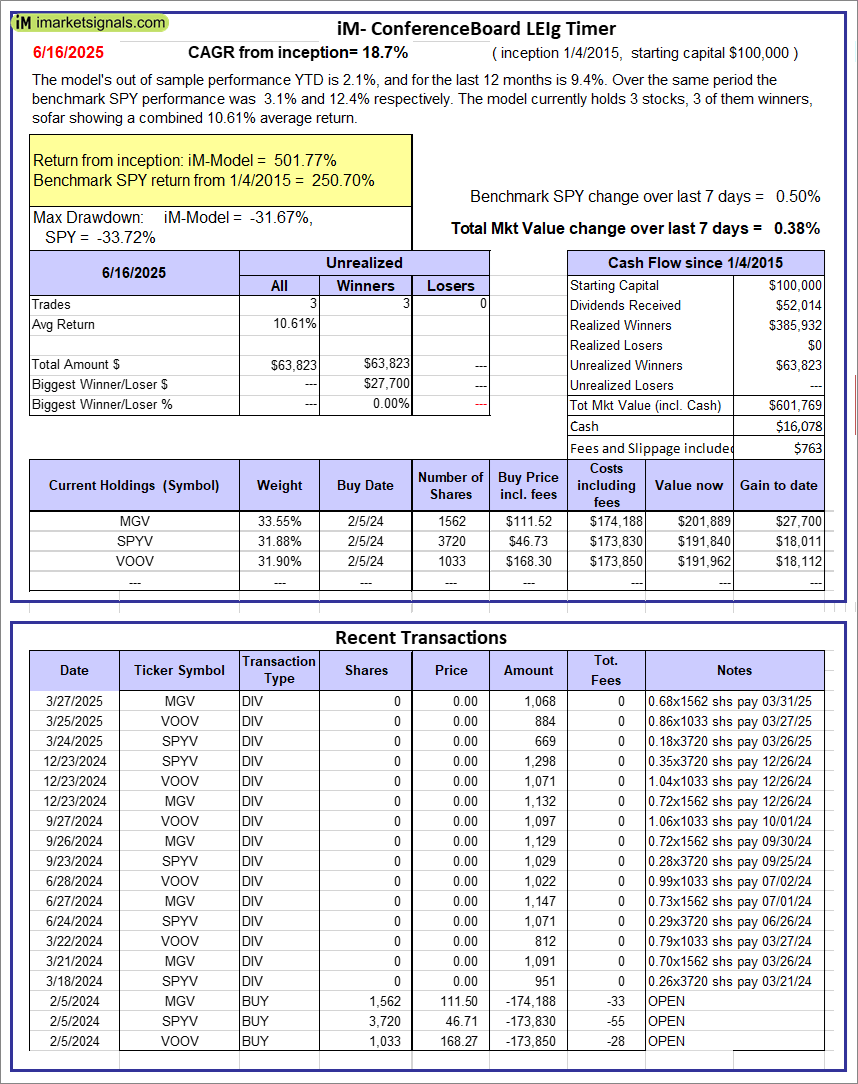 |
iM-Conference Board LEIg Timer: The model’s performance YTD is 14.3%, and for the last 12 months is 7.3%. Over the same period the benchmark SPY performance was 20.1% and 9.4% respectively. Over the previous week the market value of the iM-Conference Board LEIg Timer gained 0.38% at a time when SPY gained 0.50%. A starting capital of $100,000 at inception on 4/5/2017 would have grown to $601,769 which includes $16,078 cash and excludes $763 spent on fees and slippage. |
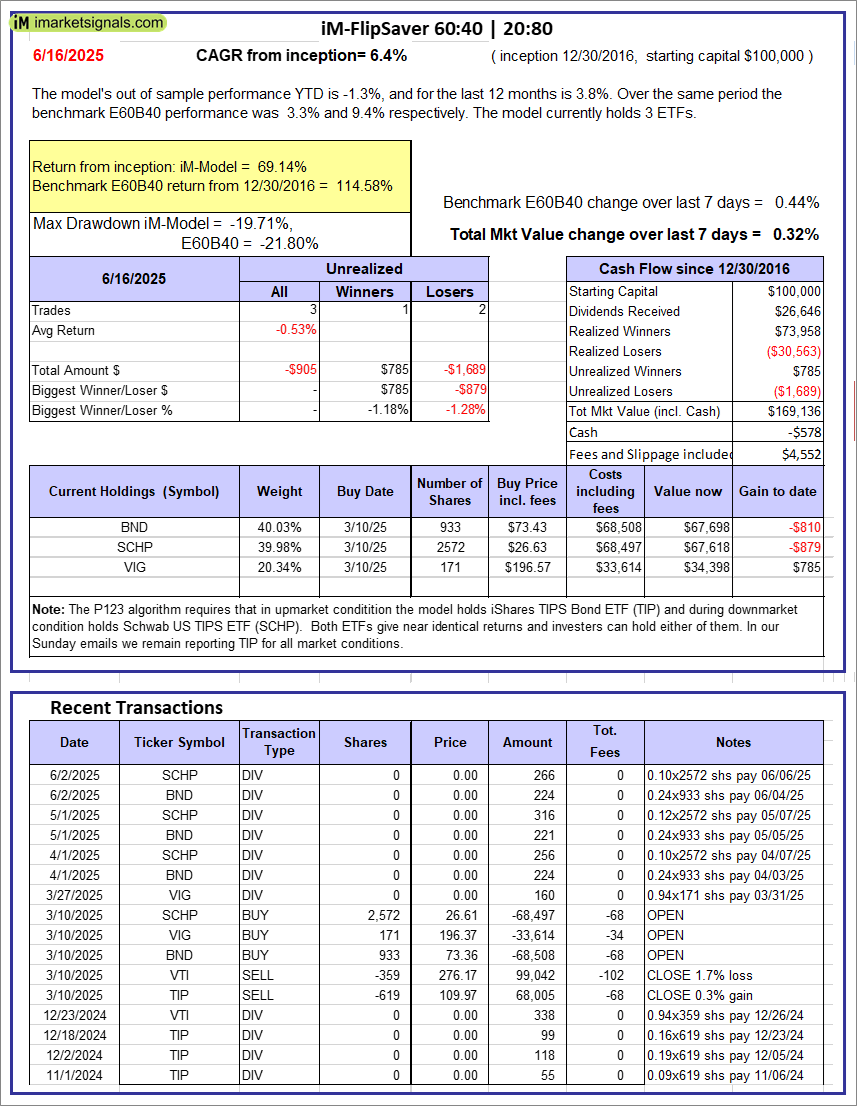 |
iM-FlipSaver 60:40 | 20:80 – 2017: The model’s out of sample performance YTD is -1.3%, and for the last 12 months is 3.8%. Over the same period the benchmark E60B40 performance was 3.3% and 9.4% respectively. Over the previous week the market value of iM-FlipSaver 80:20 | 20:80 gained 0.32% at a time when SPY gained 0.44%. A starting capital of $100,000 at inception on 7/16/2015 would have grown to $169,136 which includes -$578 cash and excludes $4,552 spent on fees and slippage. |
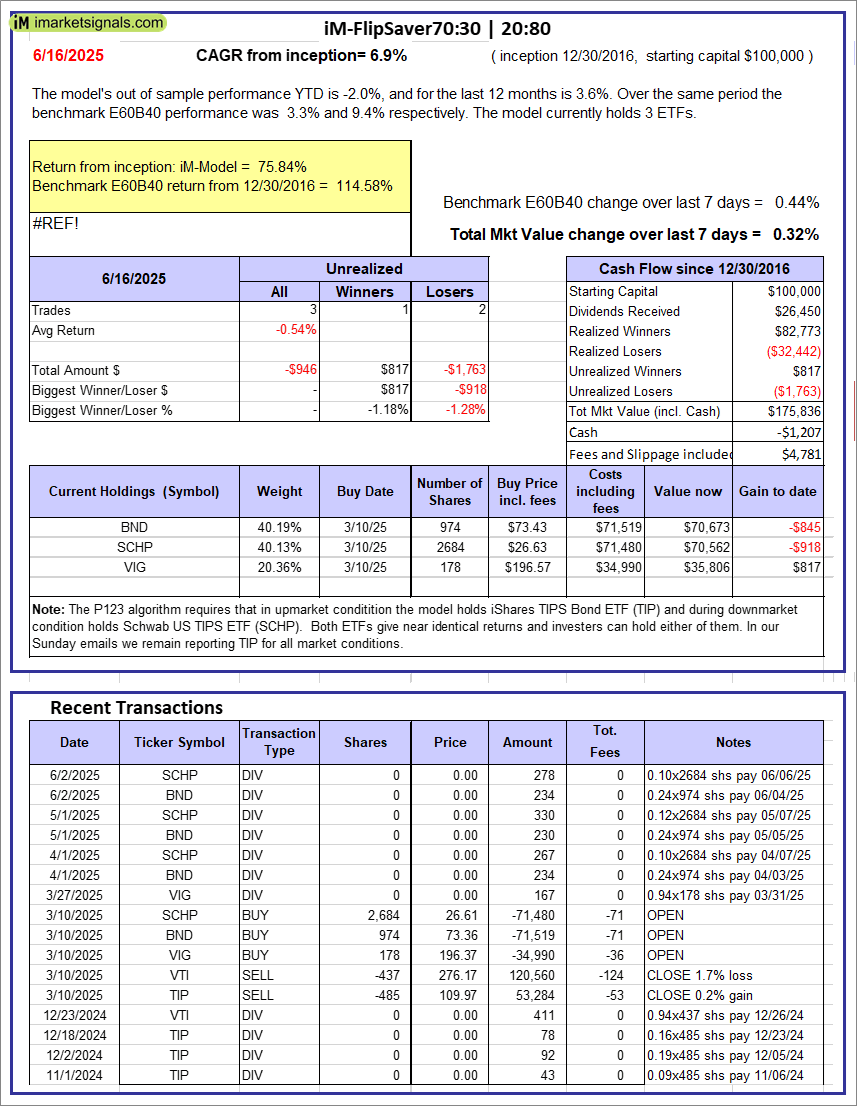 |
iM-FlipSaver 70:30 | 20:80 – 2017: The model’s out of sample performance YTD is -2.0%, and for the last 12 months is 3.6%. Over the same period the benchmark E60B40 performance was 3.3% and 9.4% respectively. Over the previous week the market value of iM-FlipSaver 70:30 | 20:80 gained 0.32% at a time when SPY gained 0.44%. A starting capital of $100,000 at inception on 7/15/2015 would have grown to $175,836 which includes -$1,207 cash and excludes $4,781 spent on fees and slippage. |
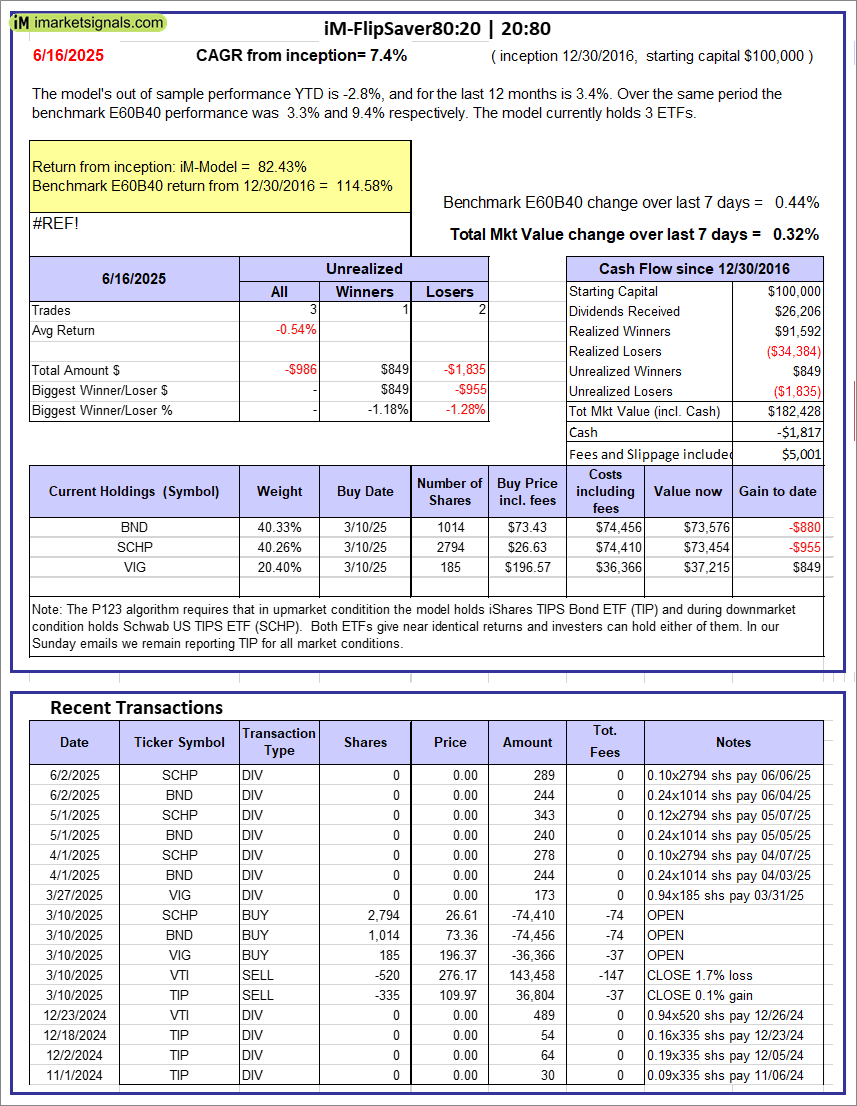 |
iM-FlipSaver 80:20 | 20:80 – 2017: The model’s out of sample performance YTD is -2.8%, and for the last 12 months is 3.4%. Over the same period the benchmark E60B40 performance was 3.3% and 9.4% respectively. Over the previous week the market value of iM-FlipSaver 80:20 | 20:80 gained 0.32% at a time when SPY gained 0.44%. A starting capital of $100,000 at inception on 1/2/2017 would have grown to $182,428 which includes -$1,817 cash and excludes $5,001 spent on fees and slippage. |
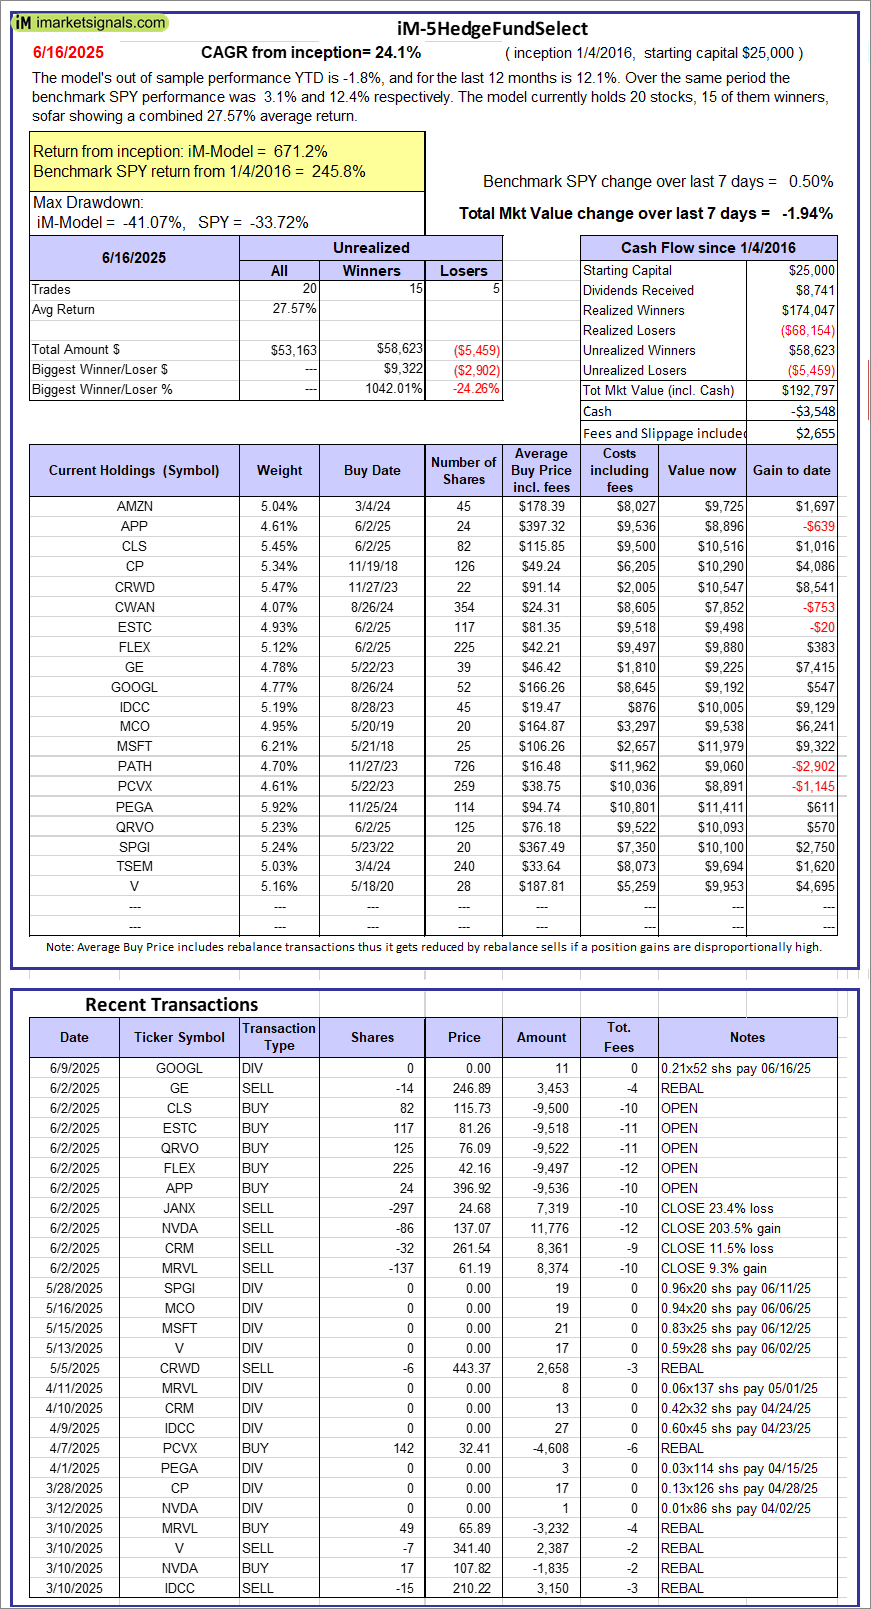 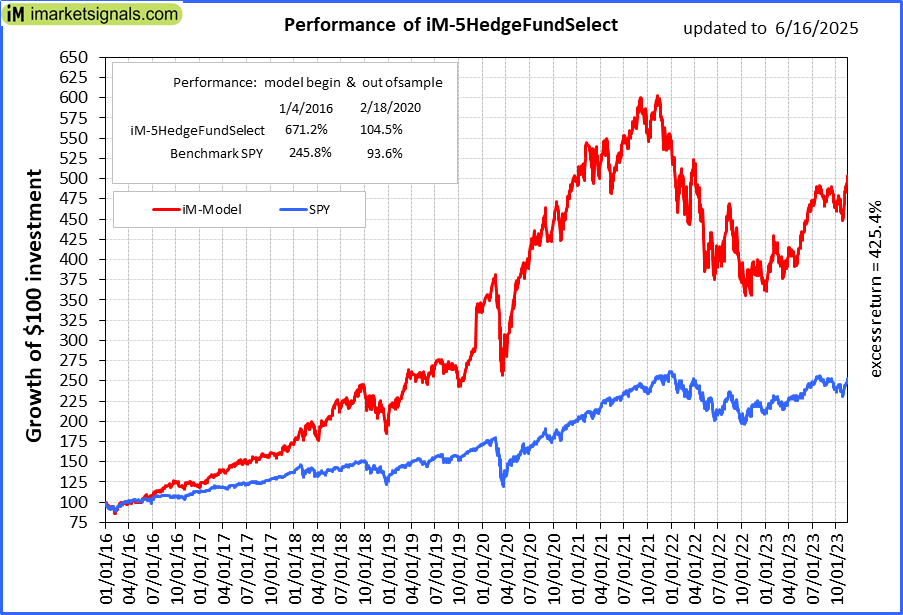 |
iM-5HedgeFundSelect: Since inception, on 1/5/2016, the model gained 671.19% while the benchmark SPY gained 245.79% over the same period. Over the previous week the market value of iM-5HedgeFundSelect gained -1.94% at a time when SPY gained 0.50%. A starting capital of $25,000 at inception on 1/5/2016 would have grown to $192,797 which includes -$3,548 cash and excludes $2,655 spent on fees and slippage. |
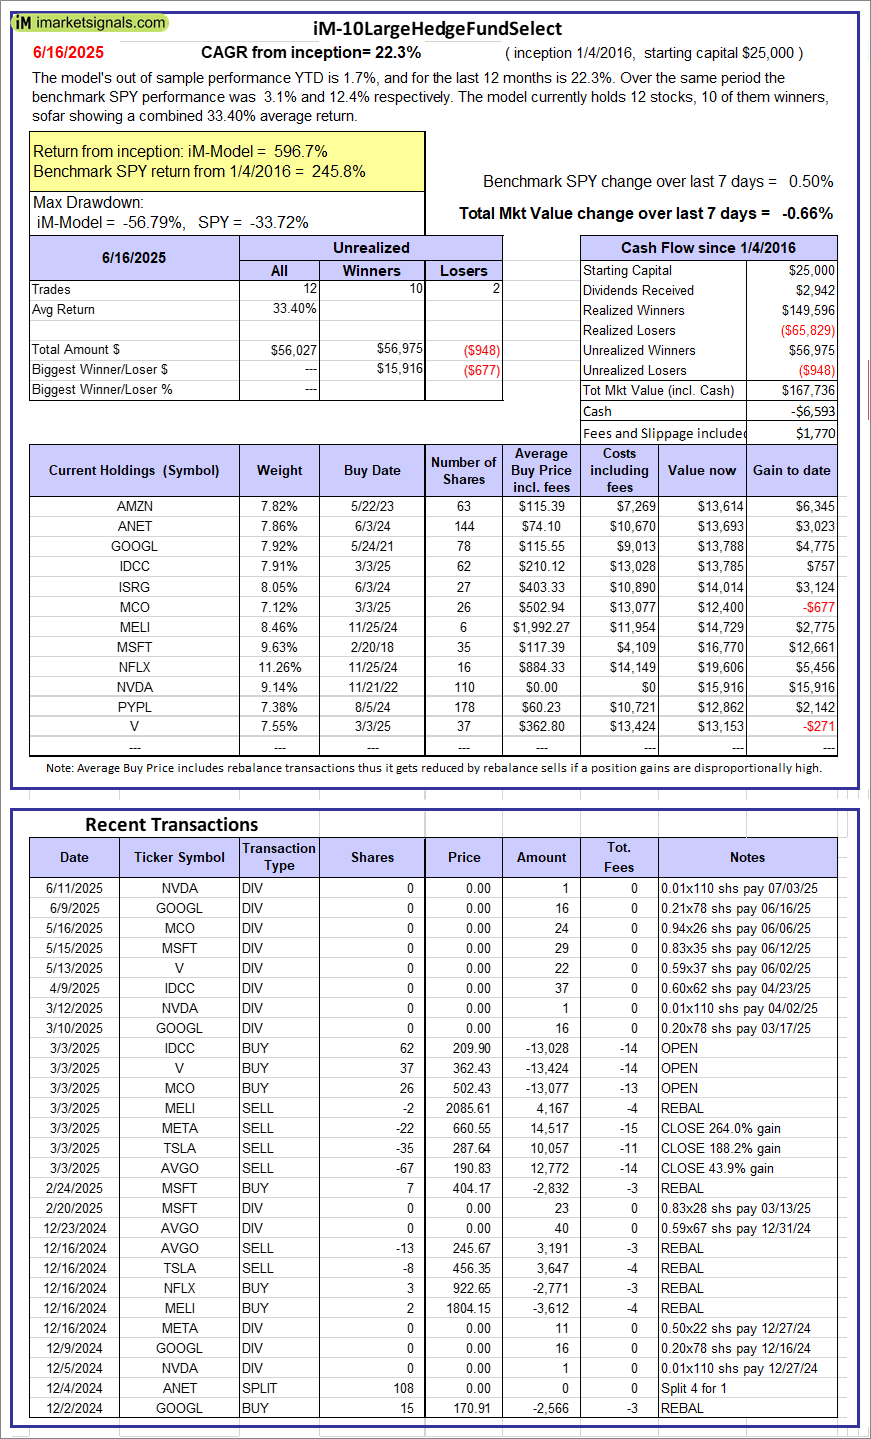 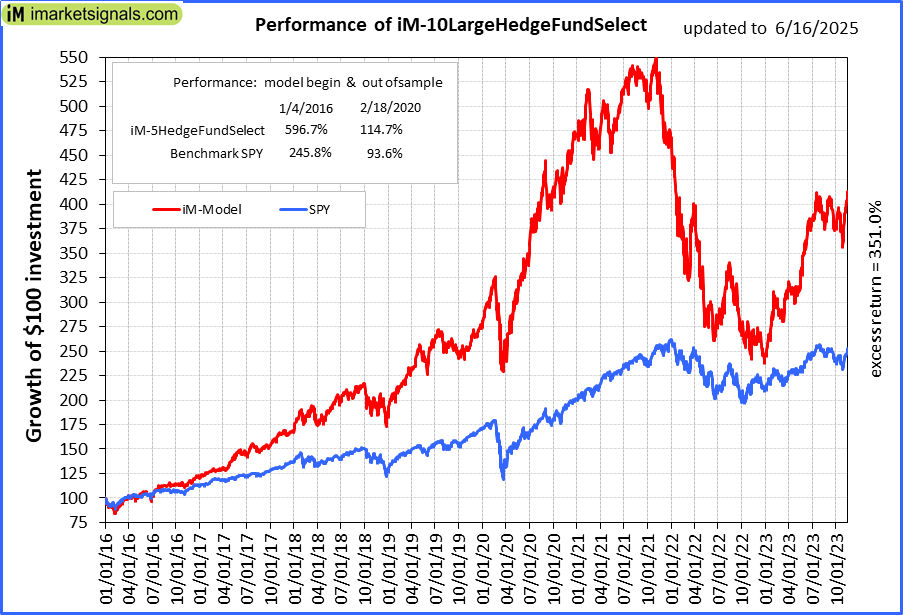 |
iM-10LargeHedgeFundSelect: Since inception, on 1/5/2016, the model gained 596.74% while the benchmark SPY gained 245.79% over the same period. Over the previous week the market value of iM-10LargeHedgeFundSelect gained -0.66% at a time when SPY gained 0.50%. A starting capital of $25,000 at inception on 1/5/2016 would have grown to $167,736 which includes -$6,593 cash and excludes $1,770 spent on fees and slippage. |
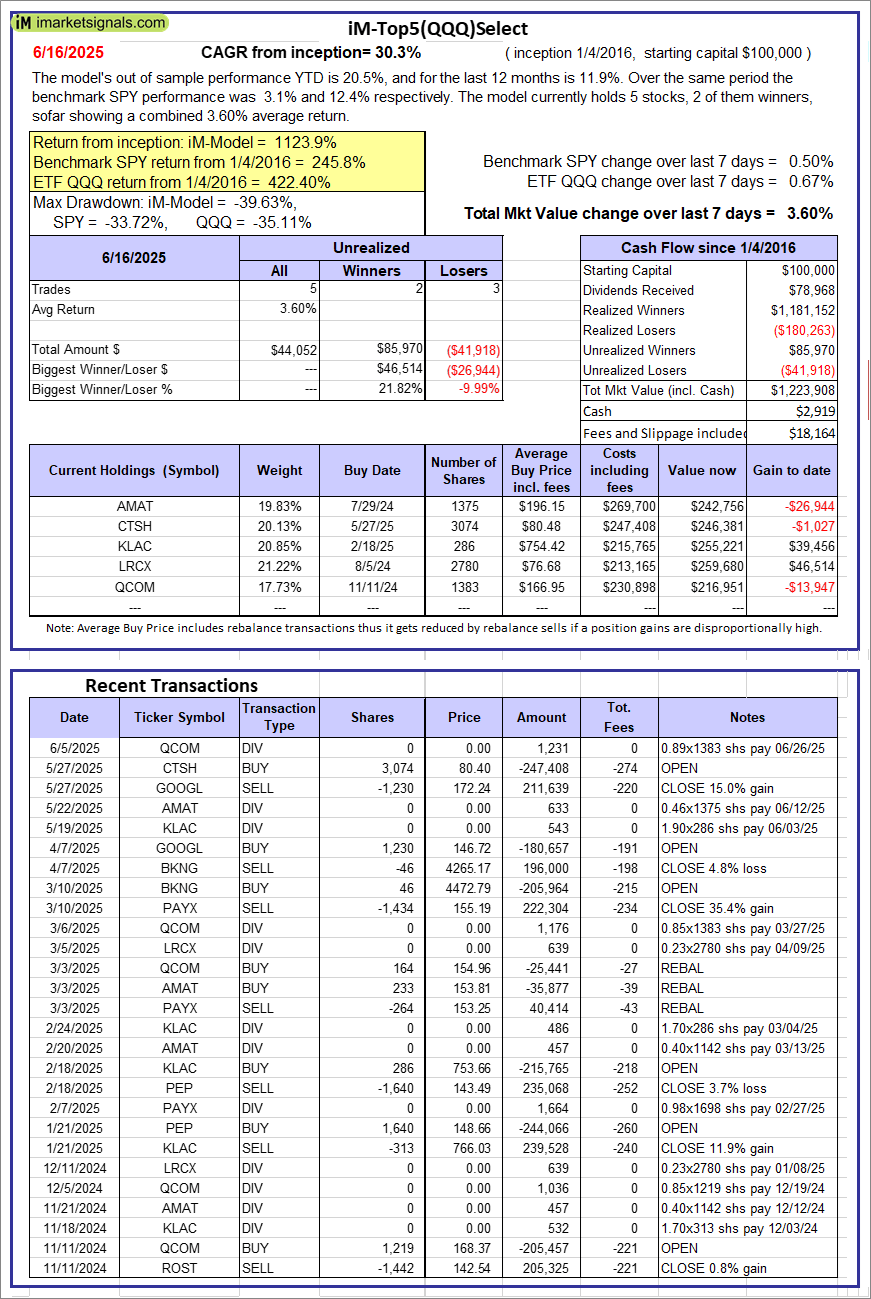 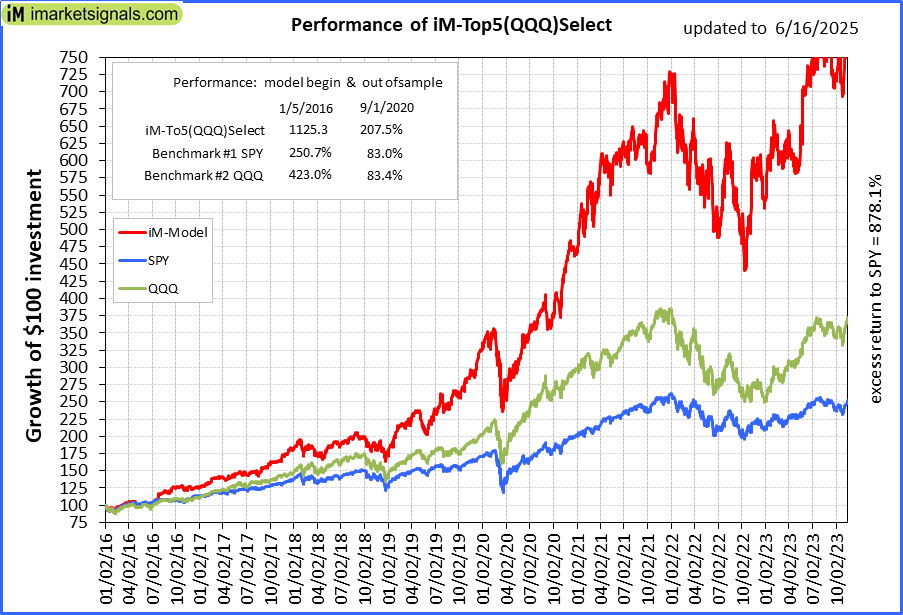 |
iM-Top5(QQQ)Select: Since inception, on 1/5/2016, the model gained 1123.91% while the benchmark SPY gained 245.79% over the same period. Over the previous week the market value of iM-Top5(QQQ)Select gained 3.60% at a time when SPY gained 0.50%. A starting capital of $100,000 at inception on 1/5/2016 would have grown to $1,223,908 which includes $2,919 cash and excludes $18,164 spent on fees and slippage. |
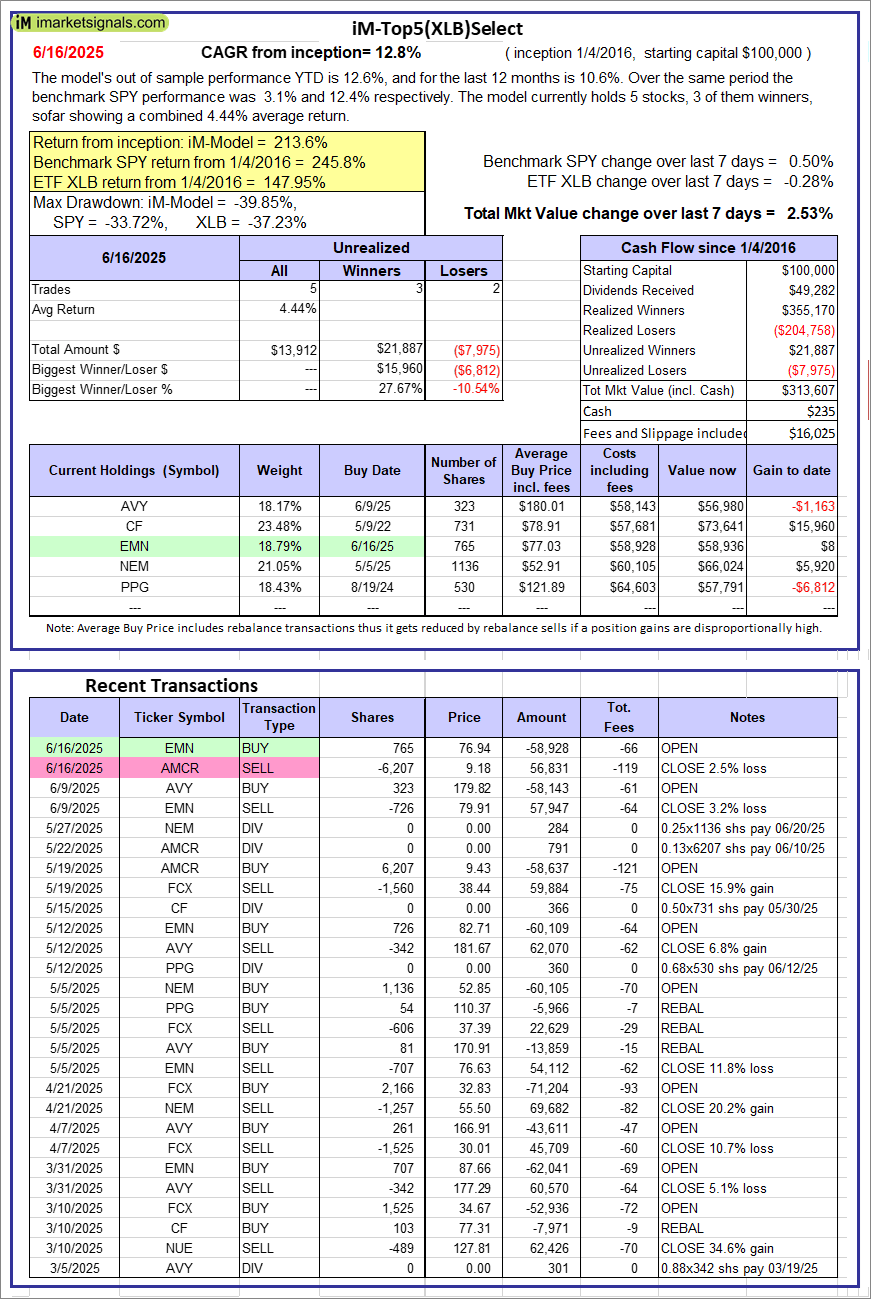  |
iM-Top5(XLB)Select: Since inception, on 1/5/2016, the model gained 213.61% while the benchmark SPY gained 245.79% over the same period. Over the previous week the market value of iM-Top5(XLB)Select gained 2.53% at a time when SPY gained 0.50%. A starting capital of $100,000 at inception on 1/5/2016 would have grown to $313,607 which includes $235 cash and excludes $16,025 spent on fees and slippage. |
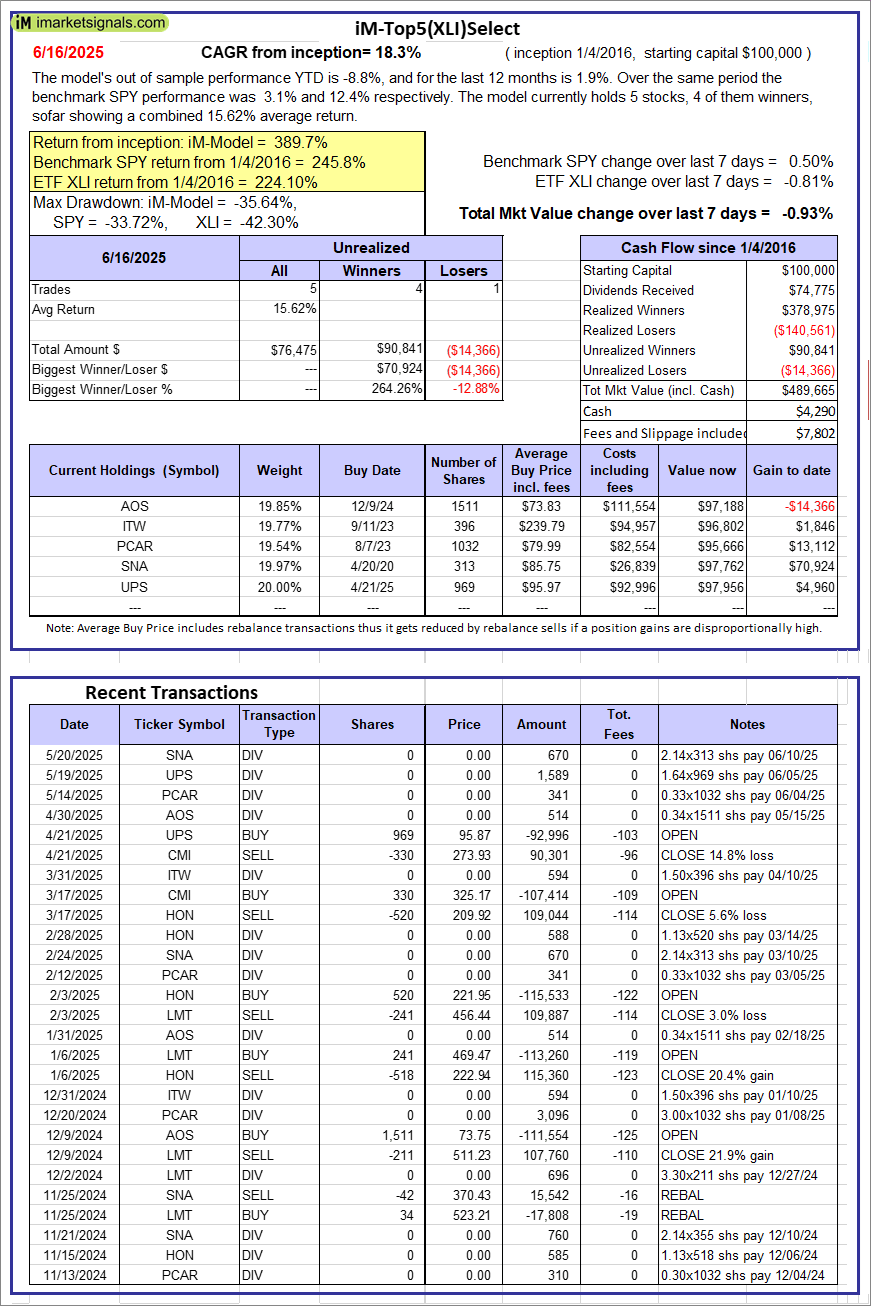 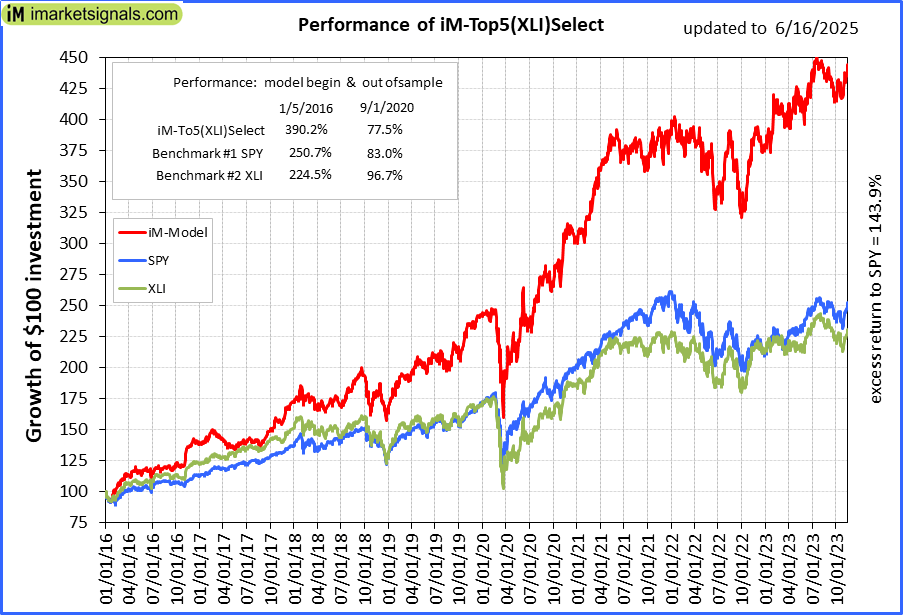 |
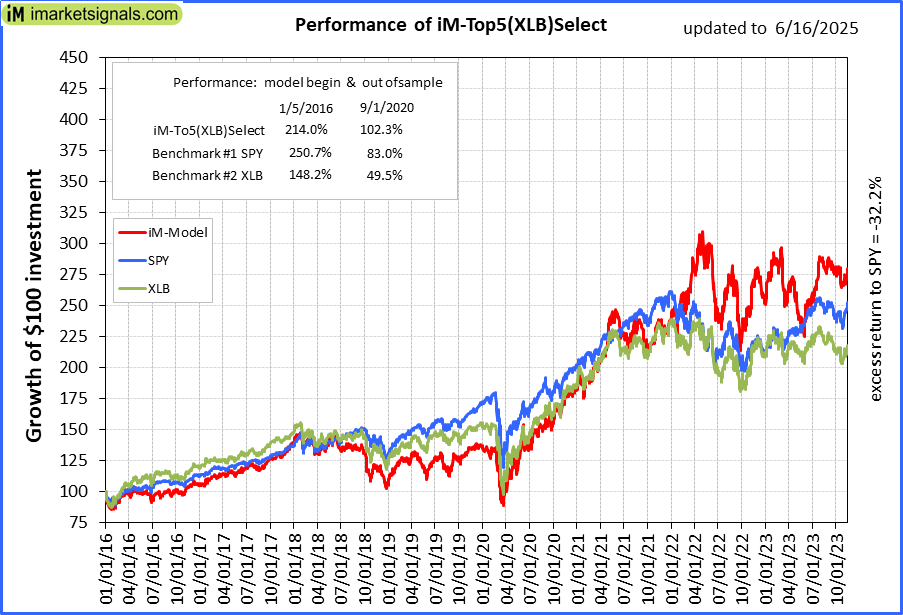
iM-Top5(XLI)Select: Since inception, on 1/5/2016, the model gained 389.66% while the benchmark SPY gained 245.79% over the same period. Over the previous week the market value of iM-Top5(XLI)Select gained -0.93% at a time when SPY gained 0.50%. A starting capital of $100,000 at inception on 1/5/2016 would have grown to $489,665 which includes $4,290 cash and excludes $7,802 spent on fees and slippage. |
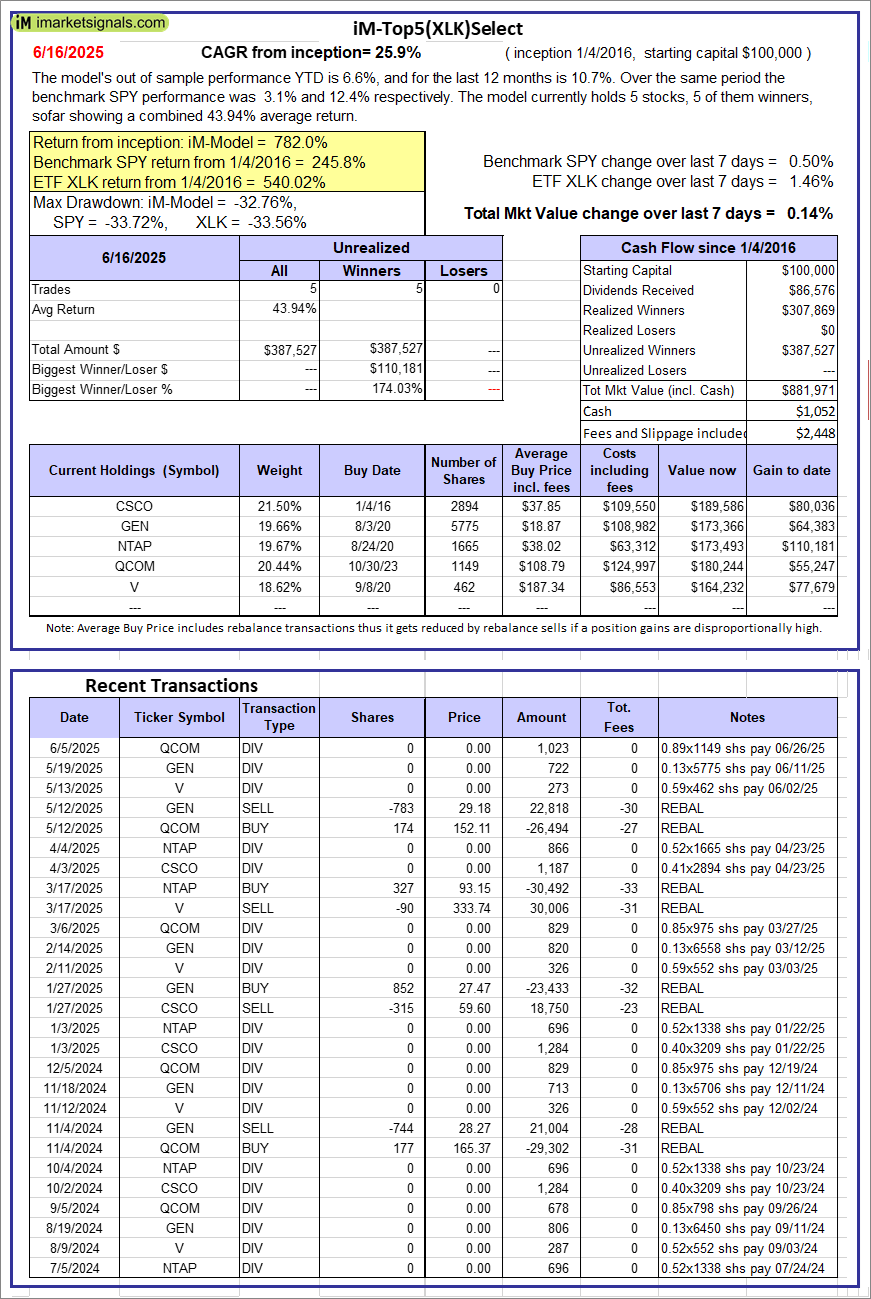 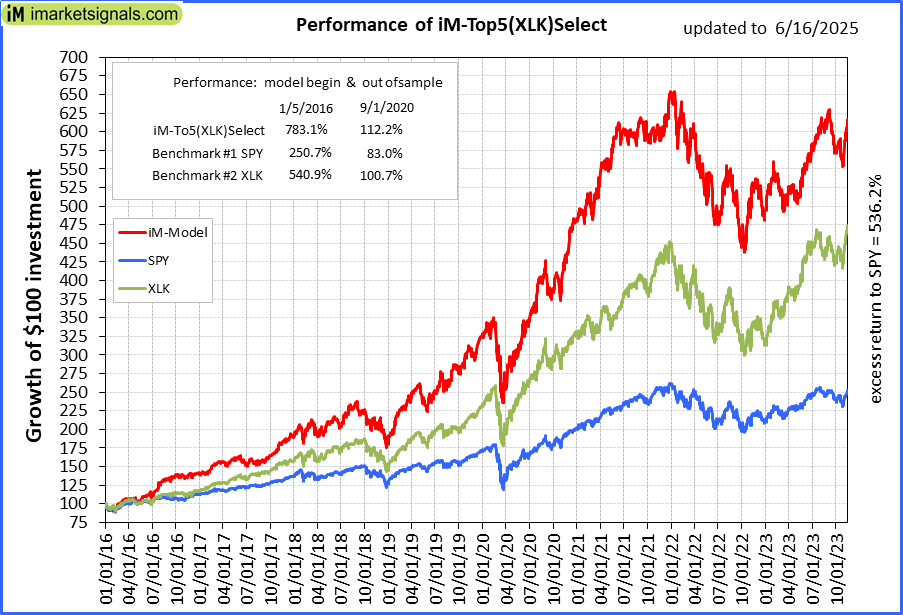 |
iM-Top5(XLK)Select: Since inception, on 1/5/2016, the model gained 781.97% while the benchmark SPY gained 245.79% over the same period. Over the previous week the market value of iM-Top5(XLK)Select gained 0.14% at a time when SPY gained 0.50%. A starting capital of $100,000 at inception on 1/5/2016 would have grown to $881,971 which includes $1,052 cash and excludes $2,448 spent on fees and slippage. |
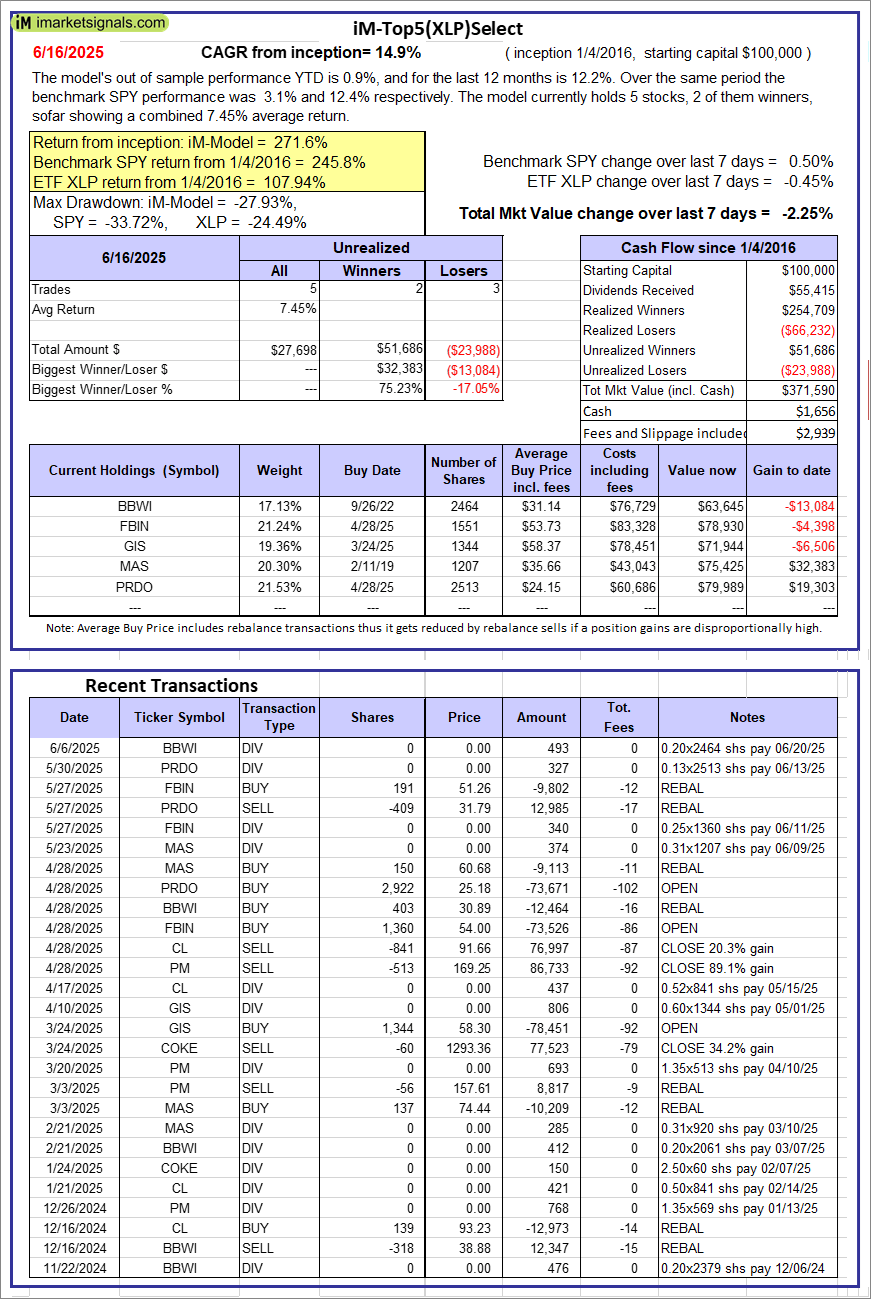 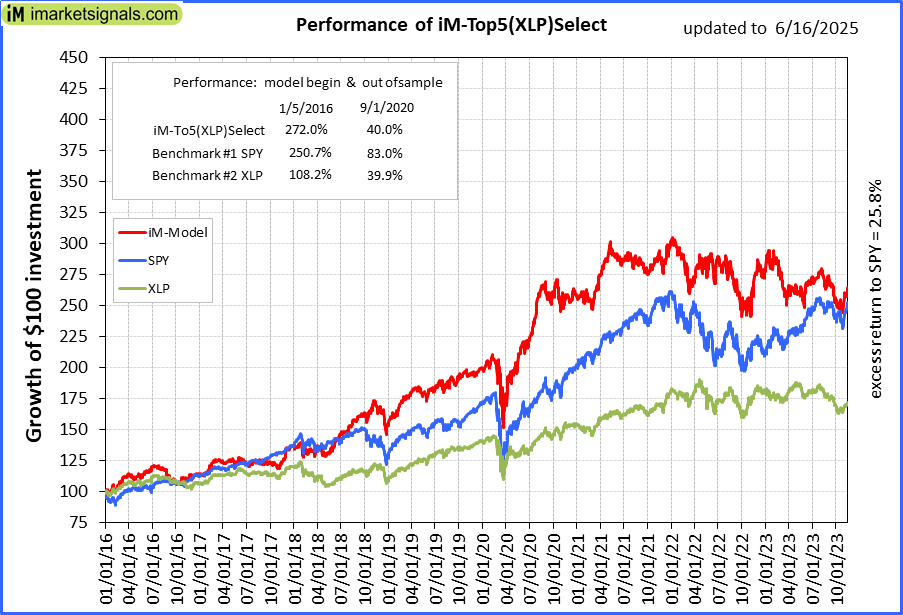 |
iM-Top5(XLP)Select: Since inception, on 1/5/2016, the model gained 271.59% while the benchmark SPY gained 245.79% over the same period. Over the previous week the market value of iM-Top5(XLP)Select gained -2.25% at a time when SPY gained 0.50%. A starting capital of $100,000 at inception on 1/5/2016 would have grown to $371,590 which includes $1,656 cash and excludes $2,939 spent on fees and slippage. |
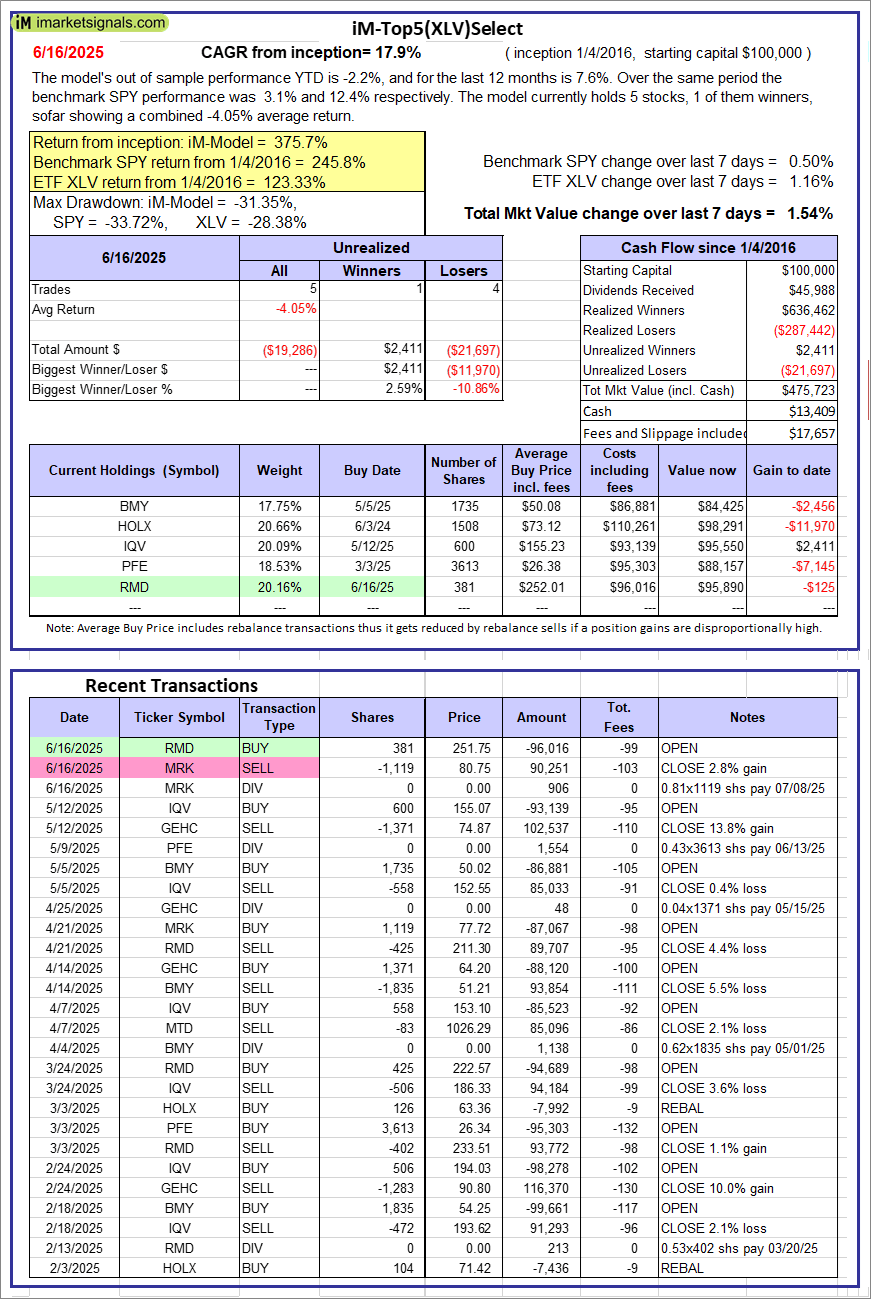 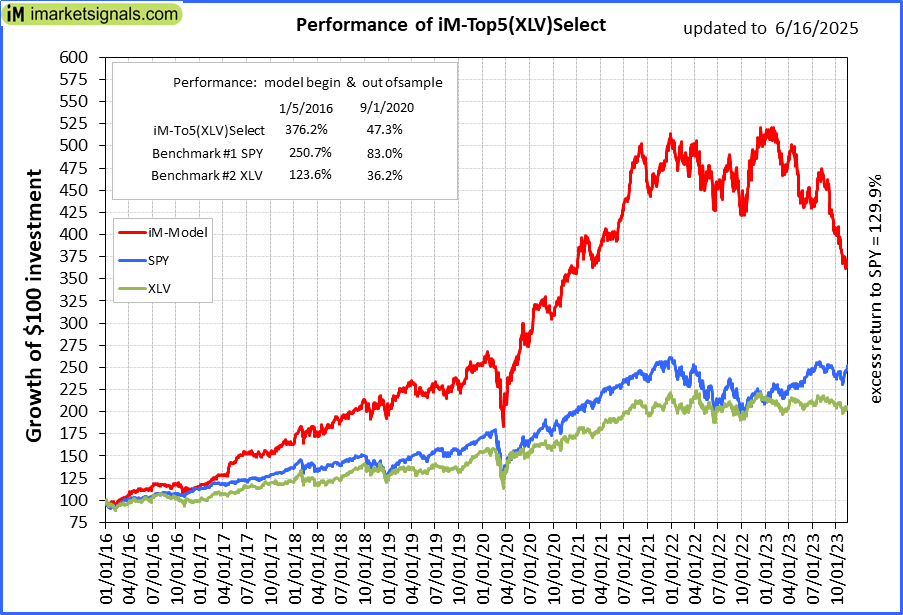 |
iM-Top5(XLV)Select: Since inception, on 1/5/2016, the model gained 375.72% while the benchmark SPY gained 245.79% over the same period. Over the previous week the market value of iM-Top5(XLV)Select gained 1.54% at a time when SPY gained 0.50%. A starting capital of $100,000 at inception on 1/5/2016 would have grown to $475,723 which includes $13,409 cash and excludes $17,657 spent on fees and slippage. |
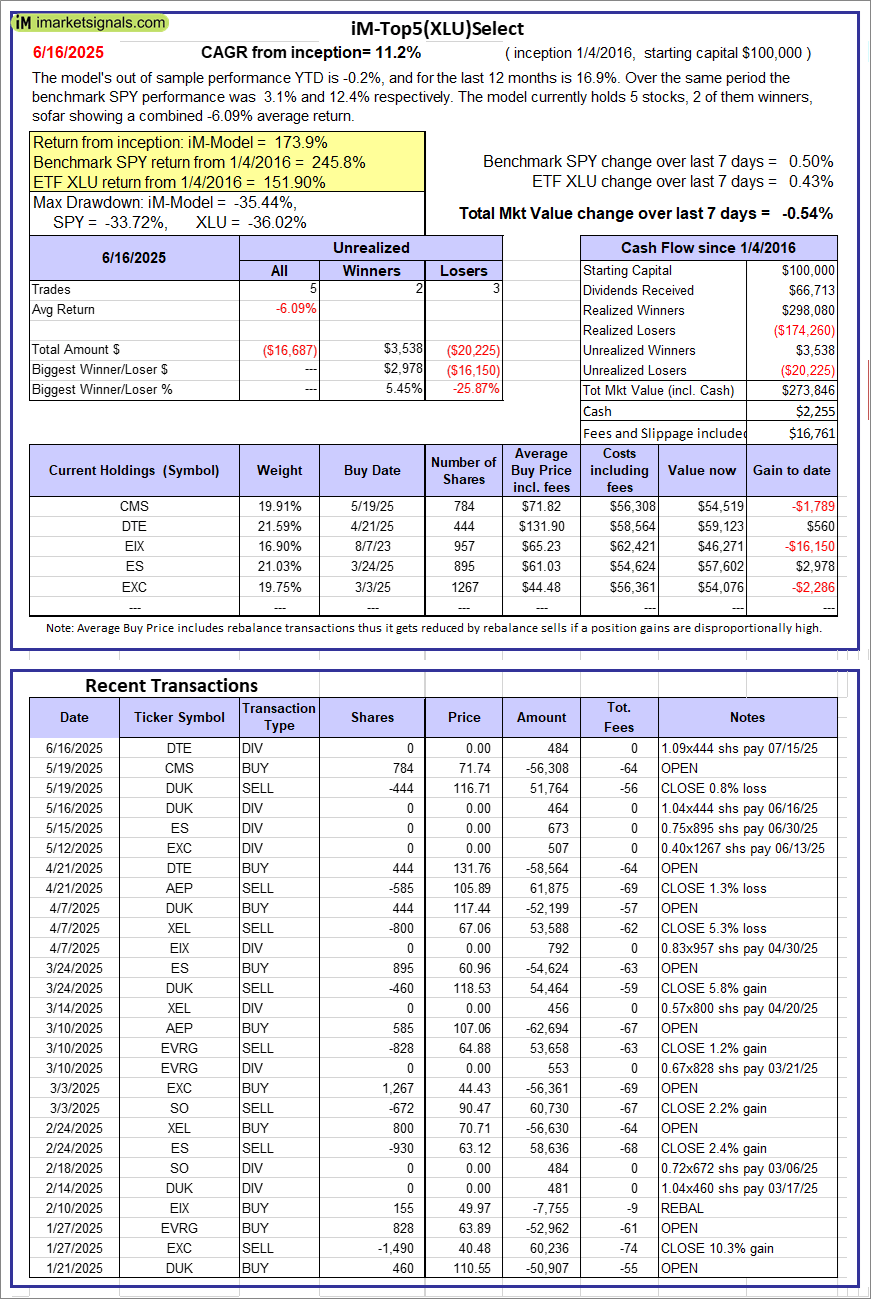 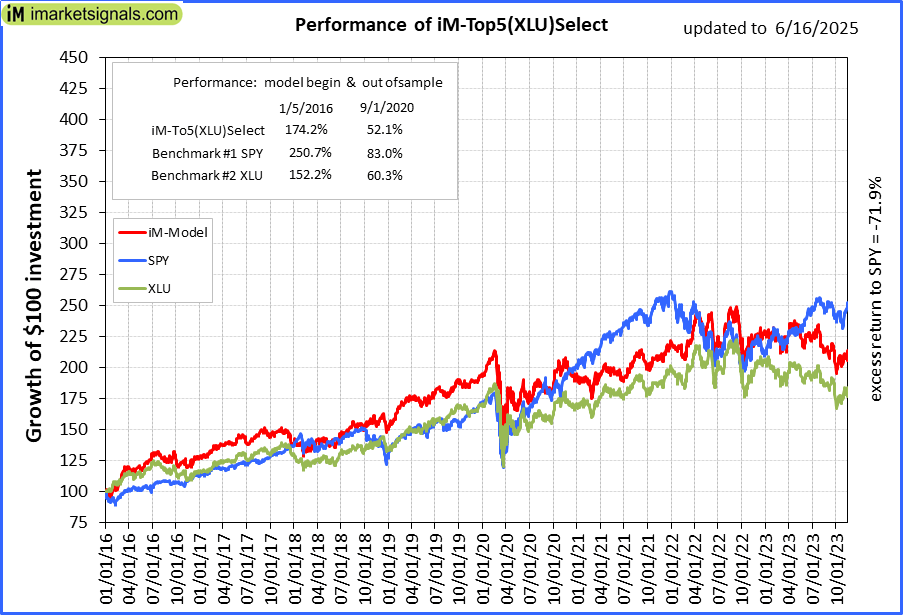 |
iM-Top5(XLU)Select: Since inception, on 1/5/2016, the model gained 173.85% while the benchmark SPY gained 245.79% over the same period. Over the previous week the market value of iM-Top5(XLU)Select gained -0.54% at a time when SPY gained 0.50%. A starting capital of $100,000 at inception on 1/5/2016 would have grown to $273,846 which includes $2,255 cash and excludes $16,761 spent on fees and slippage. |
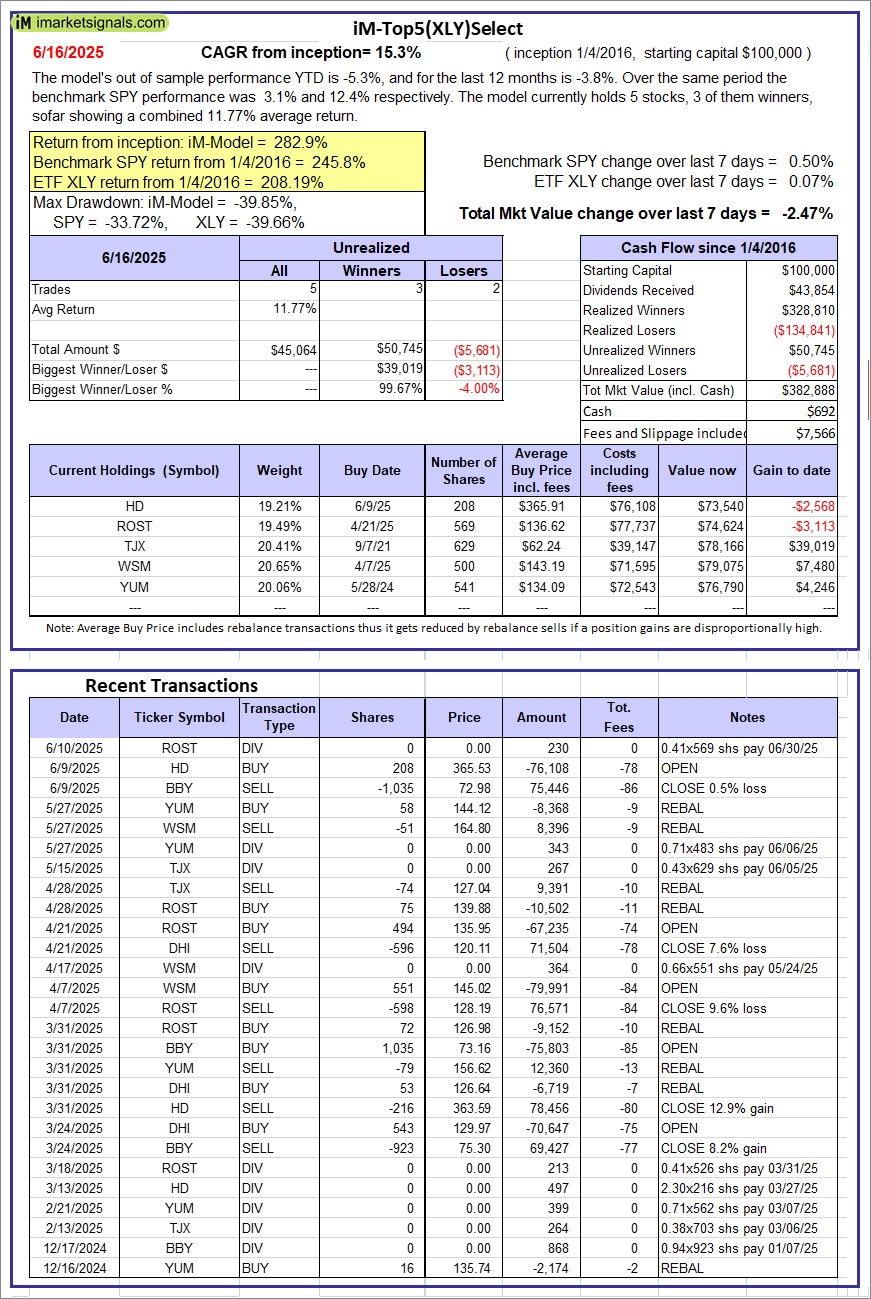 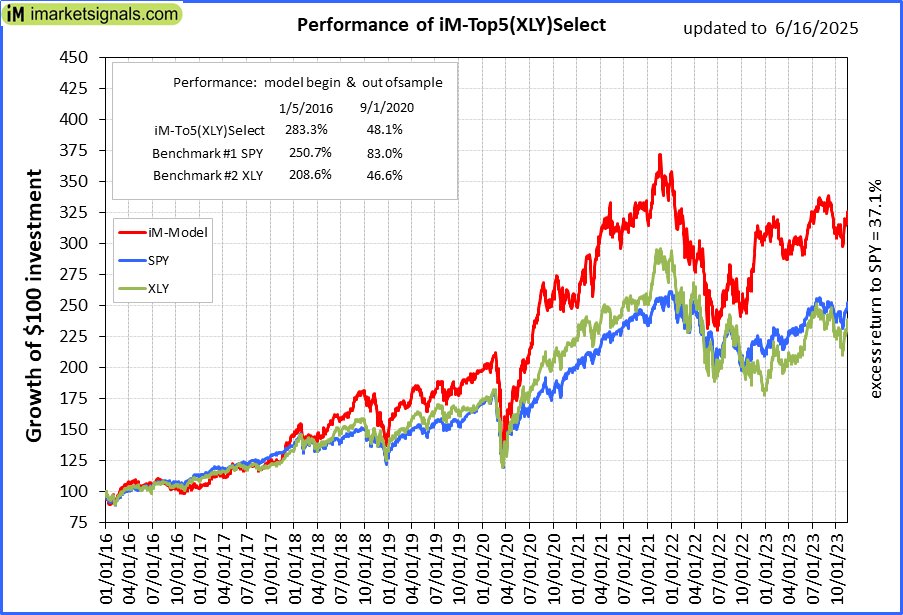 |
iM-Top5(XLY)Select: Since inception, on 1/5/2016, the model gained 282.89% while the benchmark SPY gained 245.79% over the same period. Over the previous week the market value of iM-Top5(XLY)Select gained -2.47% at a time when SPY gained 0.50%. A starting capital of $100,000 at inception on 1/5/2016 would have grown to $382,888 which includes $692 cash and excludes $7,566 spent on fees and slippage. |
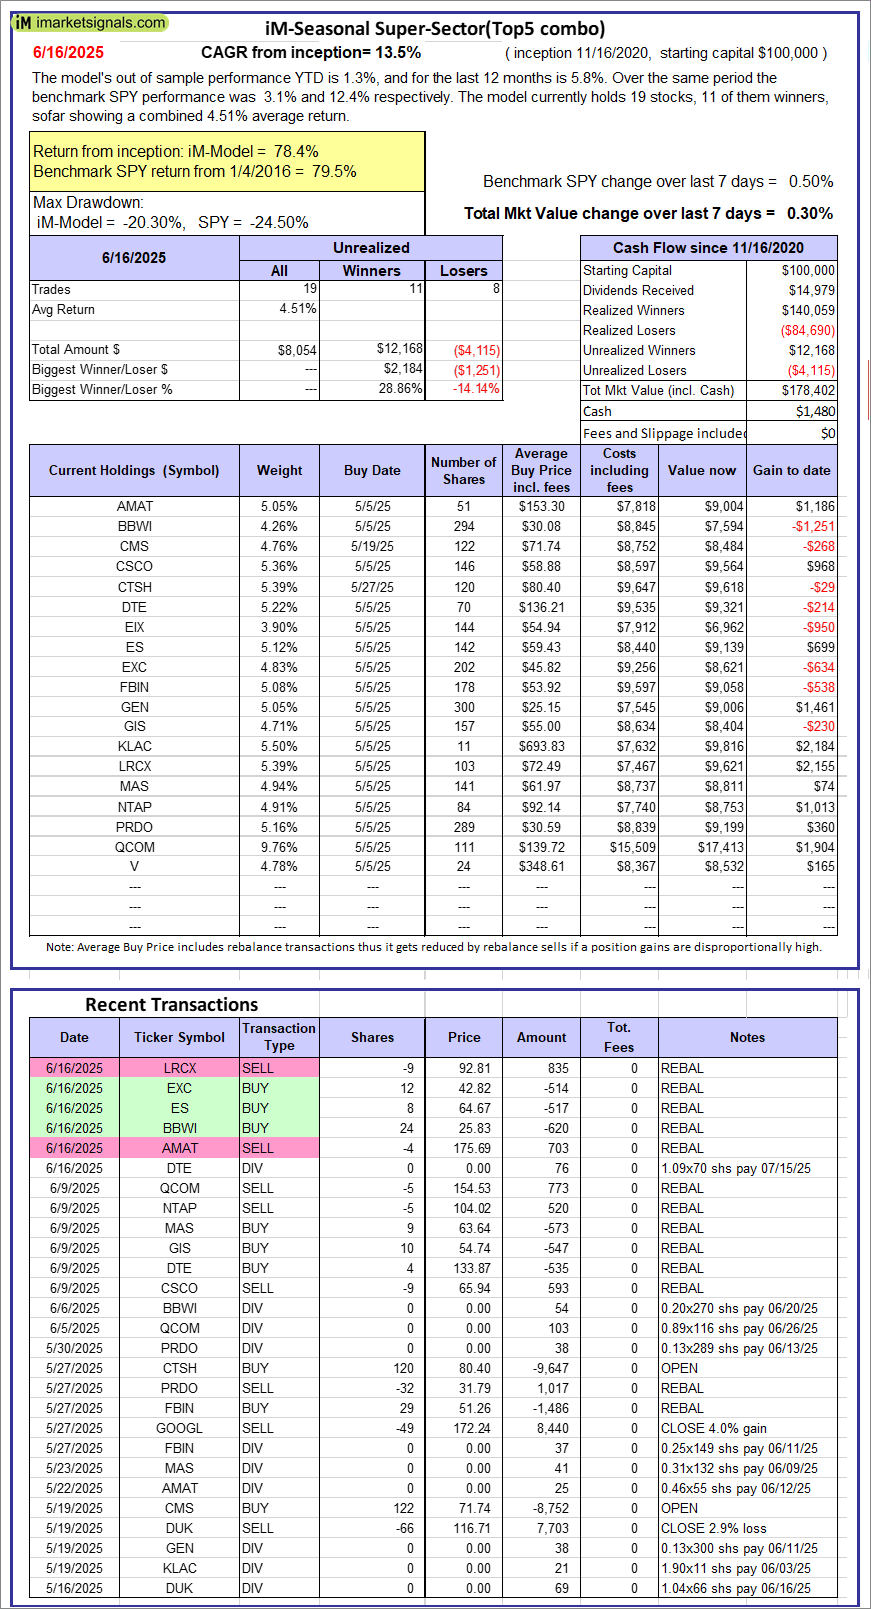 |
iM-Seasonal Super-Sectors (Top5 combo) : Since inception, on 11/17/2020, the model gained 78.40% while the benchmark SPY gained 79.50% over the same period. Over the previous week the market value of iM-Seasonal Super-Sectors (Top5 combo) gained 0.30% at a time when SPY gained 0.50%. A starting capital of $100,000 at inception on 11/17/2020 would have grown to $178,402 which includes $1,480 cash and excludes $00 spent on fees and slippage. |
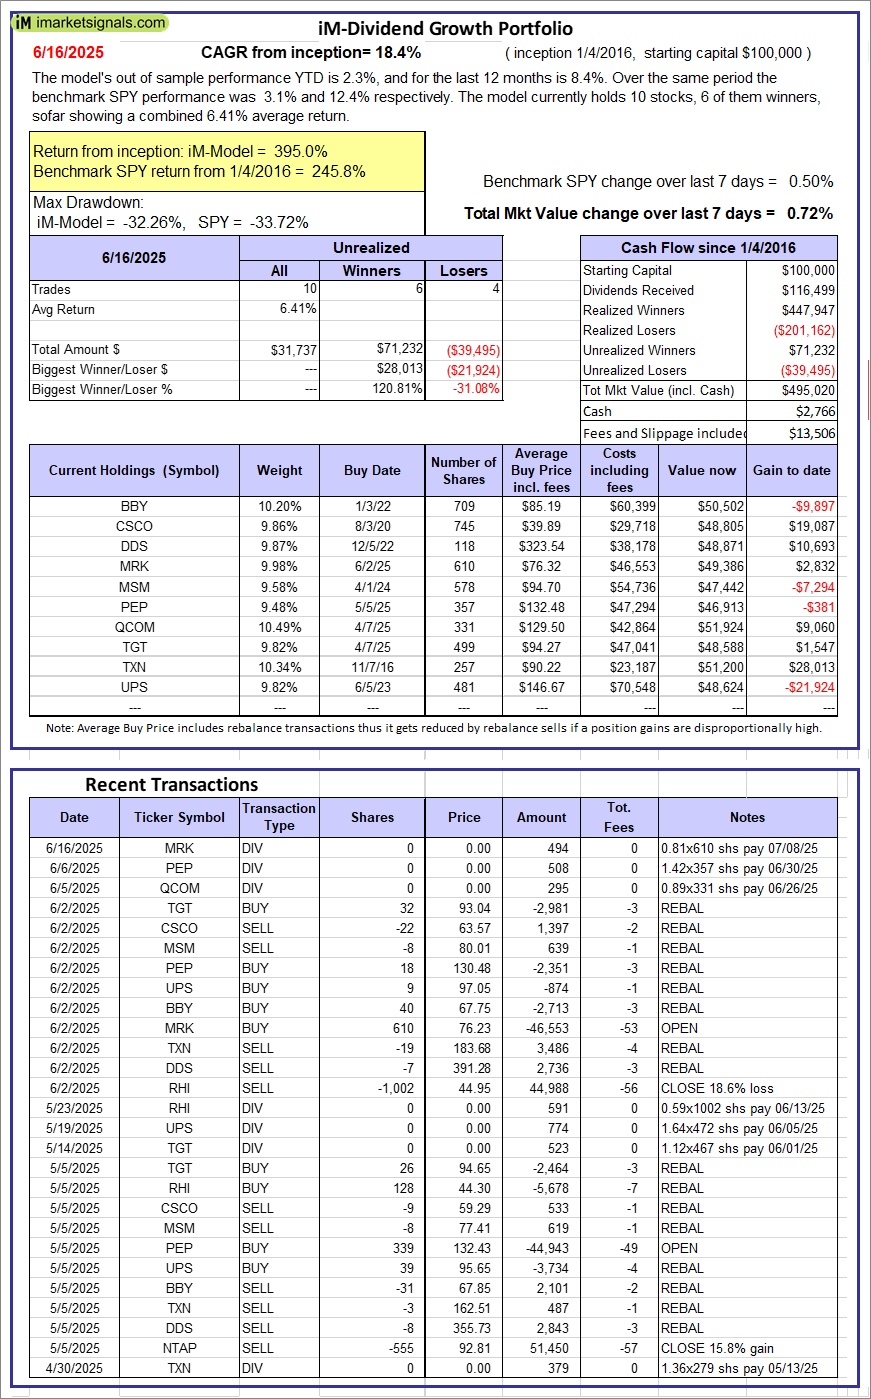 |
iM-Dividend Growth Portfolio: The model’s out of sample performance YTD is 2.3%, and for the last 12 months is 8.4%. Over the same period the benchmark SPY performance was 3.1% and 12.4% respectively. Over the previous week the market value of the iM-Dividend Growth Portfolio gained 0.72% at a time when SPY gained 0.50%. A starting capital of $100,000 at inception on 6/30/2016 would have grown to $495,020 which includes $2,766 cash and excludes $13,506 spent on fees and slippage. |
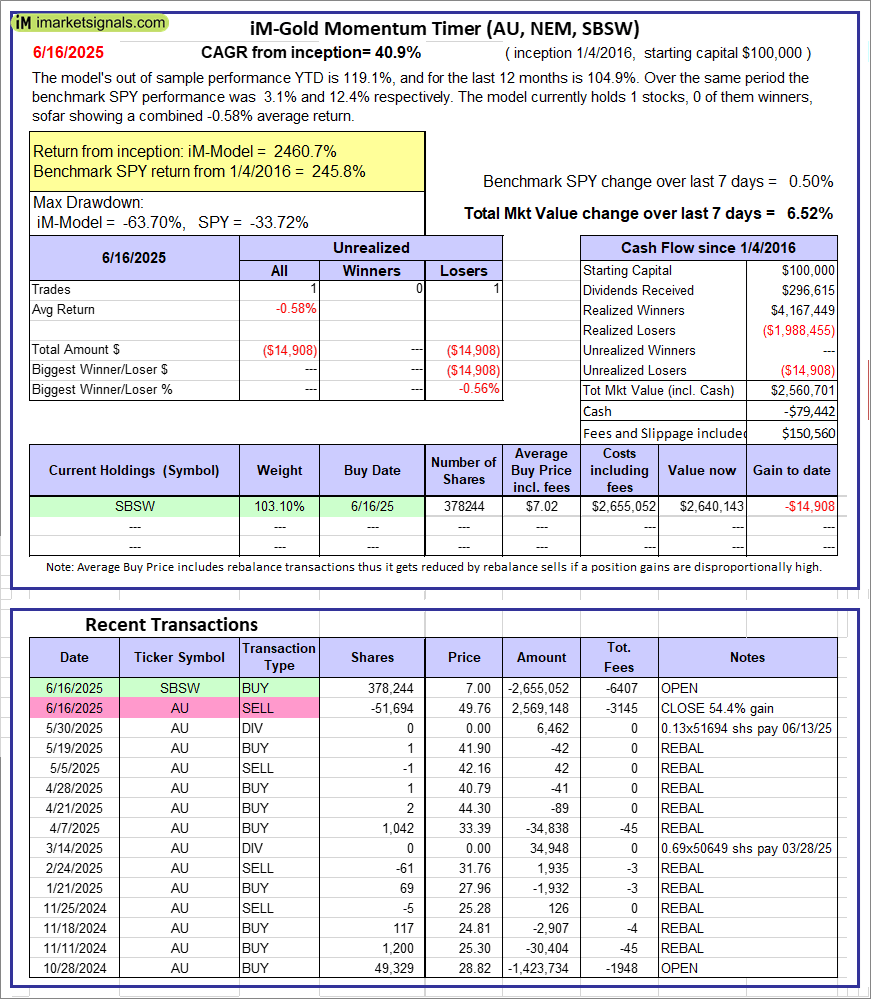 |
iM-Gold Momentum Timer (AU, NEM, SBSW): The model’s out of sample performance YTD is 119.1%, and for the last 12 months is 104.9%. Over the same period the benchmark SPY performance was 3.1% and 12.4% respectively. Over the previous week the market value of iM-Gold Momentum Timer (AU, NEM, SBSW) gained 6.52% at a time when SPY gained 0.50%. A starting capital of $100,000 at inception on 6/30/2016 would have grown to -$79,442 which includes $150,560 cash and excludes Gain to date spent on fees and slippage. |
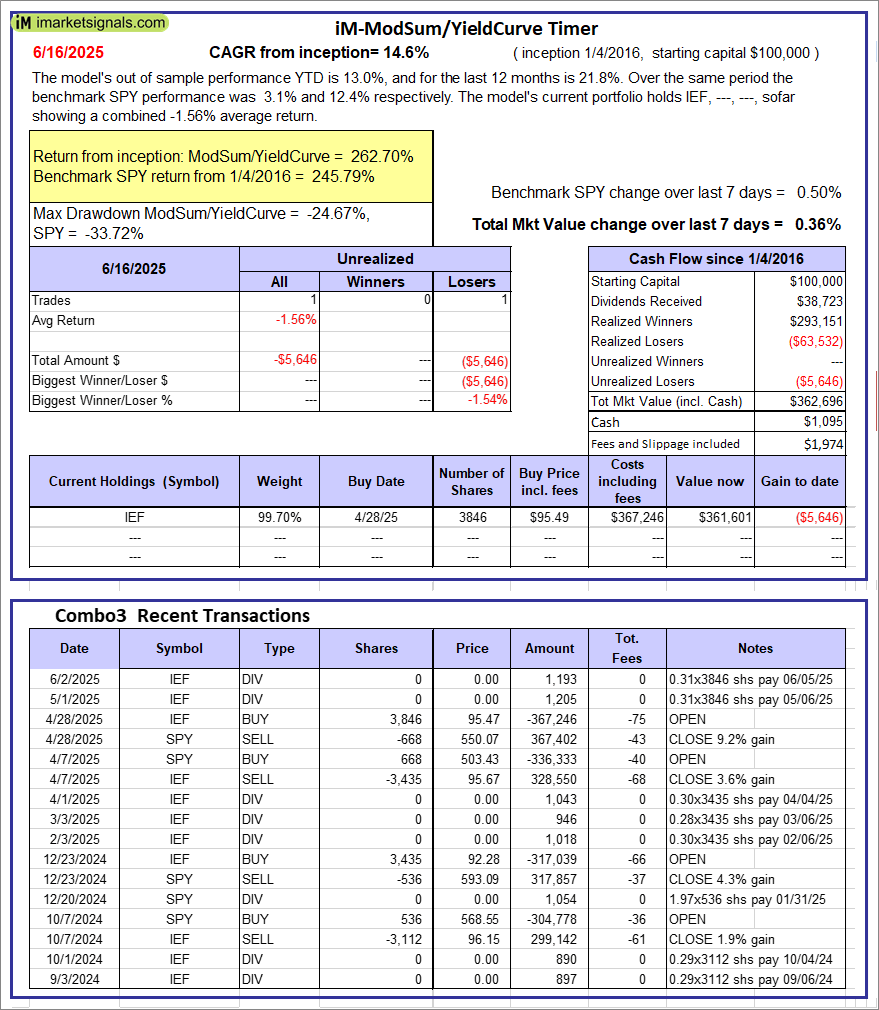 |
iM-ModSum/YieldCurve Timer: The model’s out of sample performance YTD is 13.0%, and for the last 12 months is 21.8%. Over the same period the benchmark SPY performance was 3.1% and 12.4% respectively. Over the previous week the market value of iM-PortSum/YieldCurve Timer gained 0.36% at a time when SPY gained 0.50%. A starting capital of $100,000 at inception on 1/1/2016 would have grown to $362,696 which includes $1,095 cash and excludes $1,974 spent on fees and slippage. |
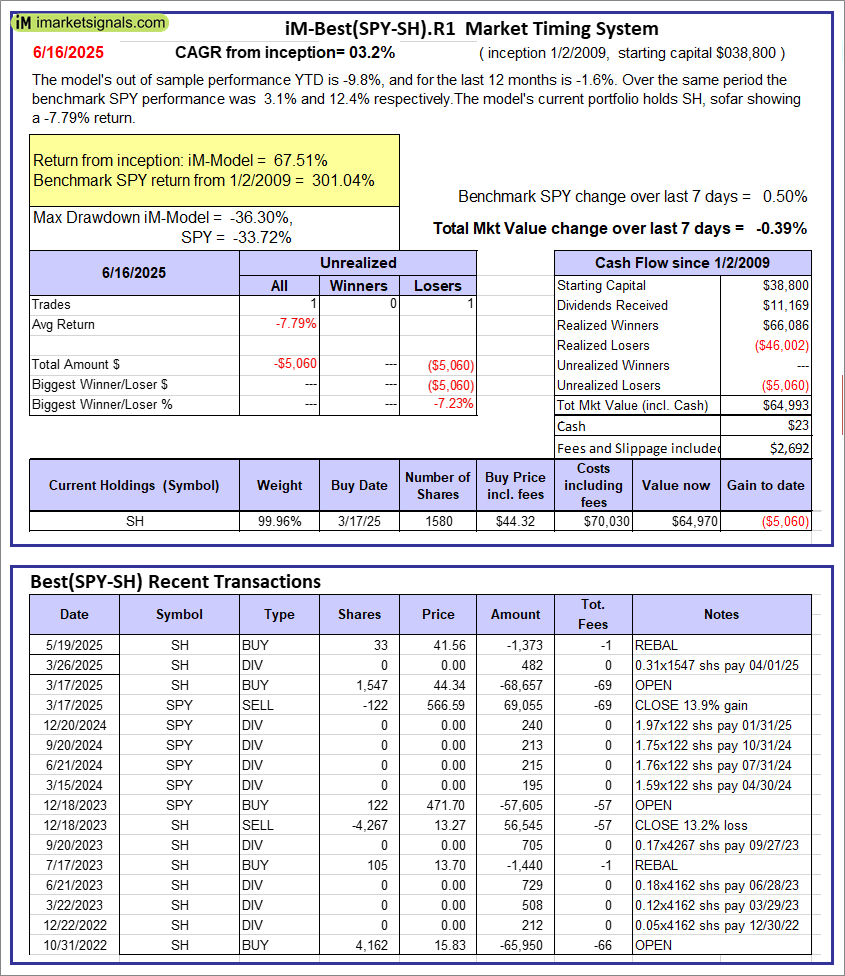 |
iM-Best(SPY-SH).R1: The model’s out of sample performance YTD is -9.8%, and for the last 12 months is -1.6%. Over the same period the benchmark SPY performance was 3.1% and 12.4% respectively. Over the previous week the market value of Best(SPY-SH) gained -0.39% at a time when SPY gained 0.50%. A starting capital of $100,000 at inception on 1/2/2009 would have grown to $64,993 which includes $23 cash and excludes $2,692 spent on fees and slippage. |
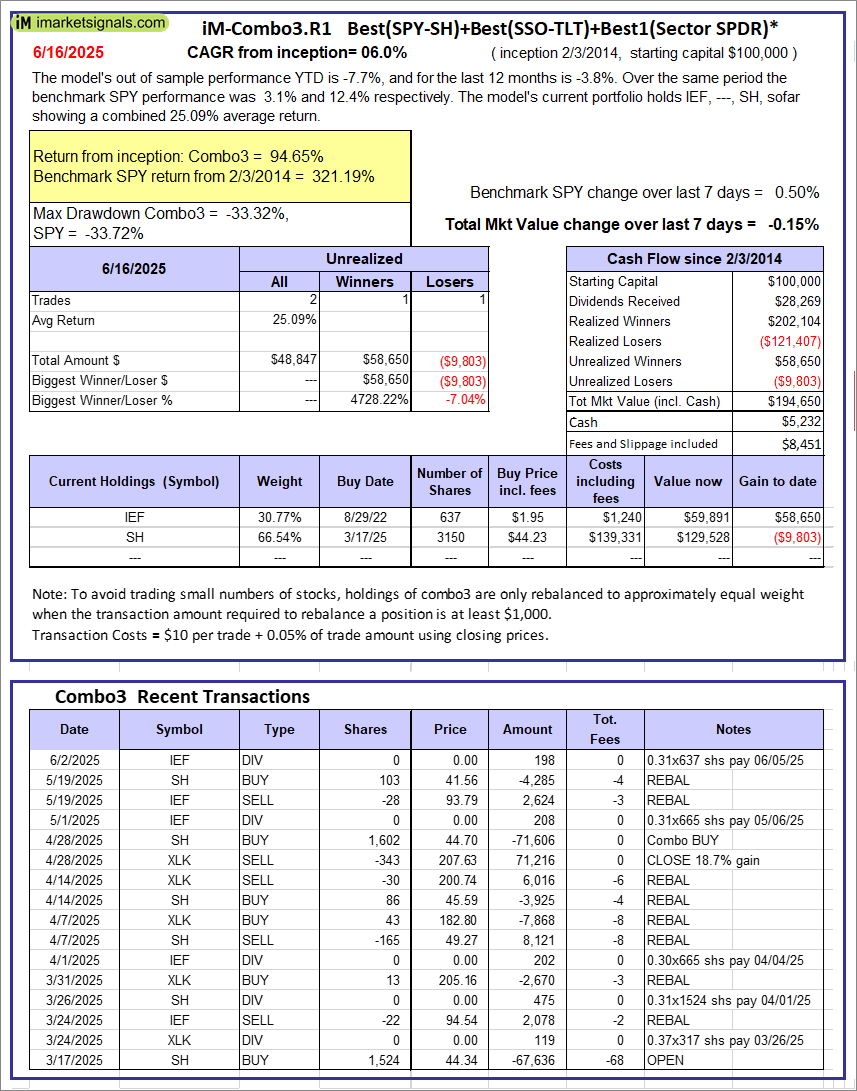 |
iM-Combo3.R1: The model’s out of sample performance YTD is -7.7%, and for the last 12 months is -3.8%. Over the same period the benchmark SPY performance was 3.1% and 12.4% respectively. Over the previous week the market value of iM-Combo3.R1 gained -0.15% at a time when SPY gained 0.50%. A starting capital of $100,000 at inception on 2/3/2014 would have grown to $194,650 which includes $5,232 cash and excludes $8,451 spent on fees and slippage. |
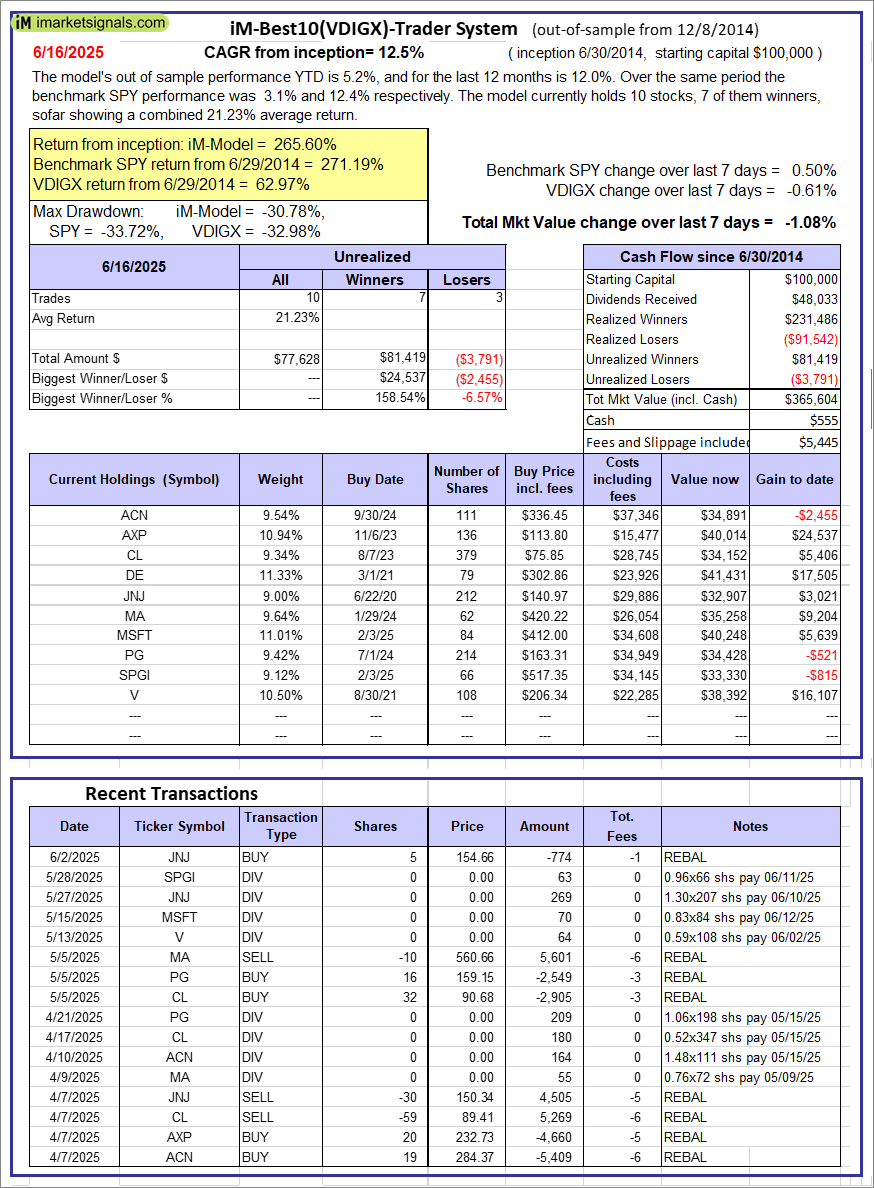 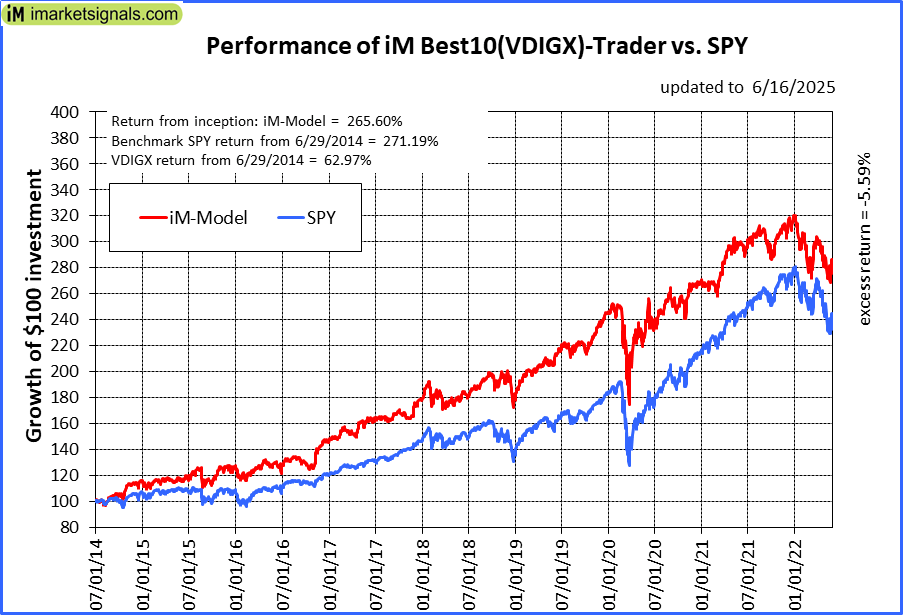 |
iM-Best10(VDIGX)-Trader: The model’s out of sample performance YTD is 5.2%, and for the last 12 months is 12.0%. Over the same period the benchmark SPY performance was 3.1% and 12.4% respectively. Since inception, on 7/1/2014, the model gained 265.60% while the benchmark SPY gained 271.19% and VDIGX gained 62.97% over the same period. Over the previous week the market value of iM-Best10(VDIGX) gained -1.08% at a time when SPY gained 0.50%. A starting capital of $100,000 at inception on 7/1/2014 would have grown to $365,604 which includes $555 cash and excludes $5,445 spent on fees and slippage. |
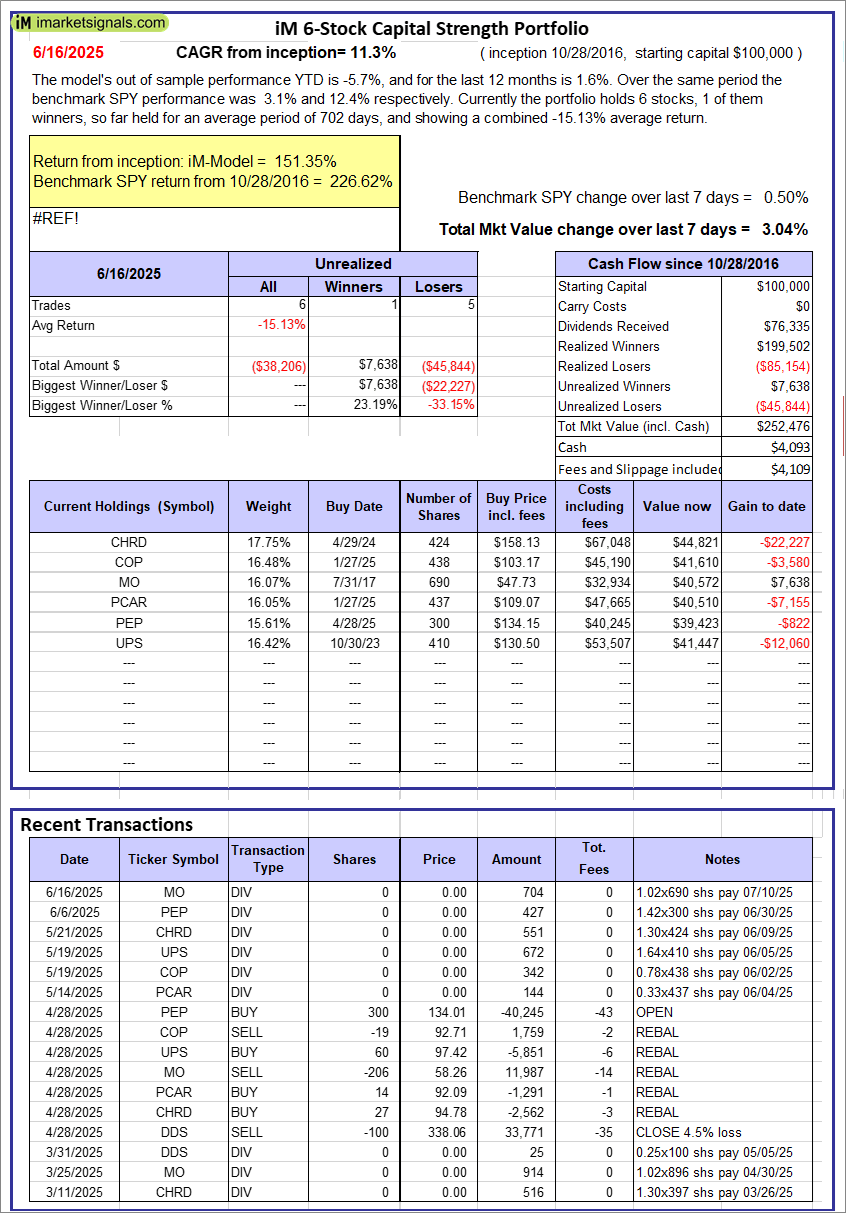 |
iM 6-Stock Capital Strength Portfolio: The model’s out of sample performance YTD is -5.7%, and for the last 12 months is 1.6%. Over the same period the benchmark SPY performance was 3.1% and 12.4% respectively. Over the previous week the market value of the iM 6-Stock Capital Strength Portfolio gained 3.04% at a time when SPY gained 0.50%. A starting capital of $100,000 at inception on 10/28/2016 would have grown to $252,476 which includes $4,093 cash and excludes $4,109 spent on fees and slippage. |
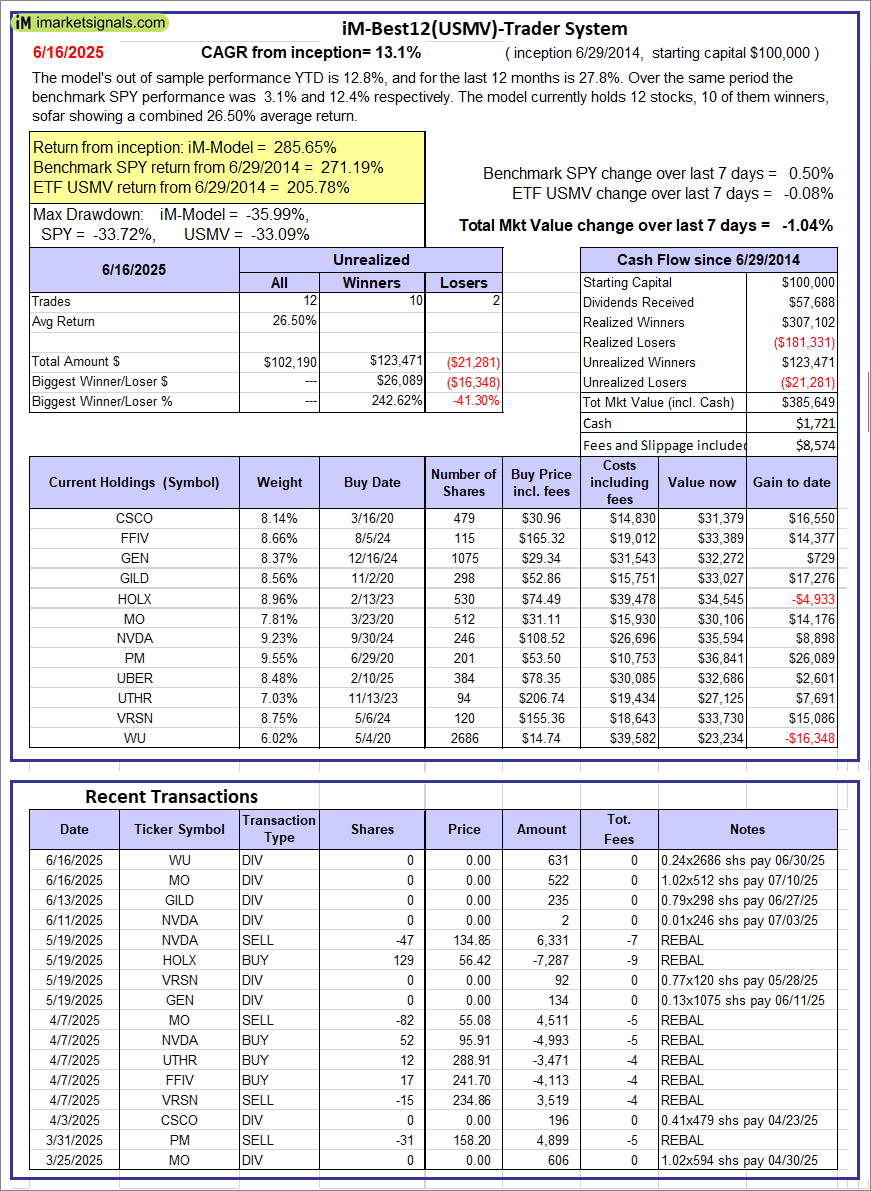 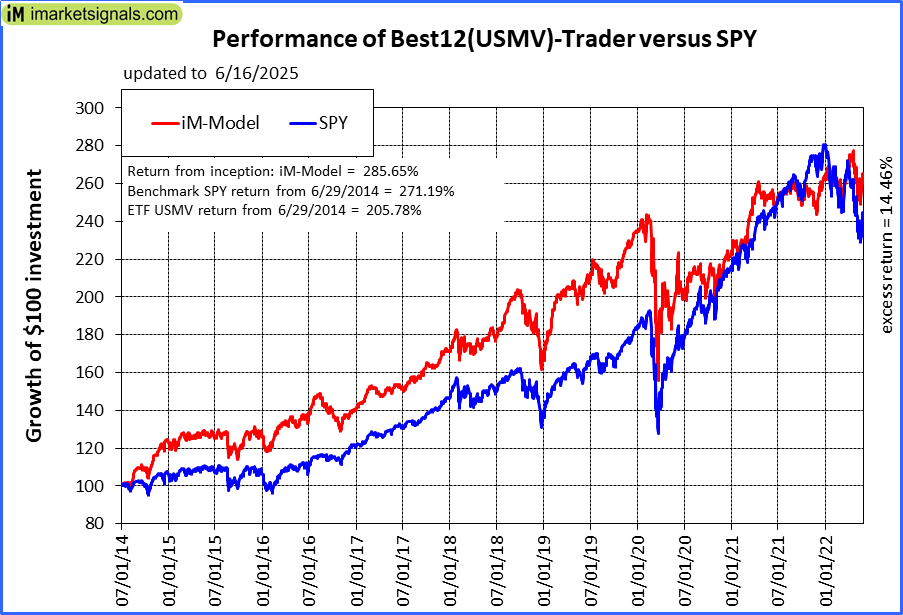 |
iM-Best12(USMV)-Trader: The model’s out of sample performance YTD is 12.8%, and for the last 12 months is 27.8%. Over the same period the benchmark SPY performance was 3.1% and 12.4% respectively. Since inception, on 6/30/2014, the model gained 285.65% while the benchmark SPY gained 271.19% and the ETF USMV gained 205.78% over the same period. Over the previous week the market value of iM-Best12(USMV)-Trader gained -1.04% at a time when SPY gained 0.50%. A starting capital of $100,000 at inception on 6/30/2014 would have grown to $385,649 which includes $1,721 cash and excludes $8,574 spent on fees and slippage. |
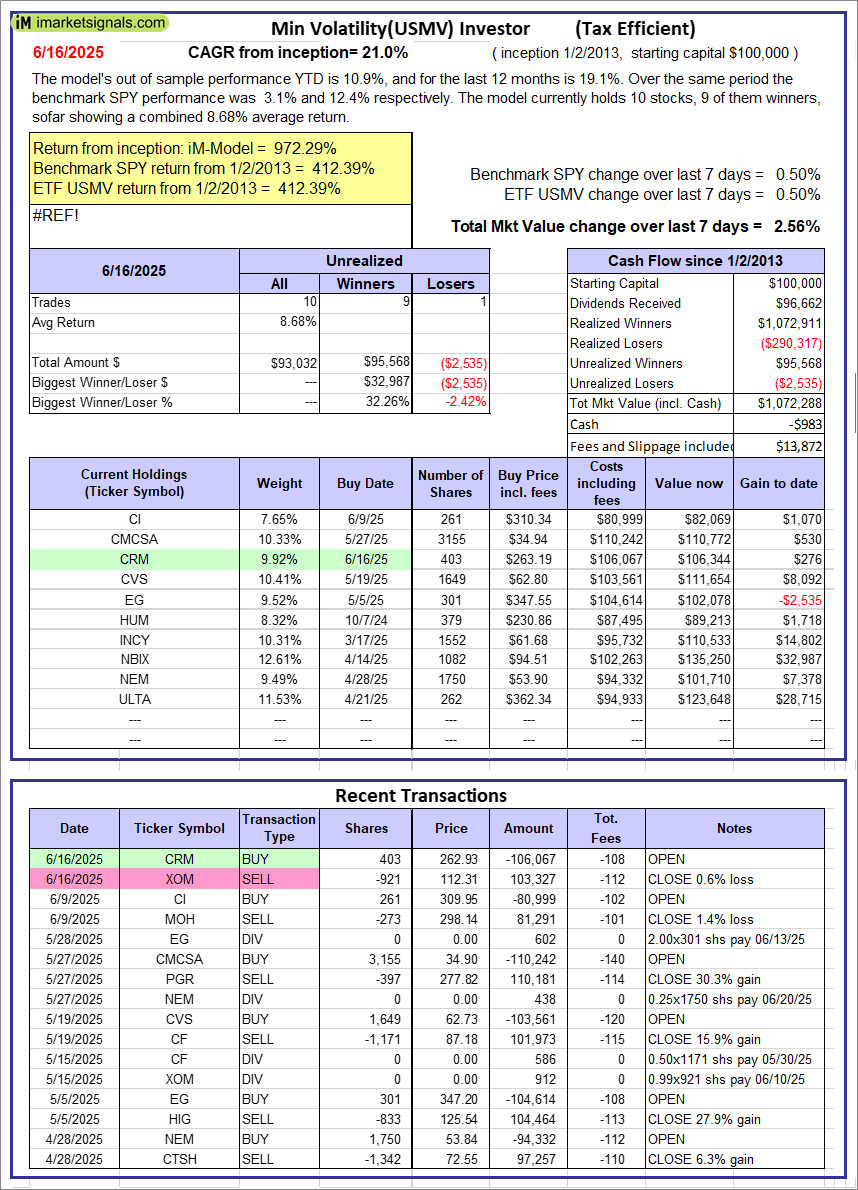 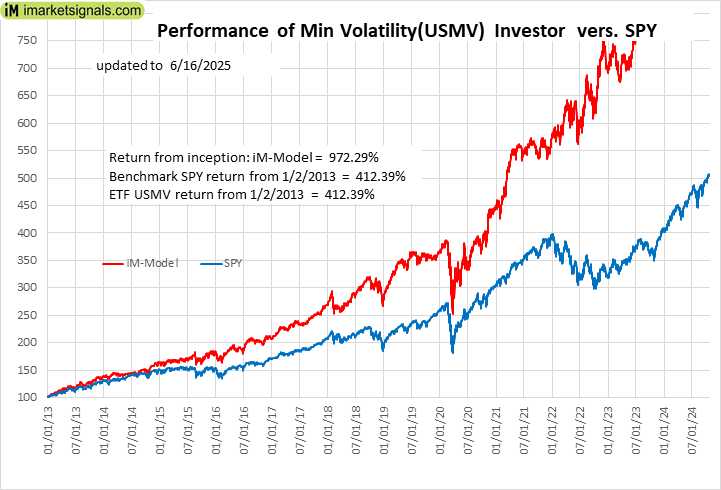 |
iM-Min Volatility(USMV) Investor (Tax Efficient): The model’s out of sample performance YTD is 10.9%, and for the last 12 months is 19.1%. Over the same period the benchmark SPY performance was 3.1% and 12.4% respectively. Since inception, on 1/3/2013, the model gained 972.29% while the benchmark SPY gained 412.39% and the ETF USMV gained 412.39% over the same period. Over the previous week the market value of iM-Best12(USMV)Q1 gained 2.56% at a time when SPY gained 0.50%. A starting capital of $100,000 at inception on 1/3/2013 would have grown to $1,072,288 which includes -$983 cash and excludes $13,872 spent on fees and slippage. |
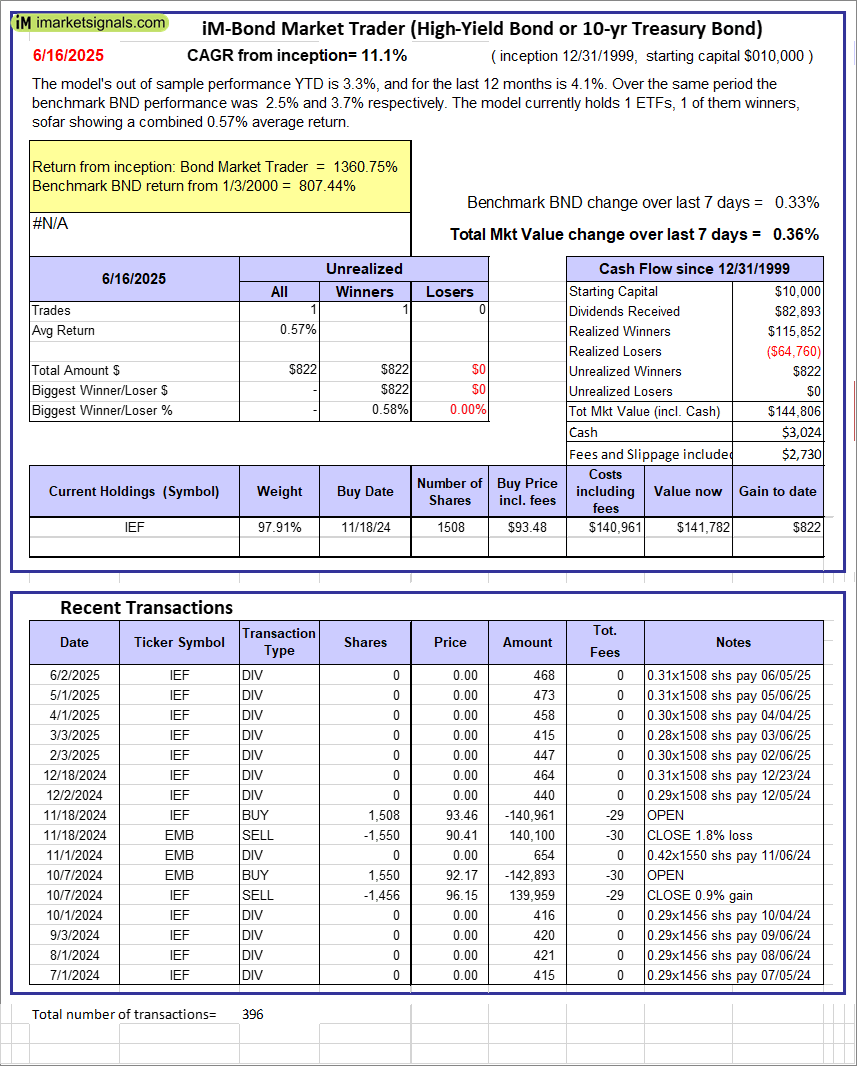 |
iM-Bond Market Trader (High-Yield Bond or 10-yr Treasury Bond): The model’s out of sample performance YTD is 3.3%, and for the last 12 months is 4.1%. Over the same period the benchmark BND performance was 2.5% and 3.7% respectively. Over the previous week the market value of the iM-Bond Market Trader (High-Yield Bond or 10-yr Treasury Bond) gained 0.36% at a time when BND gained 0.33%. A starting capital of $10,000 at inception on 1/3/2000 would have grown to $144,806 which includes $3,024 cash and excludes $2,730 spent on fees and slippage. |
|
|
iM-ModSum/YieldCurve Timer: The model’s out of sample performance YTD is 13.0%, and for the last 12 months is 21.8%. Over the same period the benchmark SPY performance was 3.1% and 12.4% respectively. Over the previous week the market value of iM-PortSum/YieldCurve Timer gained 0.36% at a time when SPY gained 0.50%. A starting capital of $100,000 at inception on 1/1/2016 would have grown to $362,696 which includes $1,095 cash and excludes $1,974 spent on fees and slippage. |
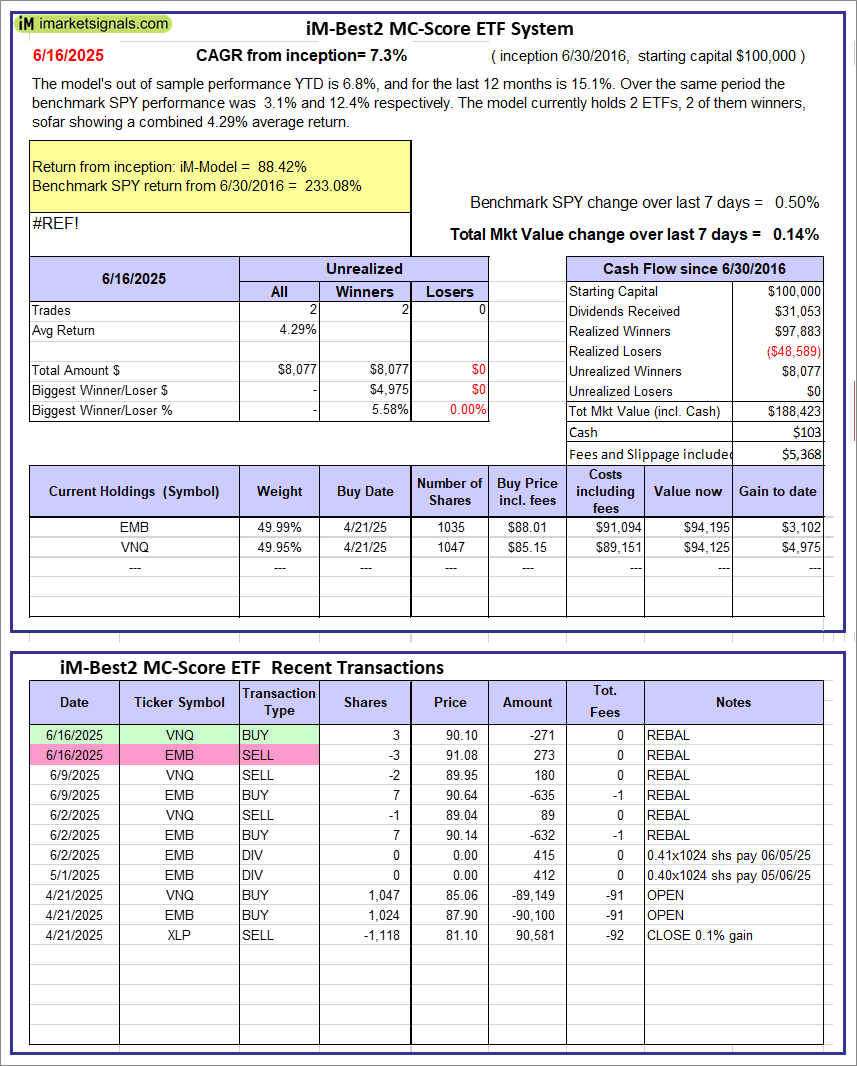 |
iM-Best2 MC-Score ETF System: The model’s out of sample performance YTD is 6.8%, and for the last 12 months is 15.1%. Over the same period the benchmark SPY performance was 3.1% and 12.4% respectively. Over the previous week the market value of the iM-Best2 MC-Score ETF System gained 0.14% at a time when SPY gained 0.50%. A starting capital of $100,000 at inception on 6/30/2016 would have grown to $188,423 which includes $103 cash and excludes $5,368 spent on fees and slippage. |
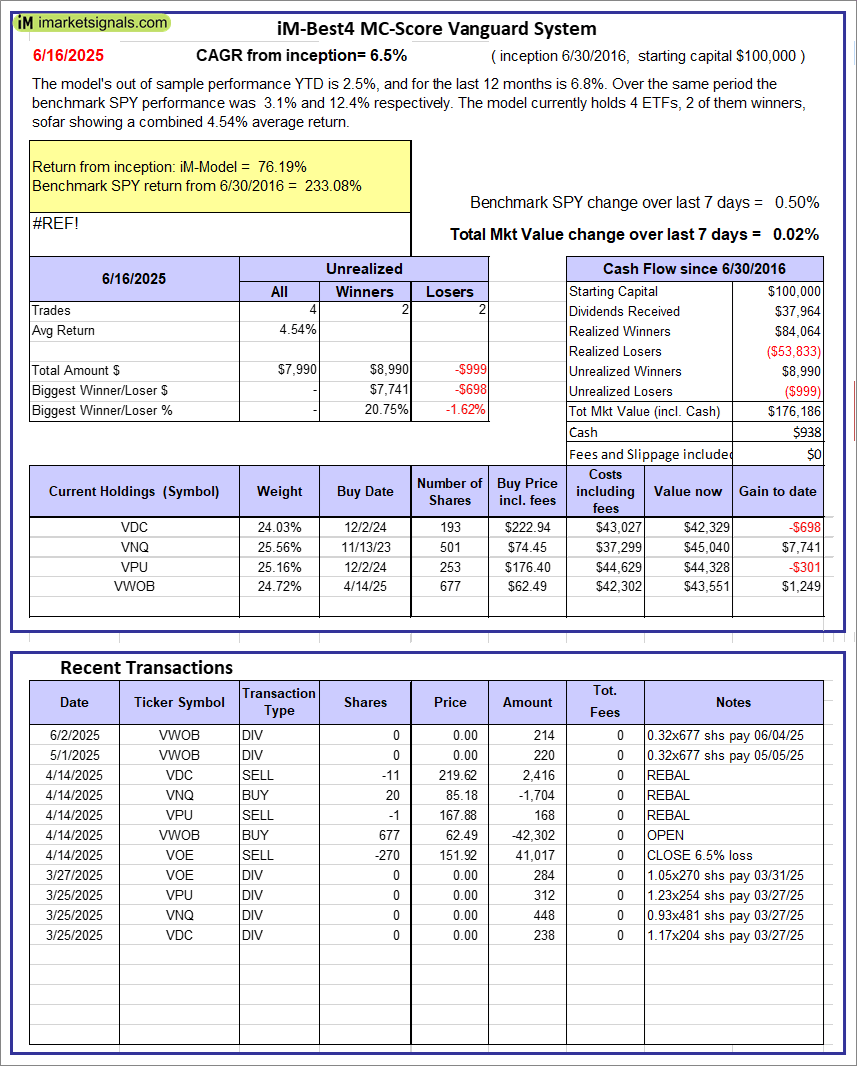 |
iM-Best4 MC-Score Vanguard System: The model’s out of sample performance YTD is 2.5%, and for the last 12 months is 6.8%. Over the same period the benchmark SPY performance was 3.1% and 12.4% respectively. Over the previous week the market value of the iM-Best4 MC-Score Vanguard System gained 0.02% at a time when SPY gained 0.50%. A starting capital of $100,000 at inception on 6/30/2016 would have grown to $176,186 which includes $938 cash and excludes $00 spent on fees and slippage. |
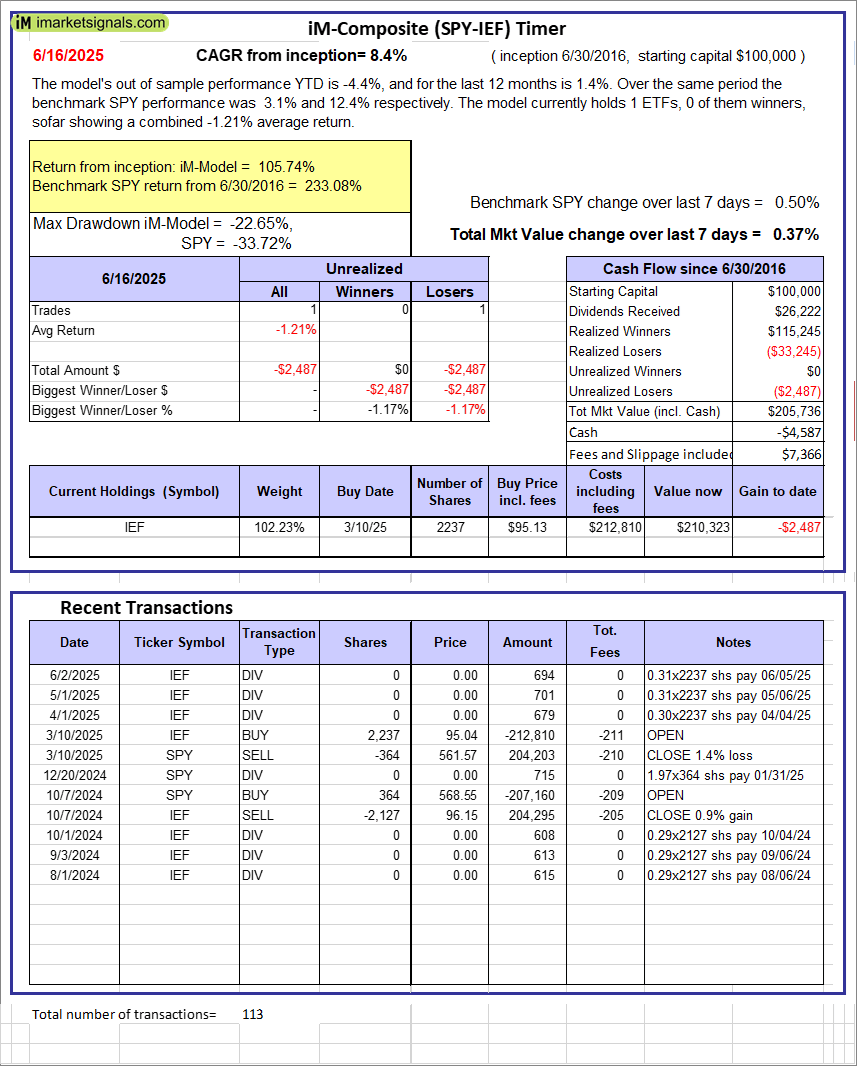 |
iM-Composite (SPY-IEF) Timer: The model’s out of sample performance YTD is -4.4%, and for the last 12 months is 1.4%. Over the same period the benchmark SPY performance was 3.1% and 12.4% respectively. Over the previous week the market value of the iM-Composite (SPY-IEF) Timer gained 0.37% at a time when SPY gained 0.50%. A starting capital of $100,000 at inception on 6/30/2016 would have grown to $205,736 which includes -$4,587 cash and excludes $7,366 spent on fees and slippage. |
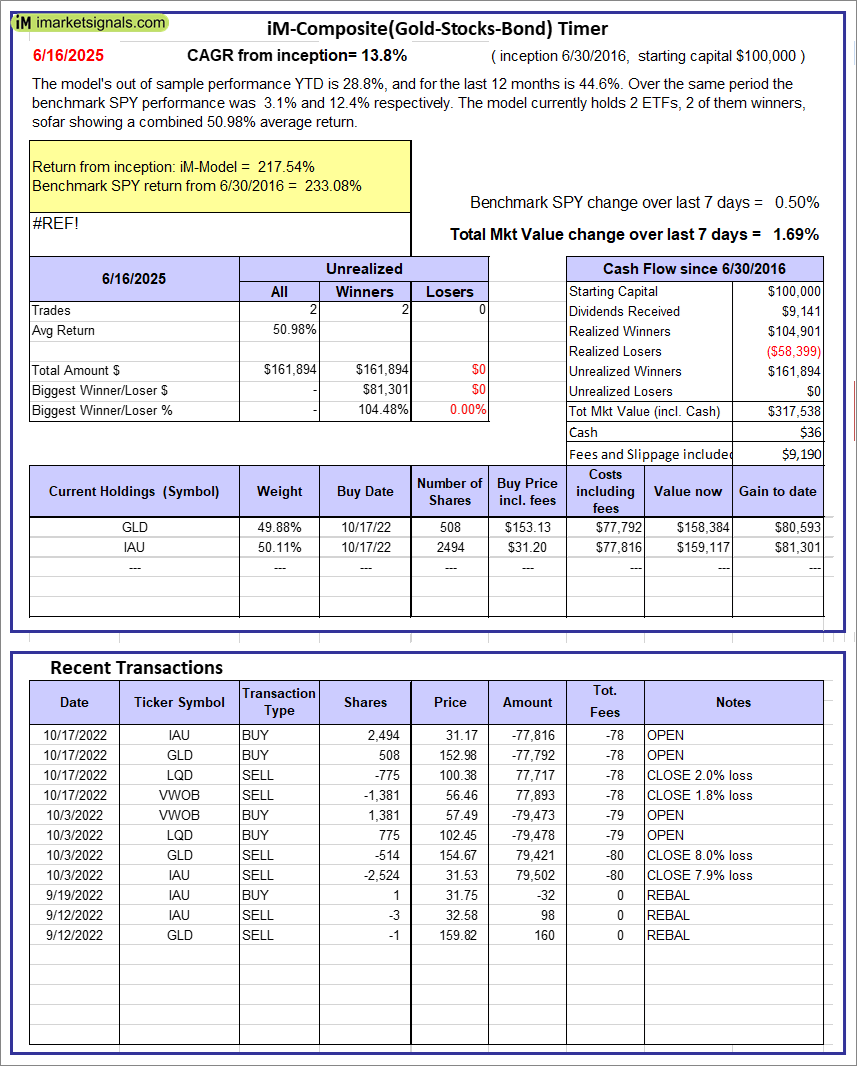 |
iM-Composite(Gold-Stocks-Bond) Timer: The model’s out of sample performance YTD is 28.8%, and for the last 12 months is 44.6%. Over the same period the benchmark SPY performance was 3.1% and 12.4% respectively. Over the previous week the market value of the iM-Composite(Gold-Stocks-Bond) Timer gained 1.69% at a time when SPY gained 0.50%. A starting capital of $100,000 at inception on 6/30/2016 would have grown to $317,538 which includes $36 cash and excludes $9,190 spent on fees and slippage. |
iM-Best Reports – 6/17/2025
Posted in pmp SPY-SH
Leave a Reply
You must be logged in to post a comment.