
  |
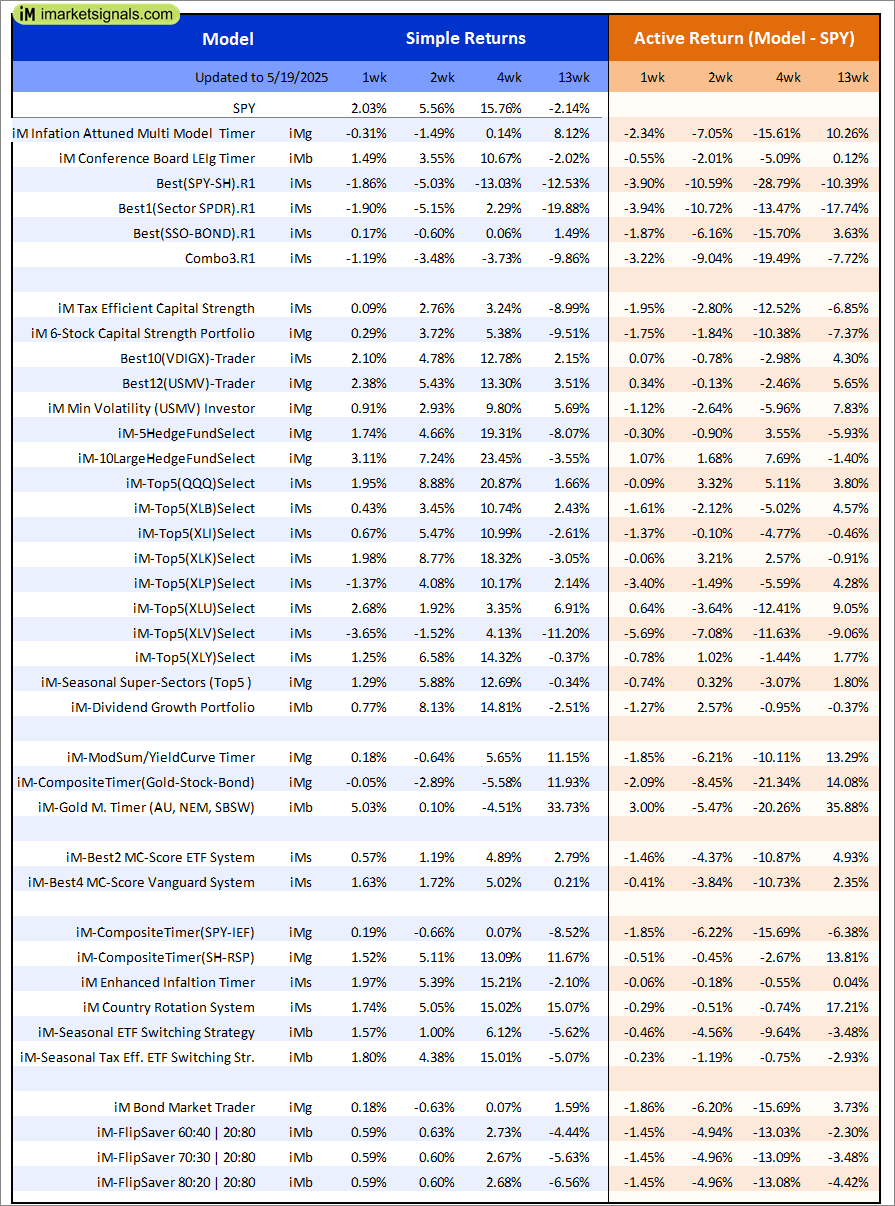
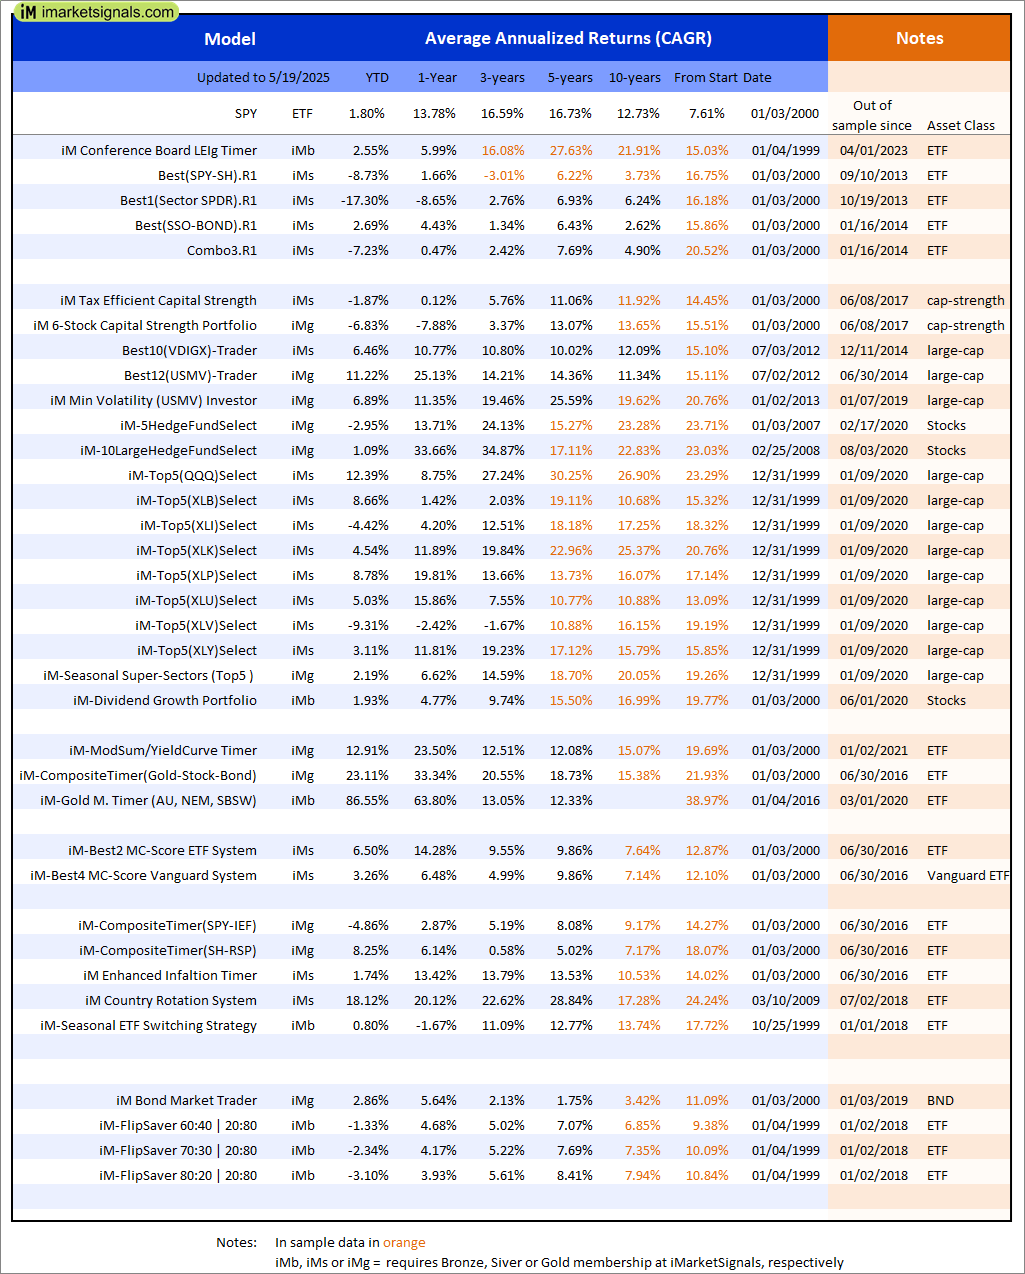
Out of sample performance summary of our models for the past 1, 2, 4 and 13 week periods. The active active return indicates how the models over- or underperformed the benchmark ETF SPY. Also the YTD, and the 1-, 3-, 5- and 10-year annualized returns are shown in the second table |
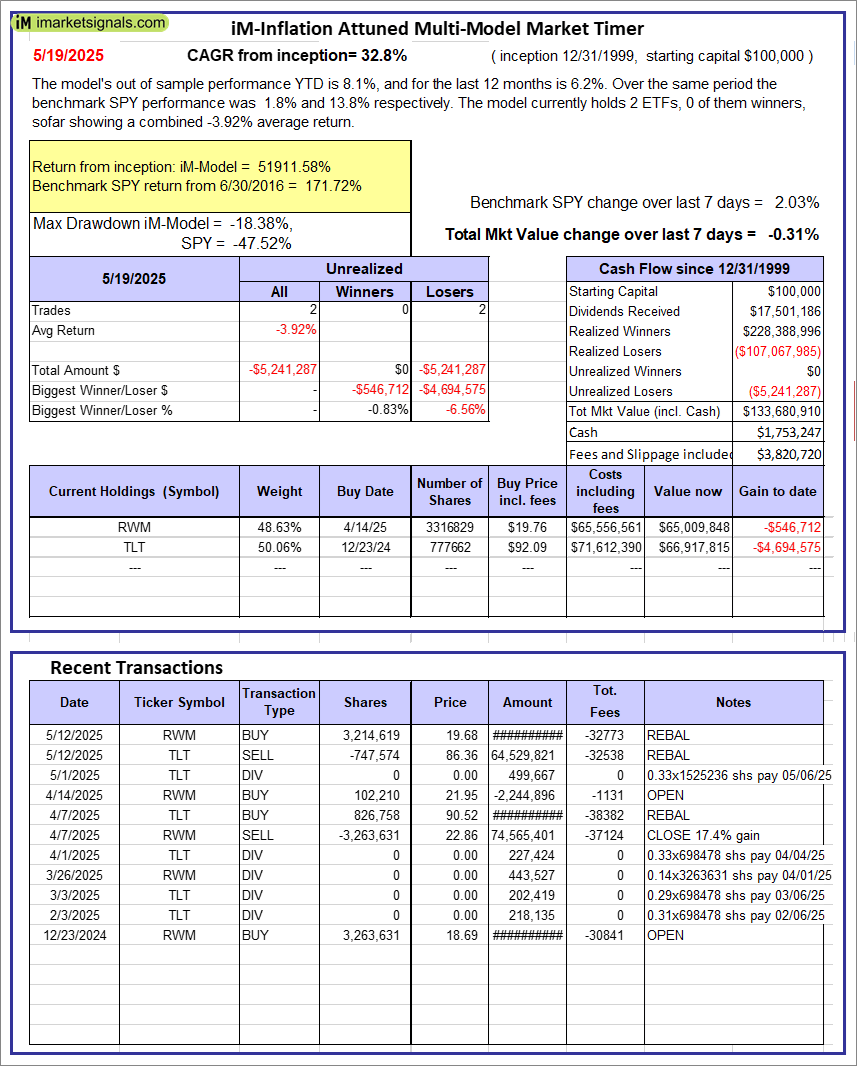 |
iM-Inflation Attuned Multi-Model Market Timer: The model’s out of sample performance YTD is 8.1%, and for the last 12 months is 6.2%. Over the same period the benchmark SPY performance was 1.8% and 13.8% respectively. Over the previous week the market value of the iM-Inflation Attuned Multi-Model Market Timer gained -0.31% at a time when SPY gained 2.03%. A starting capital of $100,000 at inception on 3/24/2017 would have grown to $133,680,910 which includes $1,753,247 cash and excludes $3,820,720 spent on fees and slippage. |
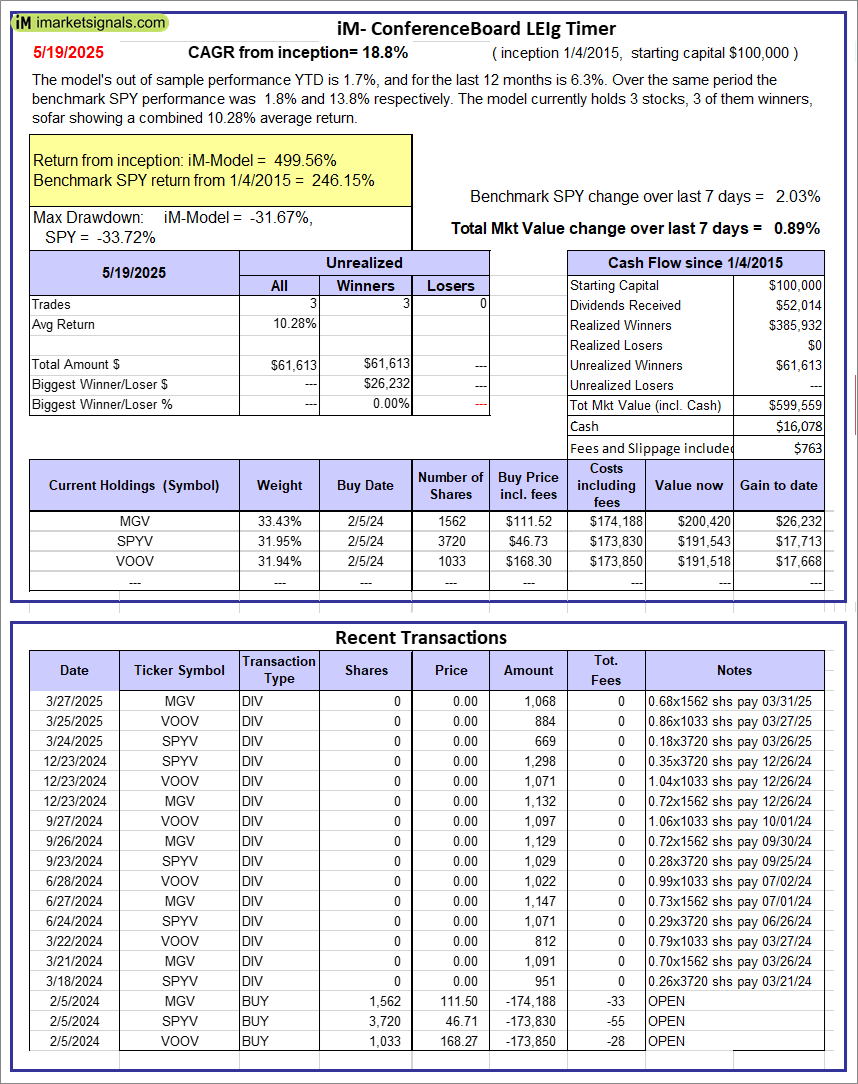 |
iM-Conference Board LEIg Timer: The model’s performance YTD is 14.3%, and for the last 12 months is 7.3%. Over the same period the benchmark SPY performance was 20.1% and 9.4% respectively. Over the previous week the market value of the iM-Conference Board LEIg Timer gained 0.89% at a time when SPY gained 2.03%. A starting capital of $100,000 at inception on 4/5/2017 would have grown to $599,559 which includes $16,078 cash and excludes $763 spent on fees and slippage. |
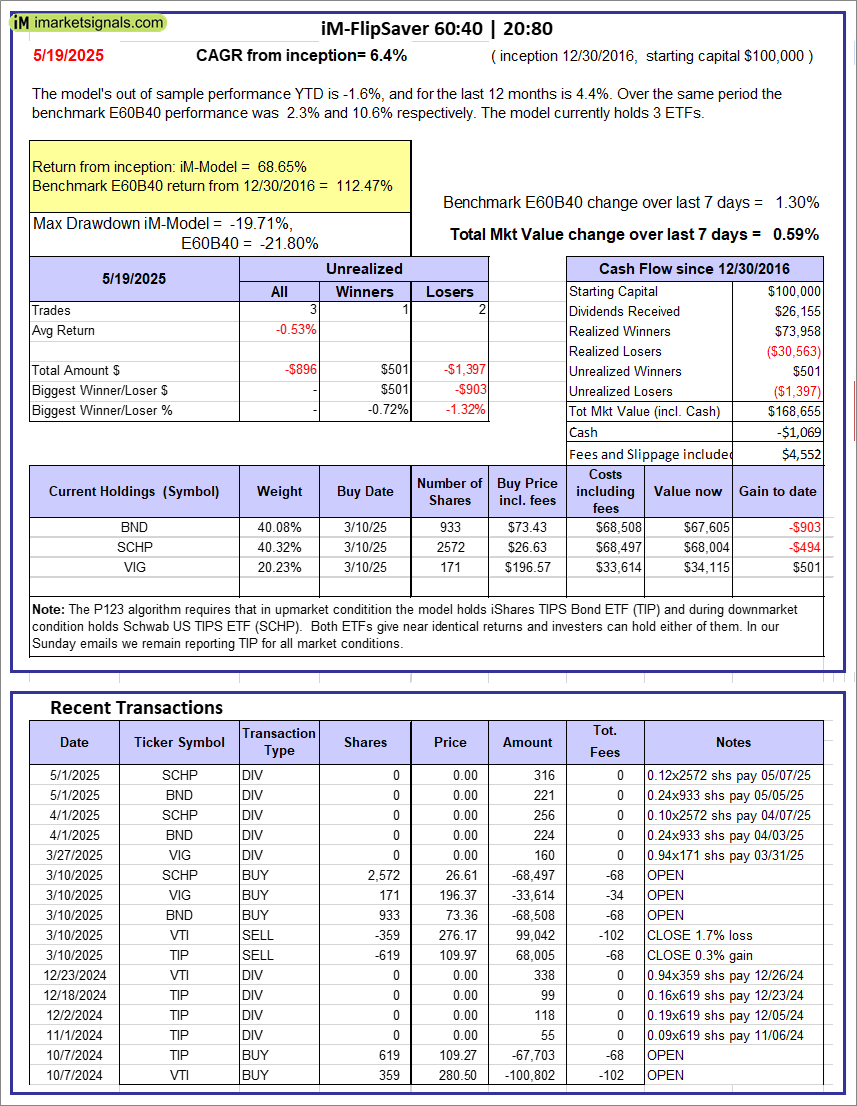 |
iM-FlipSaver 60:40 | 20:80 – 2017: The model’s out of sample performance YTD is -1.6%, and for the last 12 months is 4.4%. Over the same period the benchmark E60B40 performance was 2.3% and 10.6% respectively. Over the previous week the market value of iM-FlipSaver 80:20 | 20:80 gained 0.59% at a time when SPY gained 1.30%. A starting capital of $100,000 at inception on 7/16/2015 would have grown to $168,655 which includes -$1,069 cash and excludes $4,552 spent on fees and slippage. |
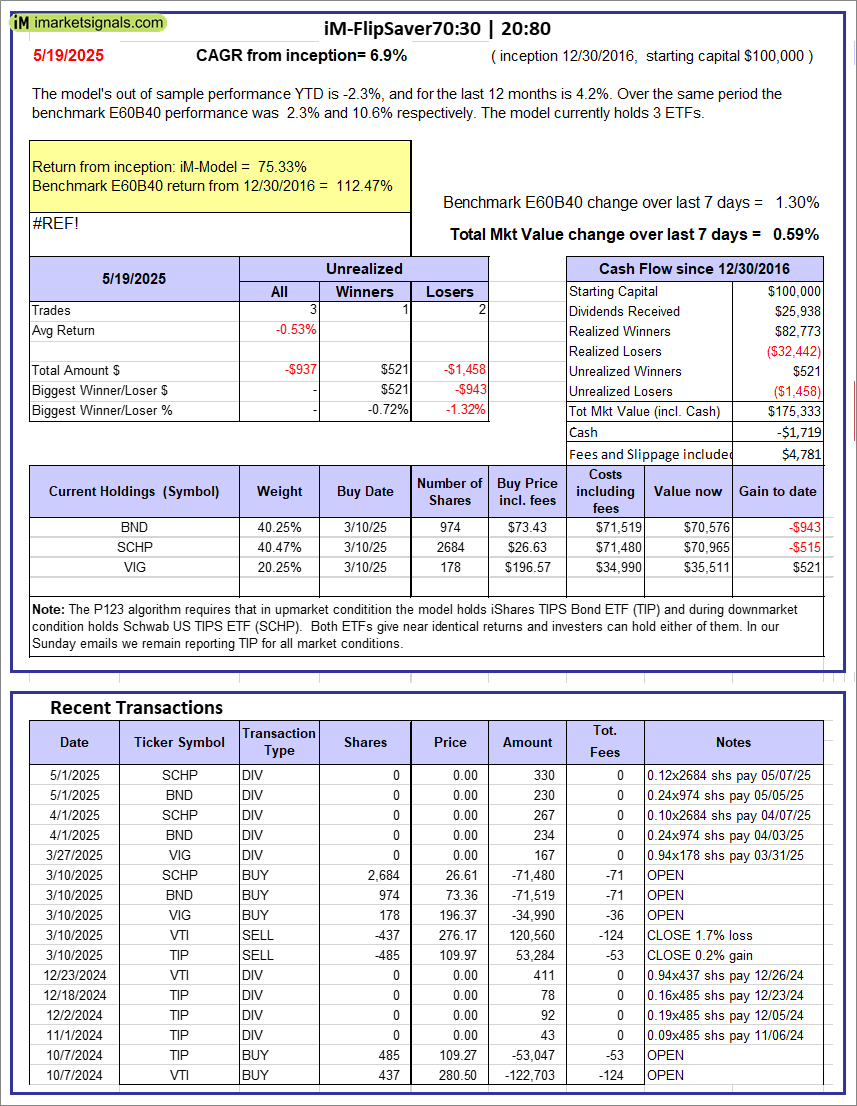 |
iM-FlipSaver 70:30 | 20:80 – 2017: The model’s out of sample performance YTD is -2.3%, and for the last 12 months is 4.2%. Over the same period the benchmark E60B40 performance was 2.3% and 10.6% respectively. Over the previous week the market value of iM-FlipSaver 70:30 | 20:80 gained 0.59% at a time when SPY gained 1.30%. A starting capital of $100,000 at inception on 7/15/2015 would have grown to $175,333 which includes -$1,719 cash and excludes $4,781 spent on fees and slippage. |
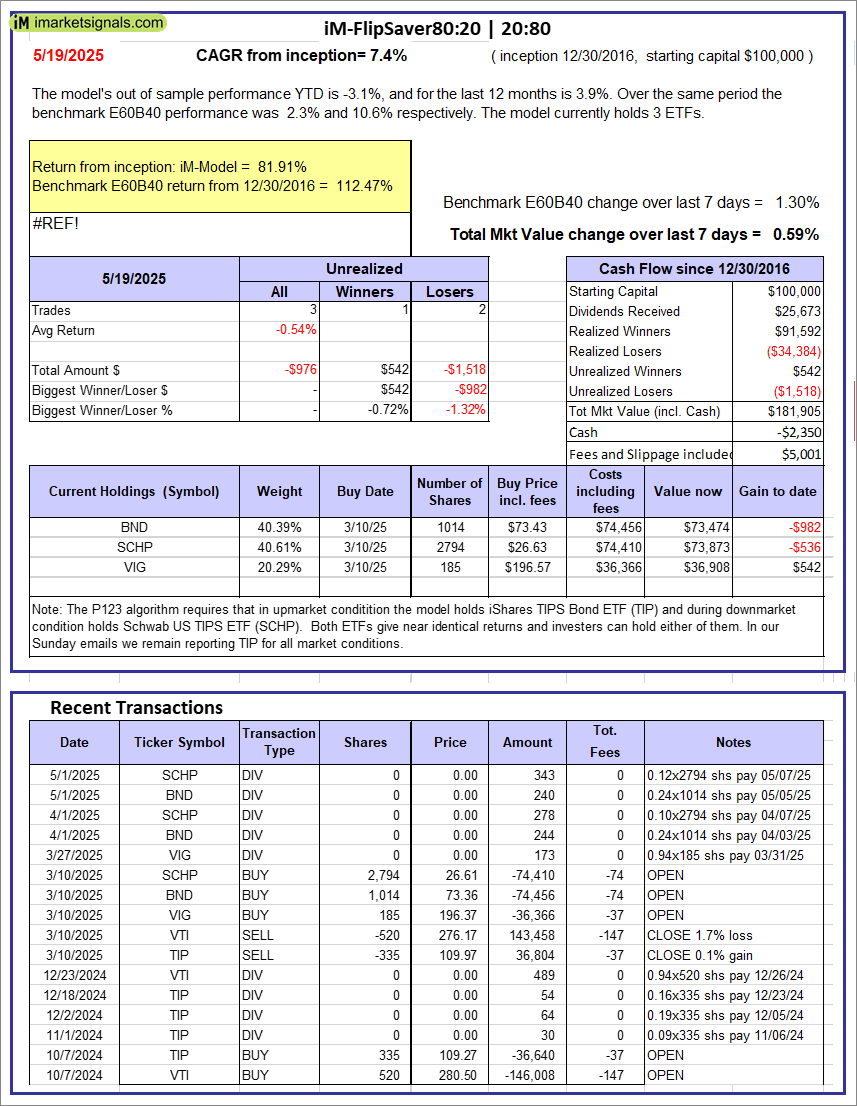 |
iM-FlipSaver 80:20 | 20:80 – 2017: The model’s out of sample performance YTD is -3.1%, and for the last 12 months is 3.9%. Over the same period the benchmark E60B40 performance was 2.3% and 10.6% respectively. Over the previous week the market value of iM-FlipSaver 80:20 | 20:80 gained 0.59% at a time when SPY gained 1.30%. A starting capital of $100,000 at inception on 1/2/2017 would have grown to $181,905 which includes -$2,350 cash and excludes $5,001 spent on fees and slippage. |
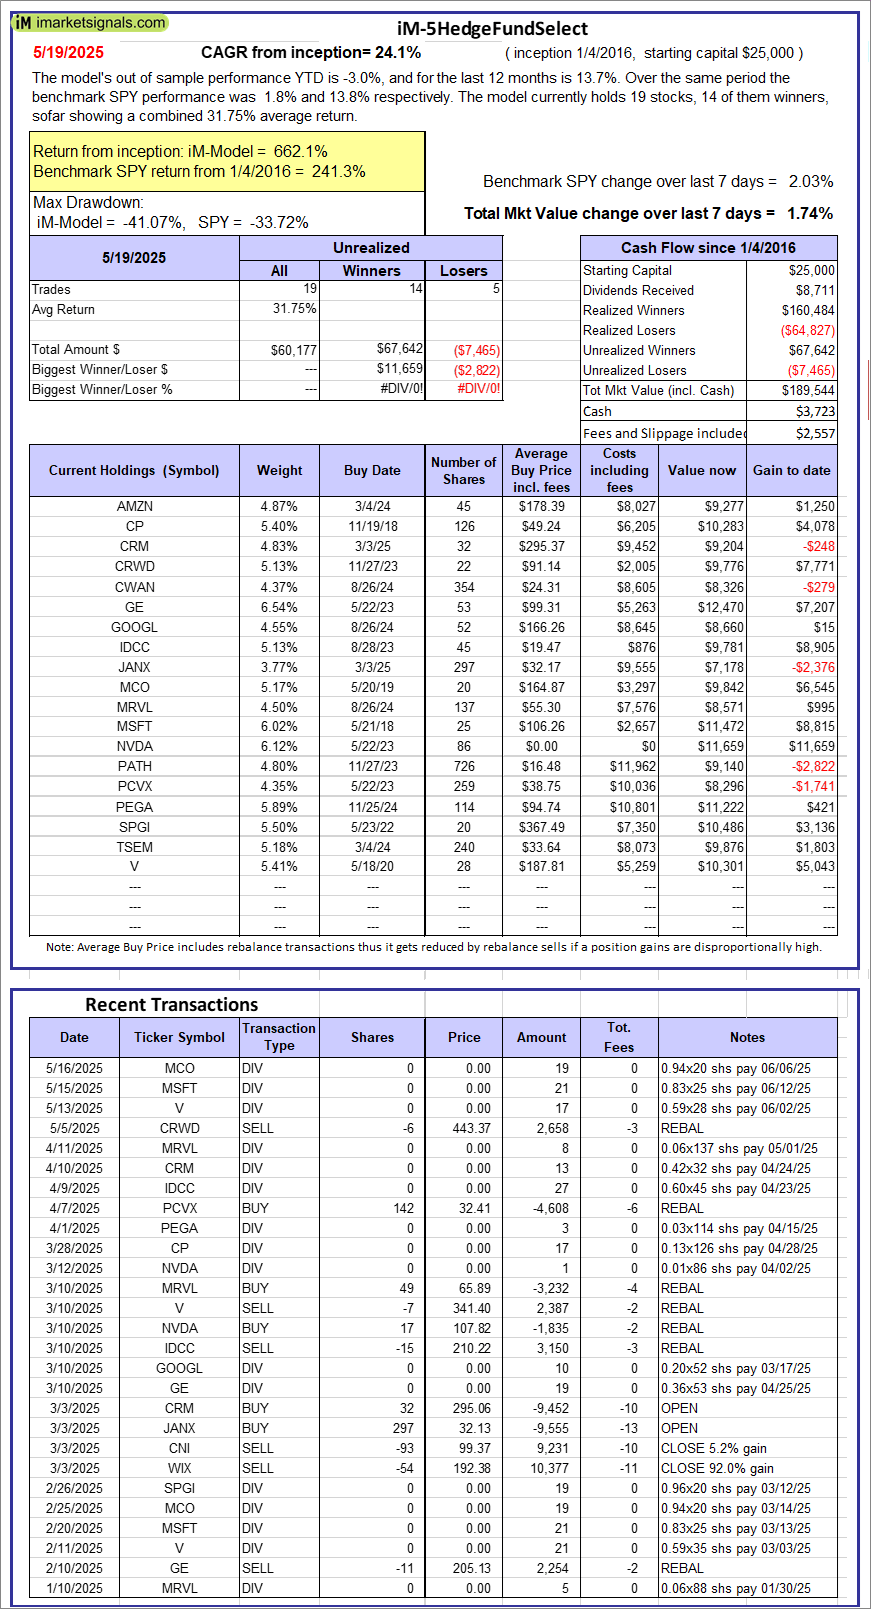 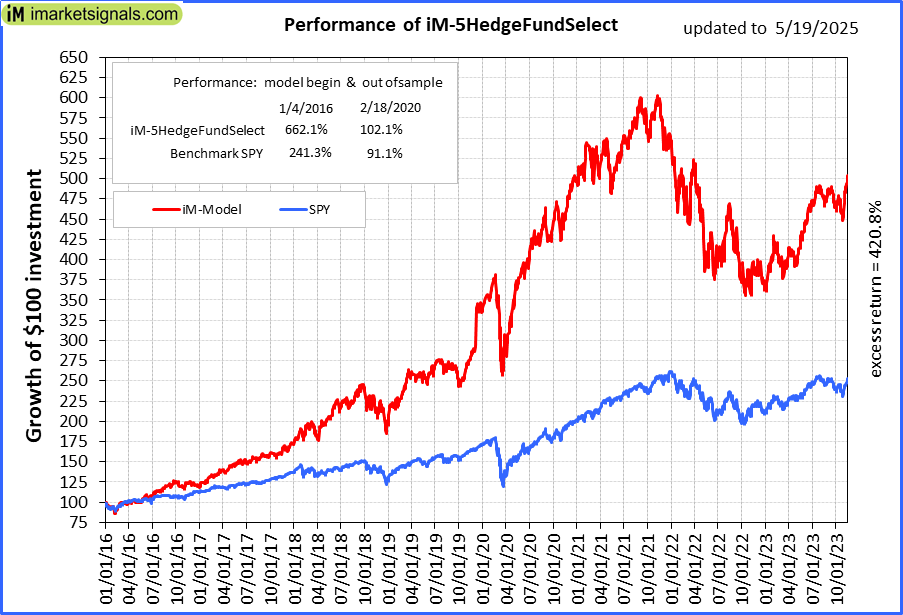 |
iM-5HedgeFundSelect: Since inception, on 1/5/2016, the model gained 662.13% while the benchmark SPY gained 241.30% over the same period. Over the previous week the market value of iM-5HedgeFundSelect gained 1.74% at a time when SPY gained 2.03%. A starting capital of $25,000 at inception on 1/5/2016 would have grown to $189,544 which includes $3,723 cash and excludes $2,557 spent on fees and slippage. |
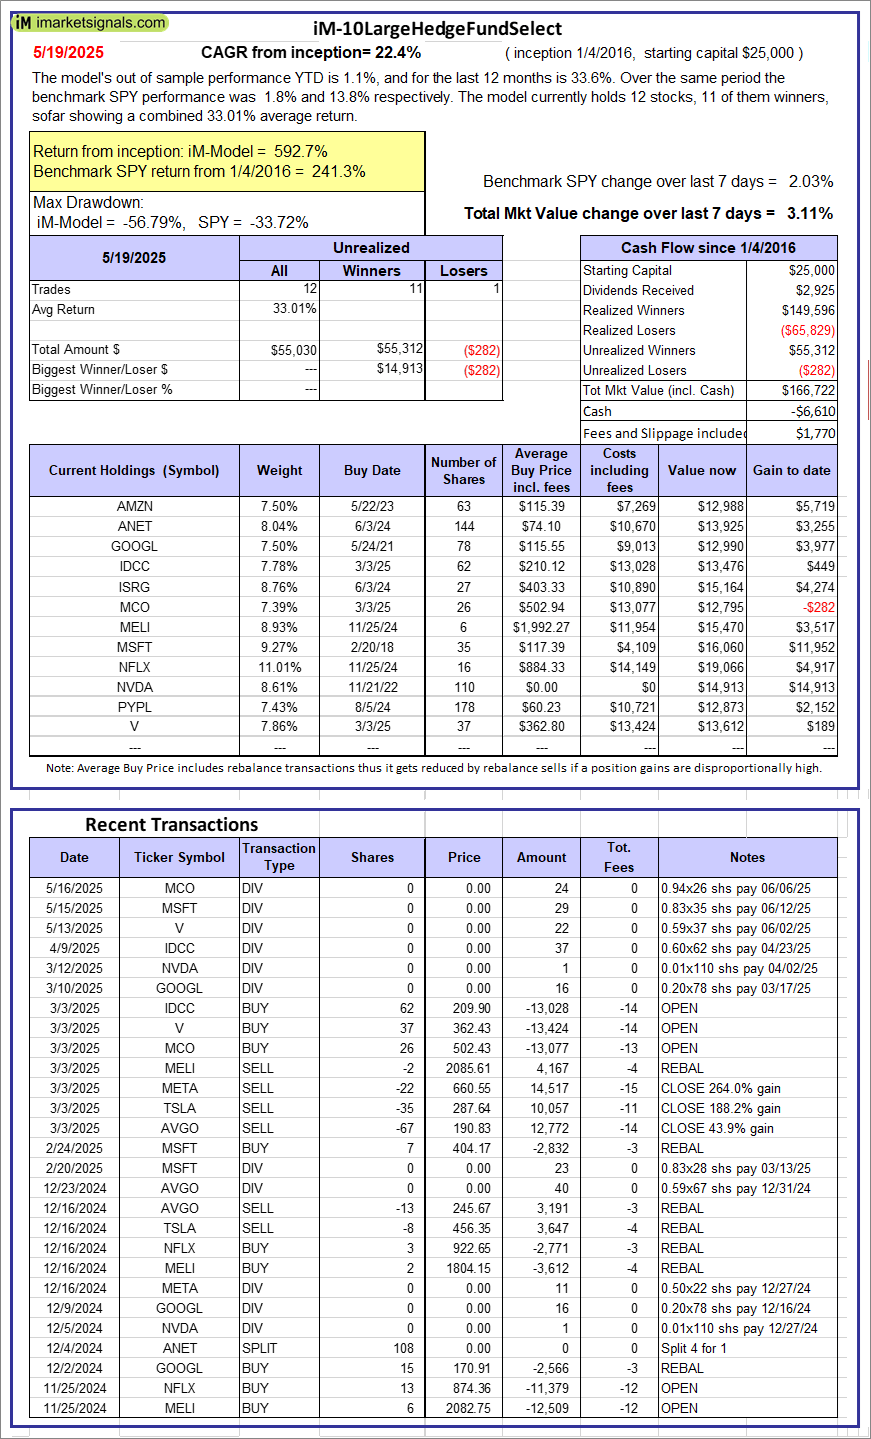 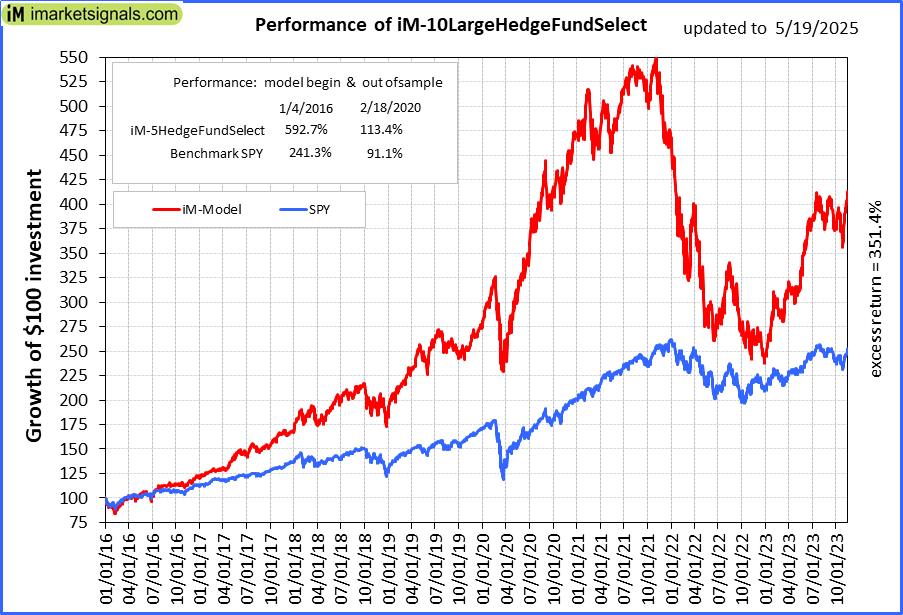 |
iM-10LargeHedgeFundSelect: Since inception, on 1/5/2016, the model gained 592.68% while the benchmark SPY gained 241.30% over the same period. Over the previous week the market value of iM-10LargeHedgeFundSelect gained 3.11% at a time when SPY gained 2.03%. A starting capital of $25,000 at inception on 1/5/2016 would have grown to $166,722 which includes -$6,610 cash and excludes $1,770 spent on fees and slippage. |
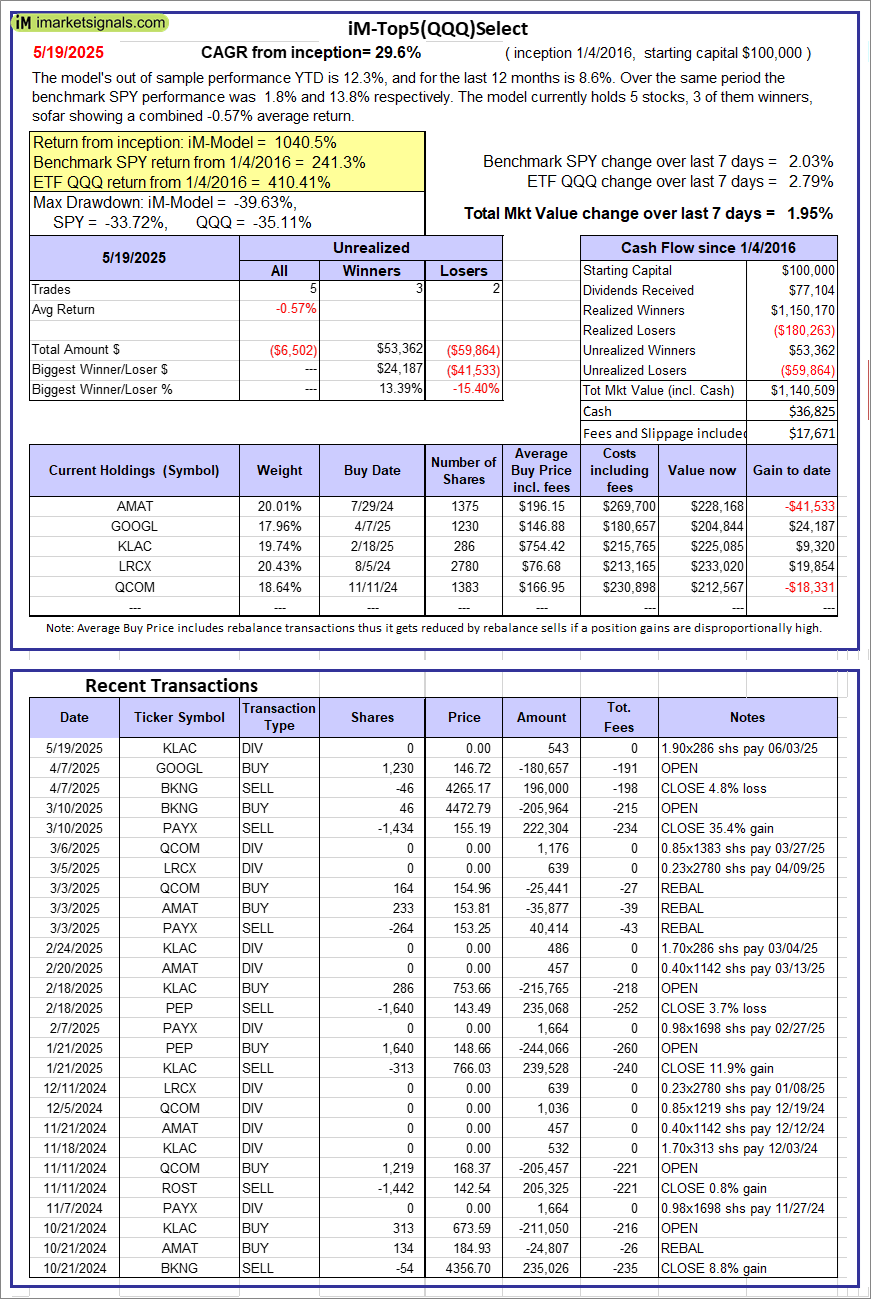 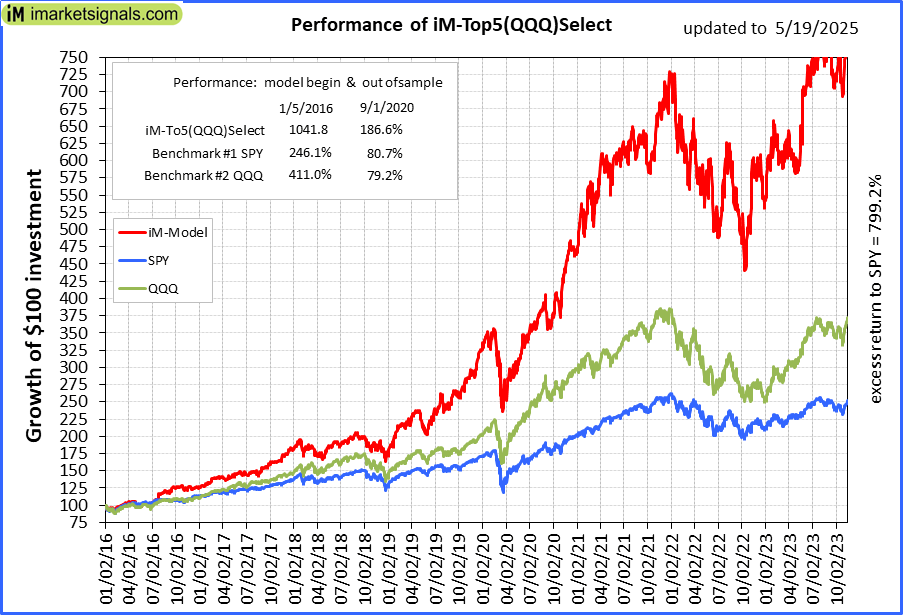 |
iM-Top5(QQQ)Select: Since inception, on 1/5/2016, the model gained 1040.51% while the benchmark SPY gained 241.30% over the same period. Over the previous week the market value of iM-Top5(QQQ)Select gained 1.95% at a time when SPY gained 2.03%. A starting capital of $100,000 at inception on 1/5/2016 would have grown to $1,140,509 which includes $36,825 cash and excludes $17,671 spent on fees and slippage. |
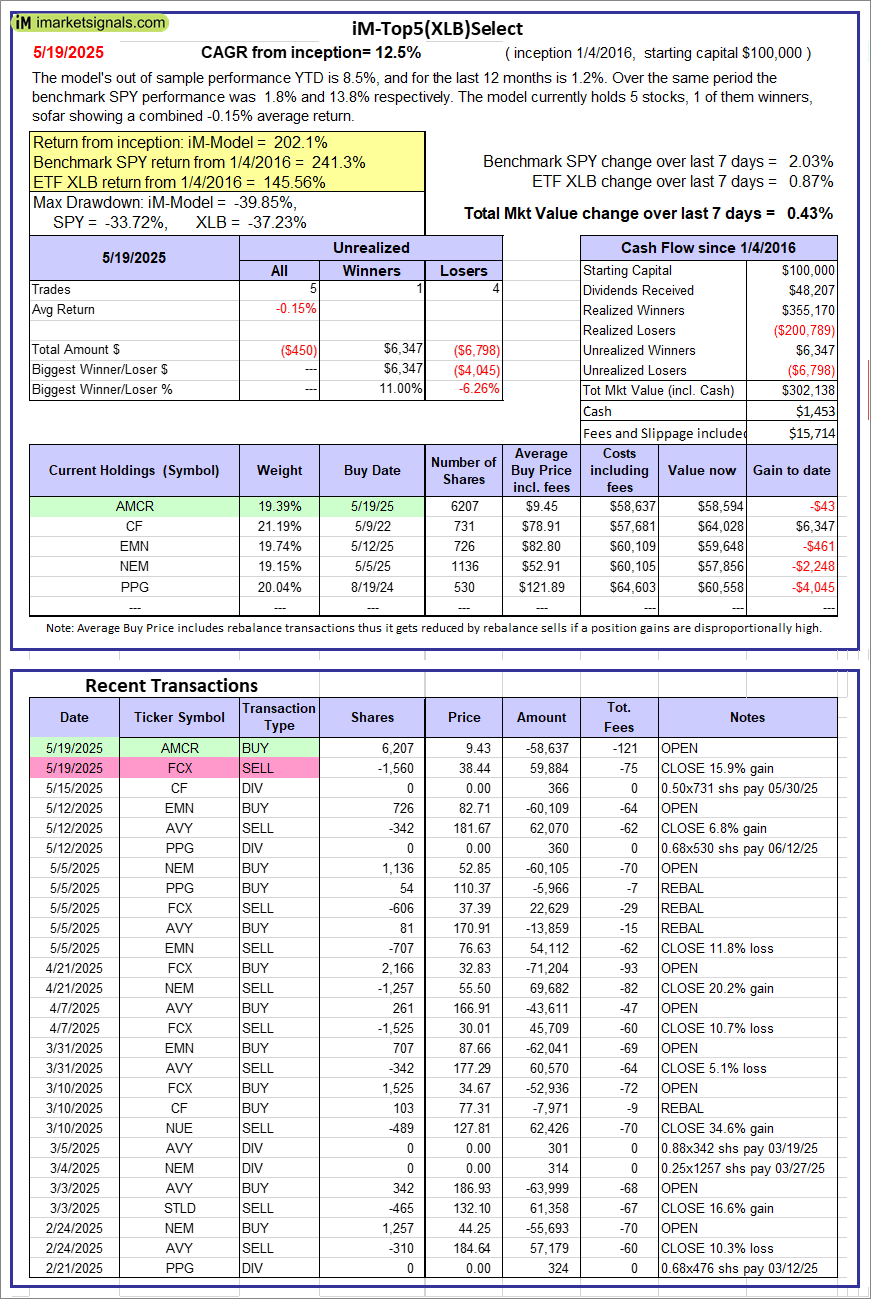 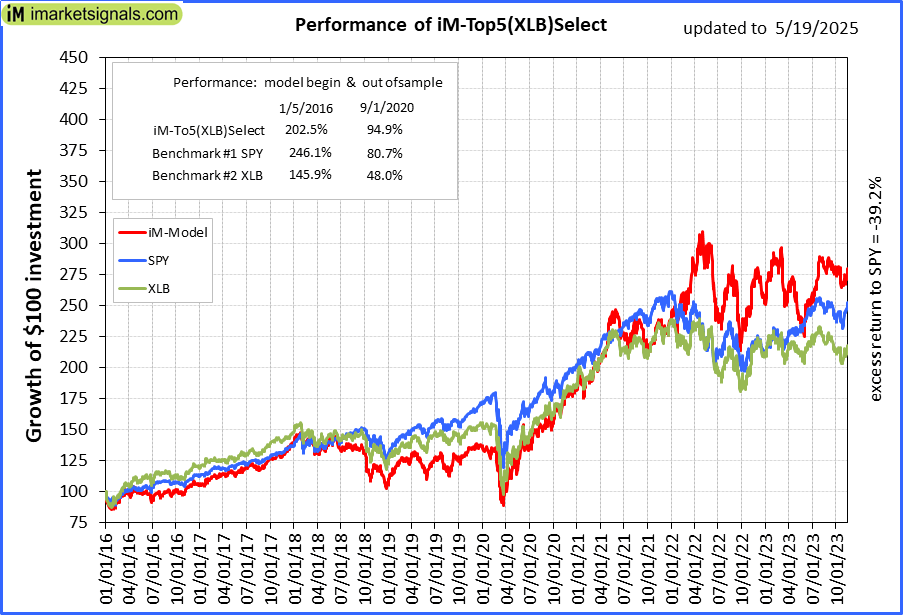 |
iM-Top5(XLB)Select: Since inception, on 1/5/2016, the model gained 202.14% while the benchmark SPY gained 241.30% over the same period. Over the previous week the market value of iM-Top5(XLB)Select gained 0.43% at a time when SPY gained 2.03%. A starting capital of $100,000 at inception on 1/5/2016 would have grown to $302,138 which includes $1,453 cash and excludes $15,714 spent on fees and slippage. |
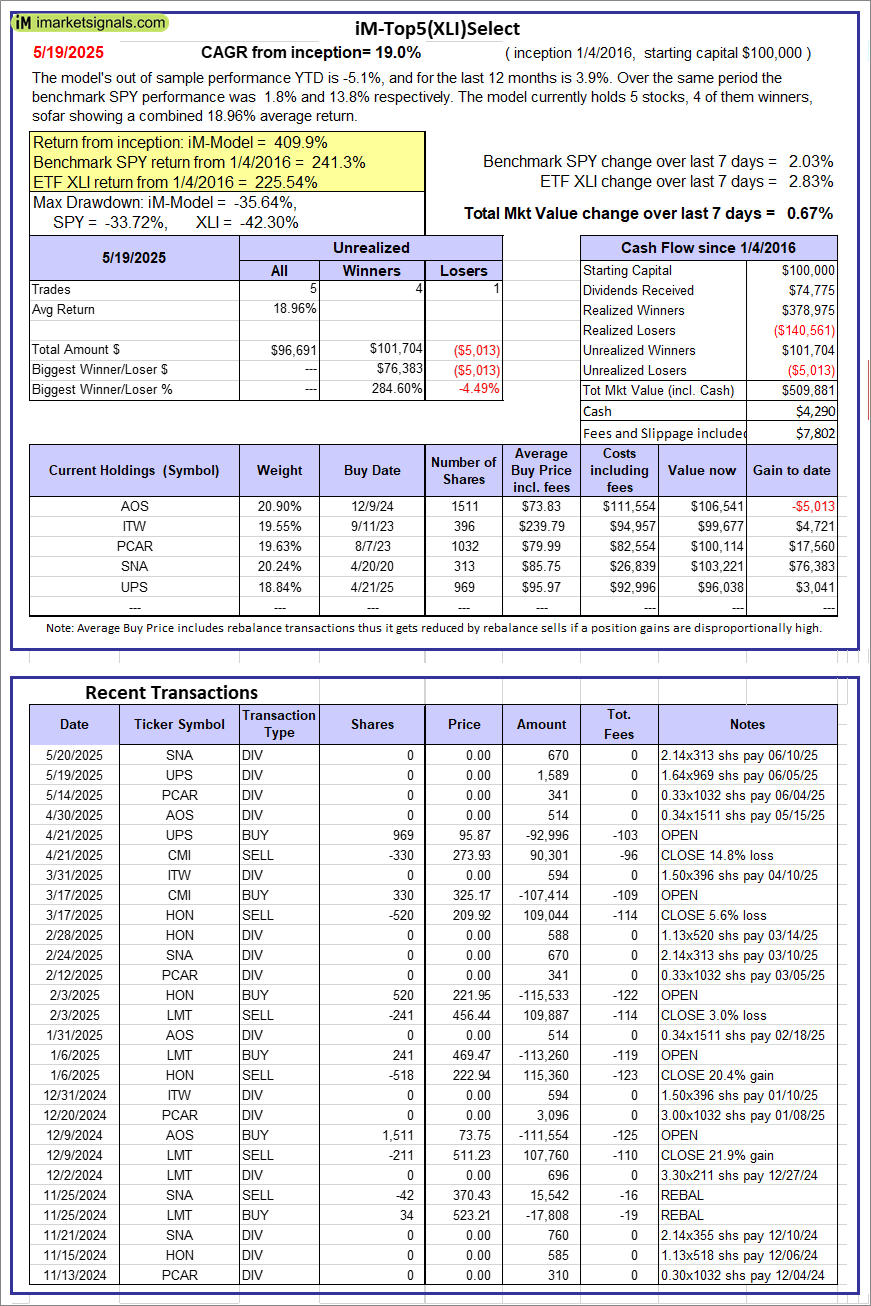 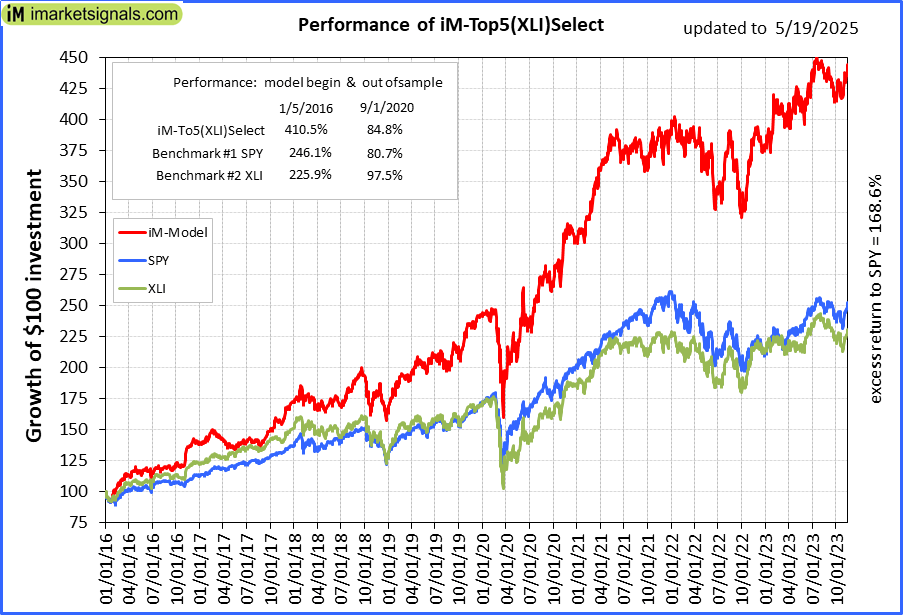 |
iM-Top5(XLI)Select: Since inception, on 1/5/2016, the model gained 409.88% while the benchmark SPY gained 241.30% over the same period. Over the previous week the market value of iM-Top5(XLI)Select gained 0.67% at a time when SPY gained 2.03%. A starting capital of $100,000 at inception on 1/5/2016 would have grown to $509,881 which includes $4,290 cash and excludes $7,802 spent on fees and slippage. |
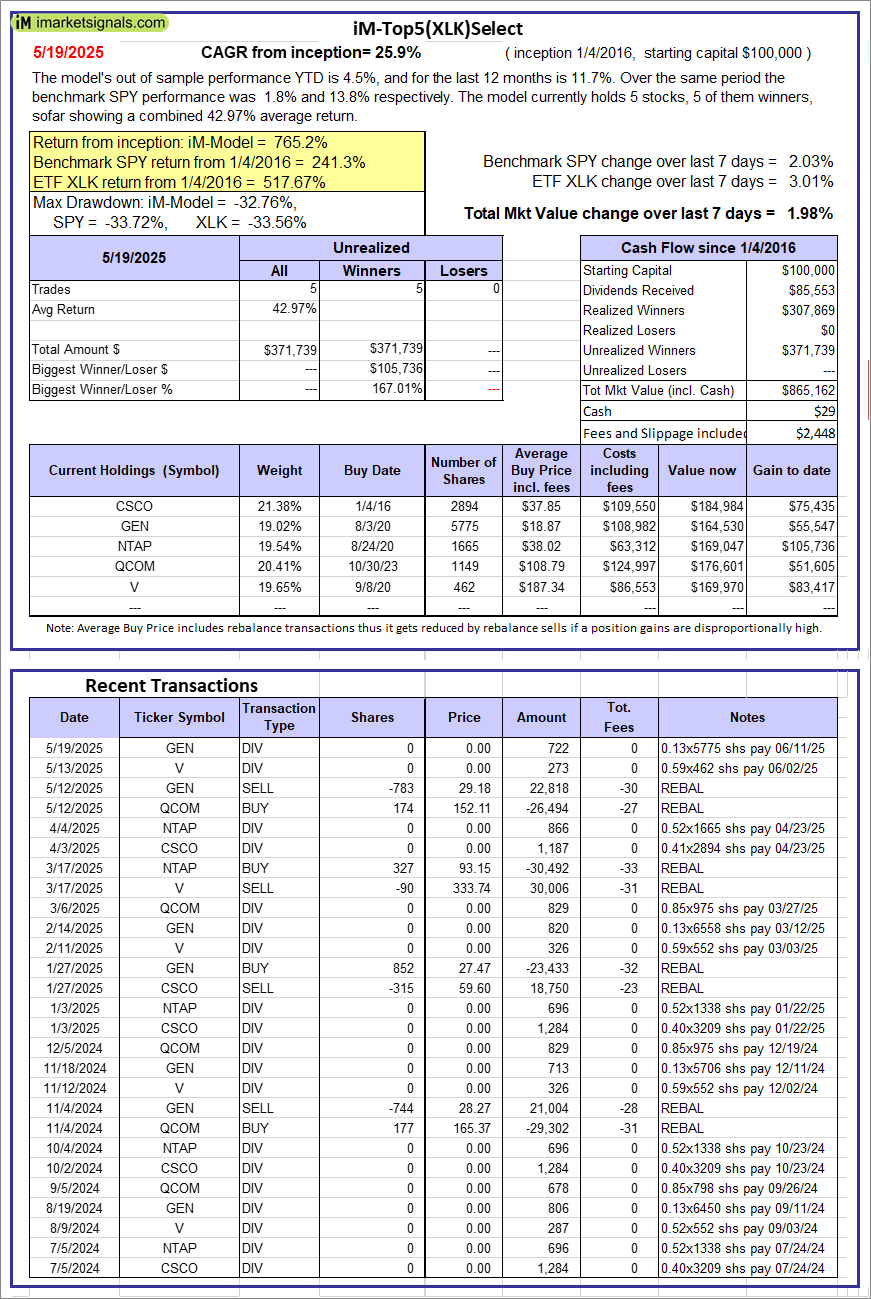 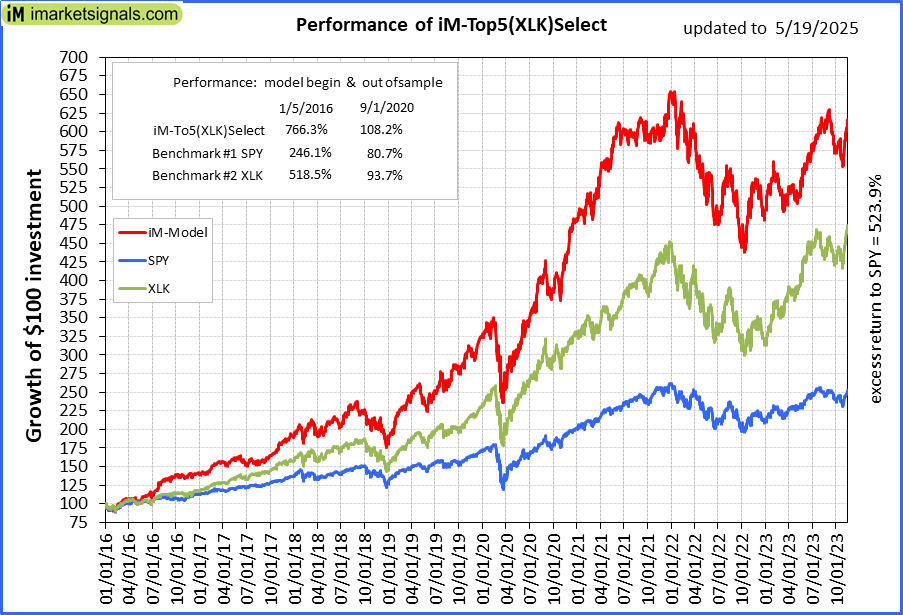 |
iM-Top5(XLK)Select: Since inception, on 1/5/2016, the model gained 765.16% while the benchmark SPY gained 241.30% over the same period. Over the previous week the market value of iM-Top5(XLK)Select gained 1.98% at a time when SPY gained 2.03%. A starting capital of $100,000 at inception on 1/5/2016 would have grown to $865,162 which includes $29 cash and excludes $2,448 spent on fees and slippage. |
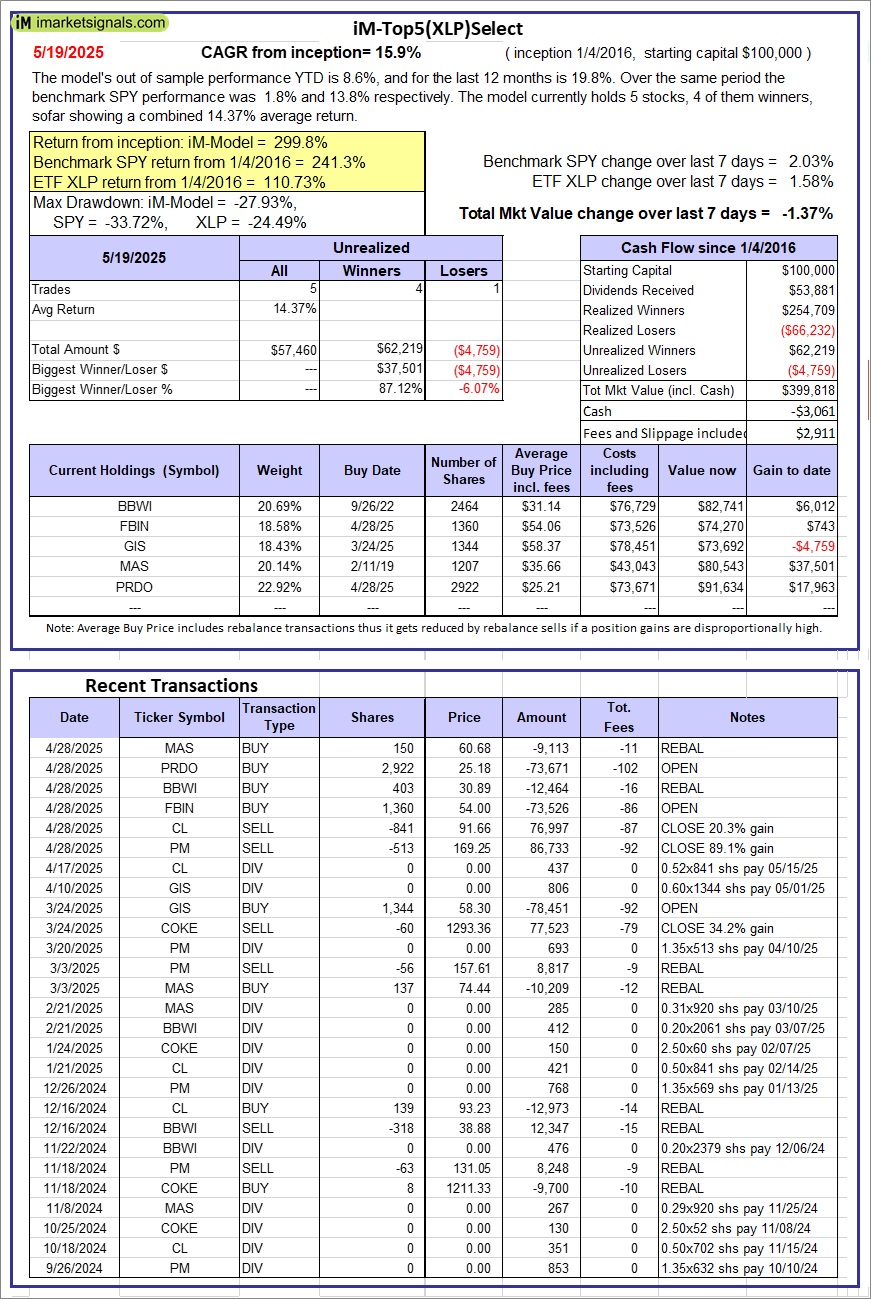  |
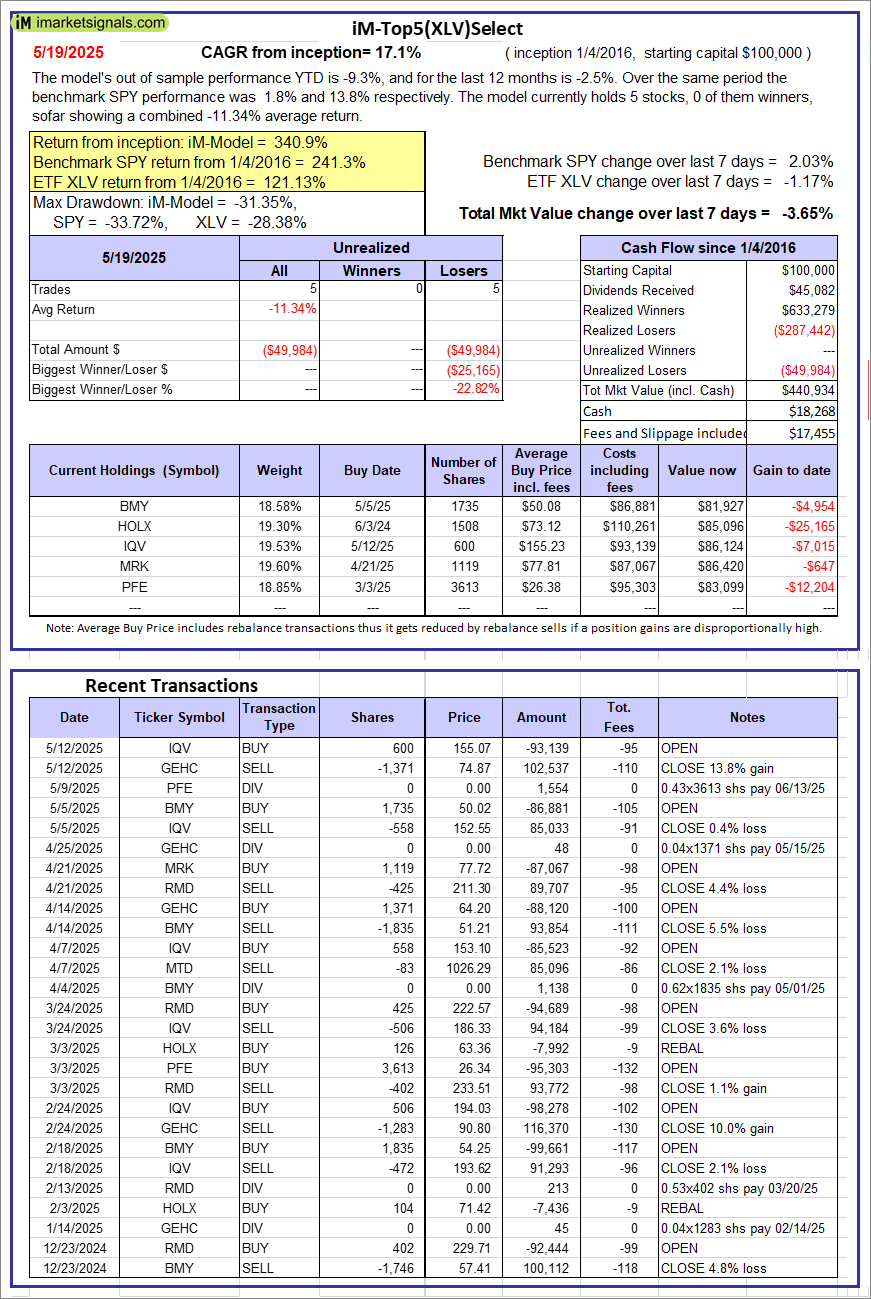
iM-Top5(XLP)Select: Since inception, on 1/5/2016, the model gained 299.82% while the benchmark SPY gained 241.30% over the same period. Over the previous week the market value of iM-Top5(XLP)Select gained -1.37% at a time when SPY gained 2.03%. A starting capital of $100,000 at inception on 1/5/2016 would have grown to $399,818 which includes -$3,061 cash and excludes $2,911 spent on fees and slippage. |
 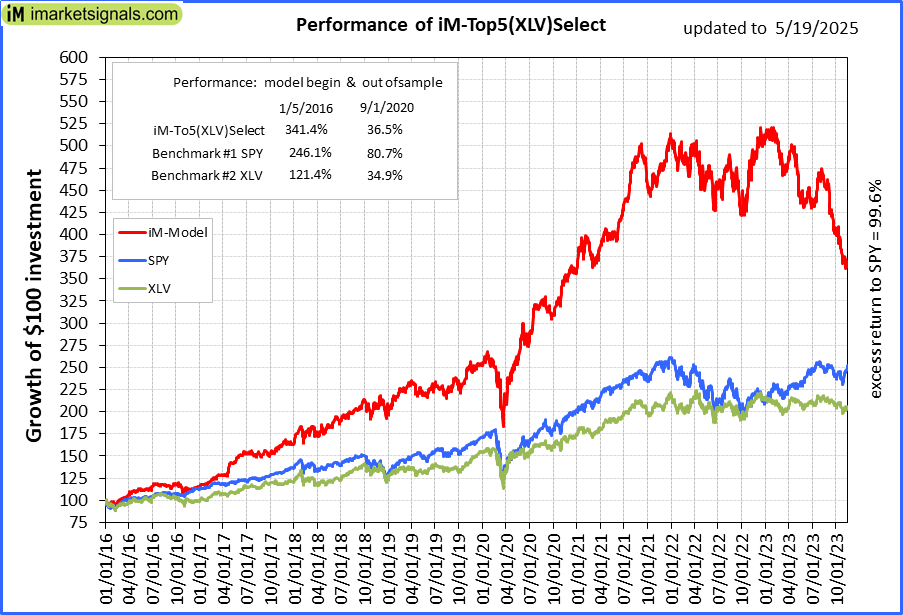 |
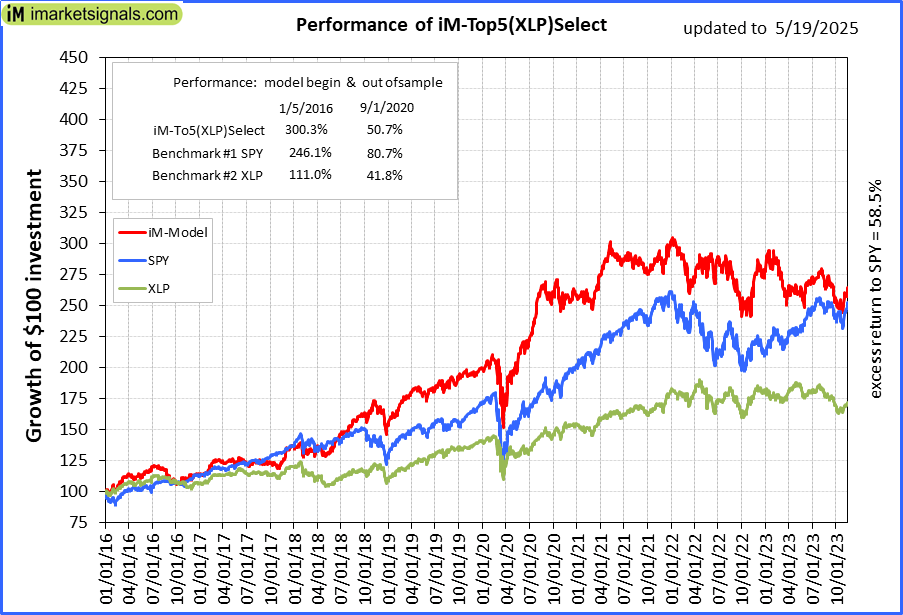
iM-Top5(XLV)Select: Since inception, on 1/5/2016, the model gained 340.93% while the benchmark SPY gained 241.30% over the same period. Over the previous week the market value of iM-Top5(XLV)Select gained -3.65% at a time when SPY gained 2.03%. A starting capital of $100,000 at inception on 1/5/2016 would have grown to $440,934 which includes $18,268 cash and excludes $17,455 spent on fees and slippage. |
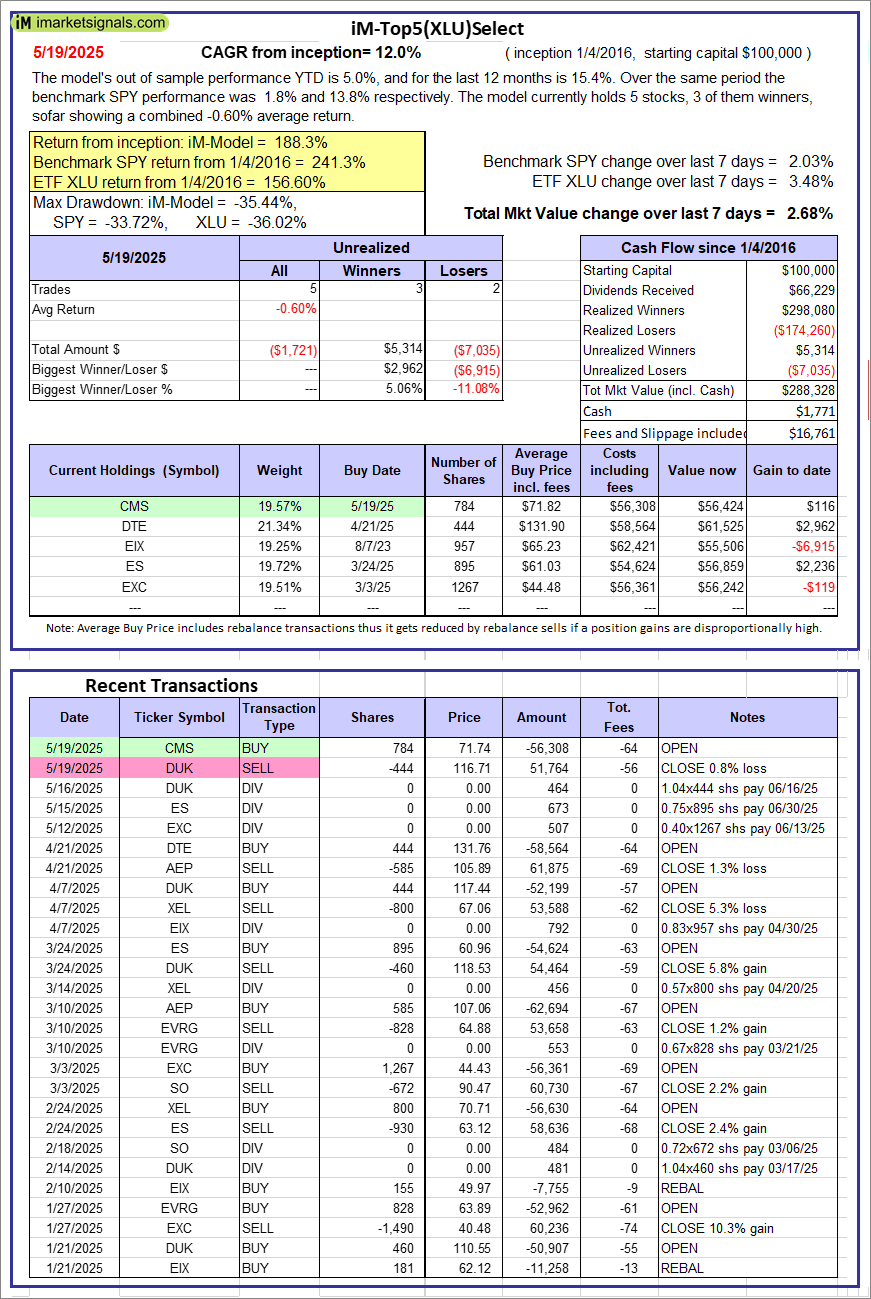 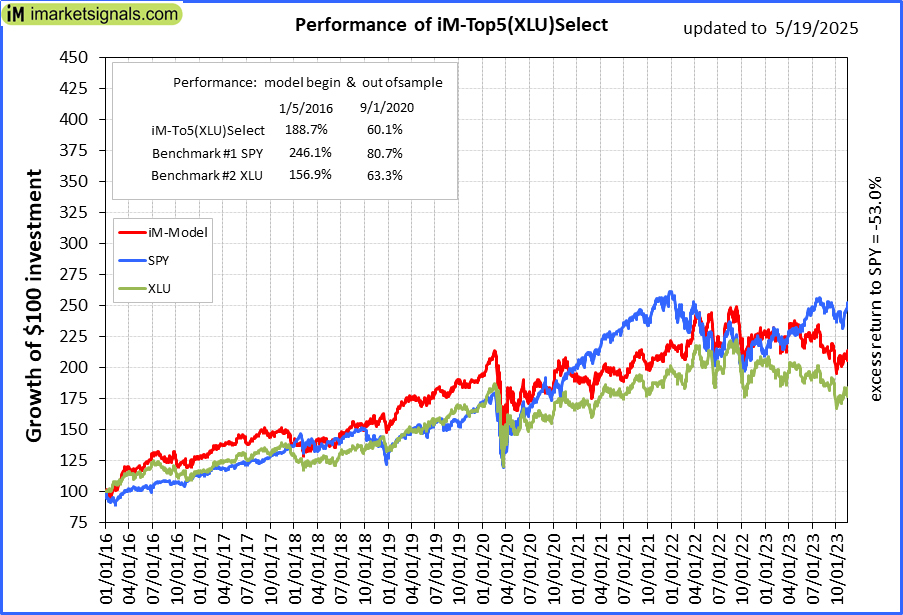 |
iM-Top5(XLU)Select: Since inception, on 1/5/2016, the model gained 188.33% while the benchmark SPY gained 241.30% over the same period. Over the previous week the market value of iM-Top5(XLU)Select gained 2.68% at a time when SPY gained 2.03%. A starting capital of $100,000 at inception on 1/5/2016 would have grown to $288,328 which includes $1,771 cash and excludes $16,761 spent on fees and slippage. |
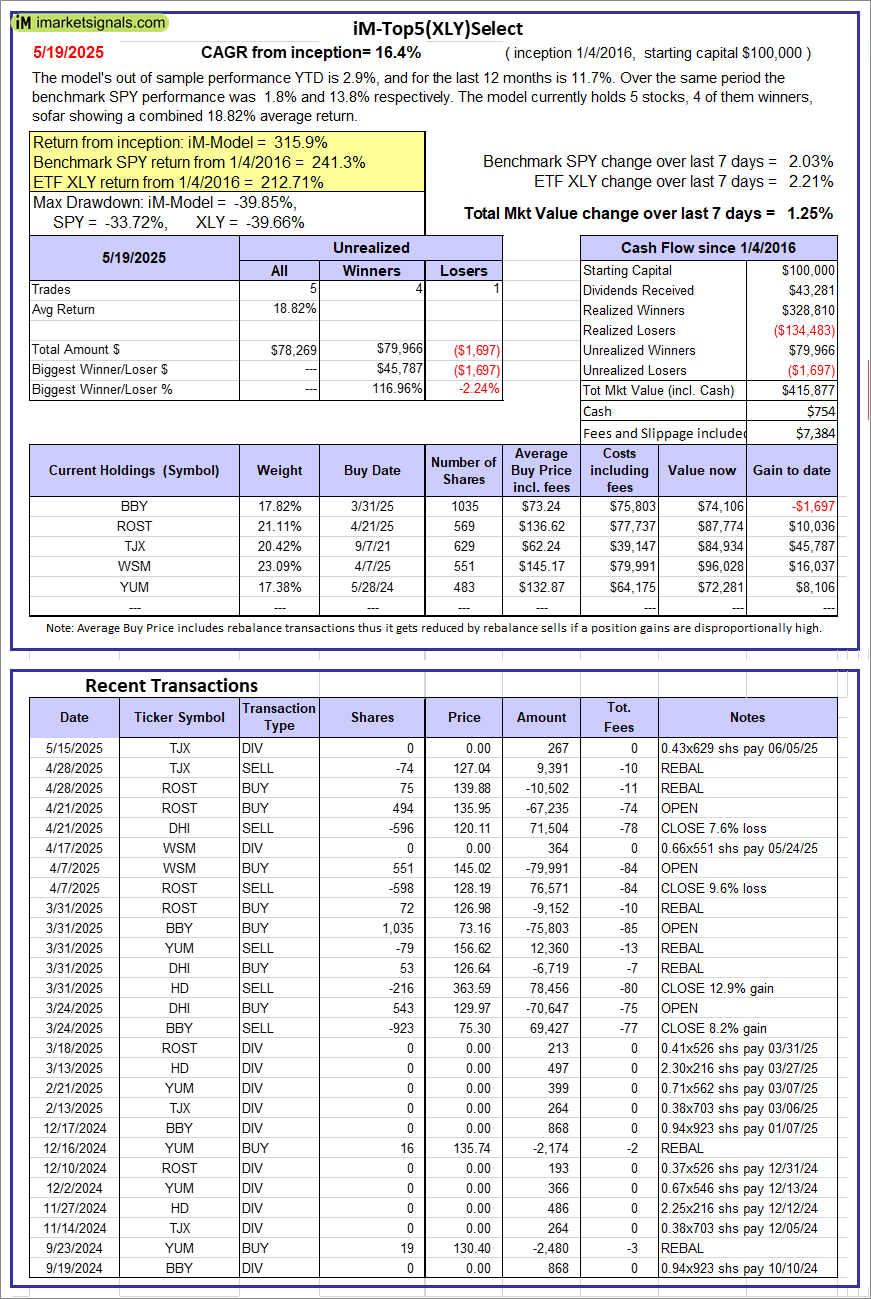 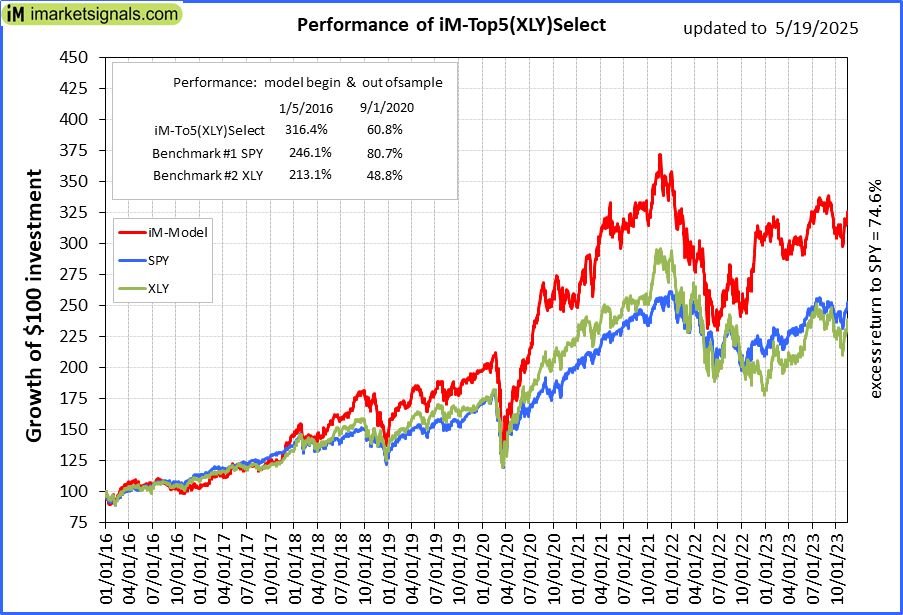 |
iM-Top5(XLY)Select: Since inception, on 1/5/2016, the model gained 315.88% while the benchmark SPY gained 241.30% over the same period. Over the previous week the market value of iM-Top5(XLY)Select gained 1.25% at a time when SPY gained 2.03%. A starting capital of $100,000 at inception on 1/5/2016 would have grown to $415,877 which includes $754 cash and excludes $7,384 spent on fees and slippage. |
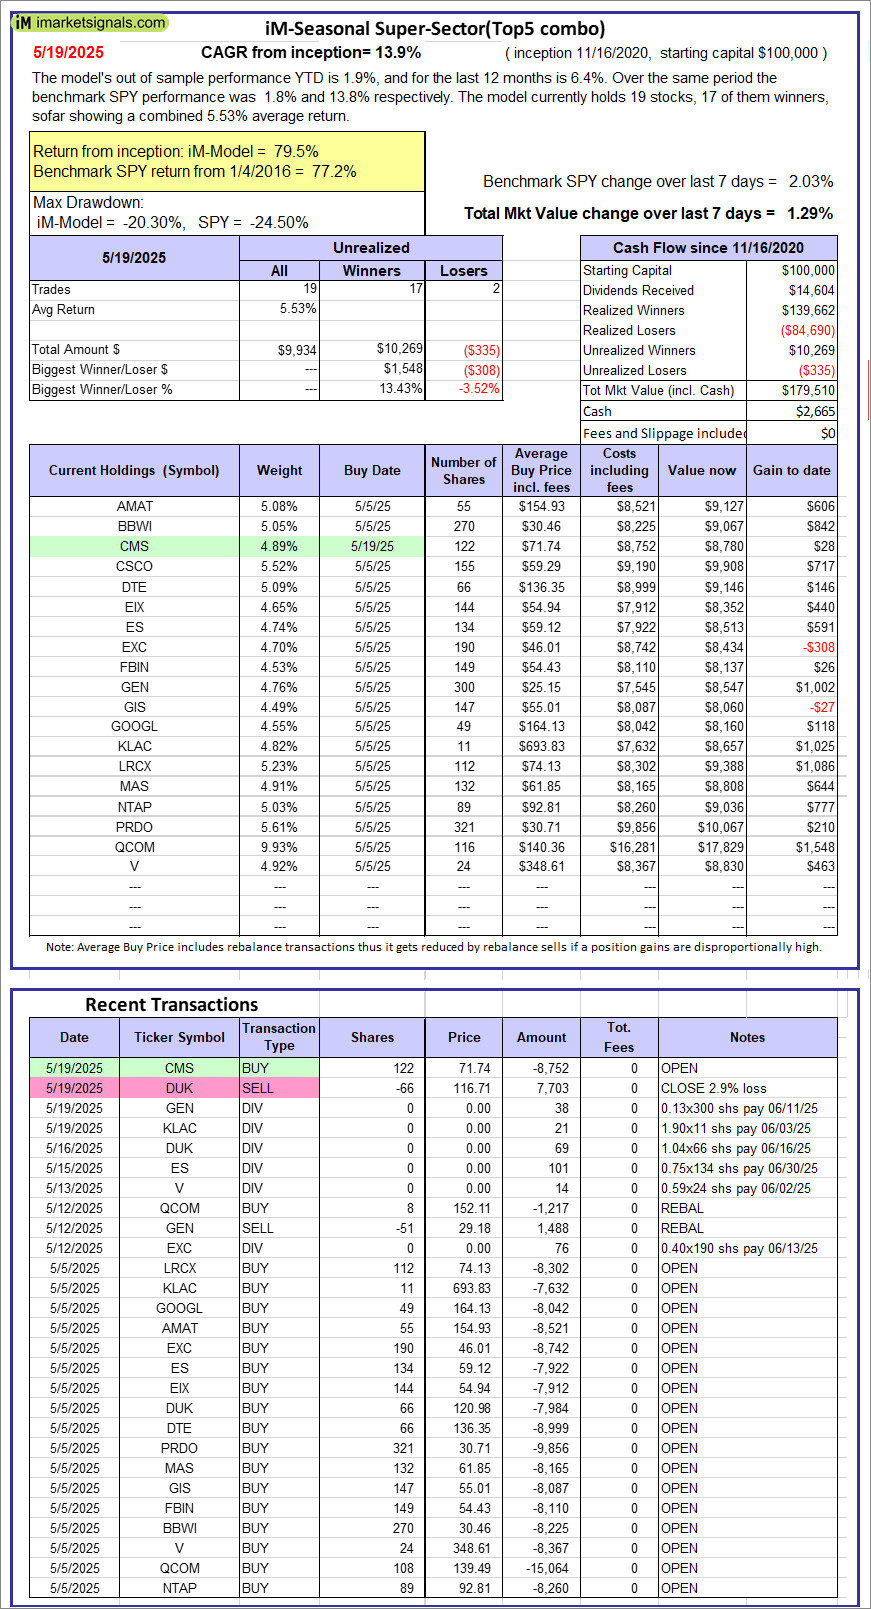 |
iM-Seasonal Super-Sectors (Top5 combo) : Since inception, on 11/17/2020, the model gained 79.51% while the benchmark SPY gained 77.17% over the same period. Over the previous week the market value of iM-Seasonal Super-Sectors (Top5 combo) gained 1.29% at a time when SPY gained 2.03%. A starting capital of $100,000 at inception on 11/17/2020 would have grown to $179,510 which includes $2,665 cash and excludes $00 spent on fees and slippage. |
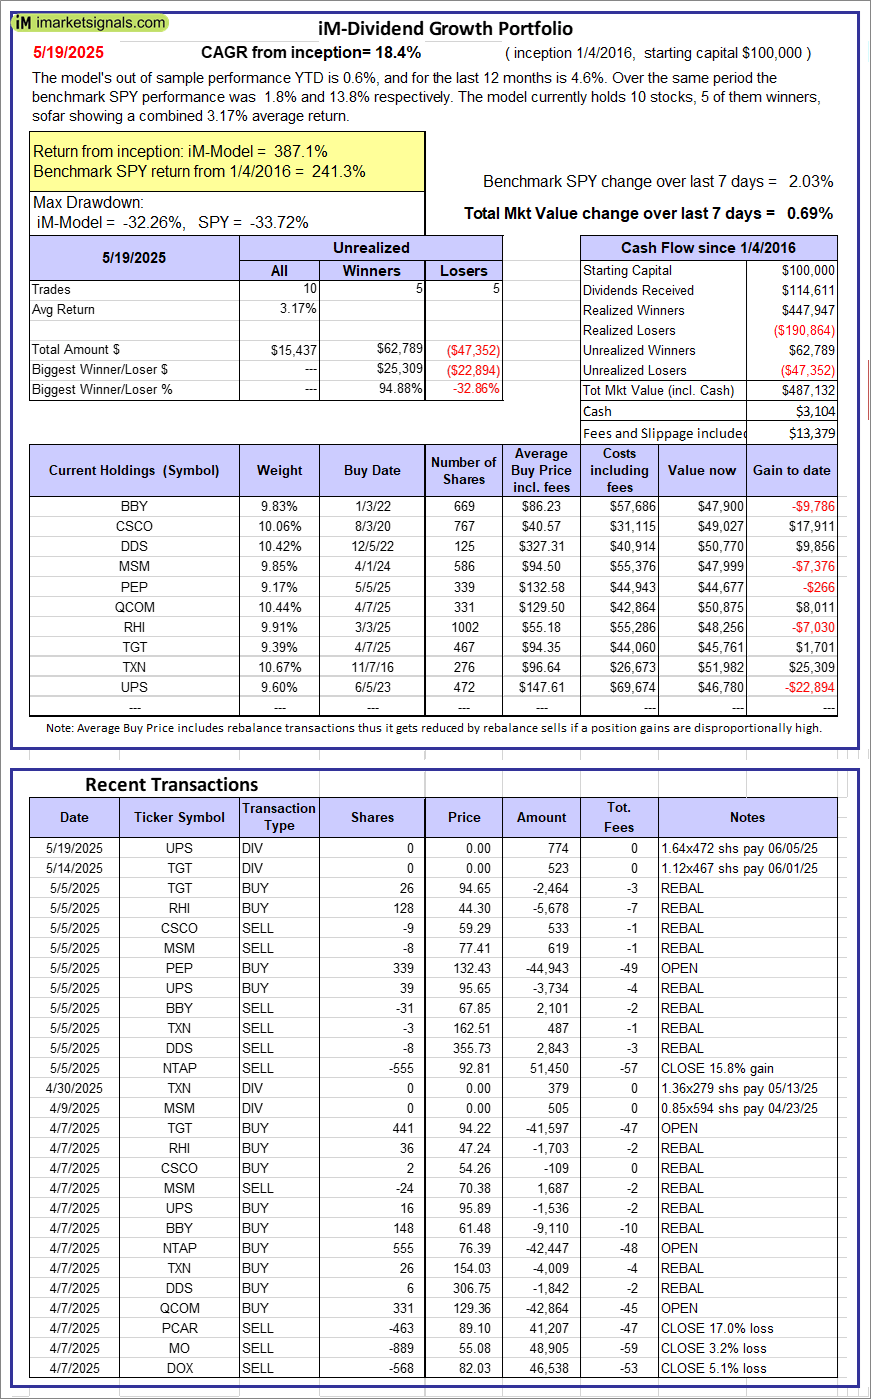 |
iM-Dividend Growth Portfolio: The model’s out of sample performance YTD is 0.6%, and for the last 12 months is 4.6%. Over the same period the benchmark SPY performance was 1.8% and 13.8% respectively. Over the previous week the market value of the iM-Dividend Growth Portfolio gained 0.69% at a time when SPY gained 2.03%. A starting capital of $100,000 at inception on 6/30/2016 would have grown to $487,132 which includes $3,104 cash and excludes $13,379 spent on fees and slippage. |
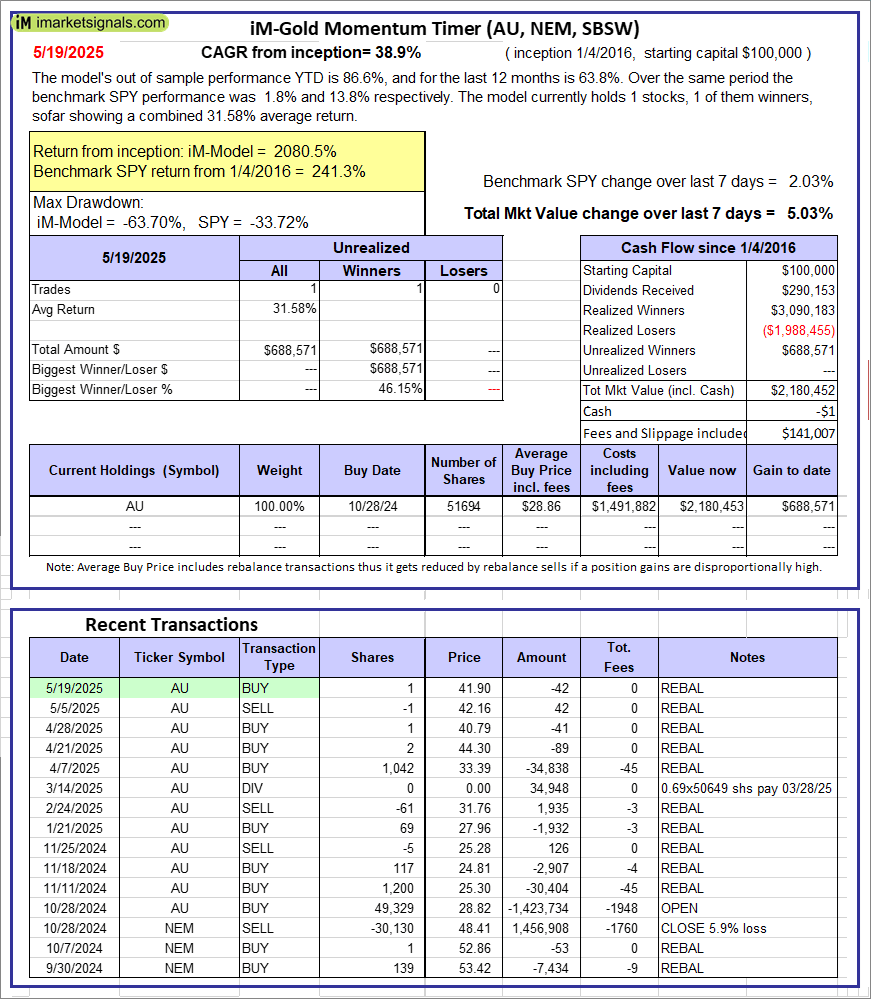 |
iM-Gold Momentum Timer (AU, NEM, SBSW): The model’s out of sample performance YTD is 86.6%, and for the last 12 months is 63.8%. Over the same period the benchmark SPY performance was 1.8% and 13.8% respectively. Over the previous week the market value of iM-Gold Momentum Timer (AU, NEM, SBSW) gained 5.03% at a time when SPY gained 2.03%. A starting capital of $100,000 at inception on 6/30/2016 would have grown to -$01 which includes $141,007 cash and excludes Gain to date spent on fees and slippage. |
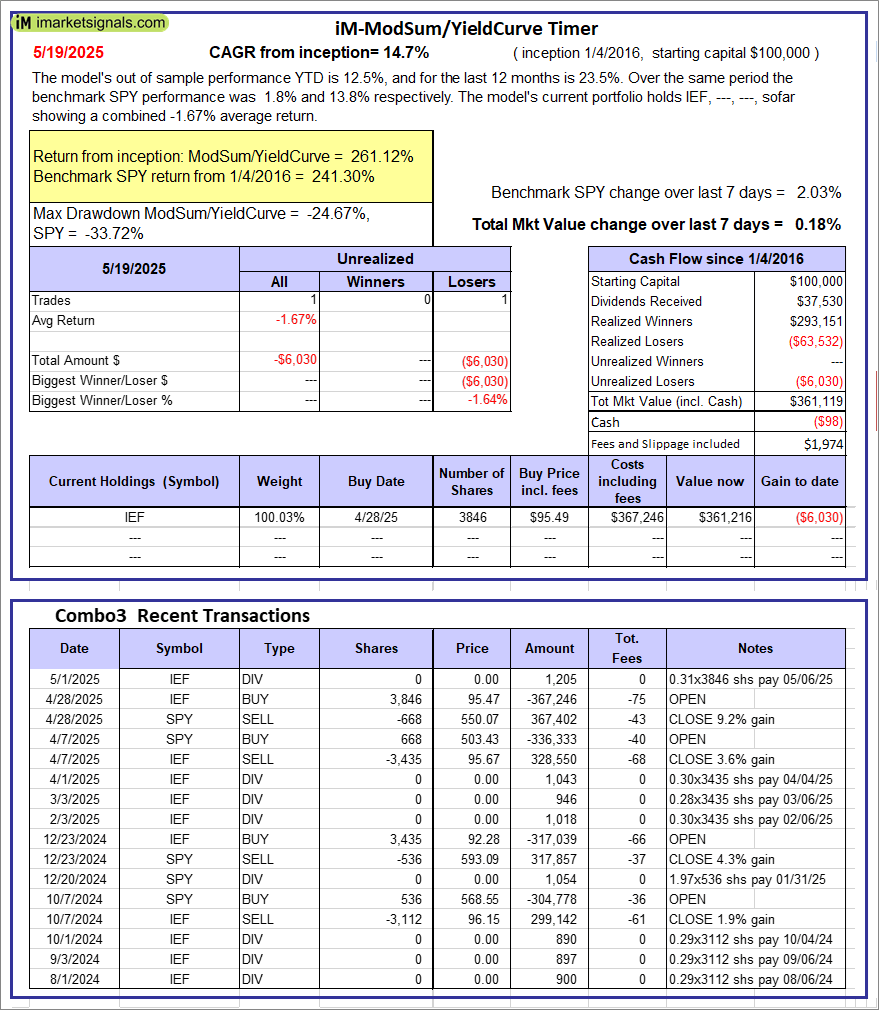 |
iM-ModSum/YieldCurve Timer: The model’s out of sample performance YTD is 12.5%, and for the last 12 months is 23.5%. Over the same period the benchmark SPY performance was 1.8% and 13.8% respectively. Over the previous week the market value of iM-PortSum/YieldCurve Timer gained 0.18% at a time when SPY gained 2.03%. A starting capital of $100,000 at inception on 1/1/2016 would have grown to $361,119 which includes -$98 cash and excludes $1,974 spent on fees and slippage. |
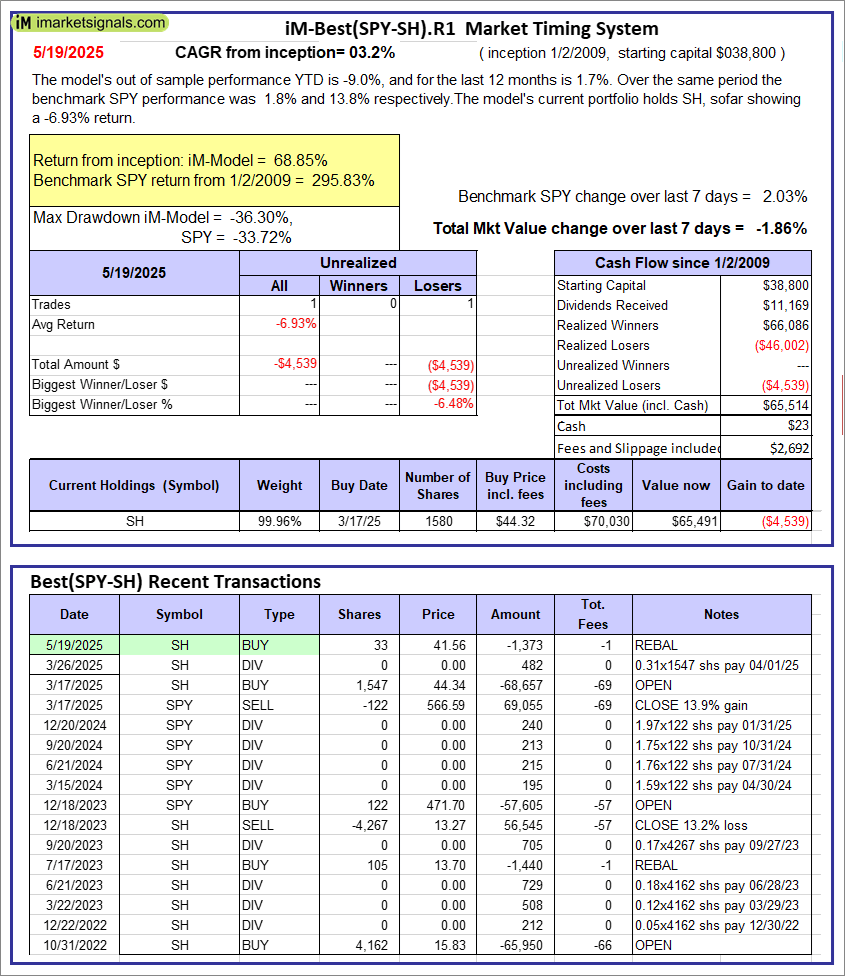 |
iM-Best(SPY-SH).R1: The model’s out of sample performance YTD is -9.0%, and for the last 12 months is 1.7%. Over the same period the benchmark SPY performance was 1.8% and 13.8% respectively. Over the previous week the market value of Best(SPY-SH) gained -1.86% at a time when SPY gained 2.03%. A starting capital of $100,000 at inception on 1/2/2009 would have grown to $65,514 which includes $23 cash and excludes $2,692 spent on fees and slippage. |
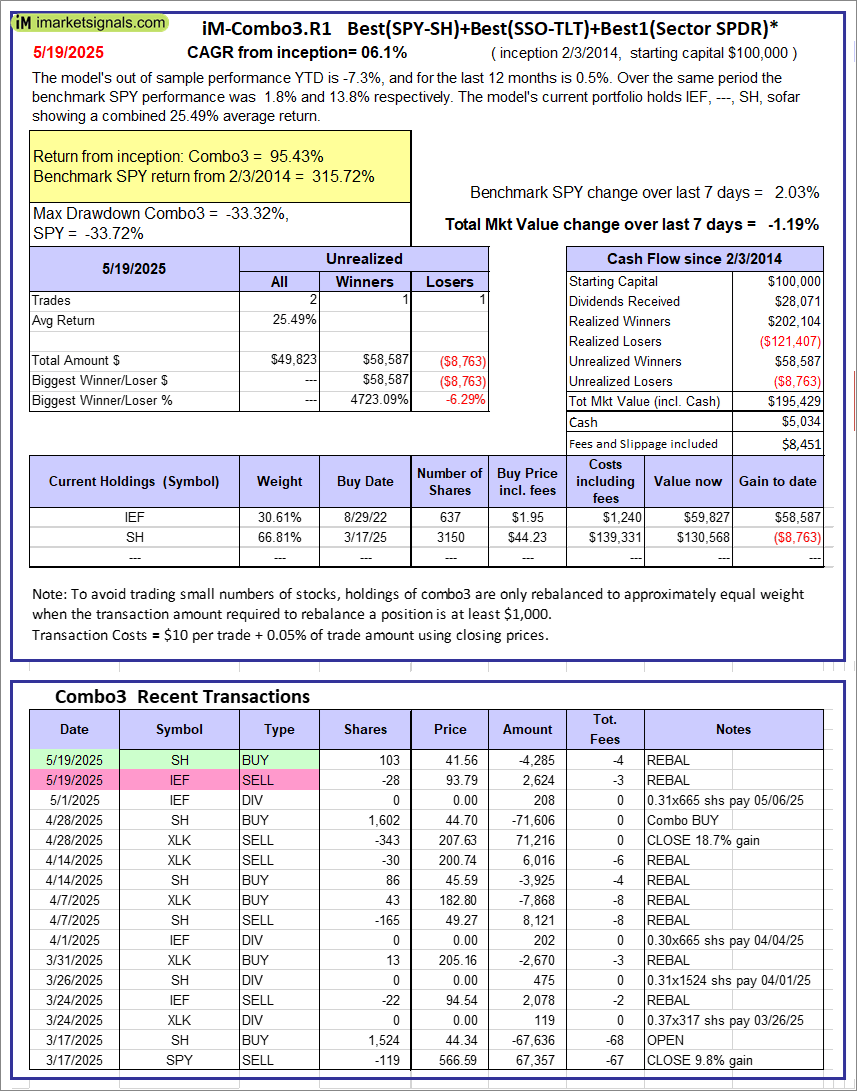 |
iM-Combo3.R1: The model’s out of sample performance YTD is -7.3%, and for the last 12 months is 0.5%. Over the same period the benchmark SPY performance was 1.8% and 13.8% respectively. Over the previous week the market value of iM-Combo3.R1 gained -1.19% at a time when SPY gained 2.03%. A starting capital of $100,000 at inception on 2/3/2014 would have grown to $195,429 which includes $5,034 cash and excludes $8,451 spent on fees and slippage. |
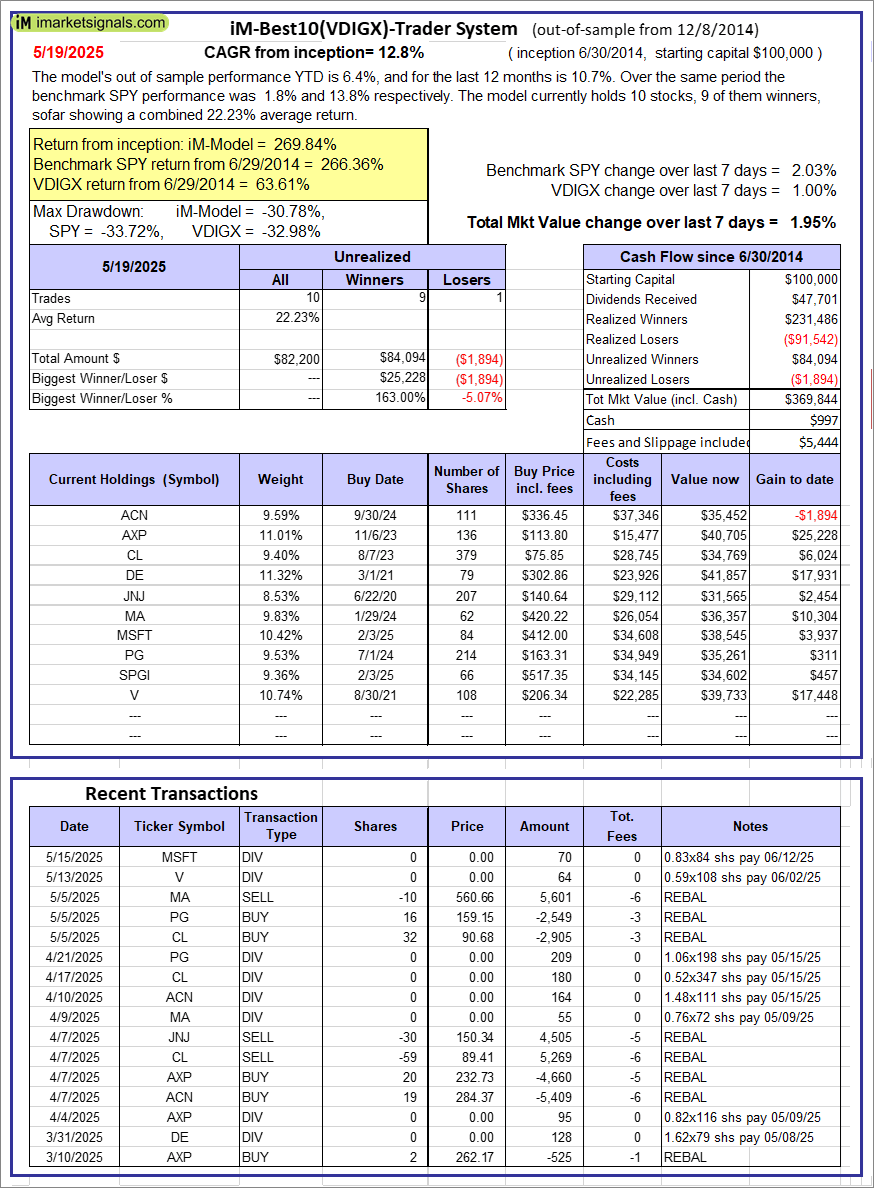 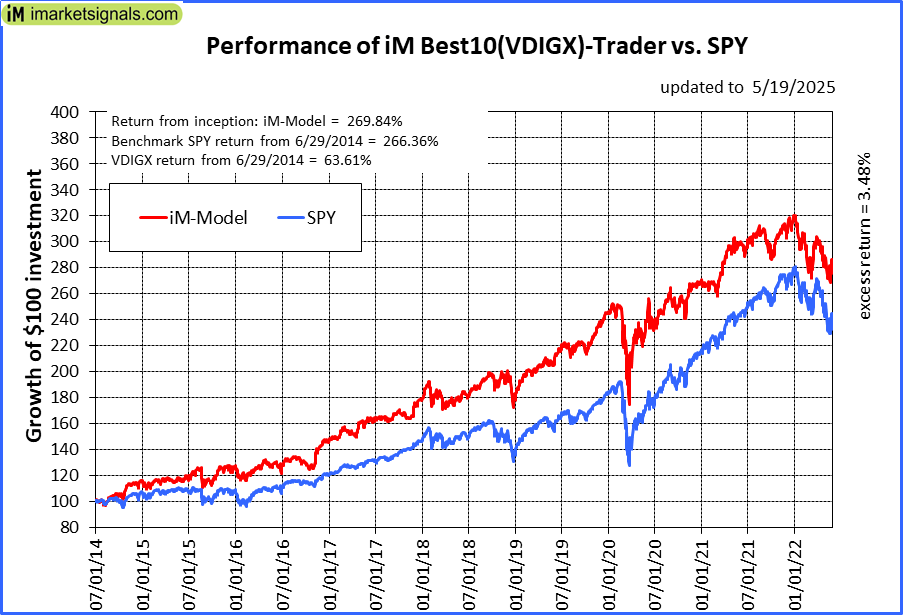 |
iM-Best10(VDIGX)-Trader: The model’s out of sample performance YTD is 6.4%, and for the last 12 months is 10.7%. Over the same period the benchmark SPY performance was 1.8% and 13.8% respectively. Since inception, on 7/1/2014, the model gained 269.84% while the benchmark SPY gained 266.36% and VDIGX gained 63.61% over the same period. Over the previous week the market value of iM-Best10(VDIGX) gained 1.95% at a time when SPY gained 2.03%. A starting capital of $100,000 at inception on 7/1/2014 would have grown to $369,844 which includes $997 cash and excludes $5,444 spent on fees and slippage. |
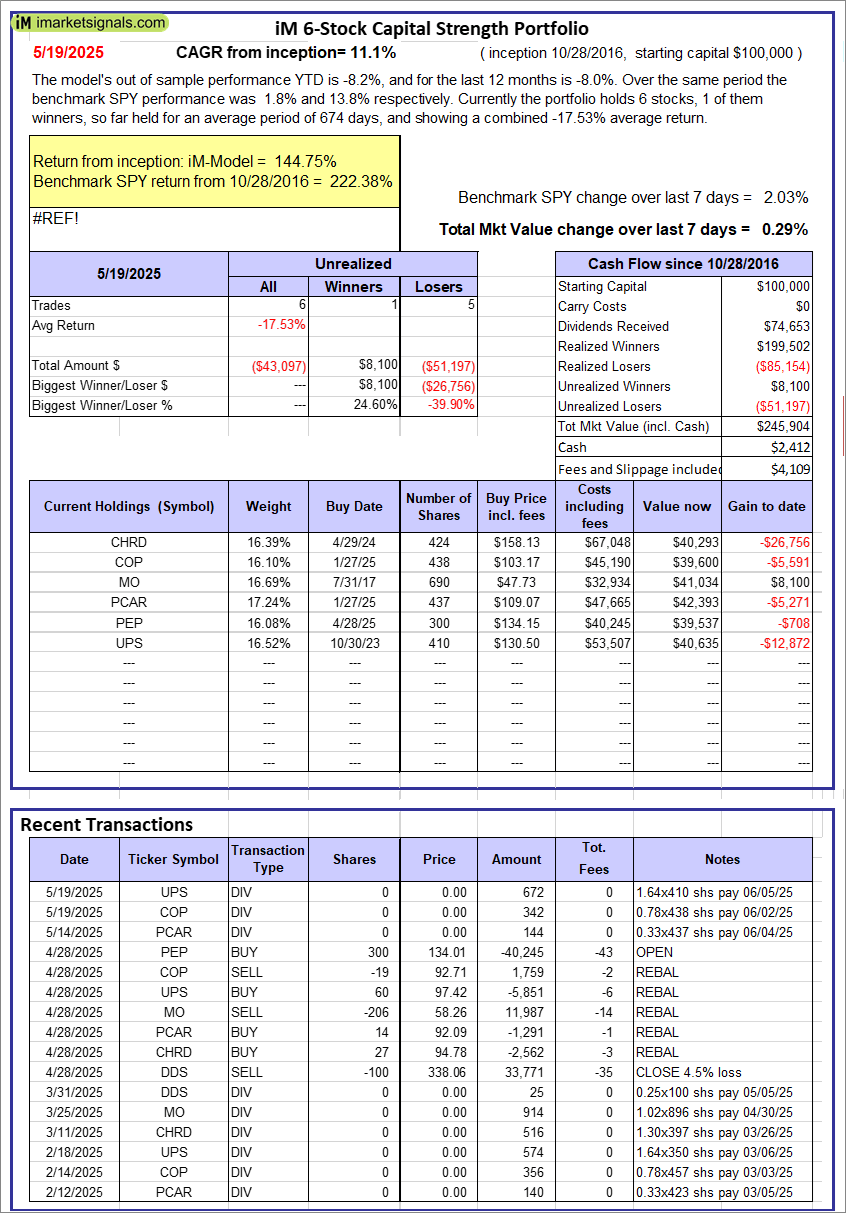 |
iM 6-Stock Capital Strength Portfolio: The model’s out of sample performance YTD is -8.2%, and for the last 12 months is -8.0%. Over the same period the benchmark SPY performance was 1.8% and 13.8% respectively. Over the previous week the market value of the iM 6-Stock Capital Strength Portfolio gained 0.29% at a time when SPY gained 2.03%. A starting capital of $100,000 at inception on 10/28/2016 would have grown to $245,904 which includes $2,412 cash and excludes $4,109 spent on fees and slippage. |
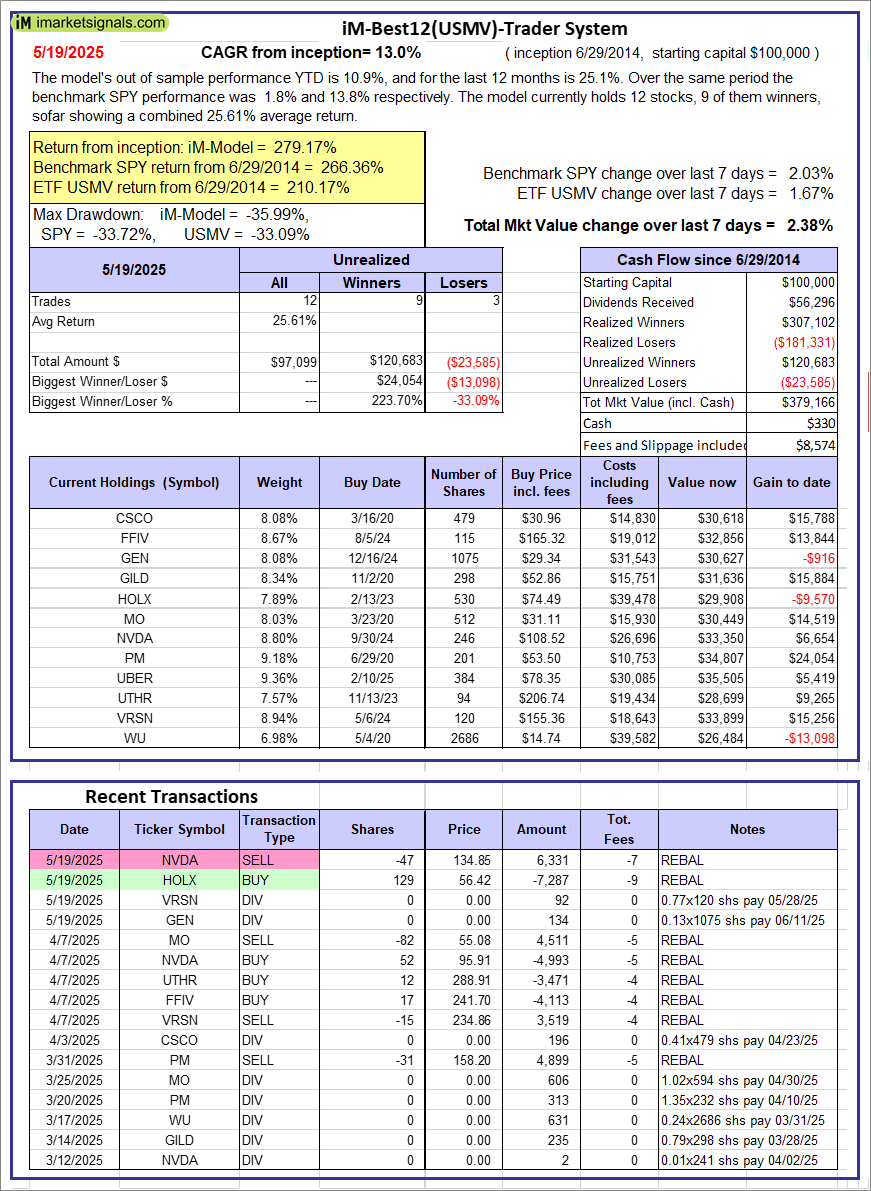 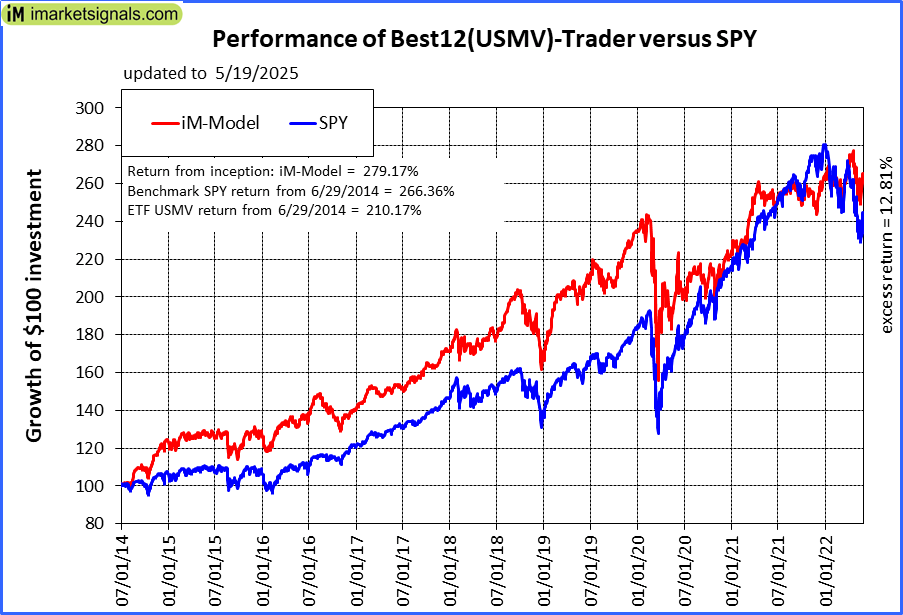 |
iM-Best12(USMV)-Trader: The model’s out of sample performance YTD is 10.9%, and for the last 12 months is 25.1%. Over the same period the benchmark SPY performance was 1.8% and 13.8% respectively. Since inception, on 6/30/2014, the model gained 279.17% while the benchmark SPY gained 266.36% and the ETF USMV gained 210.17% over the same period. Over the previous week the market value of iM-Best12(USMV)-Trader gained 2.38% at a time when SPY gained 2.03%. A starting capital of $100,000 at inception on 6/30/2014 would have grown to $379,166 which includes $330 cash and excludes $8,574 spent on fees and slippage. |
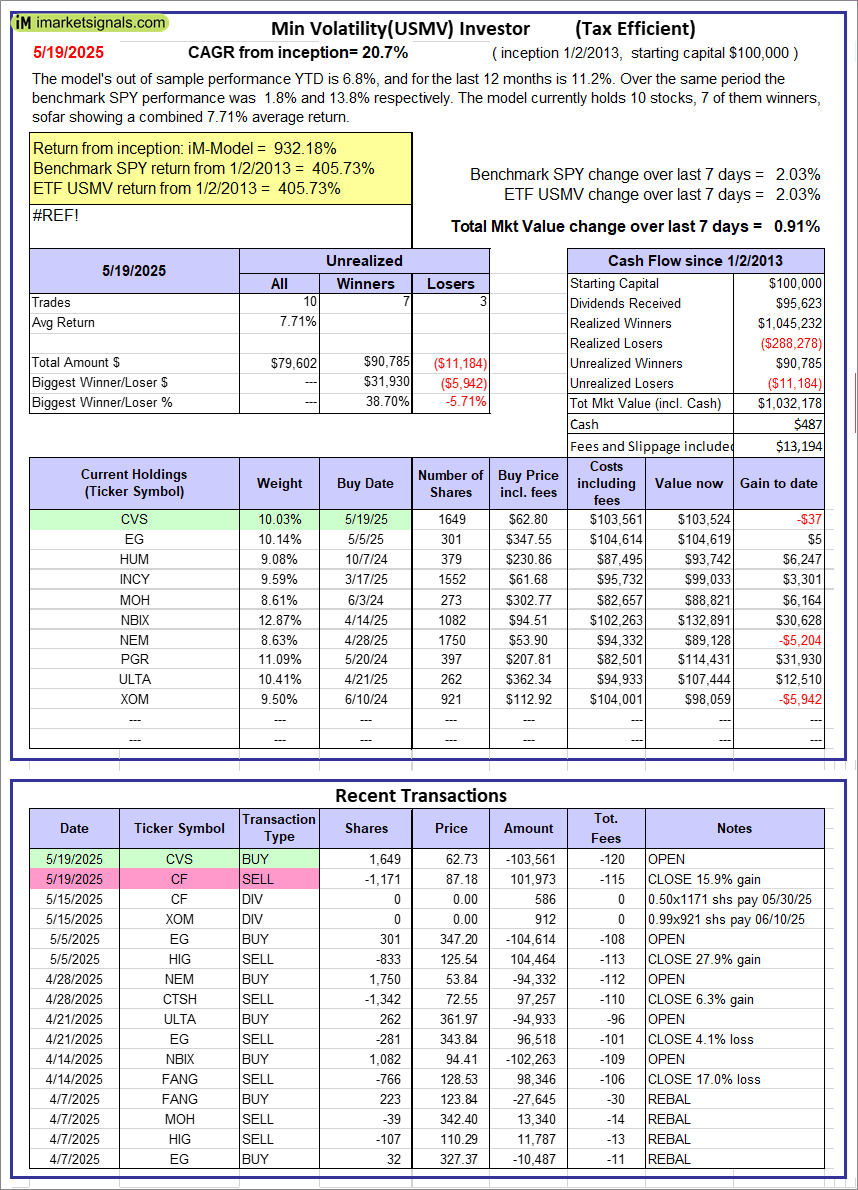 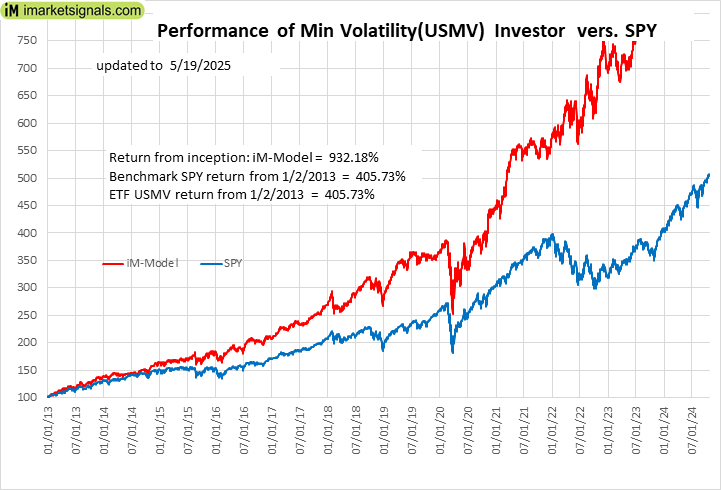 |
iM-Min Volatility(USMV) Investor (Tax Efficient): The model’s out of sample performance YTD is 6.8%, and for the last 12 months is 11.2%. Over the same period the benchmark SPY performance was 1.8% and 13.8% respectively. Since inception, on 1/3/2013, the model gained 932.18% while the benchmark SPY gained 405.73% and the ETF USMV gained 405.73% over the same period. Over the previous week the market value of iM-Best12(USMV)Q1 gained 0.91% at a time when SPY gained 2.03%. A starting capital of $100,000 at inception on 1/3/2013 would have grown to $1,032,178 which includes $487 cash and excludes $13,194 spent on fees and slippage. |
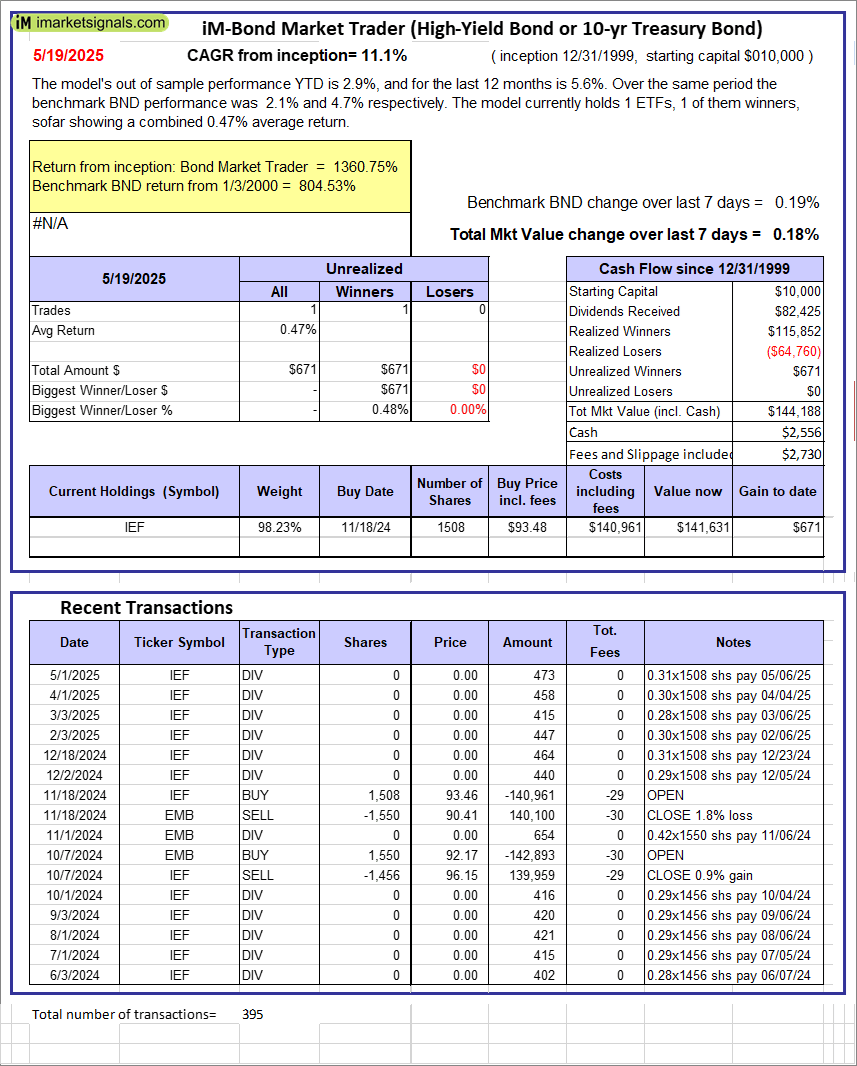 |
iM-Bond Market Trader (High-Yield Bond or 10-yr Treasury Bond): The model’s out of sample performance YTD is 2.9%, and for the last 12 months is 5.6%. Over the same period the benchmark BND performance was 2.1% and 4.7% respectively. Over the previous week the market value of the iM-Bond Market Trader (High-Yield Bond or 10-yr Treasury Bond) gained 0.18% at a time when BND gained 0.19%. A starting capital of $10,000 at inception on 1/3/2000 would have grown to $144,188 which includes $2,556 cash and excludes $2,730 spent on fees and slippage. |
|
|
iM-ModSum/YieldCurve Timer: The model’s out of sample performance YTD is 12.5%, and for the last 12 months is 23.5%. Over the same period the benchmark SPY performance was 1.8% and 13.8% respectively. Over the previous week the market value of iM-PortSum/YieldCurve Timer gained 0.18% at a time when SPY gained 2.03%. A starting capital of $100,000 at inception on 1/1/2016 would have grown to $361,119 which includes -$98 cash and excludes $1,974 spent on fees and slippage. |
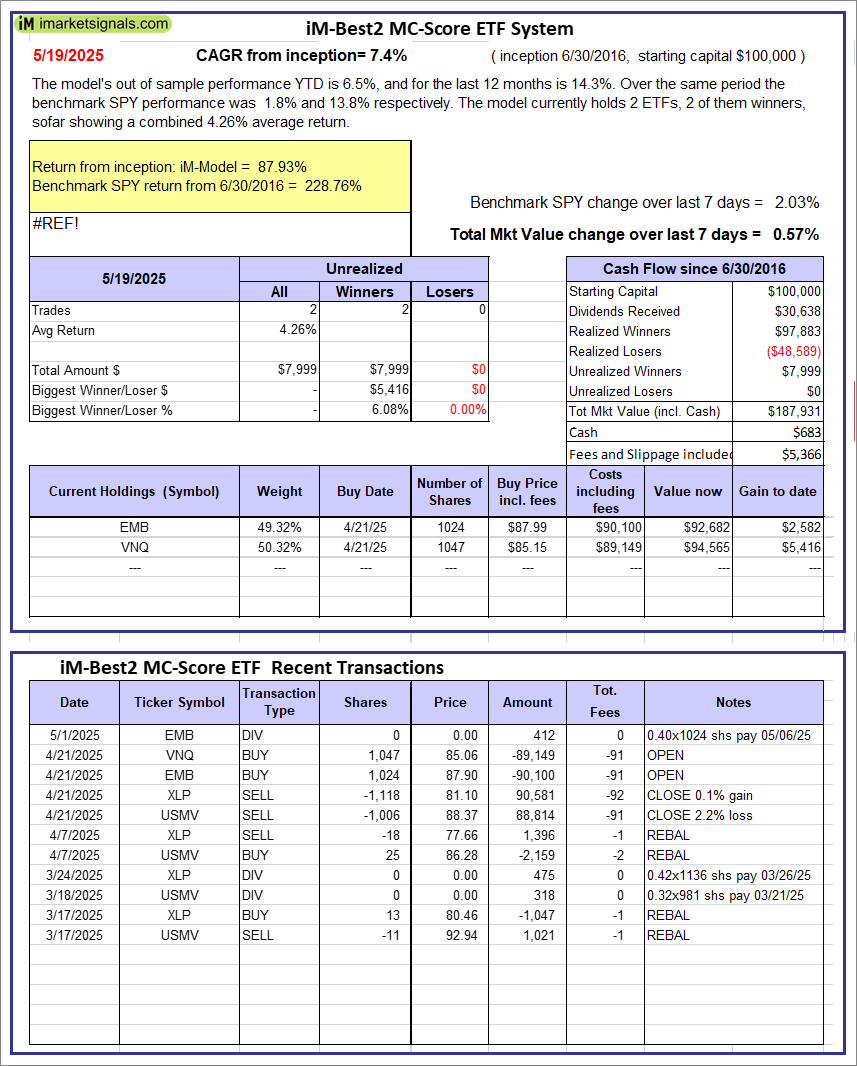 |
iM-Best2 MC-Score ETF System: The model’s out of sample performance YTD is 6.5%, and for the last 12 months is 14.3%. Over the same period the benchmark SPY performance was 1.8% and 13.8% respectively. Over the previous week the market value of the iM-Best2 MC-Score ETF System gained 0.57% at a time when SPY gained 2.03%. A starting capital of $100,000 at inception on 6/30/2016 would have grown to $187,931 which includes $683 cash and excludes $5,366 spent on fees and slippage. |
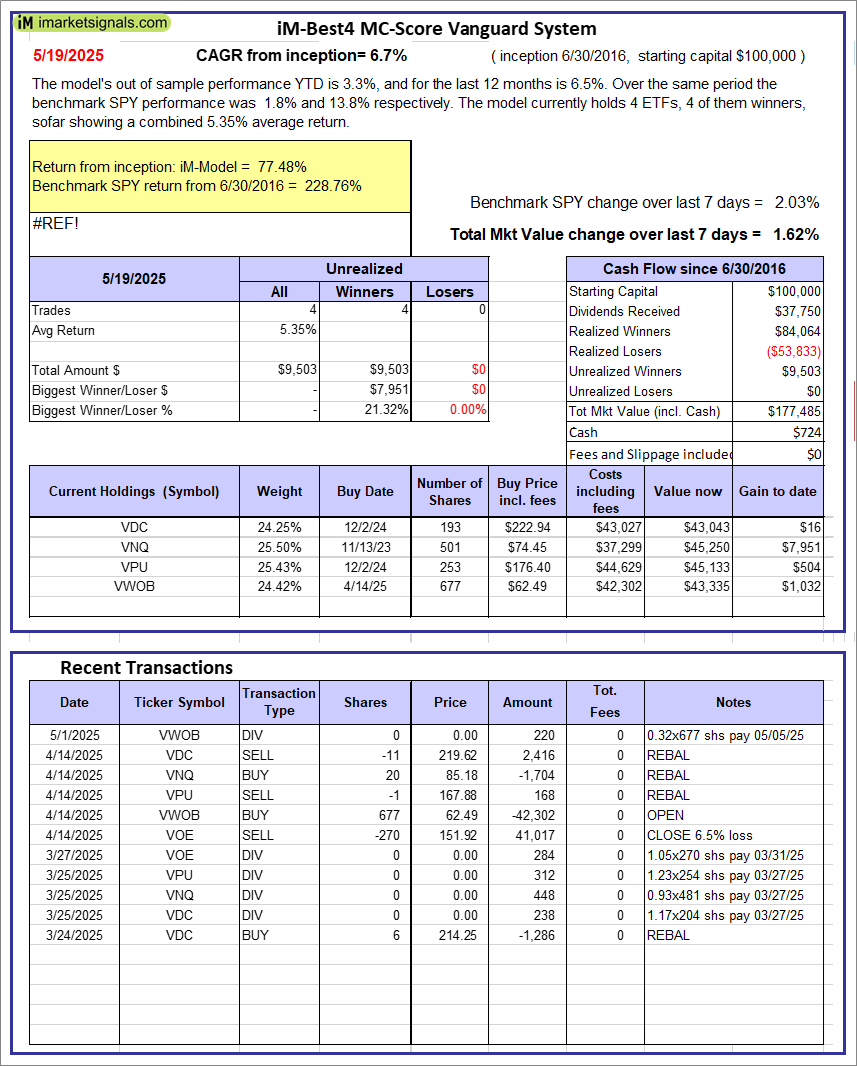 |
iM-Best4 MC-Score Vanguard System: The model’s out of sample performance YTD is 3.3%, and for the last 12 months is 6.5%. Over the same period the benchmark SPY performance was 1.8% and 13.8% respectively. Over the previous week the market value of the iM-Best4 MC-Score Vanguard System gained 1.62% at a time when SPY gained 2.03%. A starting capital of $100,000 at inception on 6/30/2016 would have grown to $177,485 which includes $724 cash and excludes $00 spent on fees and slippage. |
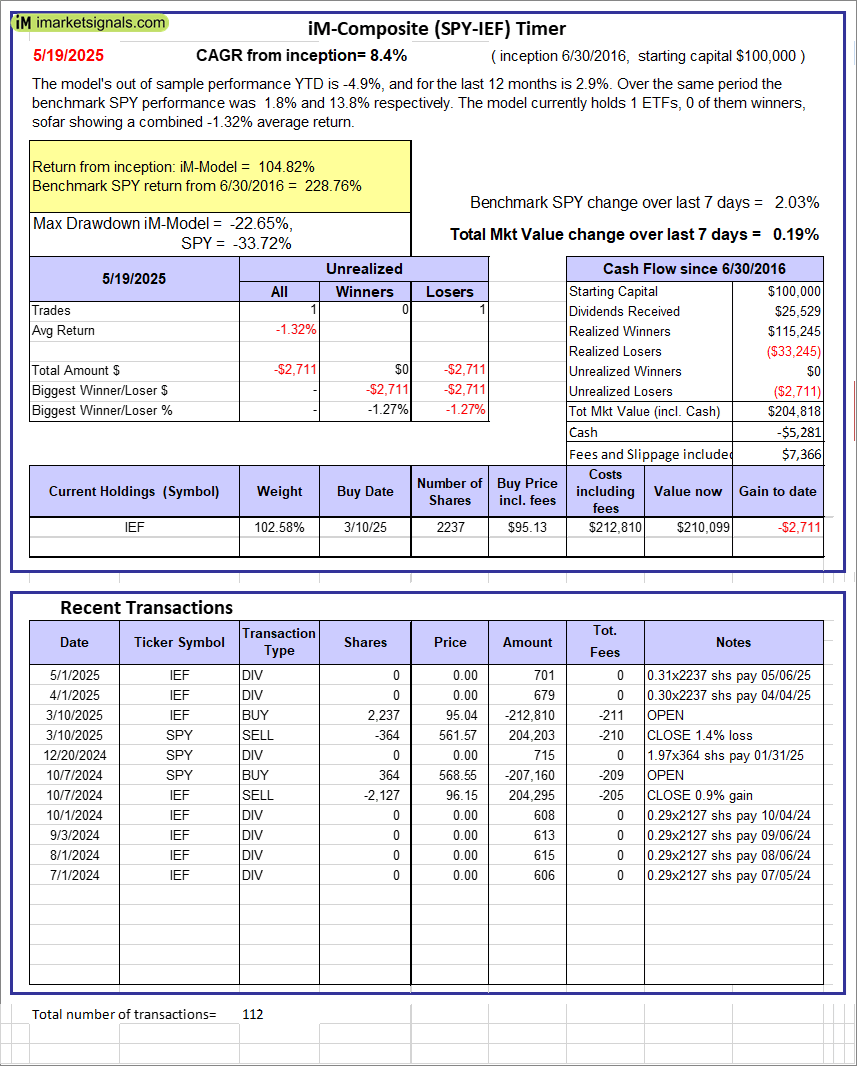 |
iM-Composite (SPY-IEF) Timer: The model’s out of sample performance YTD is -4.9%, and for the last 12 months is 2.9%. Over the same period the benchmark SPY performance was 1.8% and 13.8% respectively. Over the previous week the market value of the iM-Composite (SPY-IEF) Timer gained 0.19% at a time when SPY gained 2.03%. A starting capital of $100,000 at inception on 6/30/2016 would have grown to $204,818 which includes -$5,281 cash and excludes $7,366 spent on fees and slippage. |
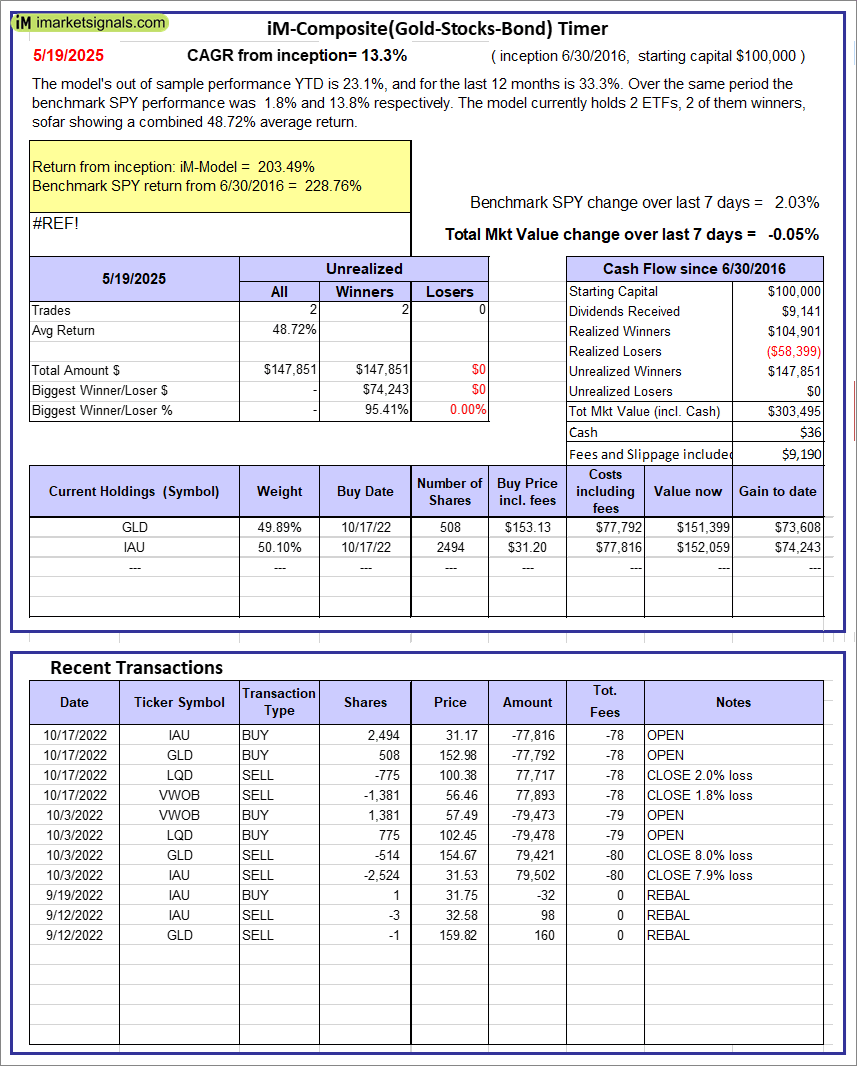 |
iM-Composite(Gold-Stocks-Bond) Timer: The model’s out of sample performance YTD is 23.1%, and for the last 12 months is 33.3%. Over the same period the benchmark SPY performance was 1.8% and 13.8% respectively. Over the previous week the market value of the iM-Composite(Gold-Stocks-Bond) Timer gained -0.05% at a time when SPY gained 2.03%. A starting capital of $100,000 at inception on 6/30/2016 would have grown to $303,495 which includes $36 cash and excludes $9,190 spent on fees and slippage. |
iM-Best Reports – 5/20/2025
Posted in pmp SPY-SH
Leave a Reply
You must be logged in to post a comment.