
  |
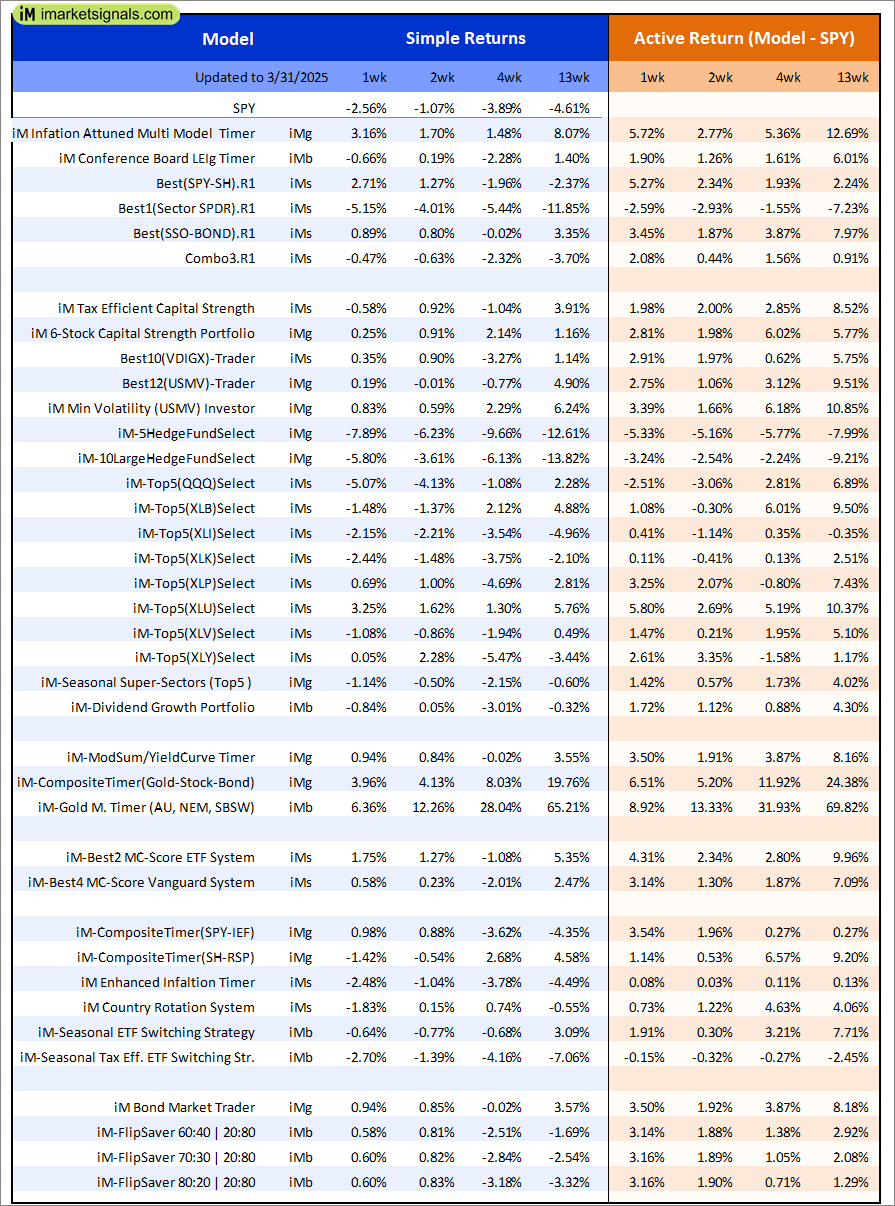
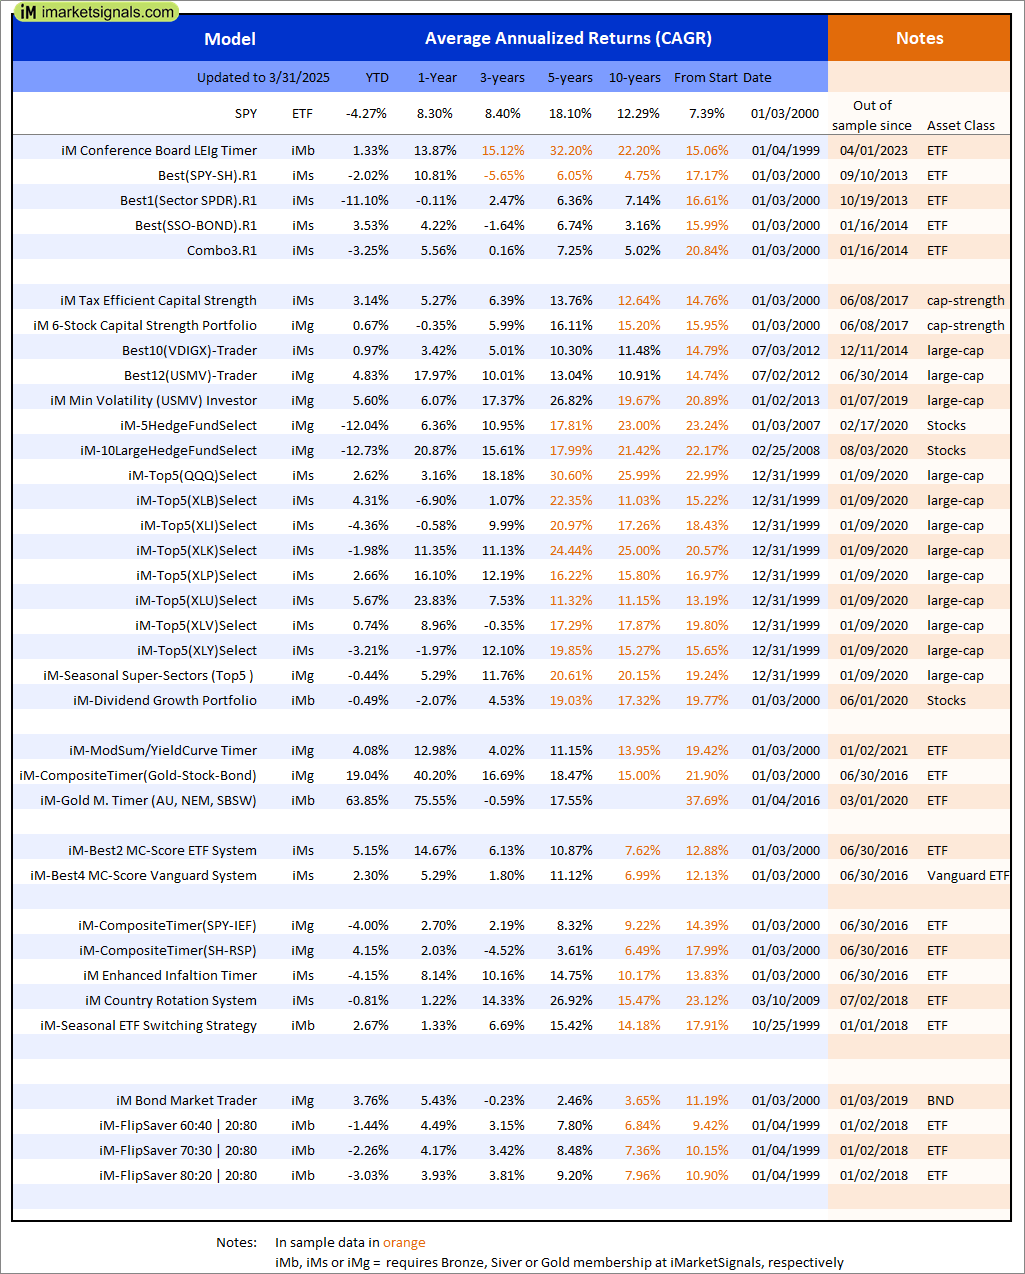
Out of sample performance summary of our models for the past 1, 2, 4 and 13 week periods. The active active return indicates how the models over- or underperformed the benchmark ETF SPY. Also the YTD, and the 1-, 3-, 5- and 10-year annualized returns are shown in the second table |
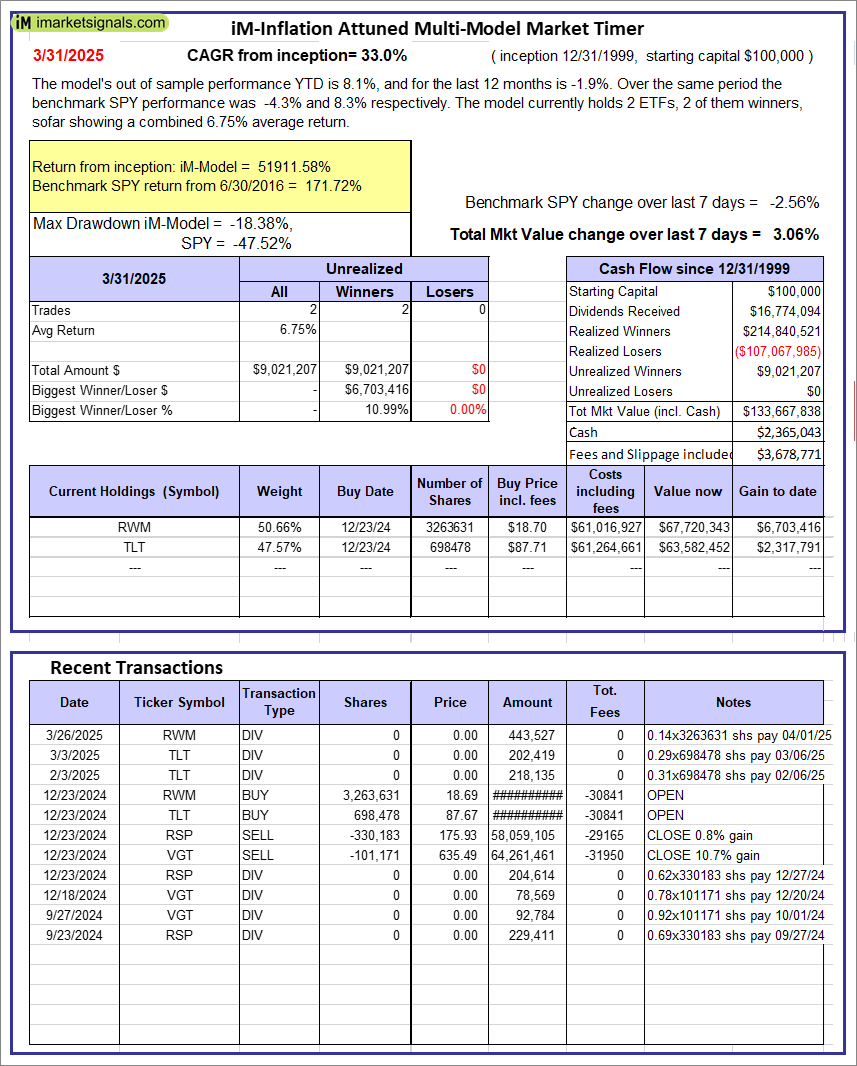 |
iM-Inflation Attuned Multi-Model Market Timer: The model’s out of sample performance YTD is 8.1%, and for the last 12 months is -1.9%. Over the same period the benchmark SPY performance was -4.3% and 8.3% respectively. Over the previous week the market value of the iM-Inflation Attuned Multi-Model Market Timer gained 3.06% at a time when SPY gained -2.56%. A starting capital of $100,000 at inception on 3/24/2017 would have grown to $133,667,838 which includes $2,365,043 cash and excludes $3,678,771 spent on fees and slippage. |
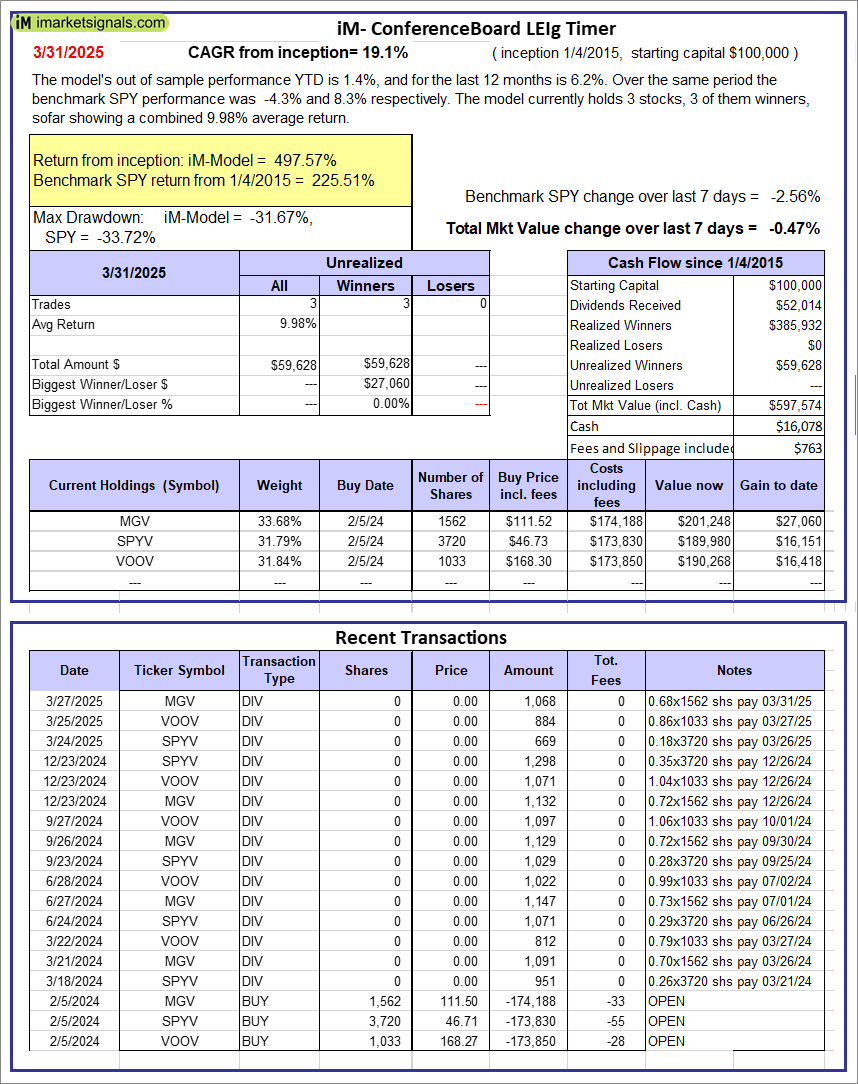 |
iM-Conference Board LEIg Timer: The model’s performance YTD is 14.3%, and for the last 12 months is 7.3%. Over the same period the benchmark SPY performance was 20.1% and 9.4% respectively. Over the previous week the market value of the iM-Conference Board LEIg Timer gained -0.47% at a time when SPY gained -2.56%. A starting capital of $100,000 at inception on 4/5/2017 would have grown to $597,574 which includes $16,078 cash and excludes $763 spent on fees and slippage. |
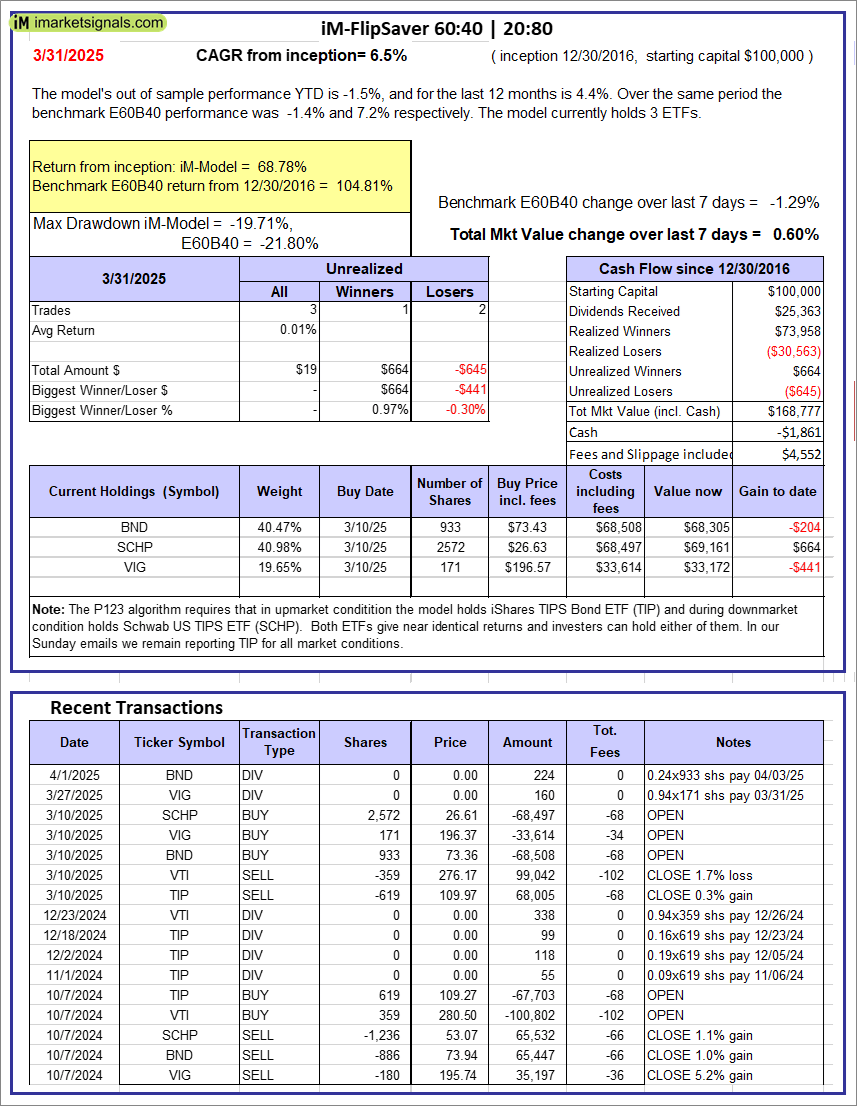 |
iM-FlipSaver 60:40 | 20:80 – 2017: The model’s out of sample performance YTD is -1.5%, and for the last 12 months is 4.4%. Over the same period the benchmark E60B40 performance was -1.4% and 7.2% respectively. Over the previous week the market value of iM-FlipSaver 80:20 | 20:80 gained 0.60% at a time when SPY gained -1.29%. A starting capital of $100,000 at inception on 7/16/2015 would have grown to $168,777 which includes -$1,861 cash and excludes $4,552 spent on fees and slippage. |
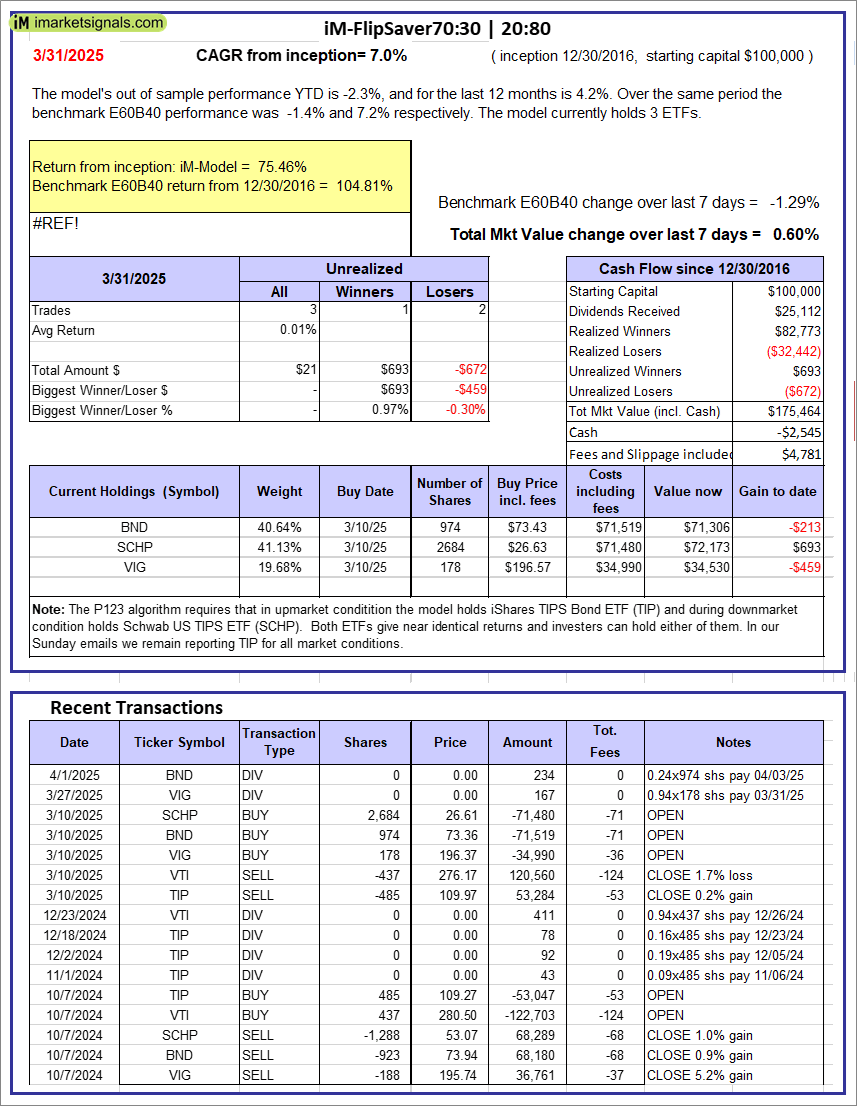 |
iM-FlipSaver 70:30 | 20:80 – 2017: The model’s out of sample performance YTD is -2.3%, and for the last 12 months is 4.2%. Over the same period the benchmark E60B40 performance was -1.4% and 7.2% respectively. Over the previous week the market value of iM-FlipSaver 70:30 | 20:80 gained 0.60% at a time when SPY gained -1.29%. A starting capital of $100,000 at inception on 7/15/2015 would have grown to $175,464 which includes -$2,545 cash and excludes $4,781 spent on fees and slippage. |
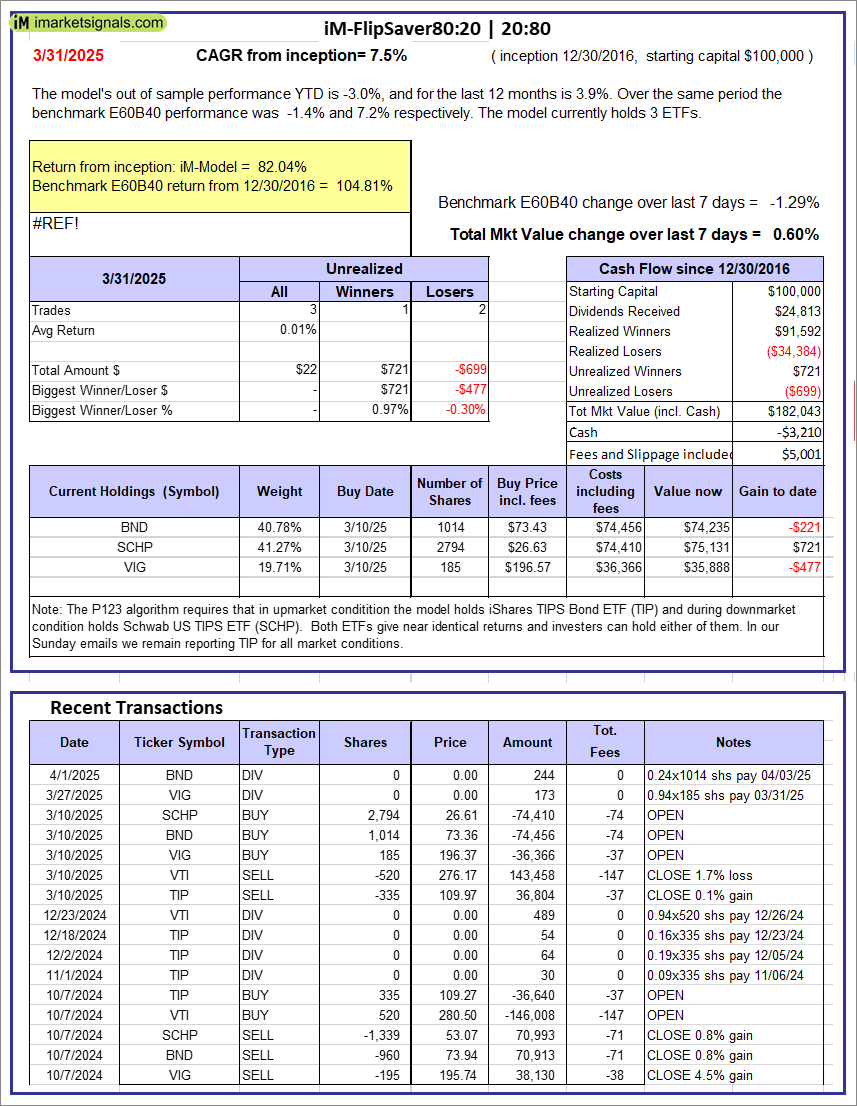 |
iM-FlipSaver 80:20 | 20:80 – 2017: The model’s out of sample performance YTD is -3.0%, and for the last 12 months is 3.9%. Over the same period the benchmark E60B40 performance was -1.4% and 7.2% respectively. Over the previous week the market value of iM-FlipSaver 80:20 | 20:80 gained 0.60% at a time when SPY gained -1.29%. A starting capital of $100,000 at inception on 1/2/2017 would have grown to $182,043 which includes -$3,210 cash and excludes $5,001 spent on fees and slippage. |
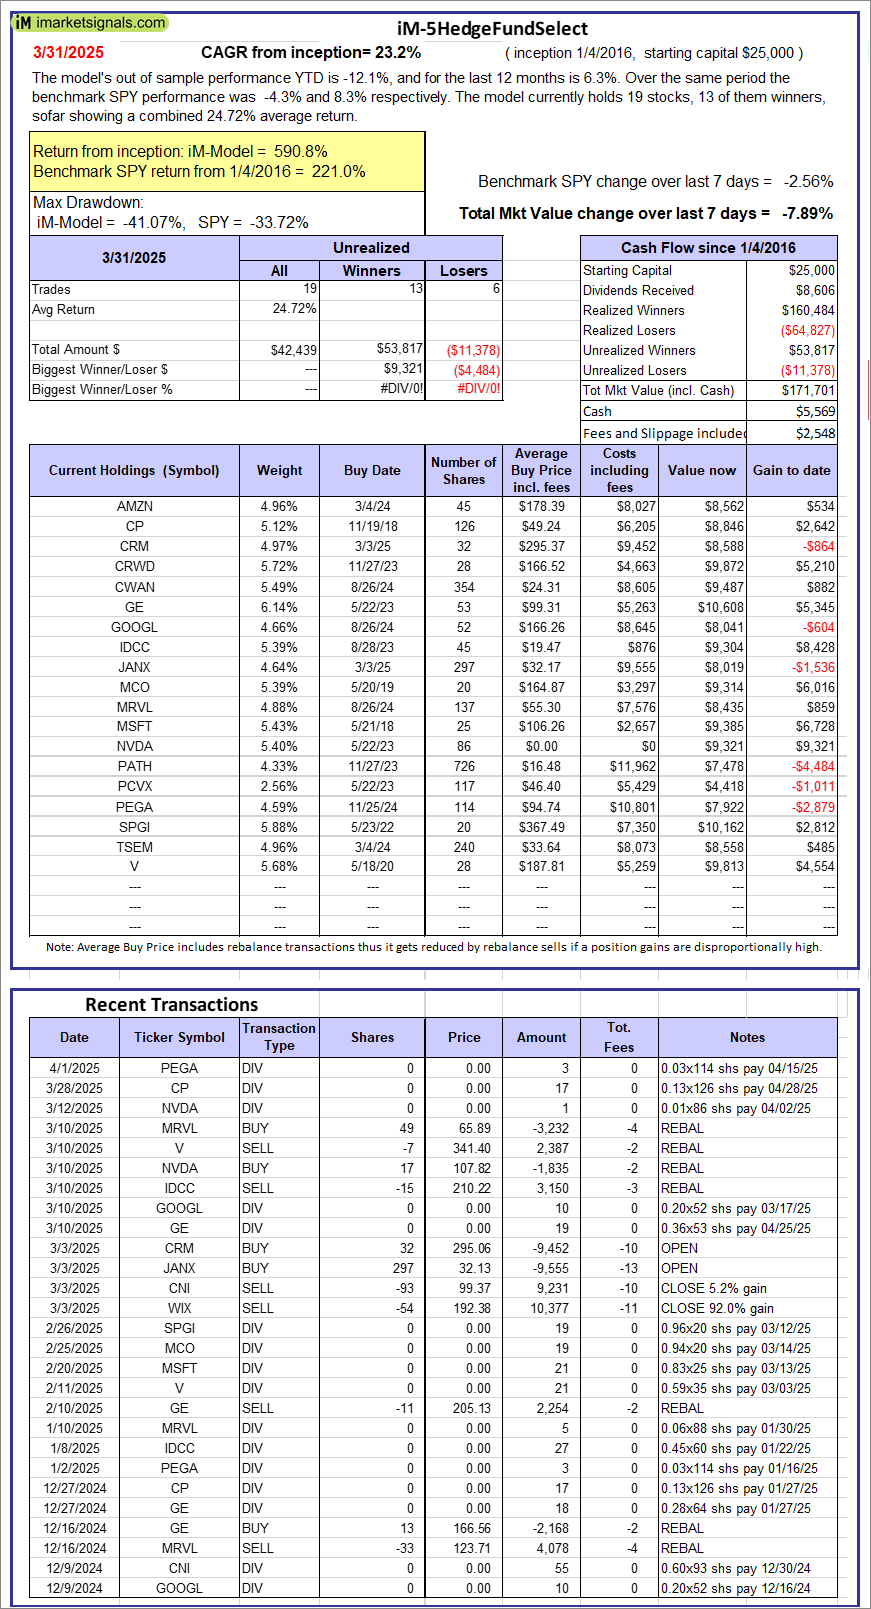 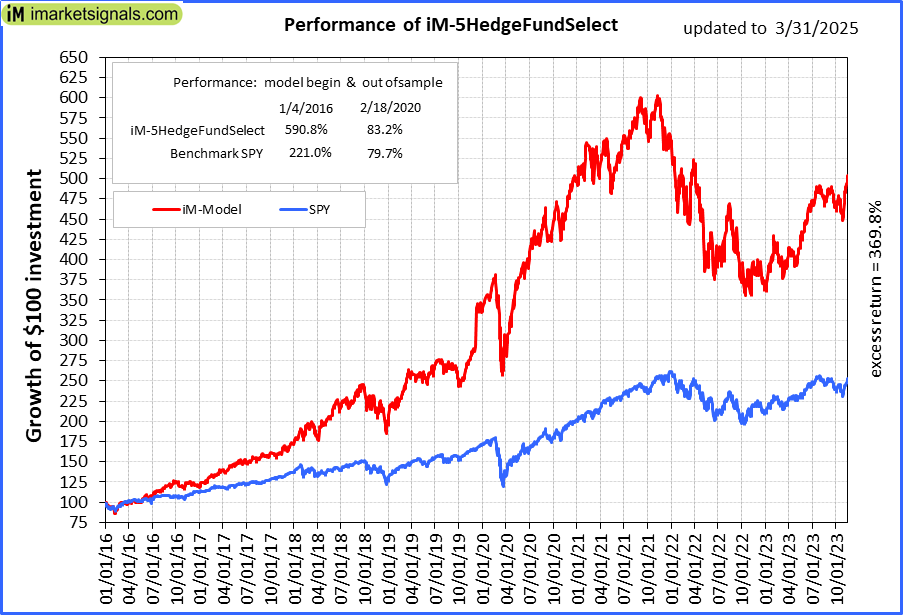 |
iM-5HedgeFundSelect: Since inception, on 1/5/2016, the model gained 590.76% while the benchmark SPY gained 220.95% over the same period. Over the previous week the market value of iM-5HedgeFundSelect gained -7.89% at a time when SPY gained -2.56%. A starting capital of $25,000 at inception on 1/5/2016 would have grown to $171,701 which includes $5,569 cash and excludes $2,548 spent on fees and slippage. |
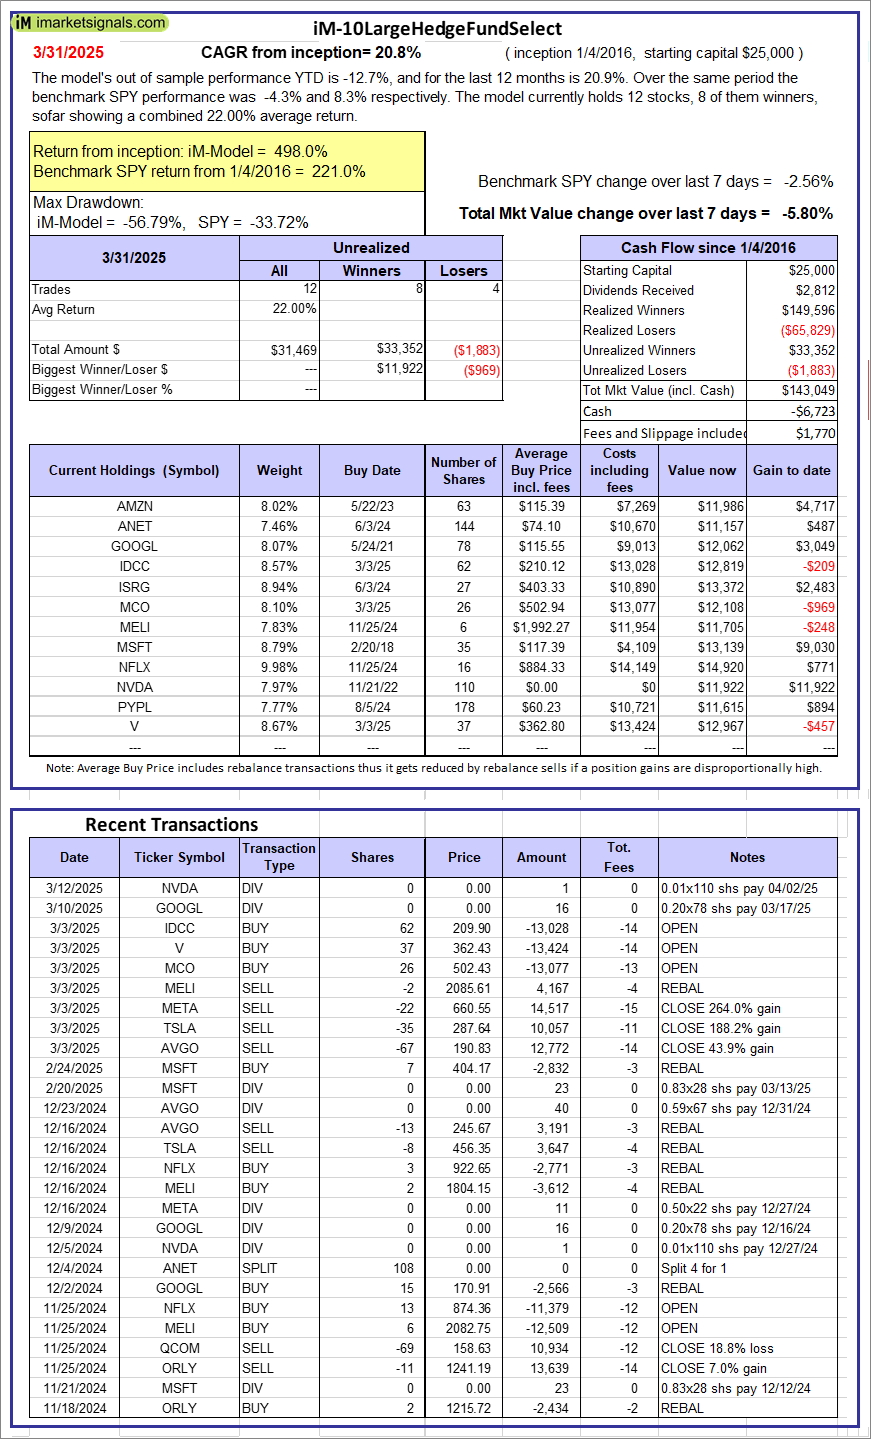 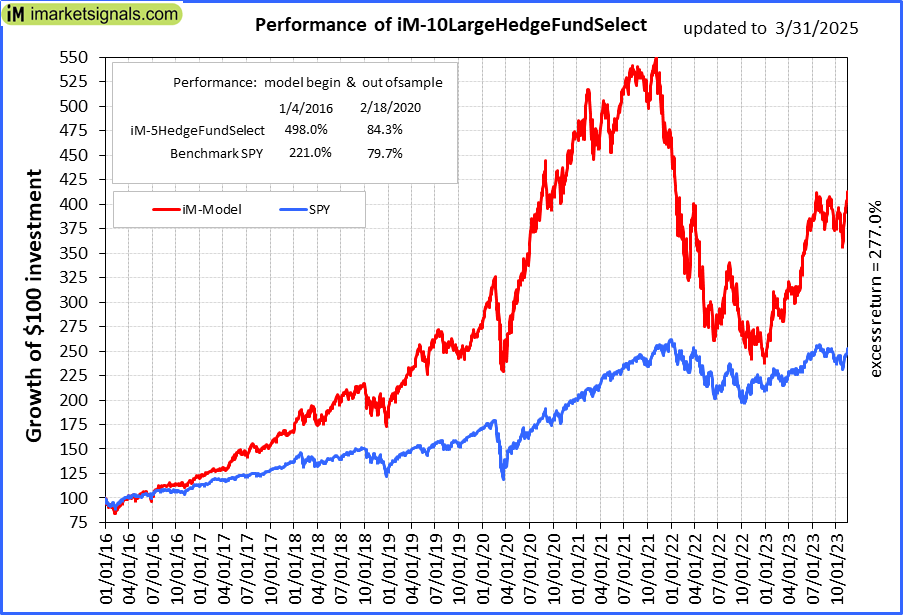 |
iM-10LargeHedgeFundSelect: Since inception, on 1/5/2016, the model gained 497.99% while the benchmark SPY gained 220.95% over the same period. Over the previous week the market value of iM-10LargeHedgeFundSelect gained -5.80% at a time when SPY gained -2.56%. A starting capital of $25,000 at inception on 1/5/2016 would have grown to $143,049 which includes -$6,723 cash and excludes $1,770 spent on fees and slippage. |
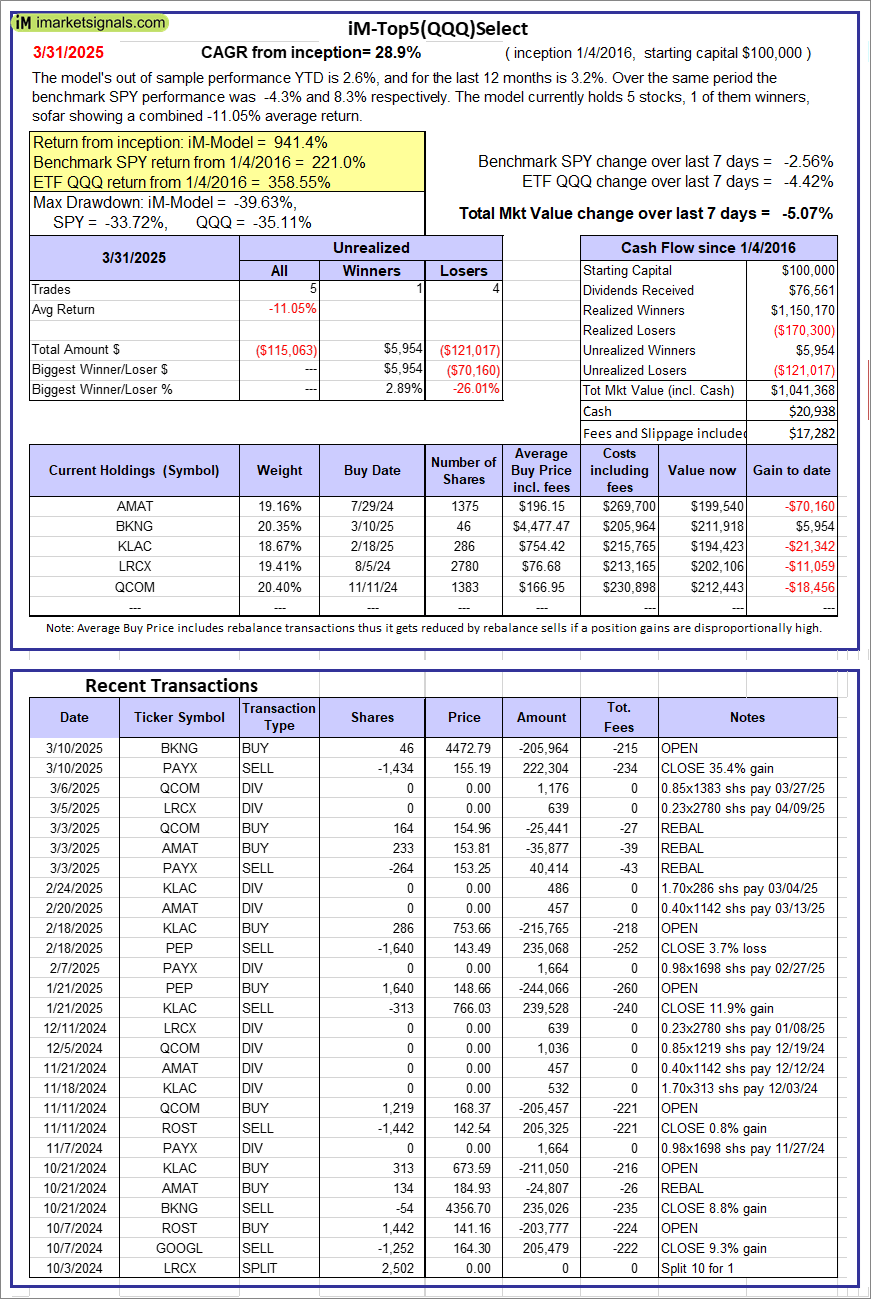 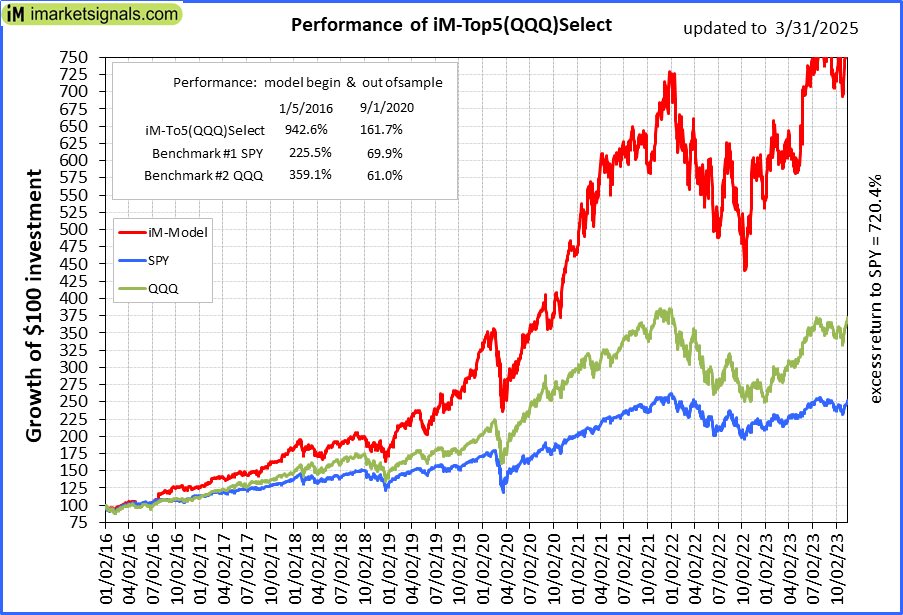 |
iM-Top5(QQQ)Select: Since inception, on 1/5/2016, the model gained 941.37% while the benchmark SPY gained 220.95% over the same period. Over the previous week the market value of iM-Top5(QQQ)Select gained -5.07% at a time when SPY gained -2.56%. A starting capital of $100,000 at inception on 1/5/2016 would have grown to $1,041,368 which includes $20,938 cash and excludes $17,282 spent on fees and slippage. |
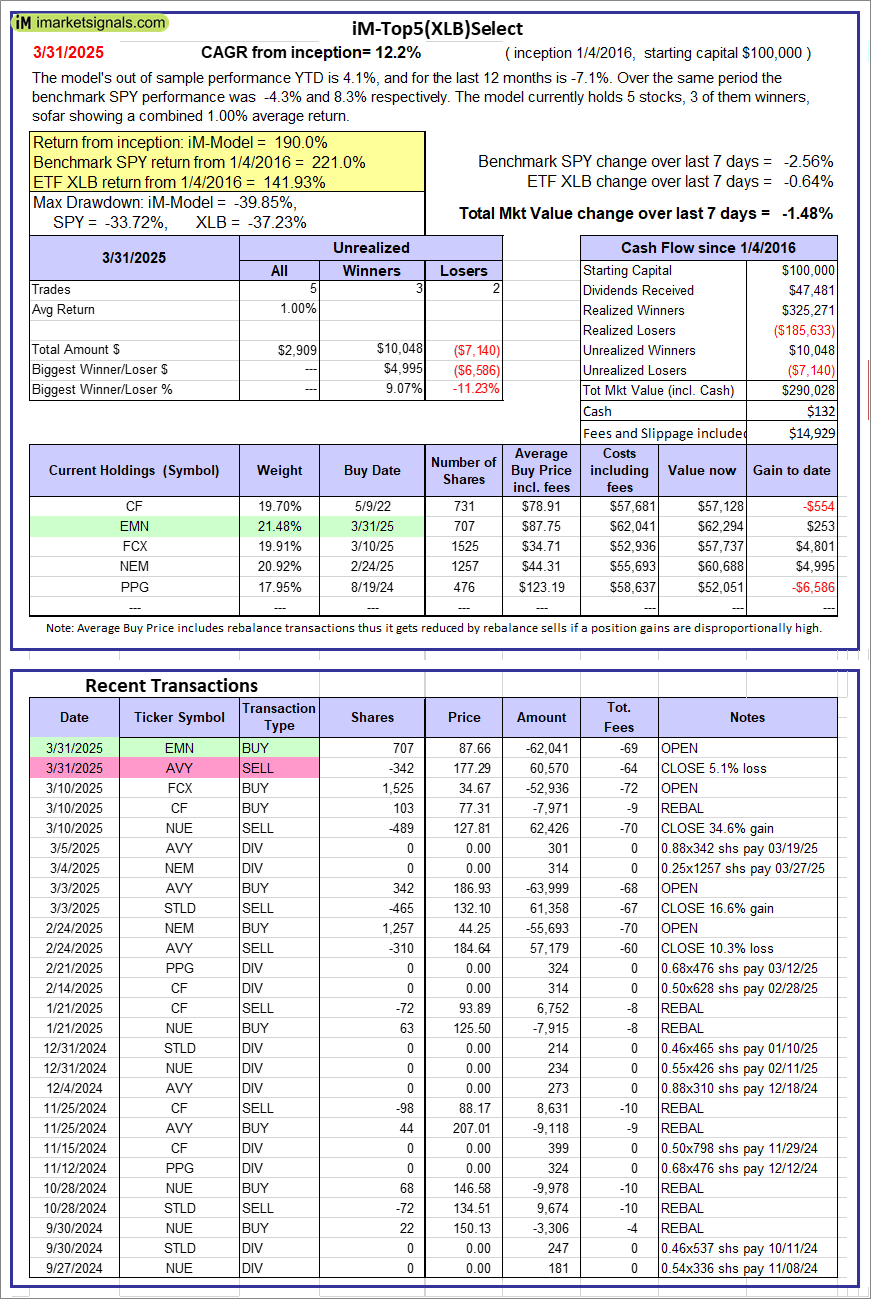 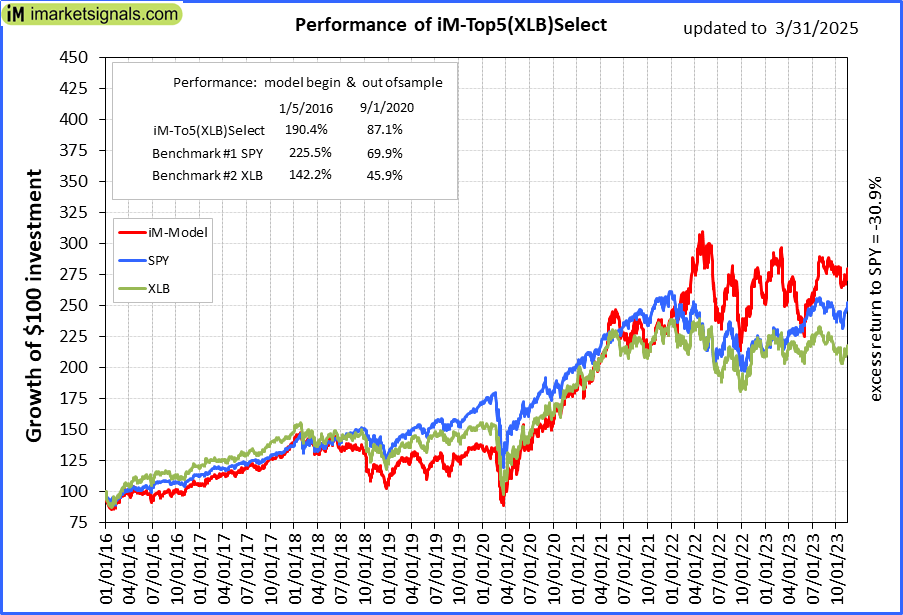 |
iM-Top5(XLB)Select: Since inception, on 1/5/2016, the model gained 190.03% while the benchmark SPY gained 220.95% over the same period. Over the previous week the market value of iM-Top5(XLB)Select gained -1.48% at a time when SPY gained -2.56%. A starting capital of $100,000 at inception on 1/5/2016 would have grown to $290,028 which includes $132 cash and excludes $14,929 spent on fees and slippage. |
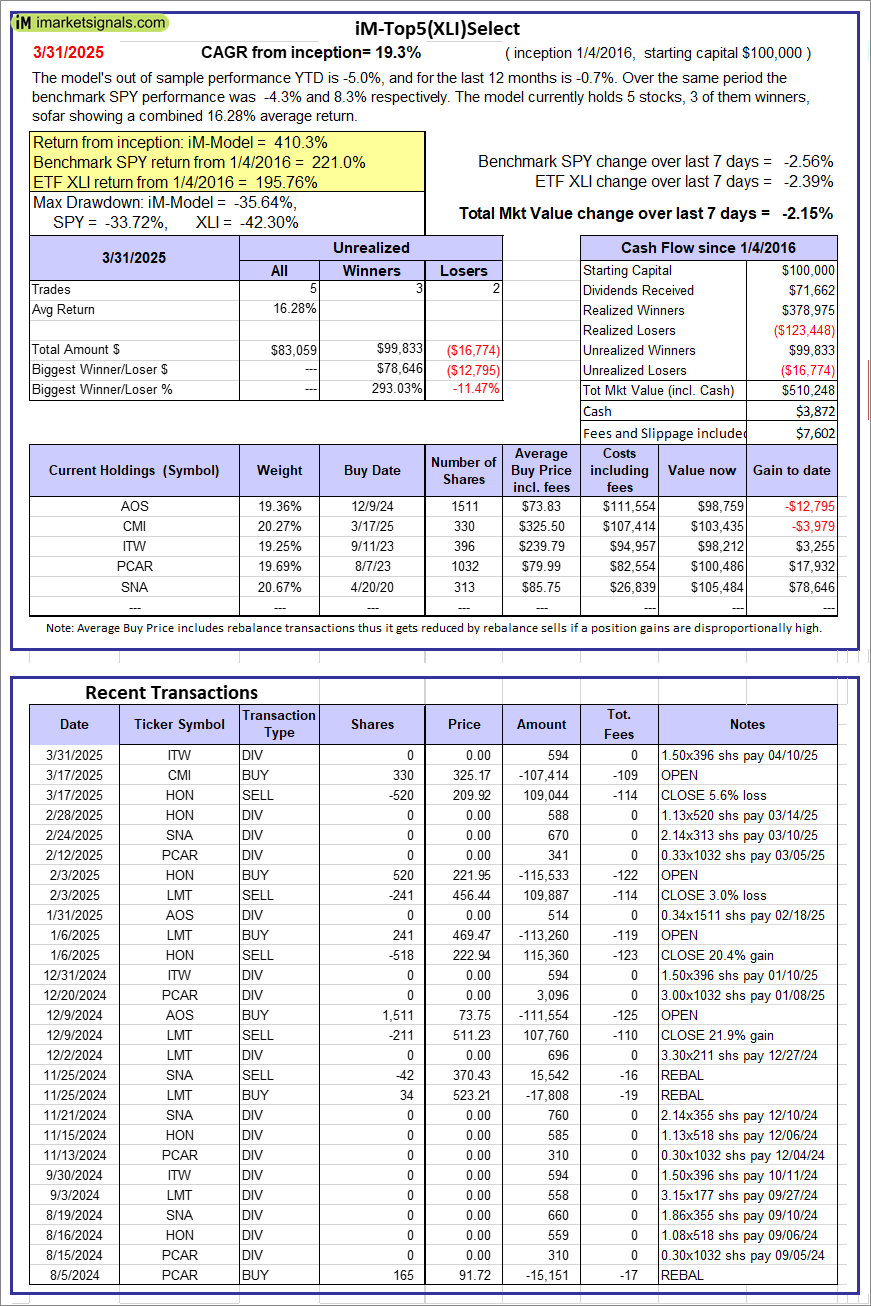 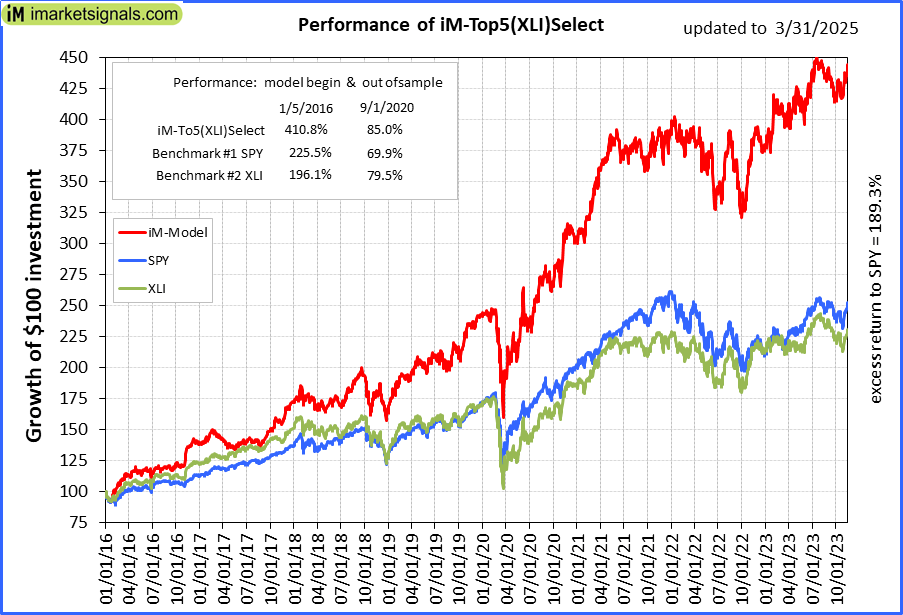 |
iM-Top5(XLI)Select: Since inception, on 1/5/2016, the model gained 410.25% while the benchmark SPY gained 220.95% over the same period. Over the previous week the market value of iM-Top5(XLI)Select gained -2.15% at a time when SPY gained -2.56%. A starting capital of $100,000 at inception on 1/5/2016 would have grown to $510,248 which includes $3,872 cash and excludes $7,602 spent on fees and slippage. |
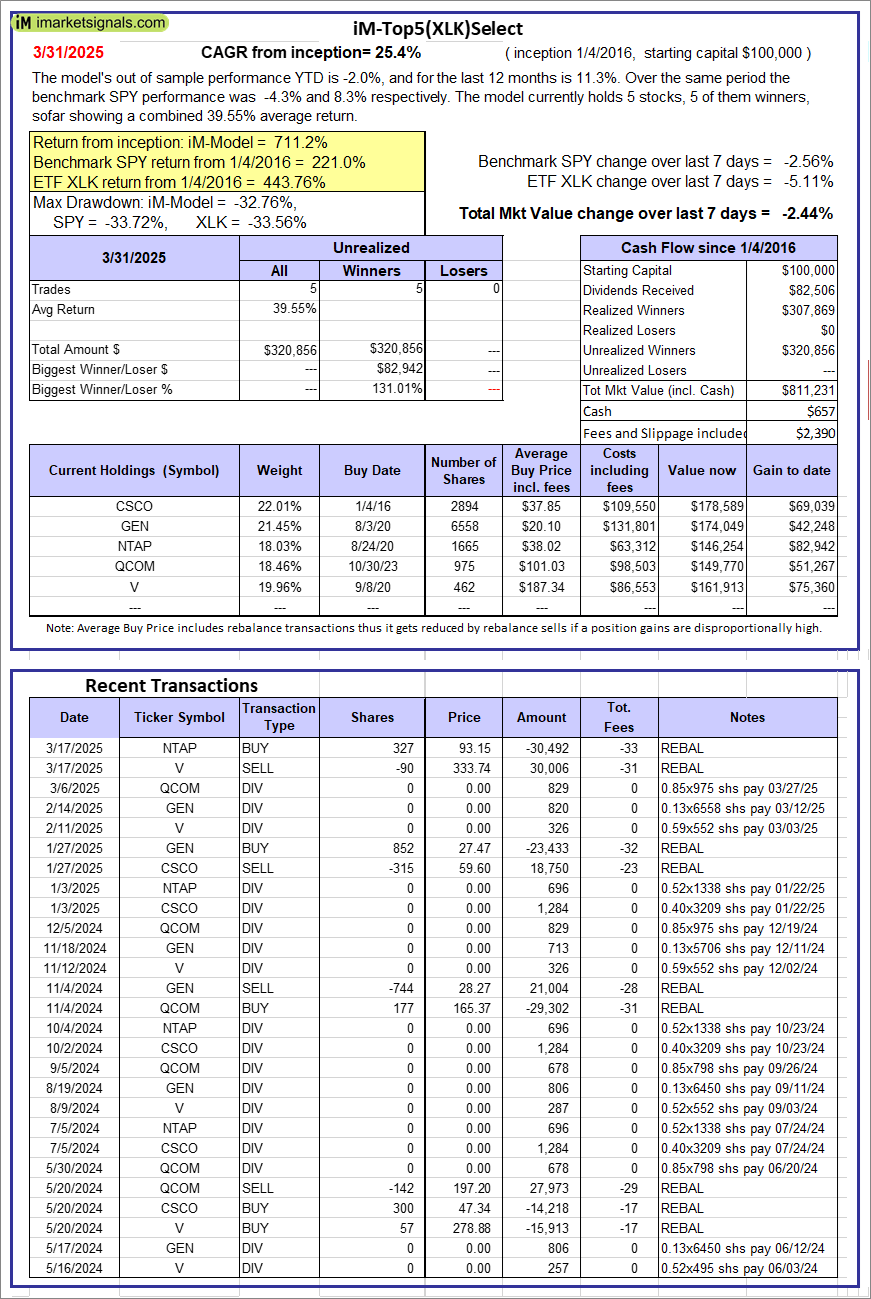 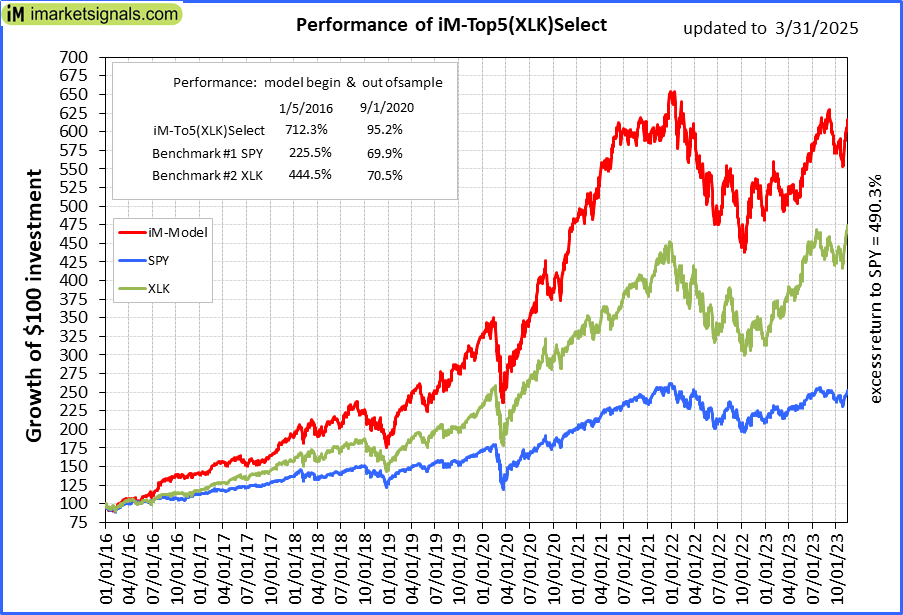 |
iM-Top5(XLK)Select: Since inception, on 1/5/2016, the model gained 711.23% while the benchmark SPY gained 220.95% over the same period. Over the previous week the market value of iM-Top5(XLK)Select gained -2.44% at a time when SPY gained -2.56%. A starting capital of $100,000 at inception on 1/5/2016 would have grown to $811,231 which includes $657 cash and excludes $2,390 spent on fees and slippage. |
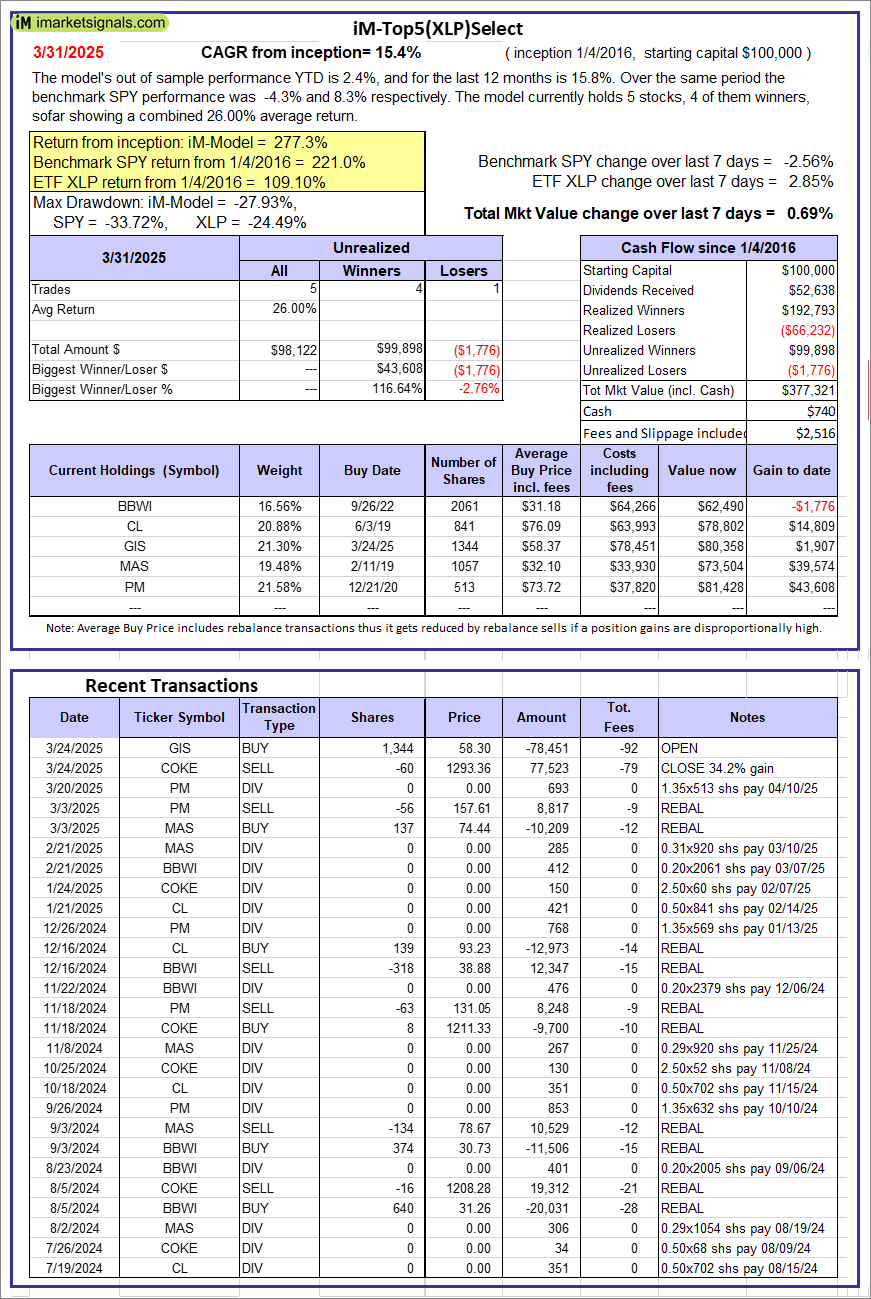 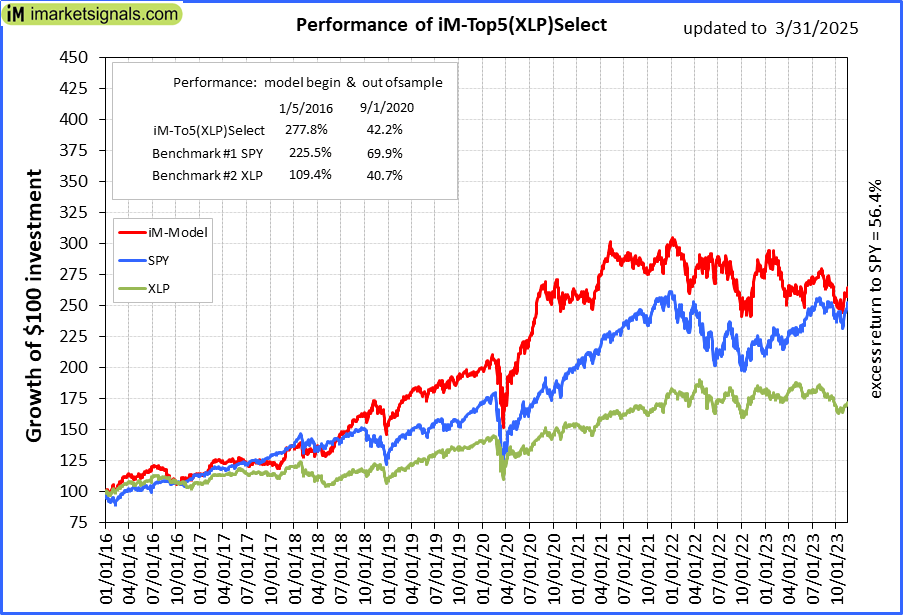 |
iM-Top5(XLP)Select: Since inception, on 1/5/2016, the model gained 277.32% while the benchmark SPY gained 220.95% over the same period. Over the previous week the market value of iM-Top5(XLP)Select gained 0.69% at a time when SPY gained -2.56%. A starting capital of $100,000 at inception on 1/5/2016 would have grown to $377,321 which includes $740 cash and excludes $2,516 spent on fees and slippage. |
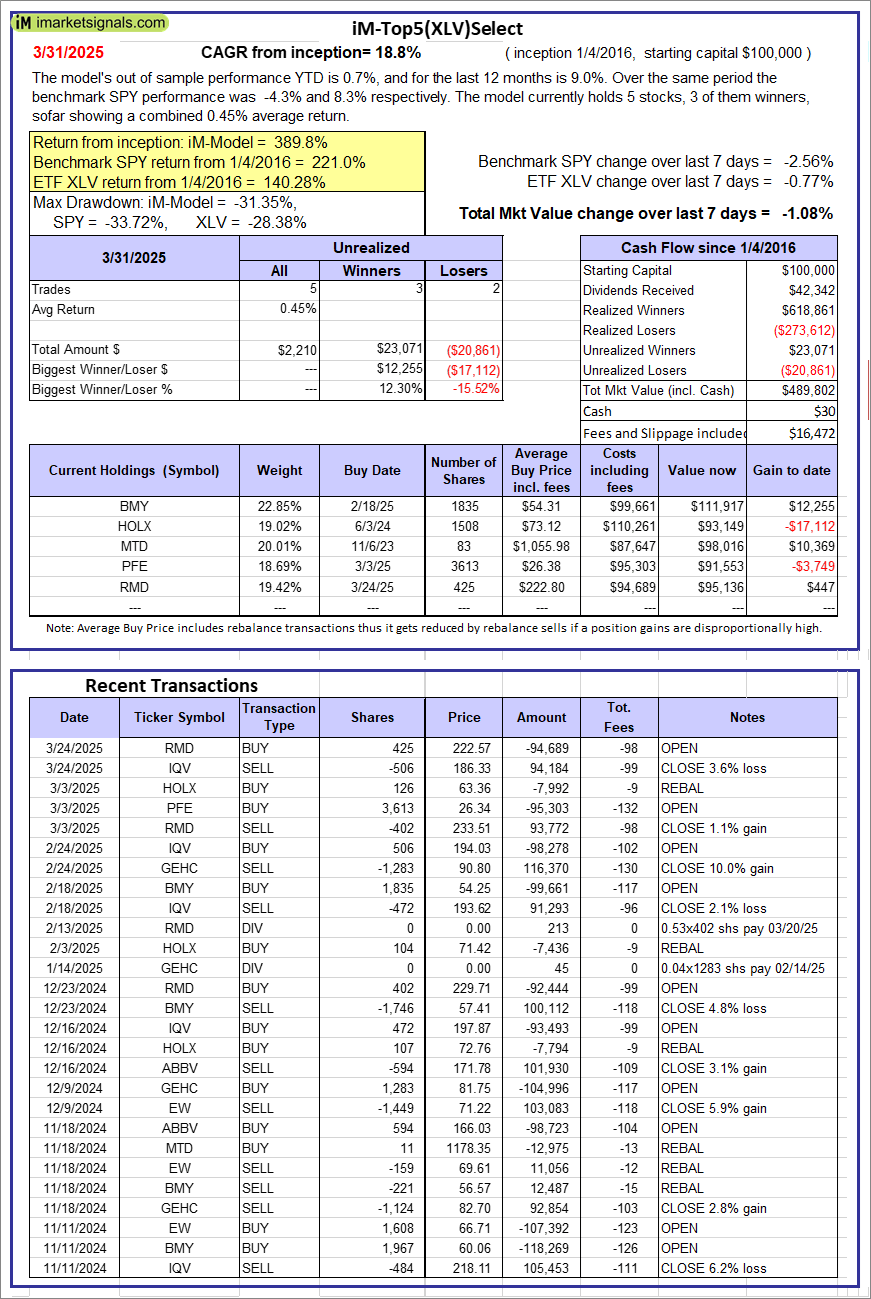 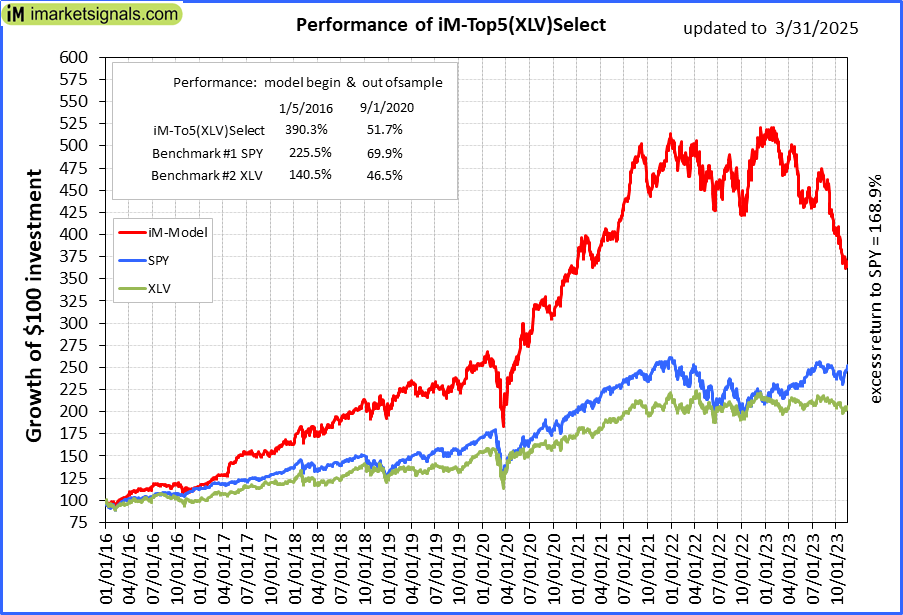 |
iM-Top5(XLV)Select: Since inception, on 1/5/2016, the model gained 389.80% while the benchmark SPY gained 220.95% over the same period. Over the previous week the market value of iM-Top5(XLV)Select gained -1.08% at a time when SPY gained -2.56%. A starting capital of $100,000 at inception on 1/5/2016 would have grown to $489,802 which includes $30 cash and excludes $16,472 spent on fees and slippage. |
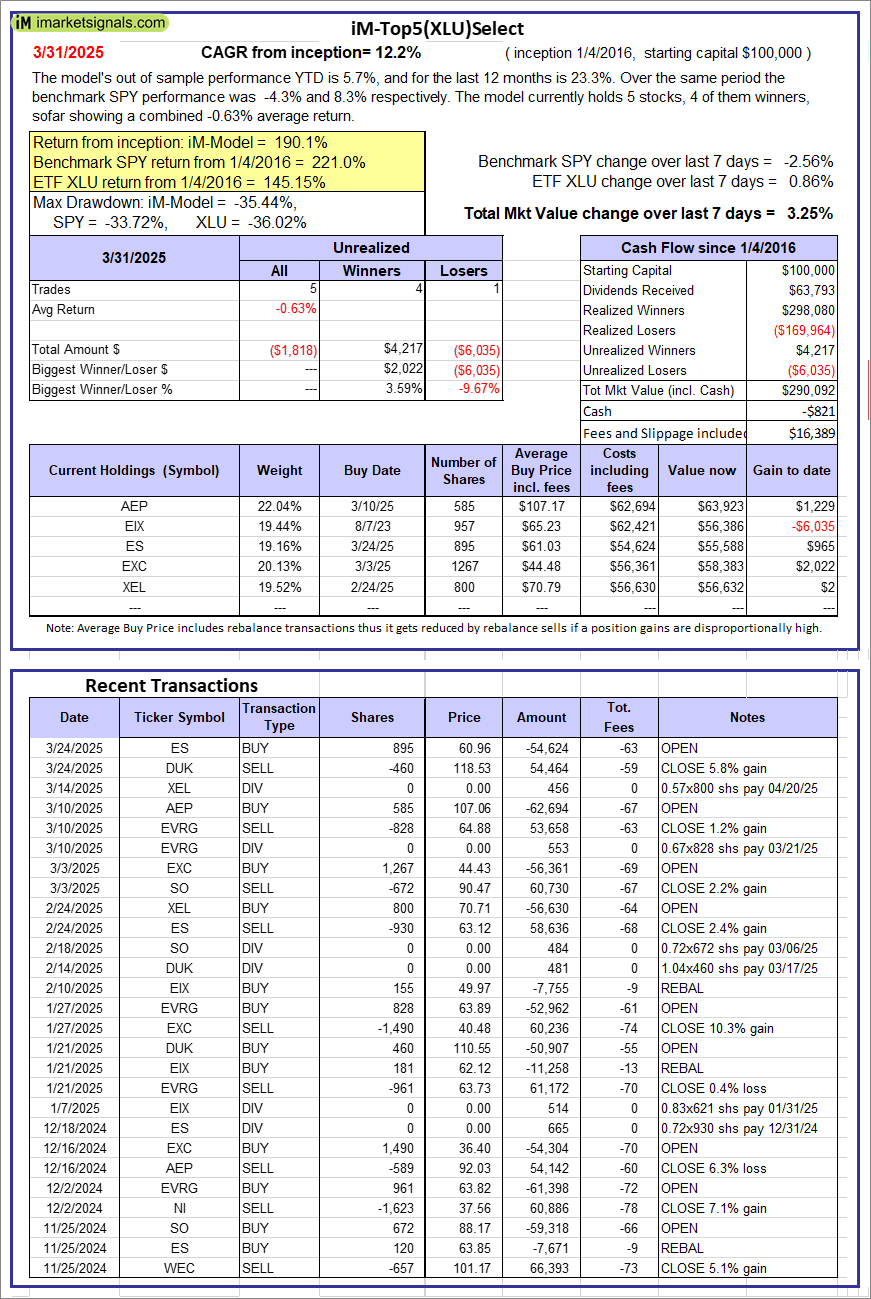 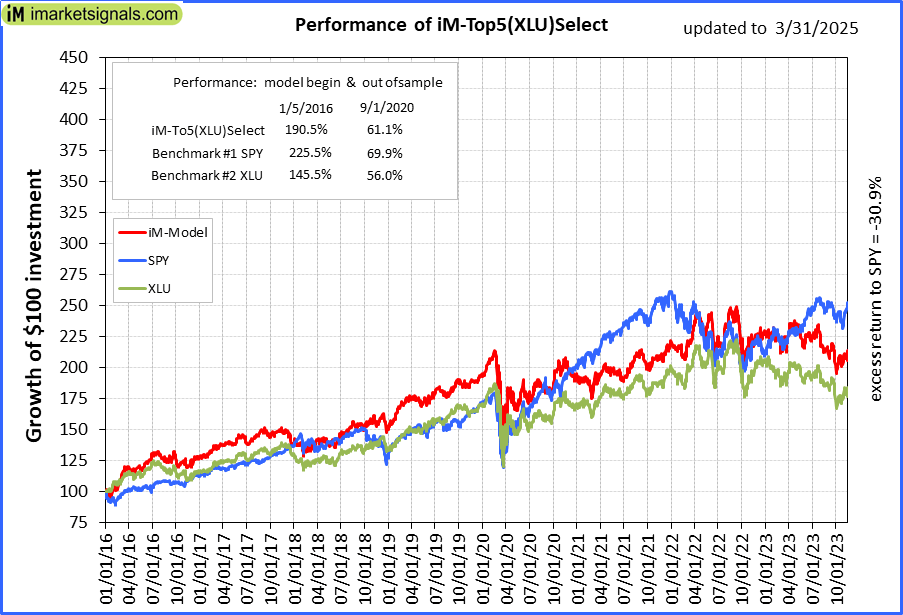 |
iM-Top5(XLU)Select: Since inception, on 1/5/2016, the model gained 190.09% while the benchmark SPY gained 220.95% over the same period. Over the previous week the market value of iM-Top5(XLU)Select gained 3.25% at a time when SPY gained -2.56%. A starting capital of $100,000 at inception on 1/5/2016 would have grown to $290,092 which includes -$821 cash and excludes $16,389 spent on fees and slippage. |
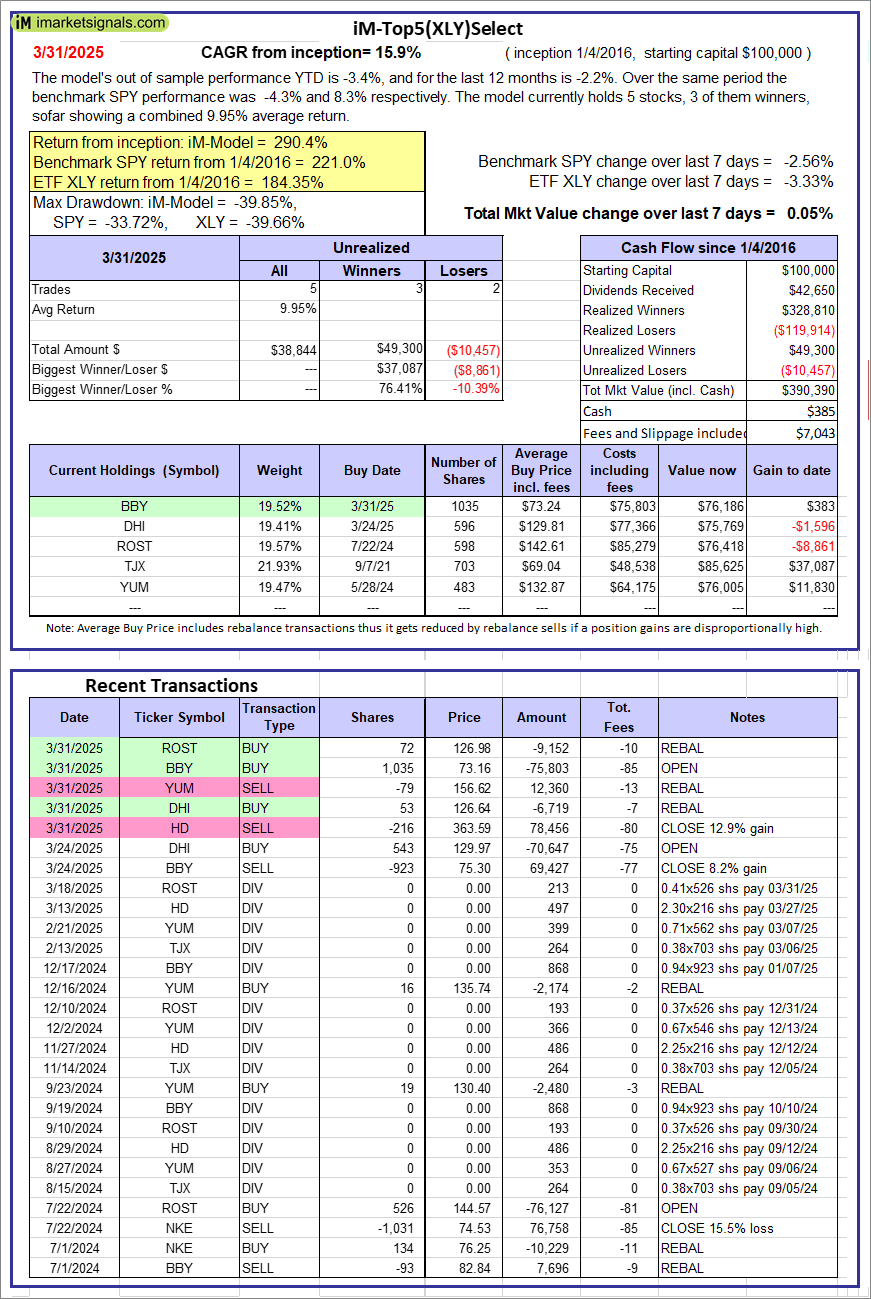 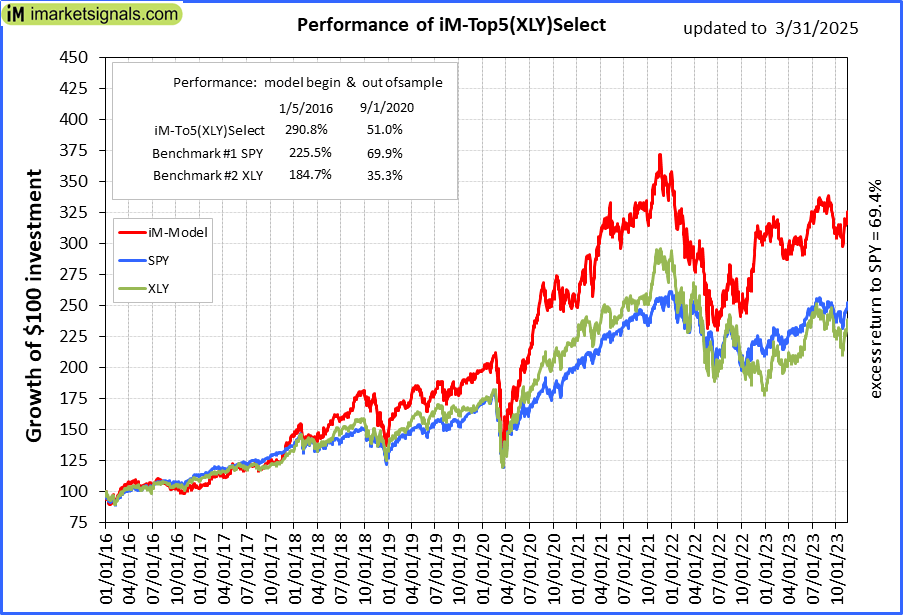 |
iM-Top5(XLY)Select: Since inception, on 1/5/2016, the model gained 290.39% while the benchmark SPY gained 220.95% over the same period. Over the previous week the market value of iM-Top5(XLY)Select gained 0.05% at a time when SPY gained -2.56%. A starting capital of $100,000 at inception on 1/5/2016 would have grown to $390,390 which includes $385 cash and excludes $7,043 spent on fees and slippage. |
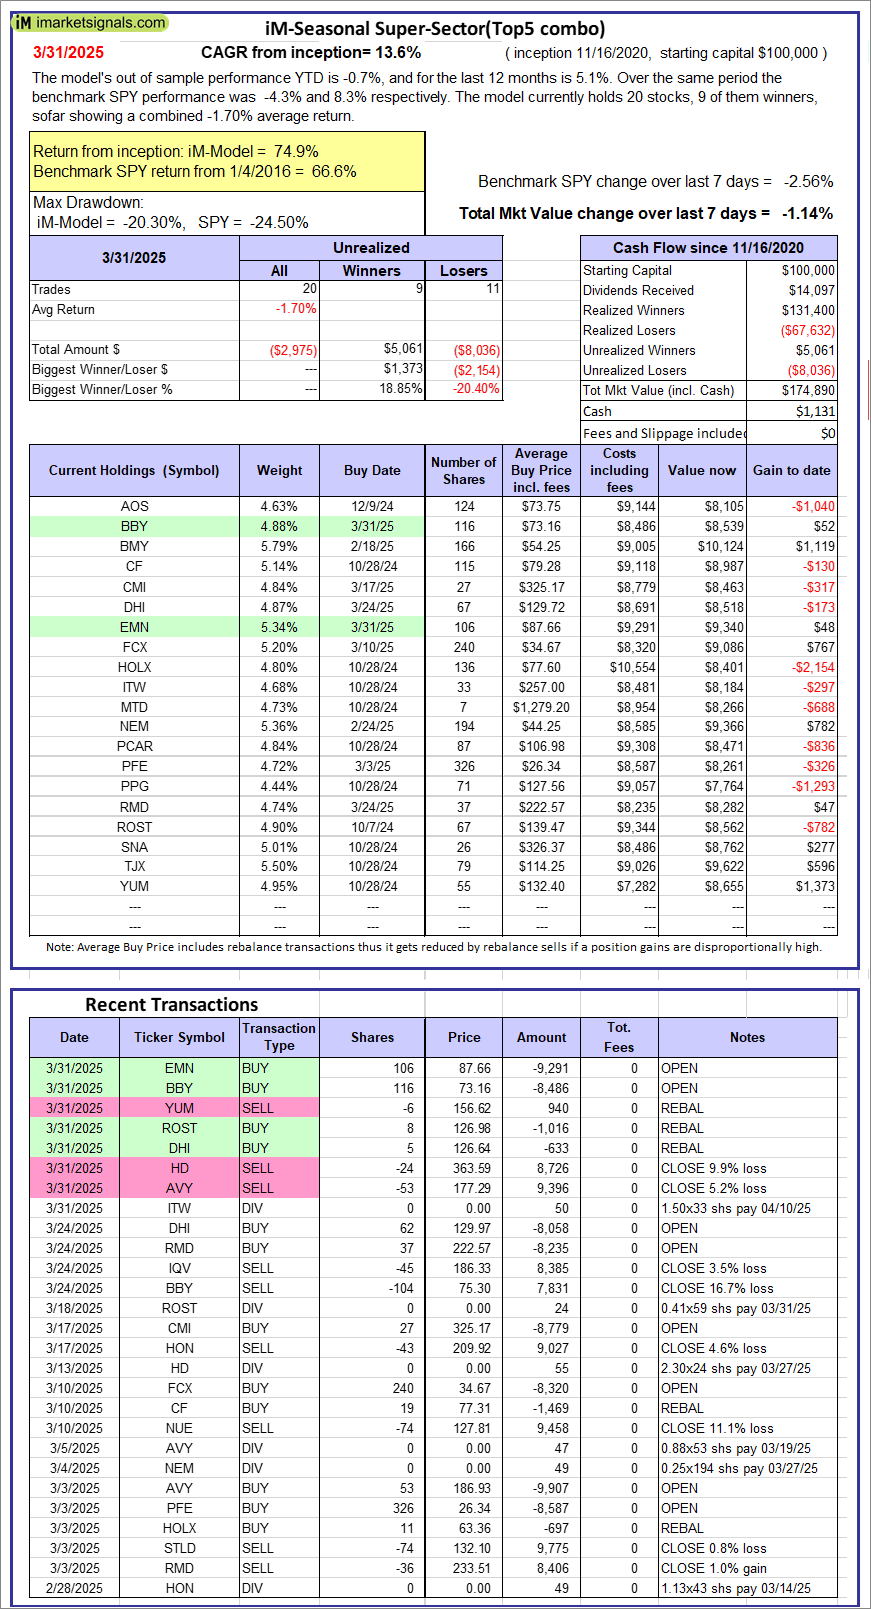 |
iM-Seasonal Super-Sectors (Top5 combo) : Since inception, on 11/17/2020, the model gained 74.89% while the benchmark SPY gained 66.61% over the same period. Over the previous week the market value of iM-Seasonal Super-Sectors (Top5 combo) gained -1.14% at a time when SPY gained -2.56%. A starting capital of $100,000 at inception on 11/17/2020 would have grown to $174,890 which includes $1,131 cash and excludes $00 spent on fees and slippage. |
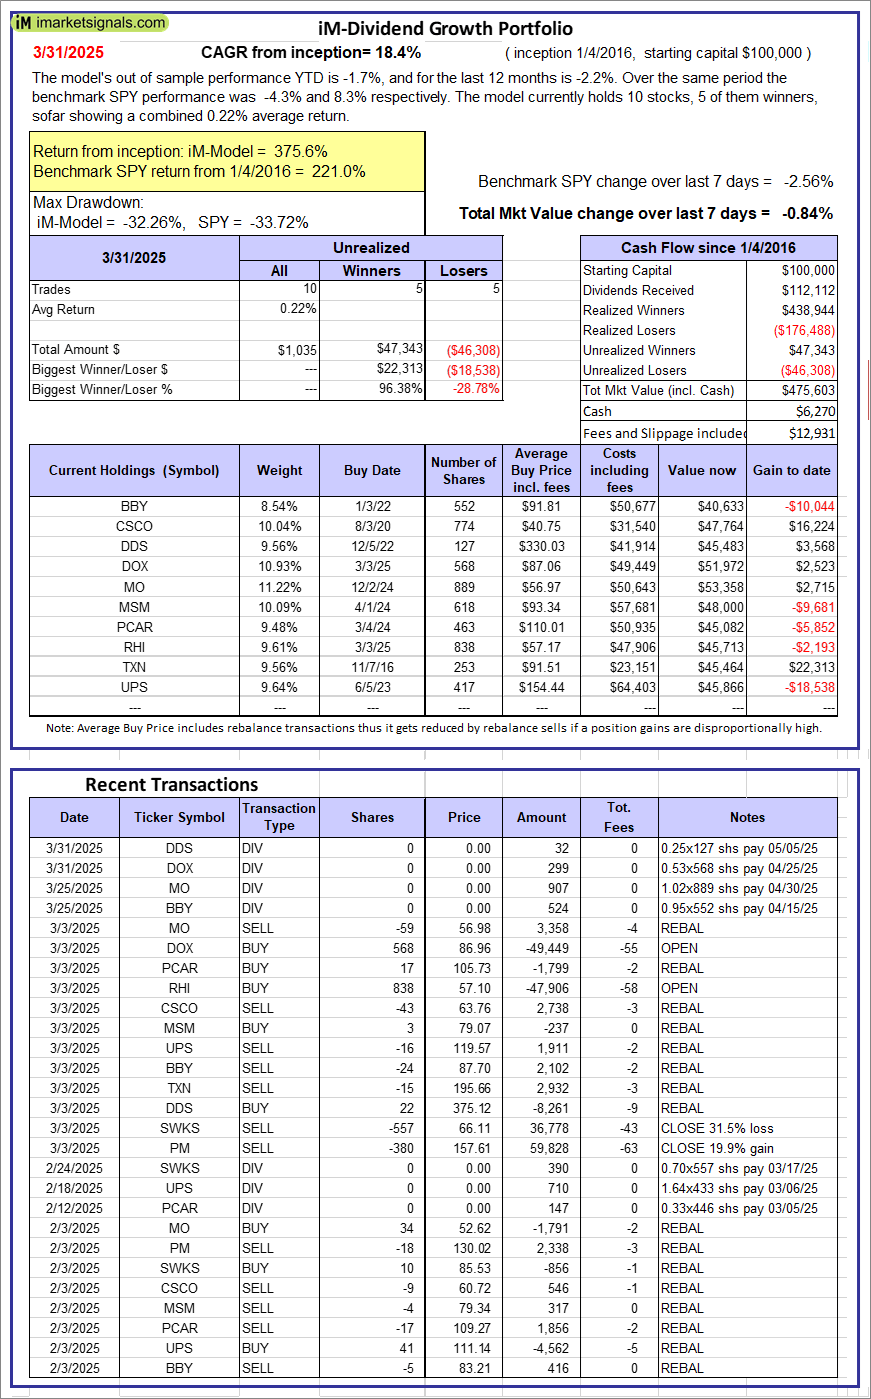 |
iM-Dividend Growth Portfolio: The model’s out of sample performance YTD is -1.7%, and for the last 12 months is -2.2%. Over the same period the benchmark SPY performance was -4.3% and 8.3% respectively. Over the previous week the market value of the iM-Dividend Growth Portfolio gained -0.84% at a time when SPY gained -2.56%. A starting capital of $100,000 at inception on 6/30/2016 would have grown to $475,603 which includes $6,270 cash and excludes $12,931 spent on fees and slippage. |
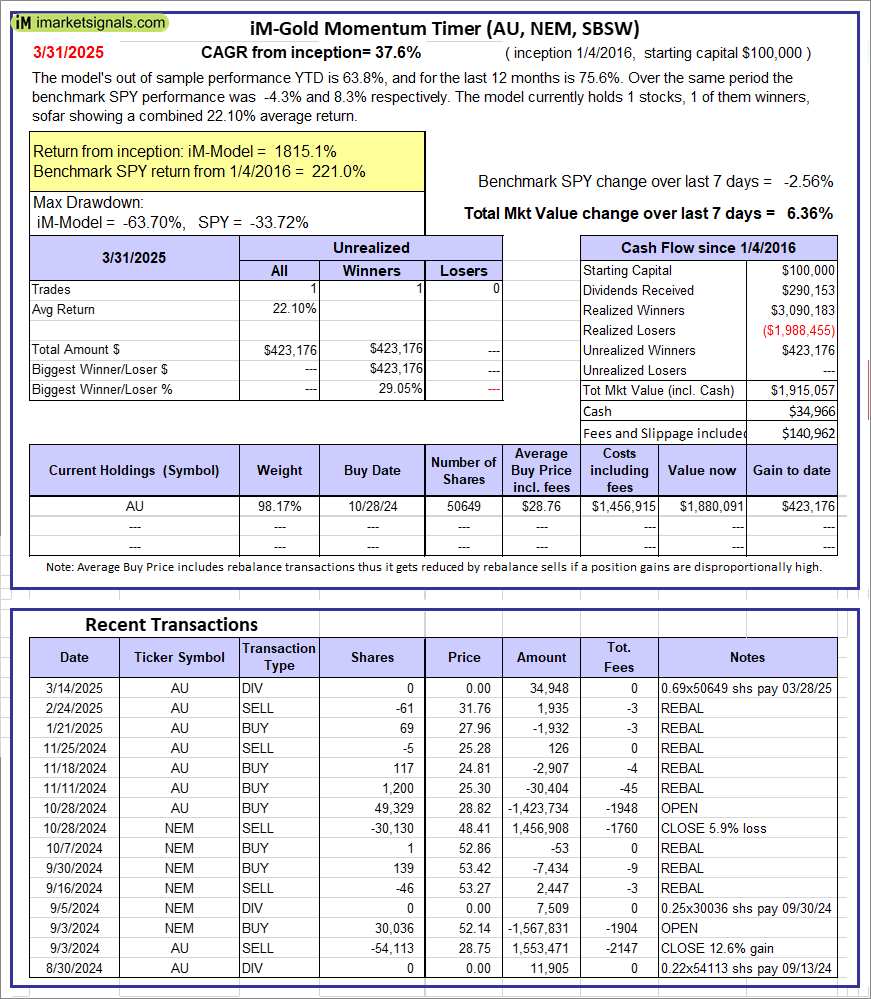 |
iM-Gold Momentum Timer (AU, NEM, SBSW): The model’s out of sample performance YTD is 63.8%, and for the last 12 months is 75.6%. Over the same period the benchmark SPY performance was -4.3% and 8.3% respectively. Over the previous week the market value of iM-Gold Momentum Timer (AU, NEM, SBSW) gained 6.36% at a time when SPY gained -2.56%. A starting capital of $100,000 at inception on 6/30/2016 would have grown to $34,966 which includes $140,962 cash and excludes Gain to date spent on fees and slippage. |
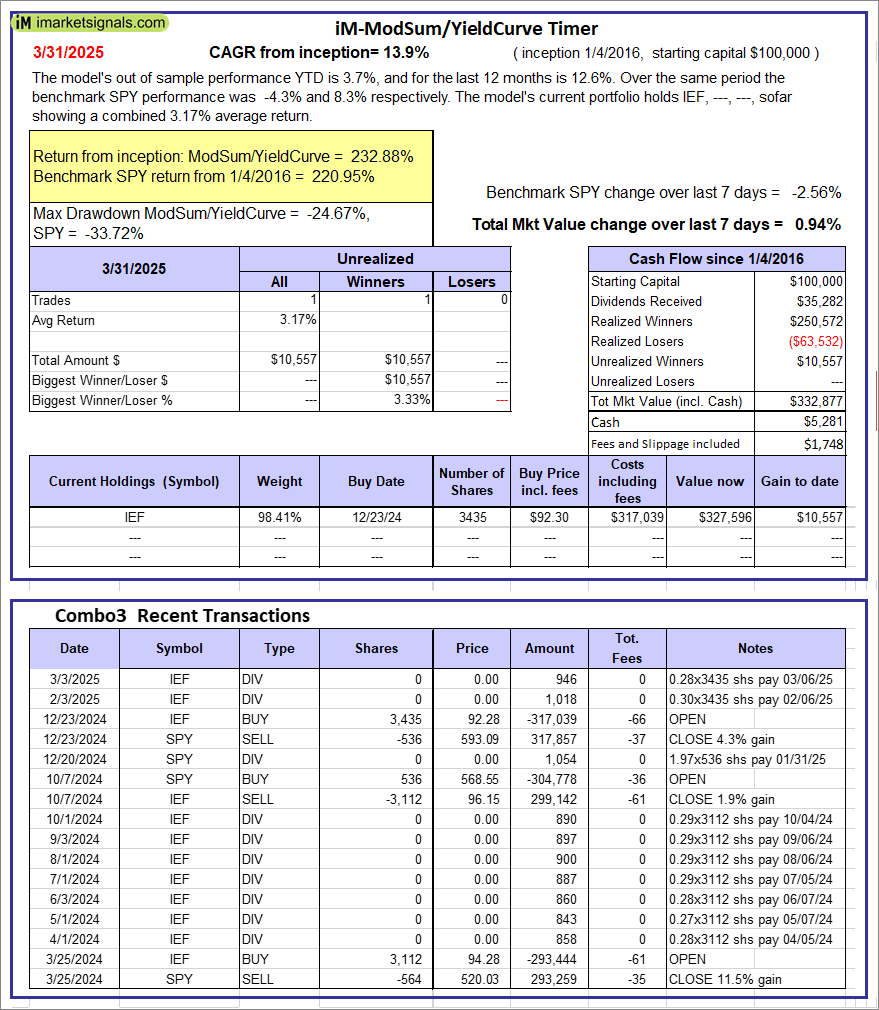 |
iM-ModSum/YieldCurve Timer: The model’s out of sample performance YTD is 3.7%, and for the last 12 months is 12.6%. Over the same period the benchmark SPY performance was -4.3% and 8.3% respectively. Over the previous week the market value of iM-PortSum/YieldCurve Timer gained 0.94% at a time when SPY gained -2.56%. A starting capital of $100,000 at inception on 1/1/2016 would have grown to $332,877 which includes $5,281 cash and excludes $1,748 spent on fees and slippage. |
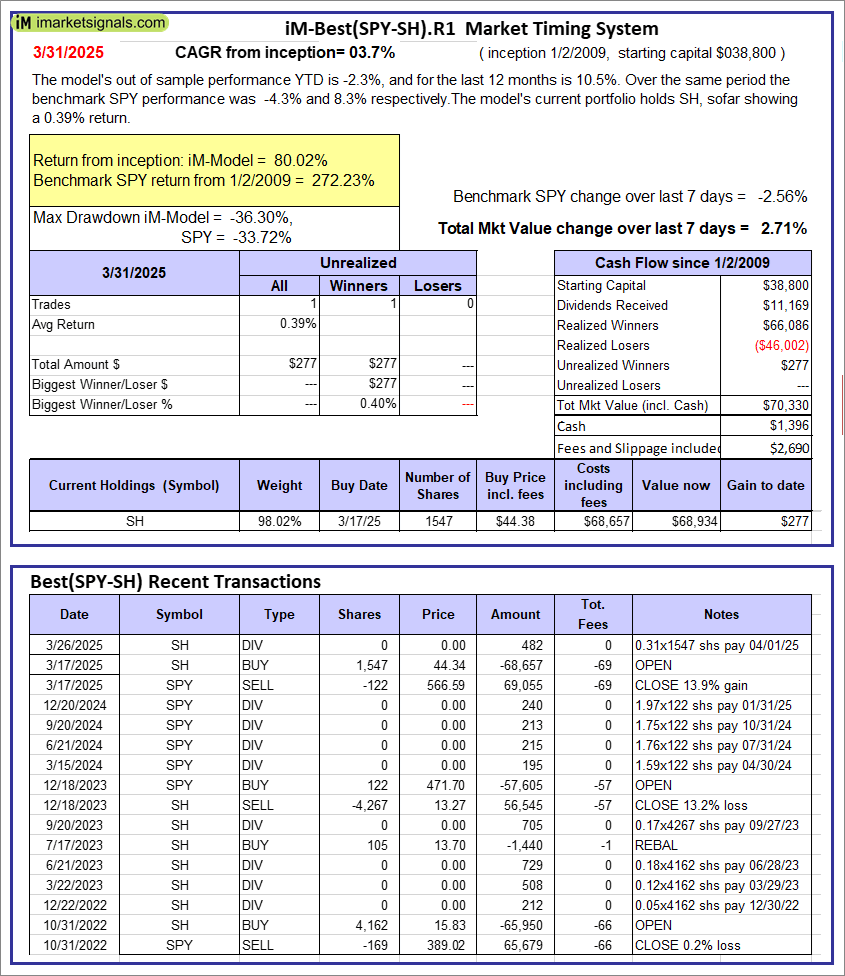 |
iM-Best(SPY-SH).R1: The model’s out of sample performance YTD is -2.3%, and for the last 12 months is 10.5%. Over the same period the benchmark SPY performance was -4.3% and 8.3% respectively. Over the previous week the market value of Best(SPY-SH) gained 2.71% at a time when SPY gained -2.56%. A starting capital of $100,000 at inception on 1/2/2009 would have grown to $70,330 which includes $1,396 cash and excludes $2,690 spent on fees and slippage. |
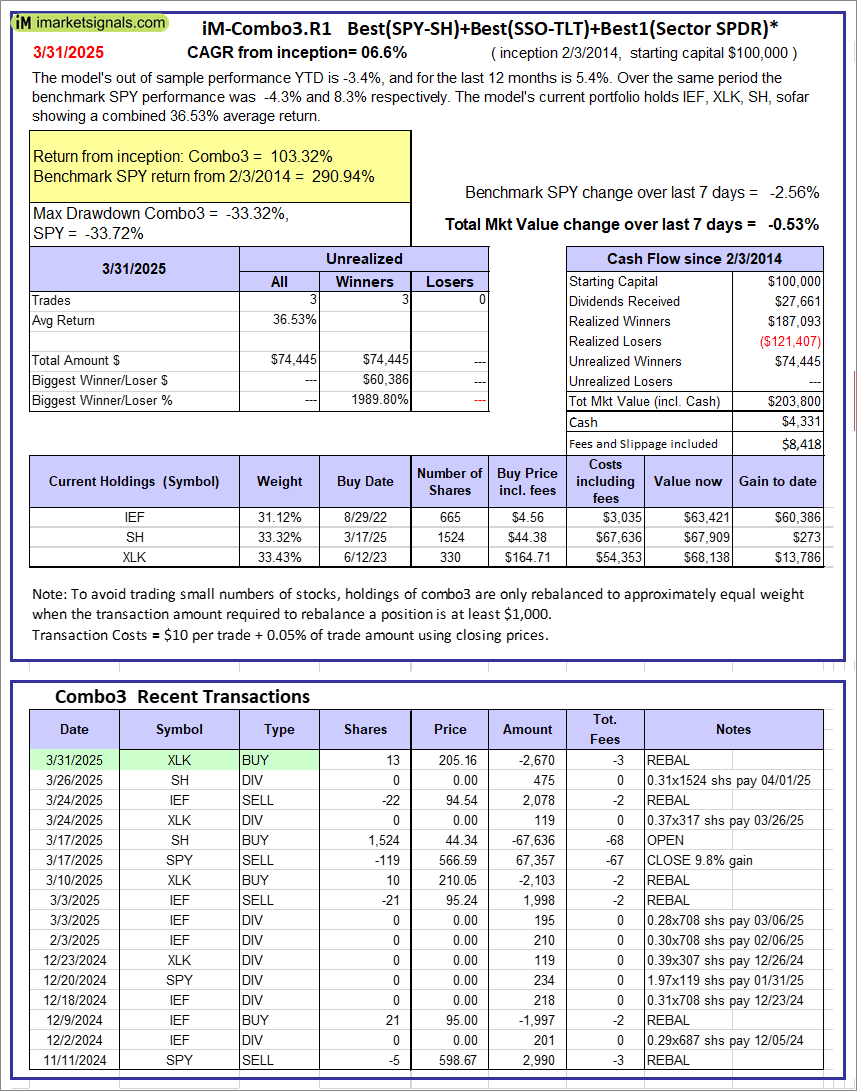 |
iM-Combo3.R1: The model’s out of sample performance YTD is -3.4%, and for the last 12 months is 5.4%. Over the same period the benchmark SPY performance was -4.3% and 8.3% respectively. Over the previous week the market value of iM-Combo3.R1 gained -0.53% at a time when SPY gained -2.56%. A starting capital of $100,000 at inception on 2/3/2014 would have grown to $203,800 which includes $4,331 cash and excludes $8,418 spent on fees and slippage. |
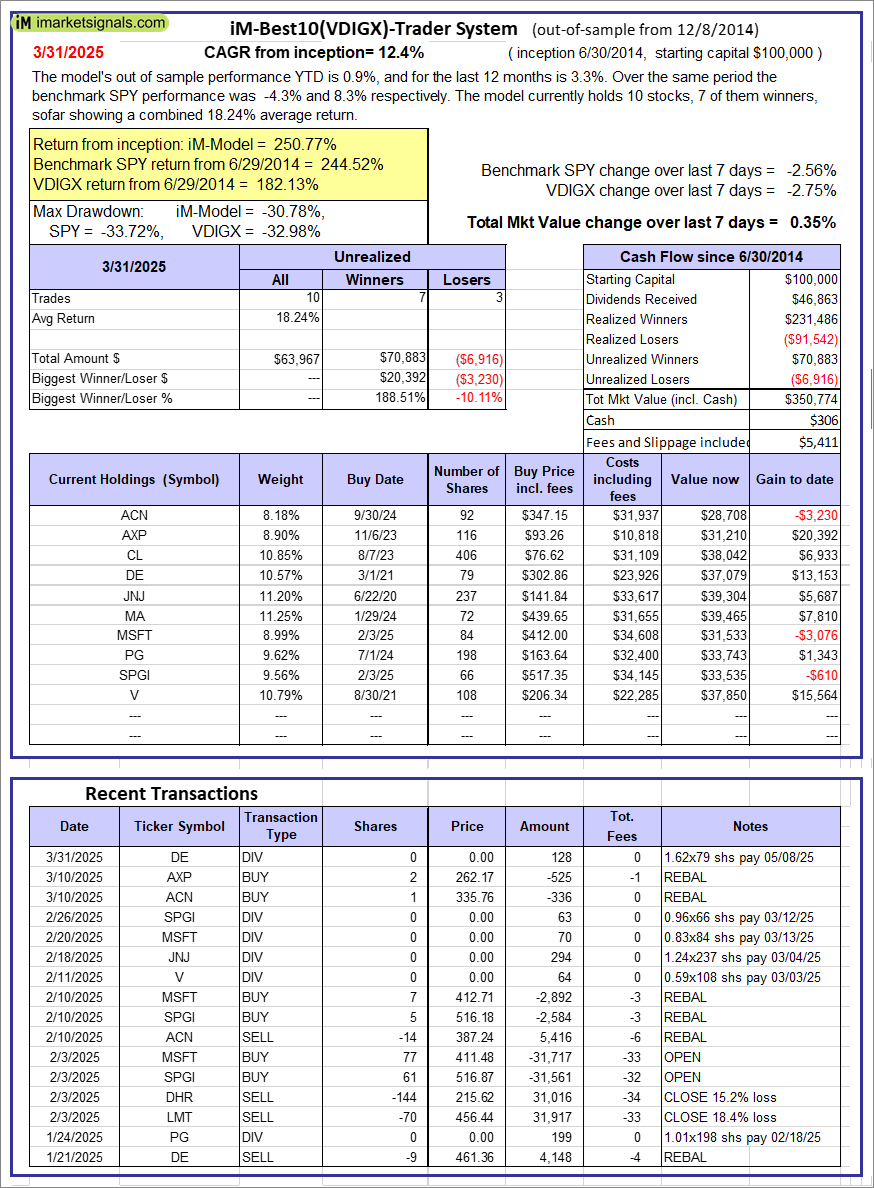 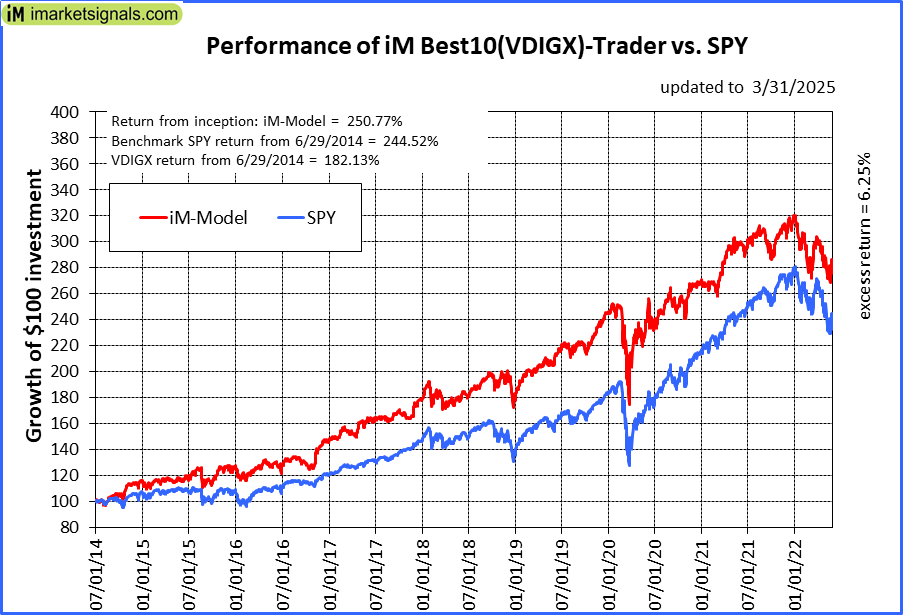 |
iM-Best10(VDIGX)-Trader: The model’s out of sample performance YTD is 0.9%, and for the last 12 months is 3.3%. Over the same period the benchmark SPY performance was -4.3% and 8.3% respectively. Since inception, on 7/1/2014, the model gained 250.77% while the benchmark SPY gained 244.52% and VDIGX gained 182.13% over the same period. Over the previous week the market value of iM-Best10(VDIGX) gained 0.35% at a time when SPY gained -2.56%. A starting capital of $100,000 at inception on 7/1/2014 would have grown to $350,774 which includes $306 cash and excludes $5,411 spent on fees and slippage. |
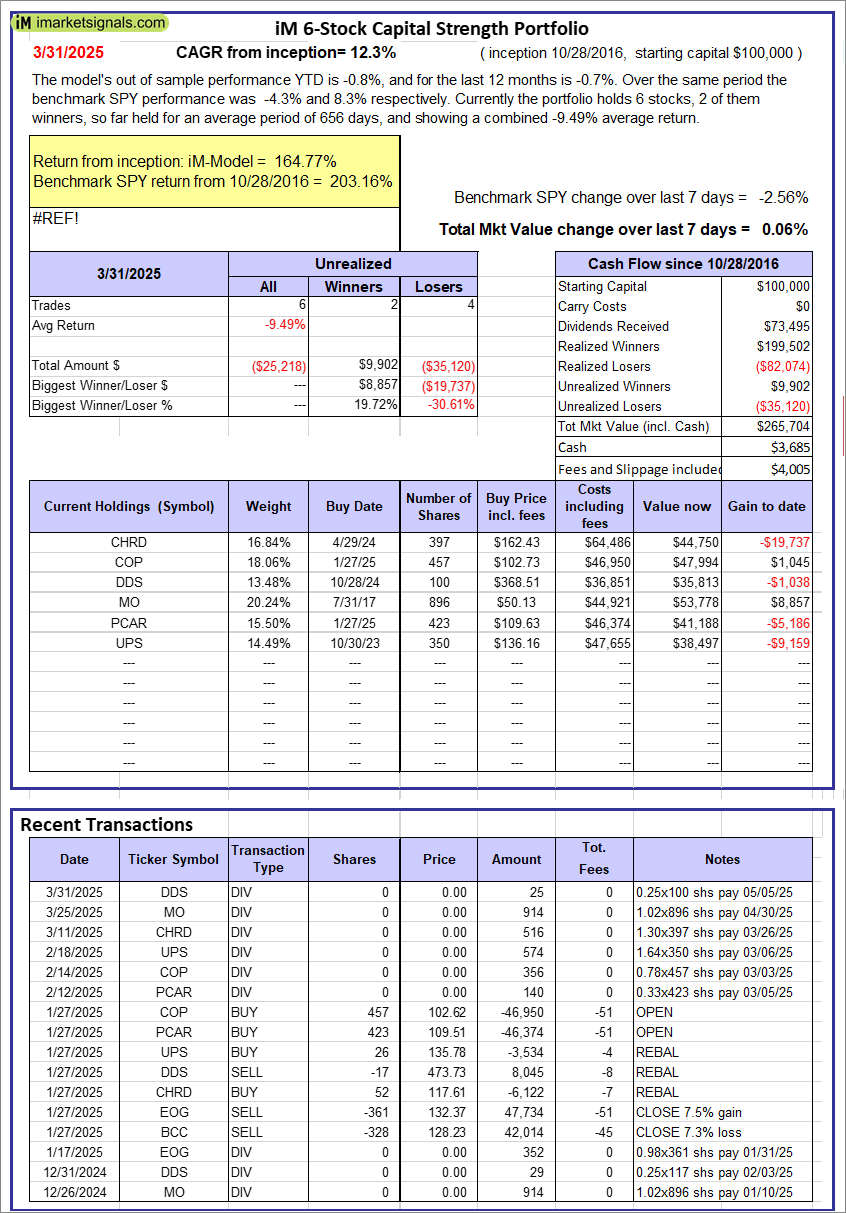 |
iM 6-Stock Capital Strength Portfolio: The model’s out of sample performance YTD is -0.8%, and for the last 12 months is -0.7%. Over the same period the benchmark SPY performance was -4.3% and 8.3% respectively. Over the previous week the market value of the iM 6-Stock Capital Strength Portfolio gained 0.06% at a time when SPY gained -2.56%. A starting capital of $100,000 at inception on 10/28/2016 would have grown to $265,704 which includes $3,685 cash and excludes $4,005 spent on fees and slippage. |
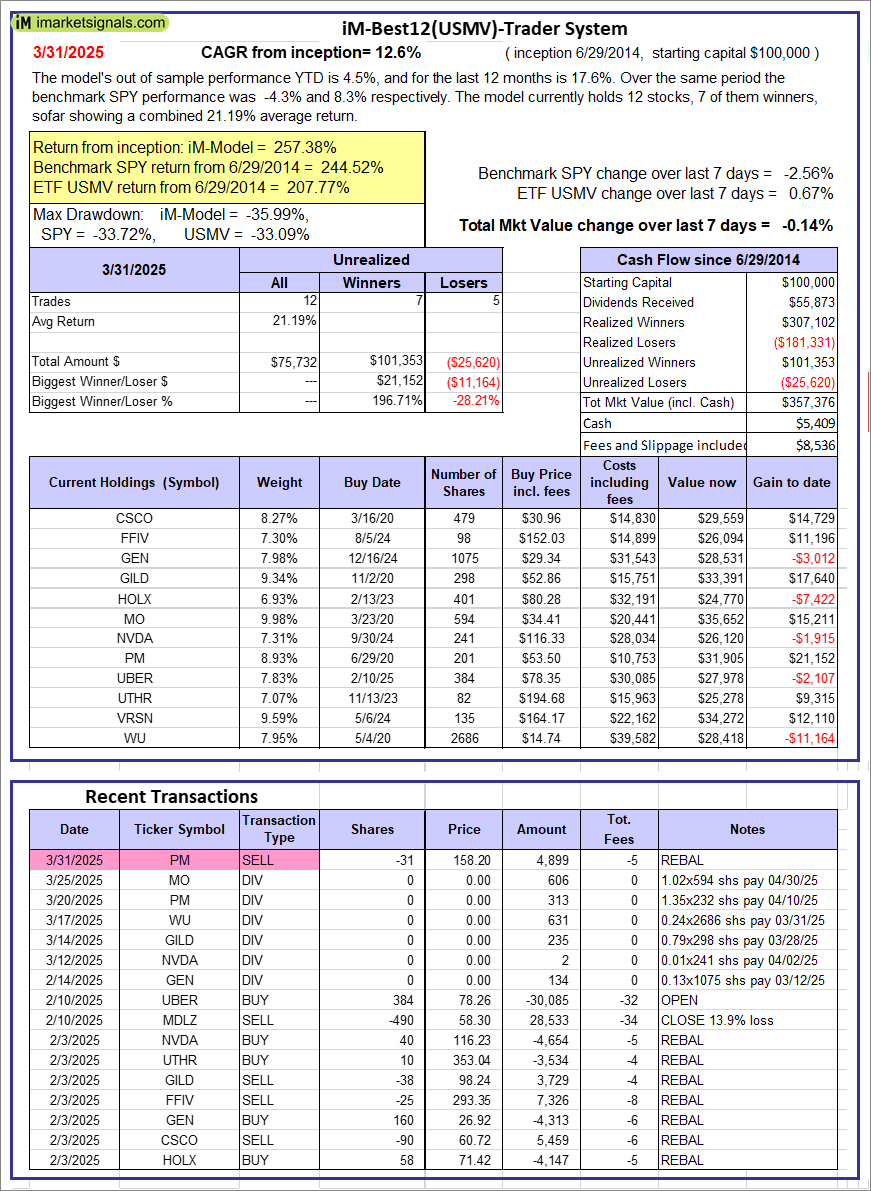 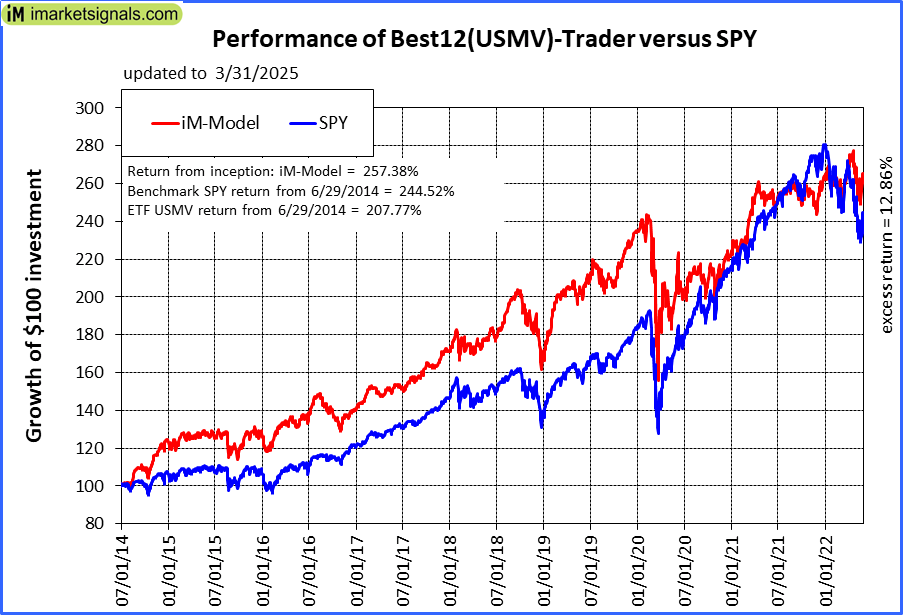 |
iM-Best12(USMV)-Trader: The model’s out of sample performance YTD is 4.5%, and for the last 12 months is 17.6%. Over the same period the benchmark SPY performance was -4.3% and 8.3% respectively. Since inception, on 6/30/2014, the model gained 257.38% while the benchmark SPY gained 244.52% and the ETF USMV gained 207.77% over the same period. Over the previous week the market value of iM-Best12(USMV)-Trader gained -0.14% at a time when SPY gained -2.56%. A starting capital of $100,000 at inception on 6/30/2014 would have grown to $357,376 which includes $5,409 cash and excludes $8,536 spent on fees and slippage. |
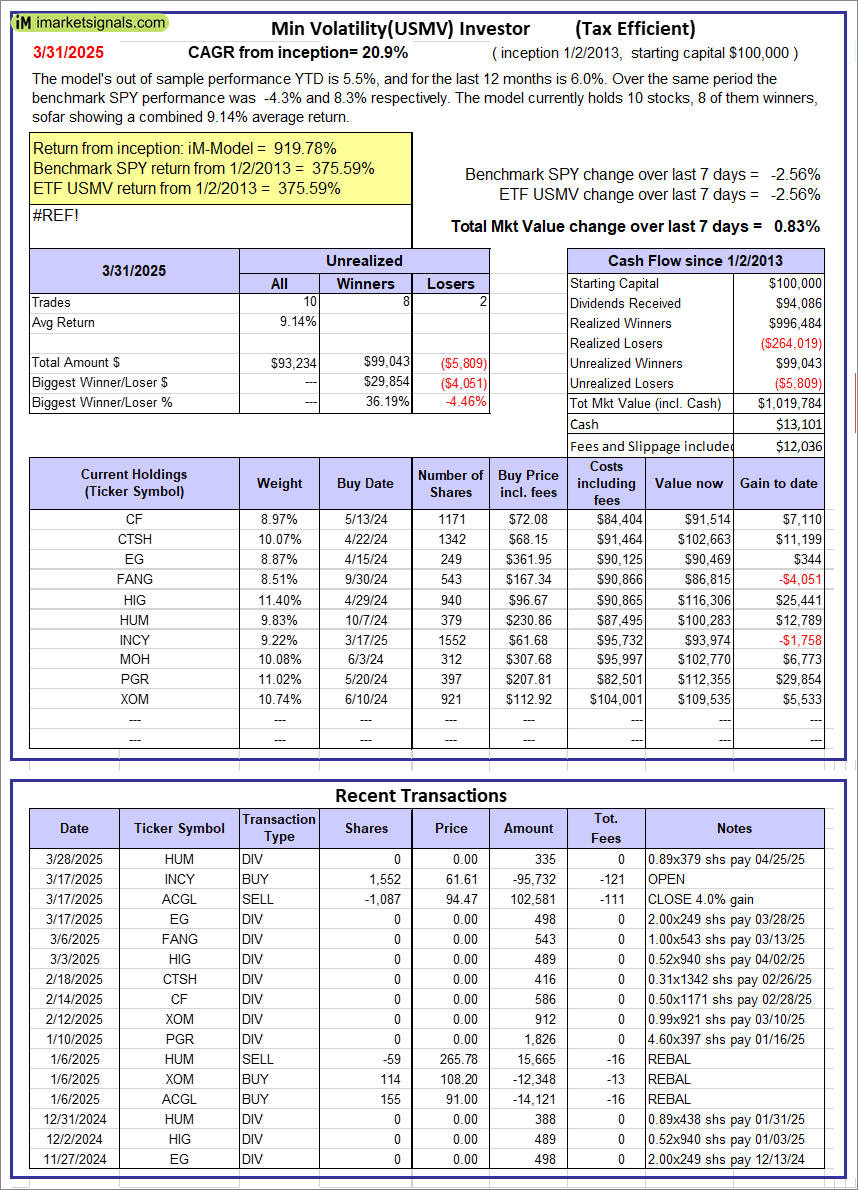 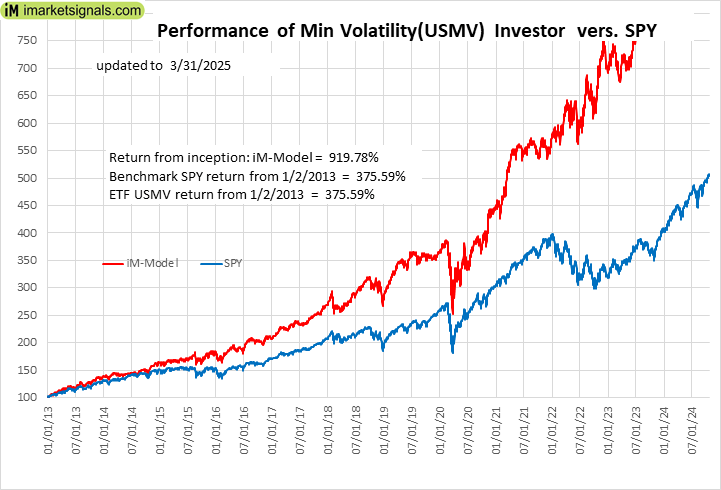 |
iM-Min Volatility(USMV) Investor (Tax Efficient): The model’s out of sample performance YTD is 5.5%, and for the last 12 months is 6.0%. Over the same period the benchmark SPY performance was -4.3% and 8.3% respectively. Since inception, on 1/3/2013, the model gained 919.78% while the benchmark SPY gained 375.59% and the ETF USMV gained 375.59% over the same period. Over the previous week the market value of iM-Best12(USMV)Q1 gained 0.83% at a time when SPY gained -2.56%. A starting capital of $100,000 at inception on 1/3/2013 would have grown to $1,019,784 which includes $13,101 cash and excludes $12,036 spent on fees and slippage. |
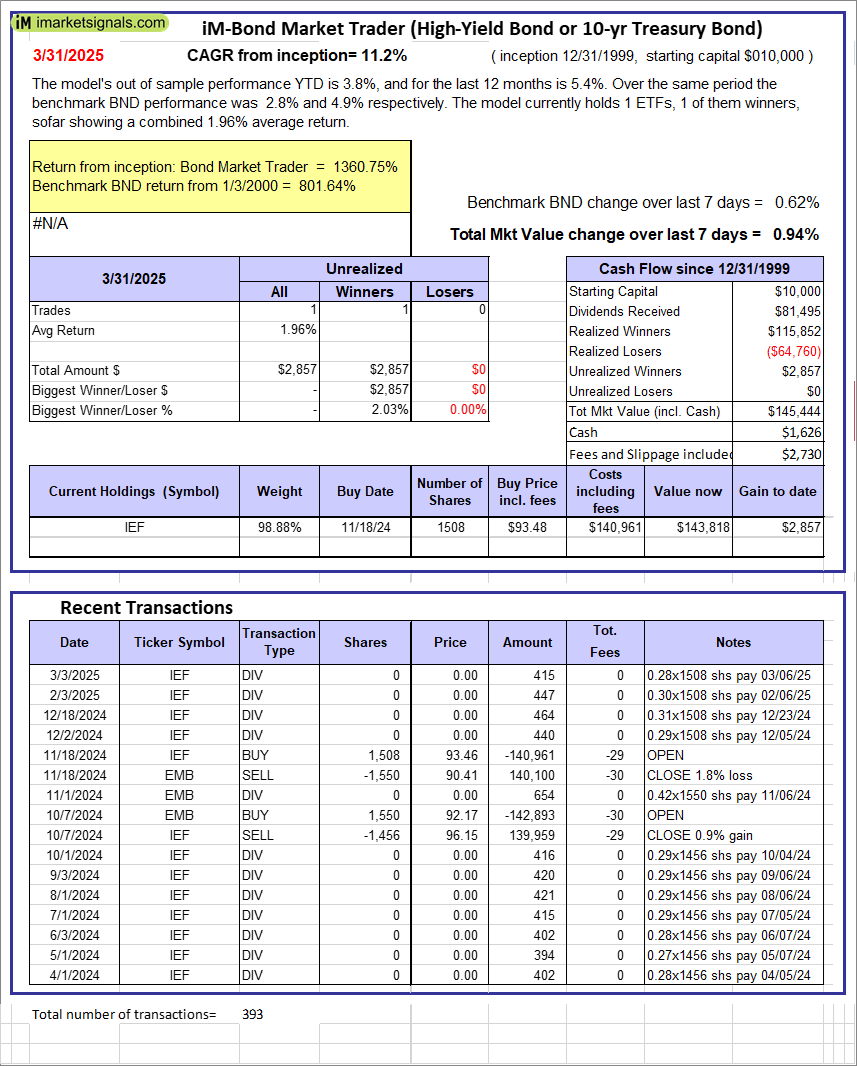 |
iM-Bond Market Trader (High-Yield Bond or 10-yr Treasury Bond): The model’s out of sample performance YTD is 3.8%, and for the last 12 months is 5.4%. Over the same period the benchmark BND performance was 2.8% and 4.9% respectively. Over the previous week the market value of the iM-Bond Market Trader (High-Yield Bond or 10-yr Treasury Bond) gained 0.94% at a time when BND gained 0.62%. A starting capital of $10,000 at inception on 1/3/2000 would have grown to $145,444 which includes $1,626 cash and excludes $2,730 spent on fees and slippage. |
|
|
iM-ModSum/YieldCurve Timer: The model’s out of sample performance YTD is 3.7%, and for the last 12 months is 12.6%. Over the same period the benchmark SPY performance was -4.3% and 8.3% respectively. Over the previous week the market value of iM-PortSum/YieldCurve Timer gained 0.94% at a time when SPY gained -2.56%. A starting capital of $100,000 at inception on 1/1/2016 would have grown to $332,877 which includes $5,281 cash and excludes $1,748 spent on fees and slippage. |
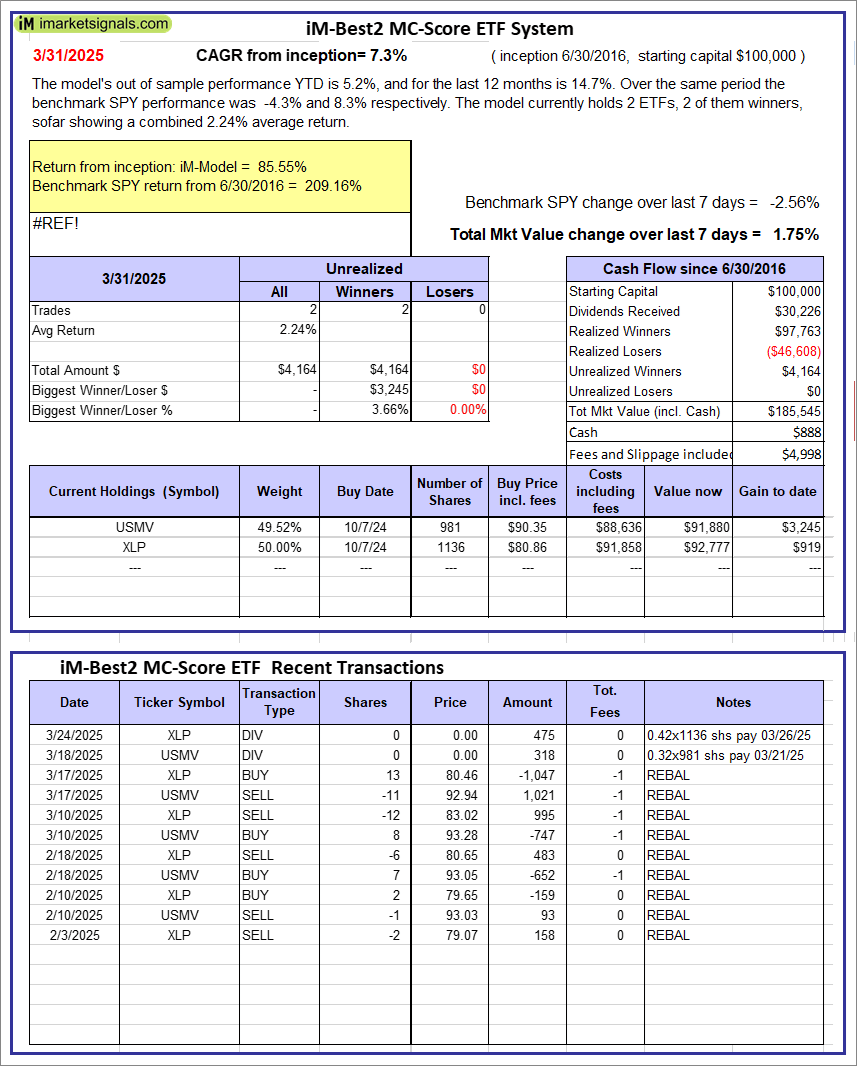 |
iM-Best2 MC-Score ETF System: The model’s out of sample performance YTD is 5.2%, and for the last 12 months is 14.7%. Over the same period the benchmark SPY performance was -4.3% and 8.3% respectively. Over the previous week the market value of the iM-Best2 MC-Score ETF System gained 1.75% at a time when SPY gained -2.56%. A starting capital of $100,000 at inception on 6/30/2016 would have grown to $185,545 which includes $888 cash and excludes $4,998 spent on fees and slippage. |
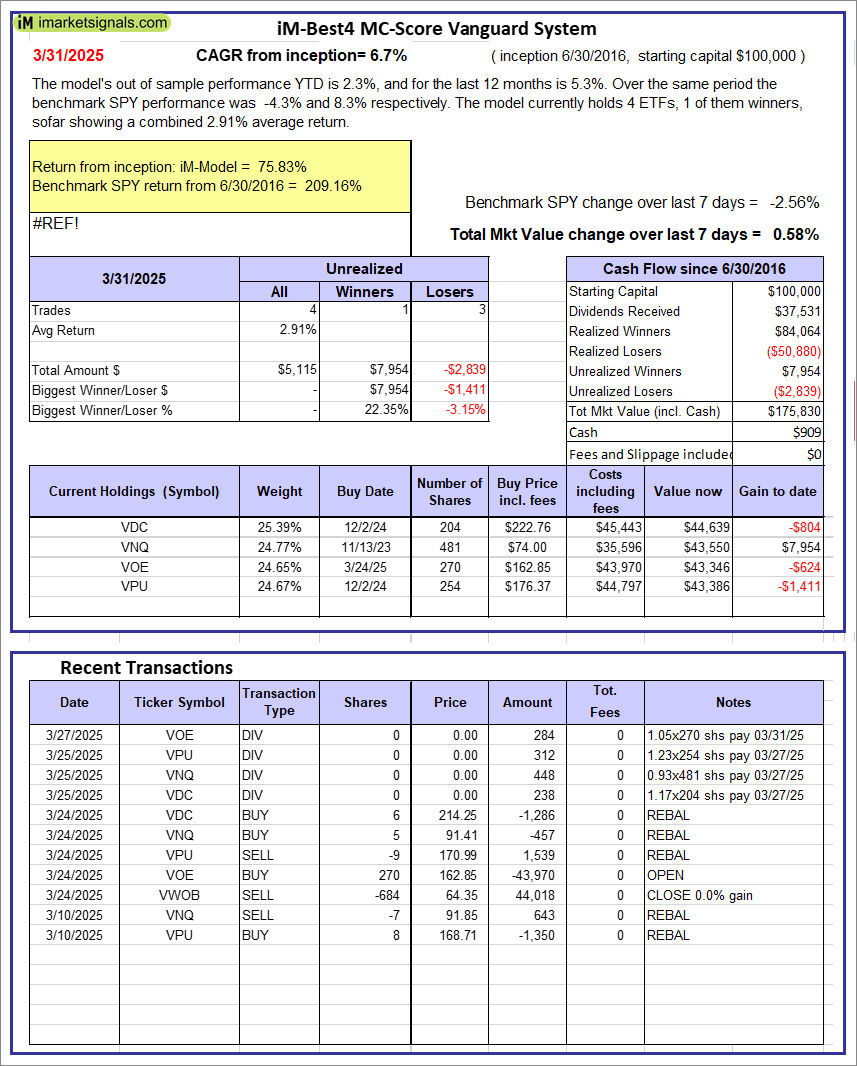 |
iM-Best4 MC-Score Vanguard System: The model’s out of sample performance YTD is 2.3%, and for the last 12 months is 5.3%. Over the same period the benchmark SPY performance was -4.3% and 8.3% respectively. Over the previous week the market value of the iM-Best4 MC-Score Vanguard System gained 0.58% at a time when SPY gained -2.56%. A starting capital of $100,000 at inception on 6/30/2016 would have grown to $175,830 which includes $909 cash and excludes $00 spent on fees and slippage. |
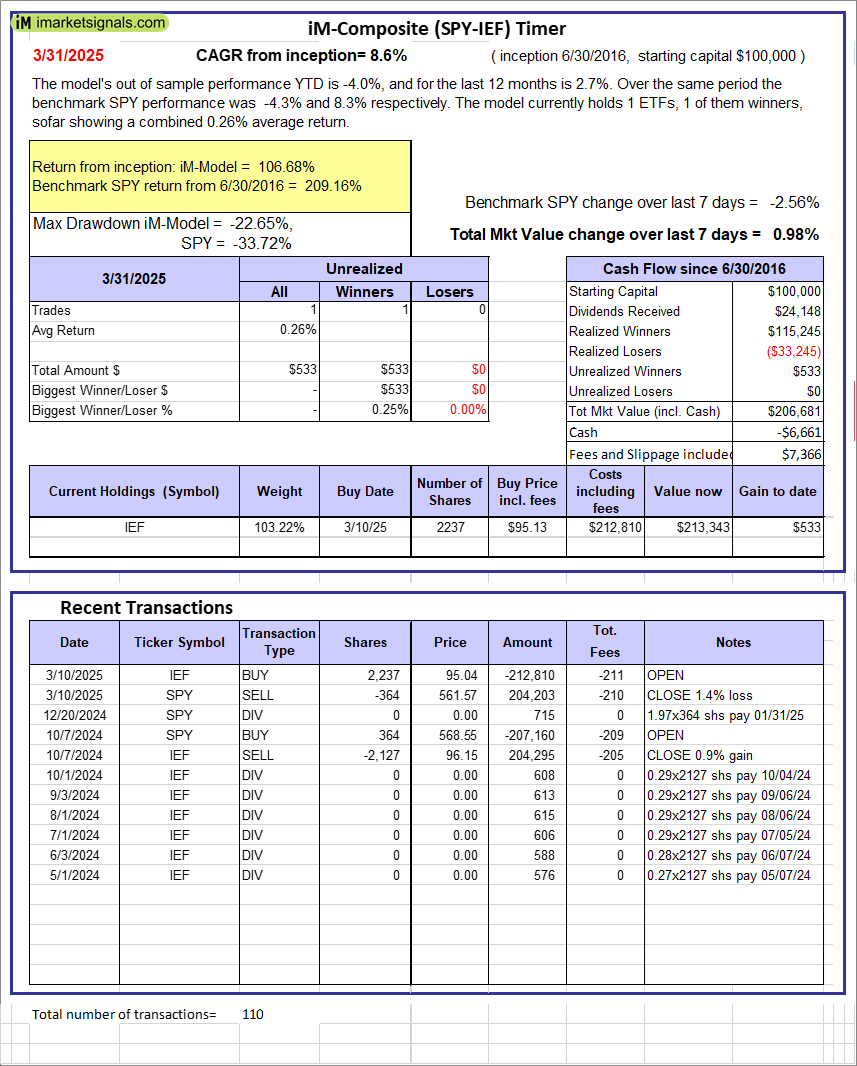 |
iM-Composite (SPY-IEF) Timer: The model’s out of sample performance YTD is -4.0%, and for the last 12 months is 2.7%. Over the same period the benchmark SPY performance was -4.3% and 8.3% respectively. Over the previous week the market value of the iM-Composite (SPY-IEF) Timer gained 0.98% at a time when SPY gained -2.56%. A starting capital of $100,000 at inception on 6/30/2016 would have grown to $206,681 which includes -$6,661 cash and excludes $7,366 spent on fees and slippage. |
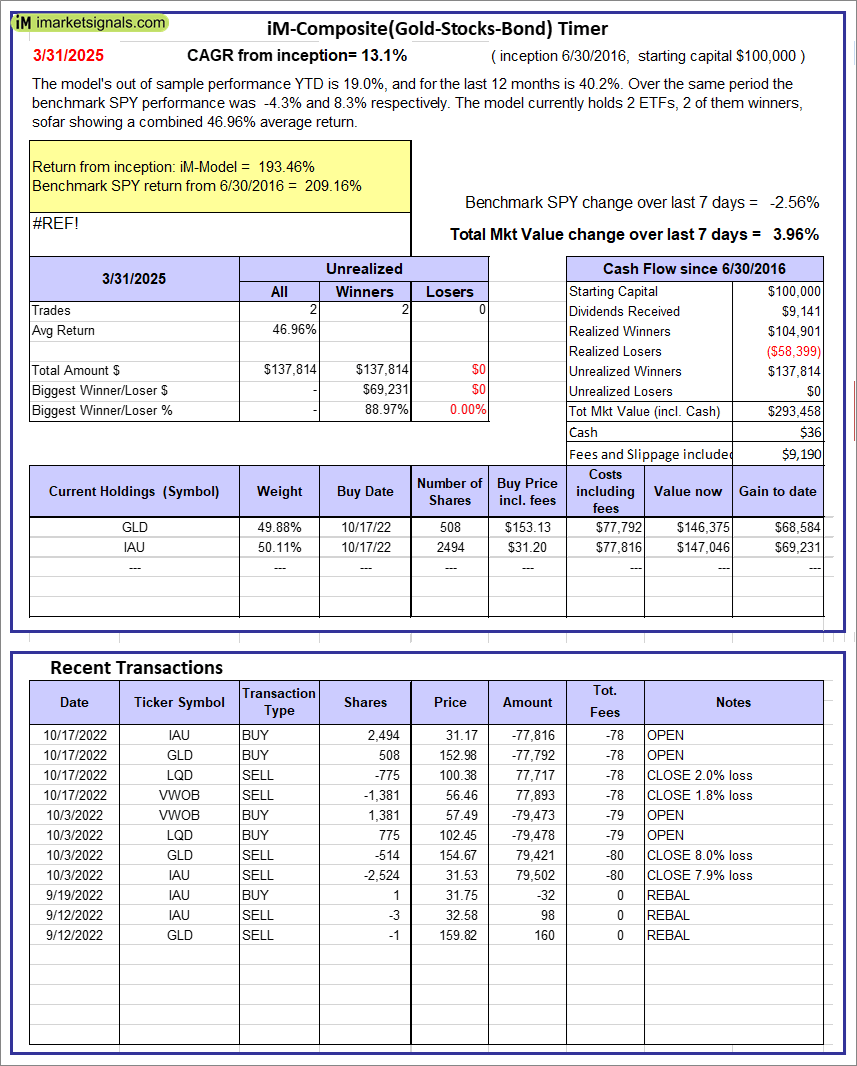 |
iM-Composite(Gold-Stocks-Bond) Timer: The model’s out of sample performance YTD is 19.0%, and for the last 12 months is 40.2%. Over the same period the benchmark SPY performance was -4.3% and 8.3% respectively. Over the previous week the market value of the iM-Composite(Gold-Stocks-Bond) Timer gained 3.96% at a time when SPY gained -2.56%. A starting capital of $100,000 at inception on 6/30/2016 would have grown to $293,458 which includes $36 cash and excludes $9,190 spent on fees and slippage. |
iM-Best Reports – 4/1/2025
Posted in pmp SPY-SH
Leave a Reply
You must be logged in to post a comment.