
  |
Out of sample performance summary of our models for the past 1, 2, 4 and 13 week periods. The active active return indicates how the models over- or underperformed the benchmark ETF SPY. Also the YTD, and the 1-, 3-, 5- and 10-year annualized returns are shown in the second table |
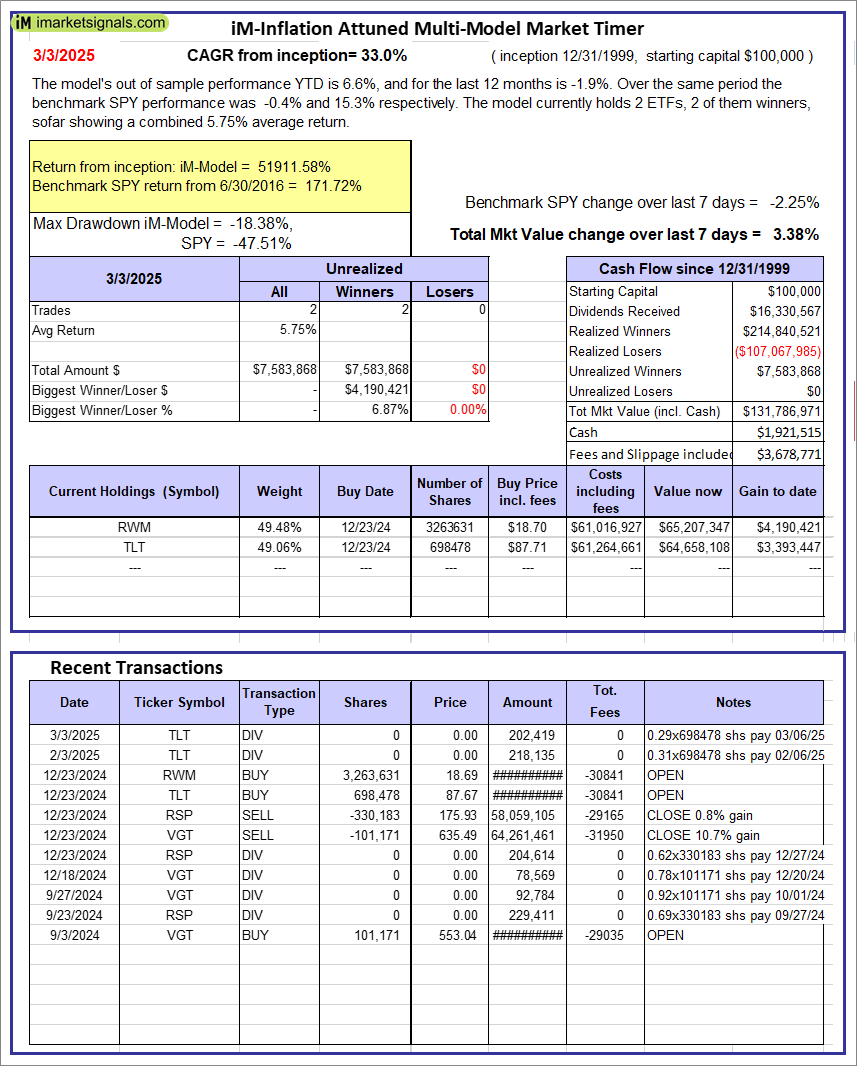 |
iM-Inflation Attuned Multi-Model Market Timer: The model’s out of sample performance YTD is 6.6%, and for the last 12 months is -1.9%. Over the same period the benchmark SPY performance was -0.4% and 15.3% respectively. Over the previous week the market value of the iM-Inflation Attuned Multi-Model Market Timer gained 3.38% at a time when SPY gained -2.25%. A starting capital of $100,000 at inception on 3/24/2017 would have grown to $131,786,971 which includes $1,921,515 cash and excludes $3,678,771 spent on fees and slippage. |
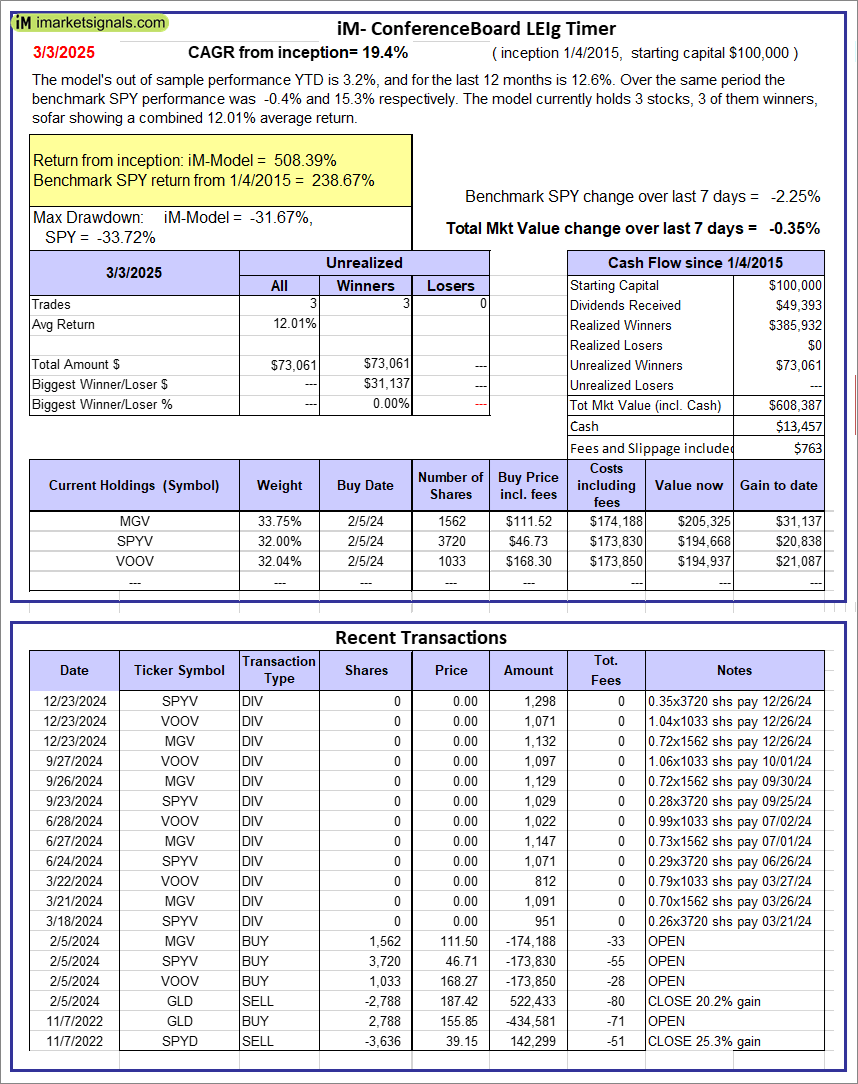 |
iM-Conference Board LEIg Timer: The model’s performance YTD is 14.3%, and for the last 12 months is 7.3%. Over the same period the benchmark SPY performance was 20.1% and 9.4% respectively. Over the previous week the market value of the iM-Conference Board LEIg Timer gained -0.35% at a time when SPY gained -2.25%. A starting capital of $100,000 at inception on 4/5/2017 would have grown to $608,387 which includes $13,457 cash and excludes $763 spent on fees and slippage. |
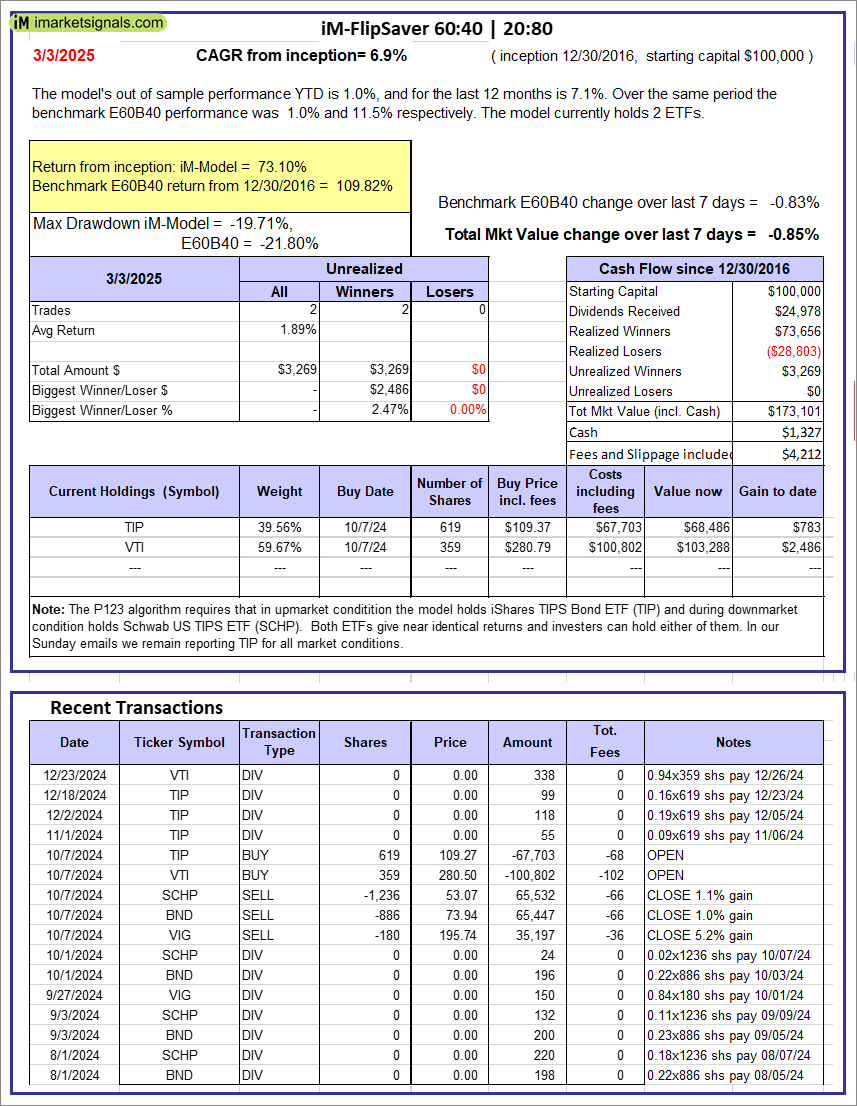 |
iM-FlipSaver 60:40 | 20:80 – 2017: The model’s out of sample performance YTD is 1.0%, and for the last 12 months is 7.1%. Over the same period the benchmark E60B40 performance was 1.0% and 11.5% respectively. Over the previous week the market value of iM-FlipSaver 80:20 | 20:80 gained -0.85% at a time when SPY gained -0.83%. A starting capital of $100,000 at inception on 7/16/2015 would have grown to $173,101 which includes $1,327 cash and excludes $4,212 spent on fees and slippage. |
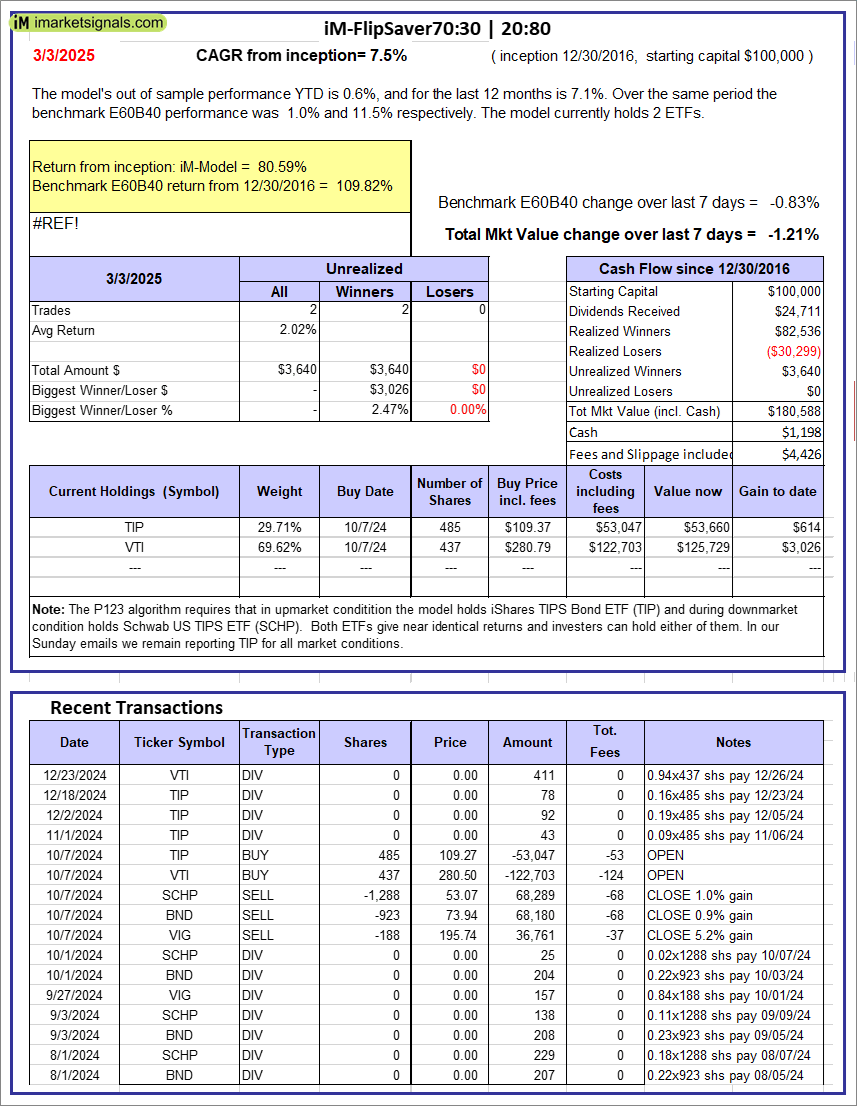 |
iM-FlipSaver 70:30 | 20:80 – 2017: The model’s out of sample performance YTD is 0.6%, and for the last 12 months is 7.1%. Over the same period the benchmark E60B40 performance was 1.0% and 11.5% respectively. Over the previous week the market value of iM-FlipSaver 70:30 | 20:80 gained -1.21% at a time when SPY gained -0.83%. A starting capital of $100,000 at inception on 7/15/2015 would have grown to $180,588 which includes $1,198 cash and excludes $4,426 spent on fees and slippage. |
 |
iM-FlipSaver 80:20 | 20:80 – 2017: The model’s out of sample performance YTD is 0.1%, and for the last 12 months is 7.2%. Over the same period the benchmark E60B40 performance was 1.0% and 11.5% respectively. Over the previous week the market value of iM-FlipSaver 80:20 | 20:80 gained -1.56% at a time when SPY gained -0.83%. A starting capital of $100,000 at inception on 1/2/2017 would have grown to $188,014 which includes $1,341 cash and excludes $4,632 spent on fees and slippage. |
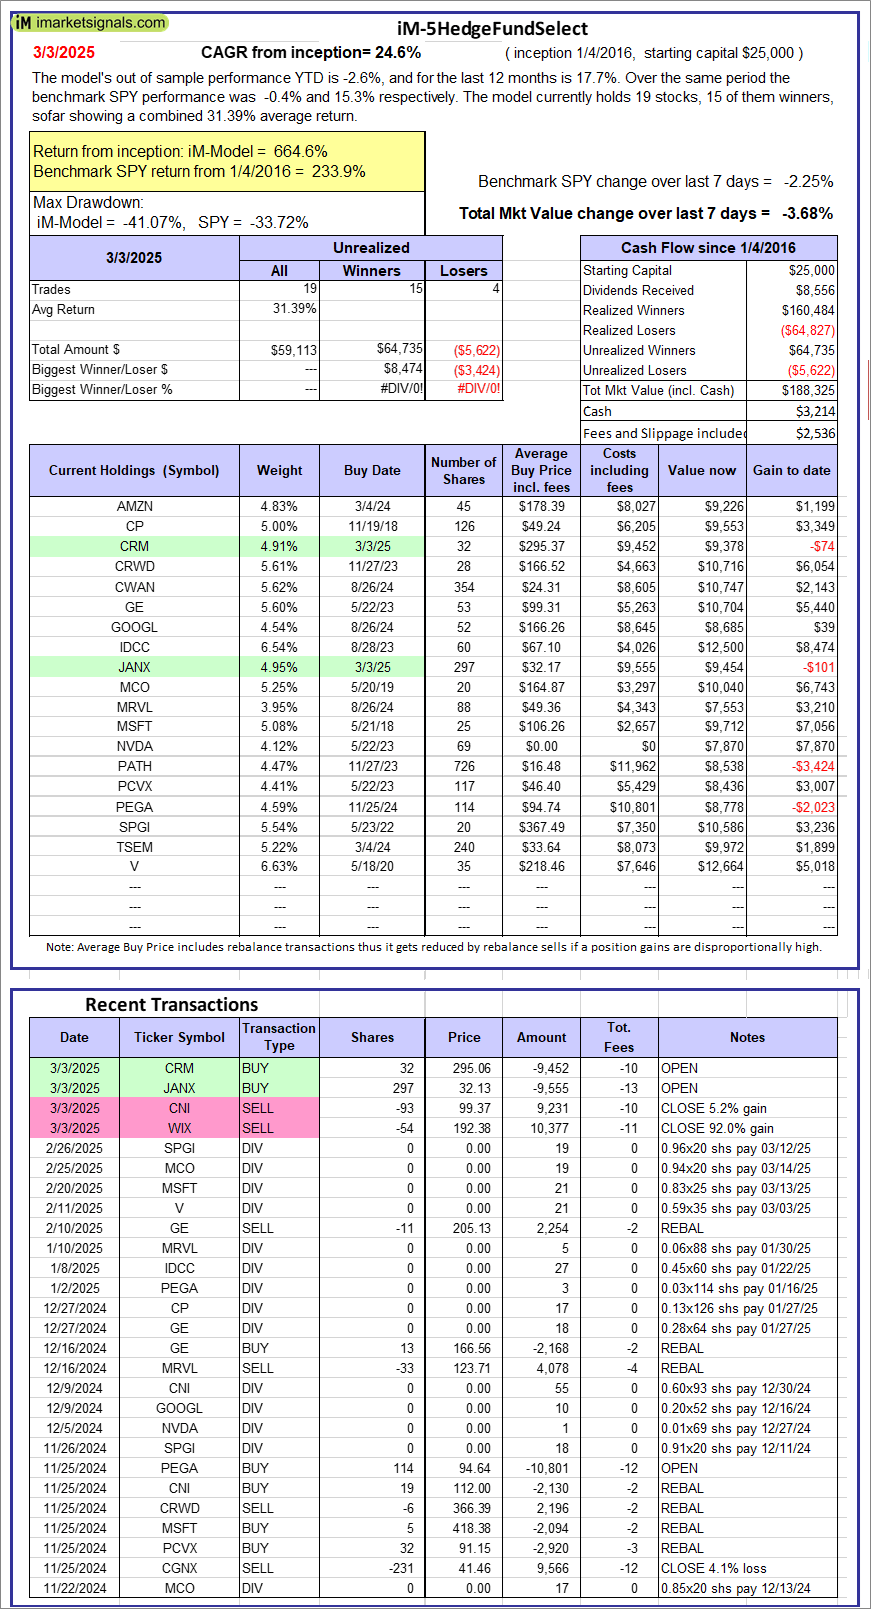  |
iM-5HedgeFundSelect: Since inception, on 1/5/2016, the model gained 664.60% while the benchmark SPY gained 233.93% over the same period. Over the previous week the market value of iM-5HedgeFundSelect gained -3.68% at a time when SPY gained -2.25%. A starting capital of $25,000 at inception on 1/5/2016 would have grown to $188,325 which includes $3,214 cash and excludes $2,536 spent on fees and slippage. |
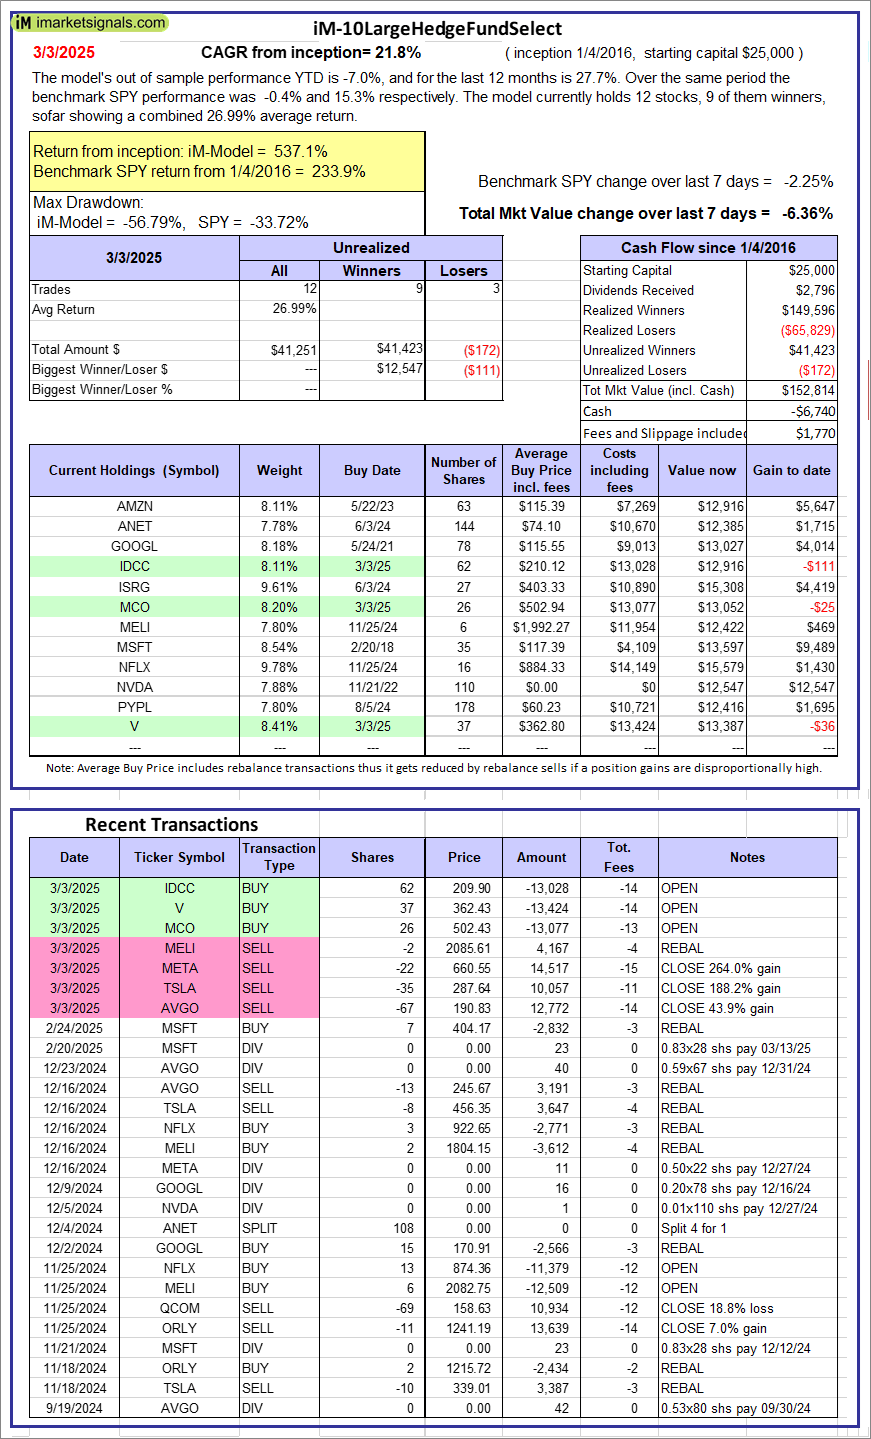  |
iM-10LargeHedgeFundSelect: Since inception, on 1/5/2016, the model gained 537.05% while the benchmark SPY gained 233.93% over the same period. Over the previous week the market value of iM-10LargeHedgeFundSelect gained -6.36% at a time when SPY gained -2.25%. A starting capital of $25,000 at inception on 1/5/2016 would have grown to $152,814 which includes -$6,740 cash and excludes $1,770 spent on fees and slippage. |
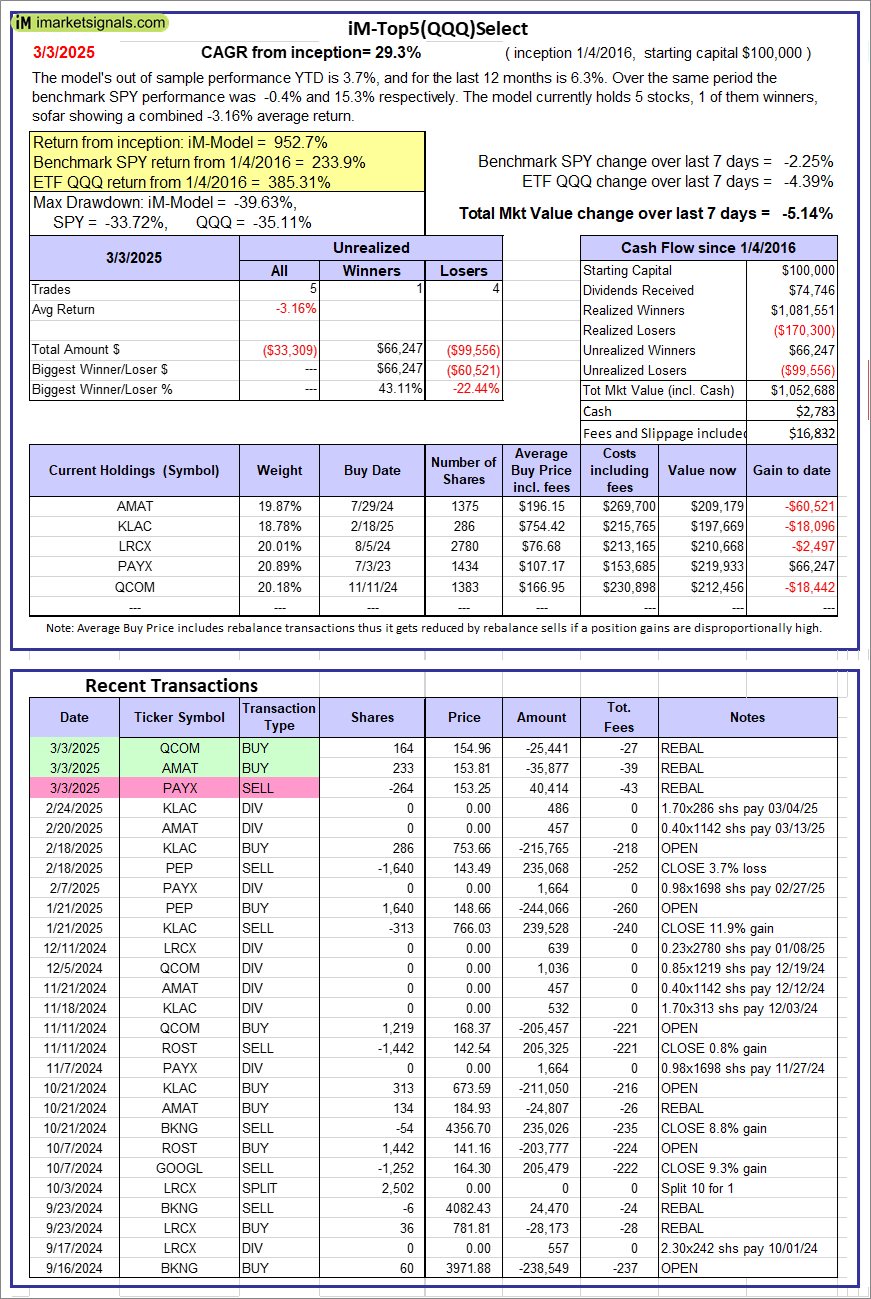  |
iM-Top5(QQQ)Select: Since inception, on 1/5/2016, the model gained 952.69% while the benchmark SPY gained 233.93% over the same period. Over the previous week the market value of iM-Top5(QQQ)Select gained -5.14% at a time when SPY gained -2.25%. A starting capital of $100,000 at inception on 1/5/2016 would have grown to $1,052,688 which includes $2,783 cash and excludes $16,832 spent on fees and slippage. |
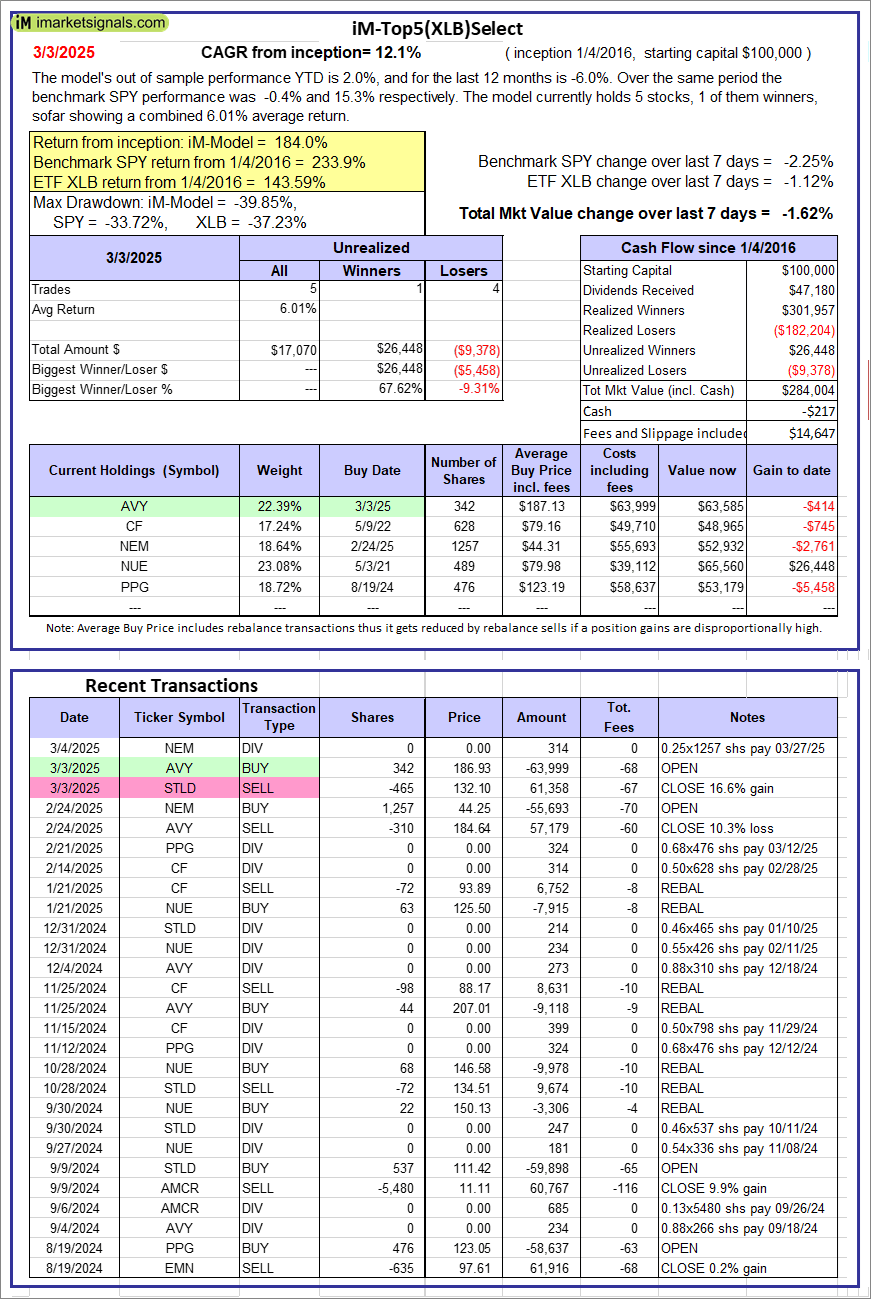  |
iM-Top5(XLB)Select: Since inception, on 1/5/2016, the model gained 184.00% while the benchmark SPY gained 233.93% over the same period. Over the previous week the market value of iM-Top5(XLB)Select gained -1.62% at a time when SPY gained -2.25%. A starting capital of $100,000 at inception on 1/5/2016 would have grown to $284,004 which includes -$217 cash and excludes $14,647 spent on fees and slippage. |
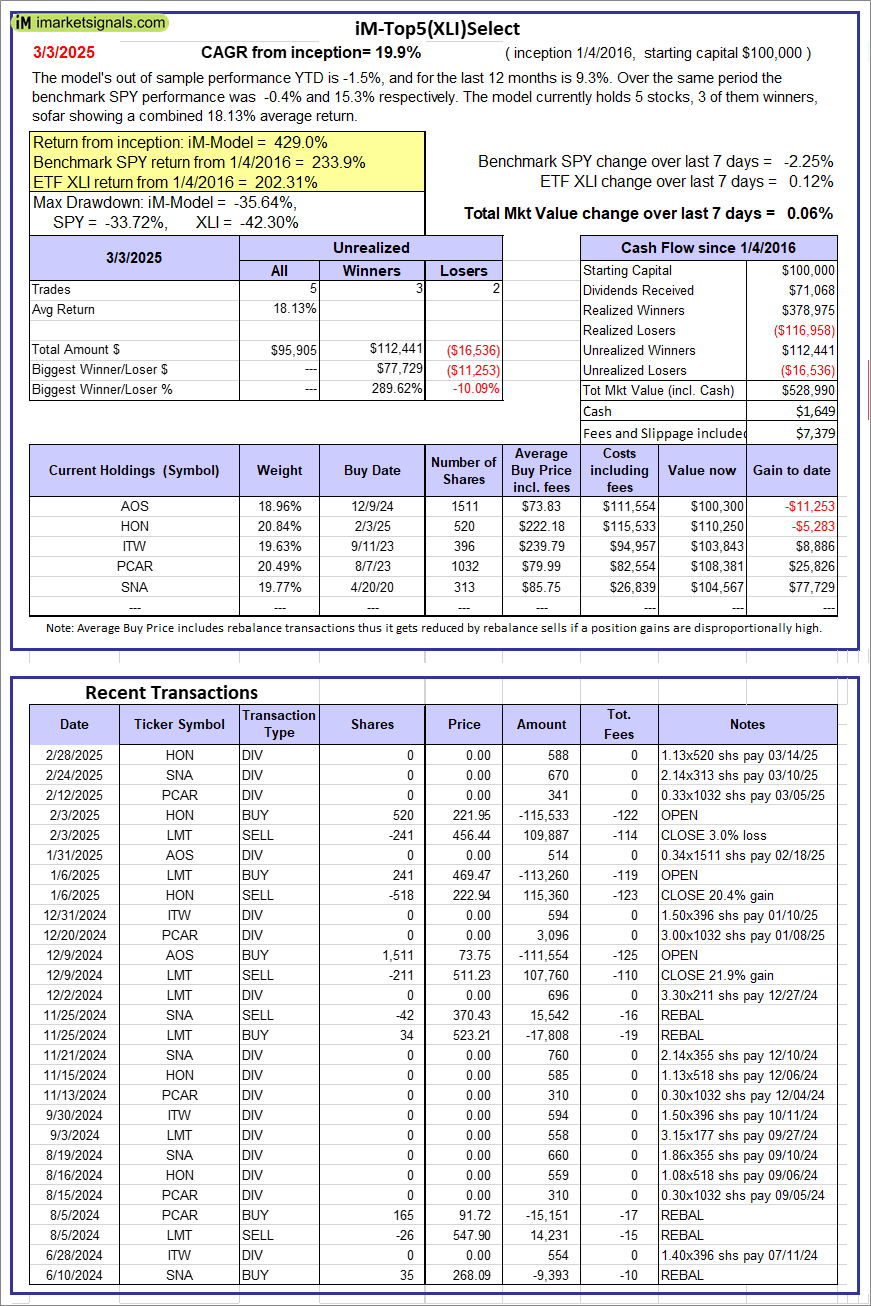  |
iM-Top5(XLI)Select: Since inception, on 1/5/2016, the model gained 428.99% while the benchmark SPY gained 233.93% over the same period. Over the previous week the market value of iM-Top5(XLI)Select gained 0.06% at a time when SPY gained -2.25%. A starting capital of $100,000 at inception on 1/5/2016 would have grown to $528,990 which includes $1,649 cash and excludes $7,379 spent on fees and slippage. |
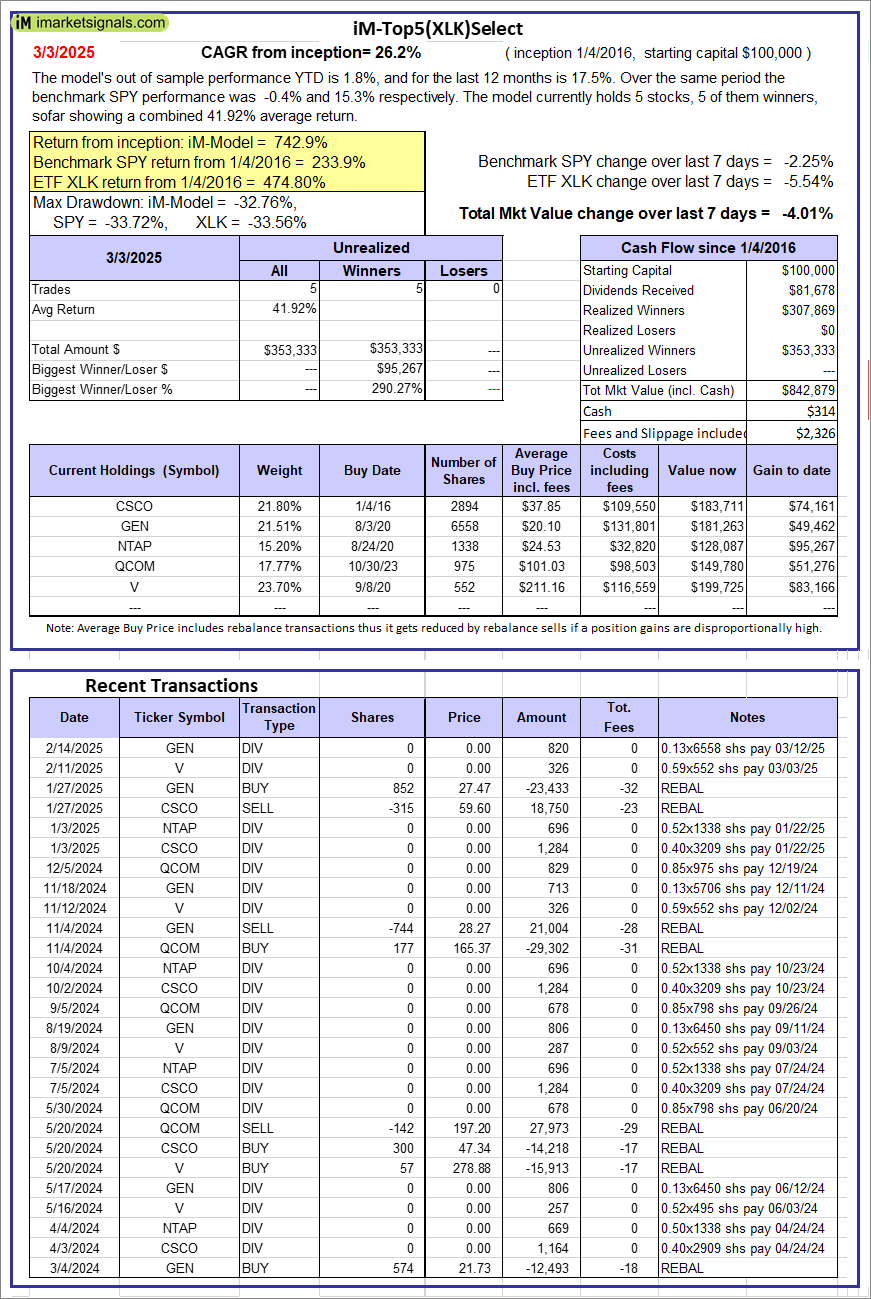  |
iM-Top5(XLK)Select: Since inception, on 1/5/2016, the model gained 742.88% while the benchmark SPY gained 233.93% over the same period. Over the previous week the market value of iM-Top5(XLK)Select gained -4.01% at a time when SPY gained -2.25%. A starting capital of $100,000 at inception on 1/5/2016 would have grown to $842,879 which includes $314 cash and excludes $2,326 spent on fees and slippage. |
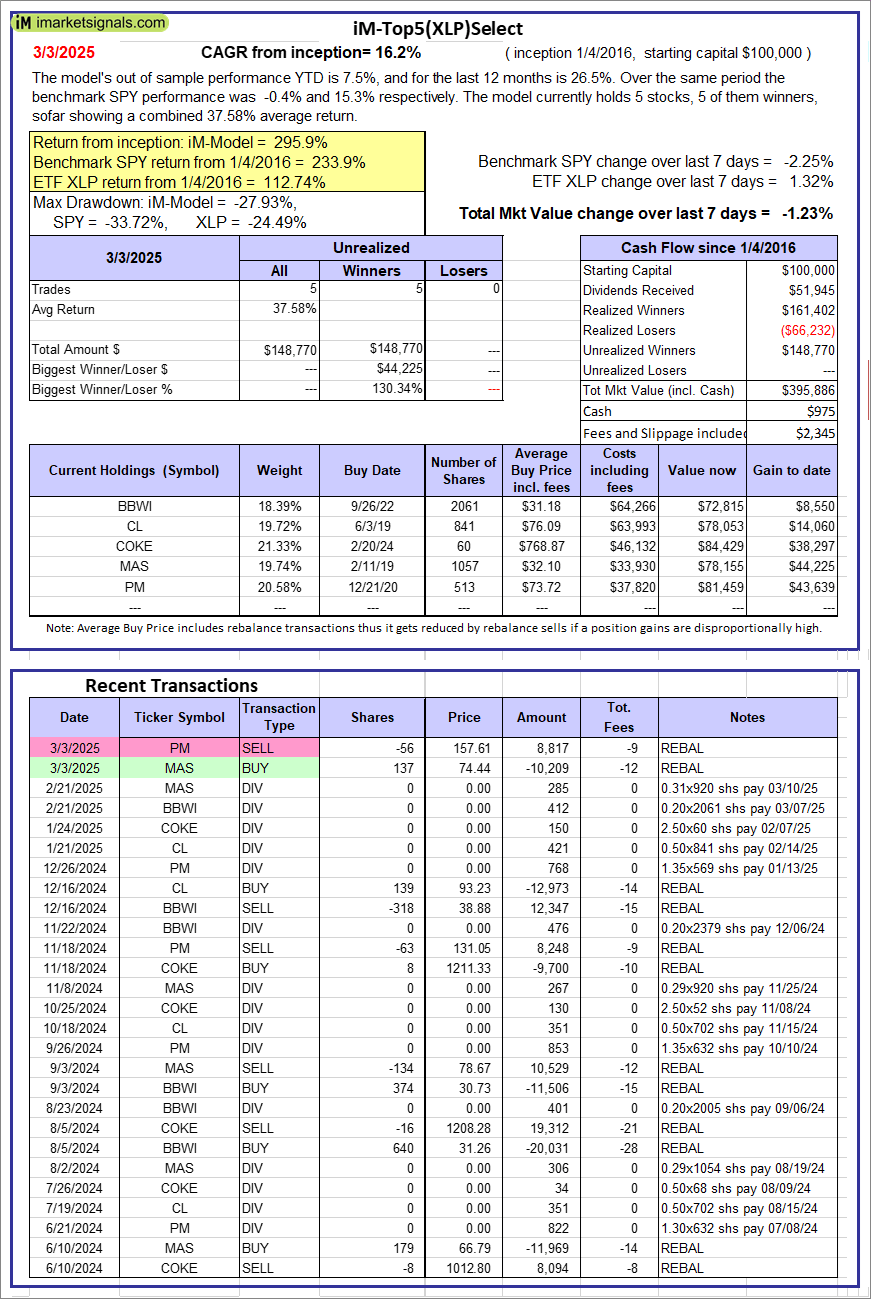  |
iM-Top5(XLP)Select: Since inception, on 1/5/2016, the model gained 295.89% while the benchmark SPY gained 233.93% over the same period. Over the previous week the market value of iM-Top5(XLP)Select gained -1.23% at a time when SPY gained -2.25%. A starting capital of $100,000 at inception on 1/5/2016 would have grown to $395,886 which includes $975 cash and excludes $2,345 spent on fees and slippage. |
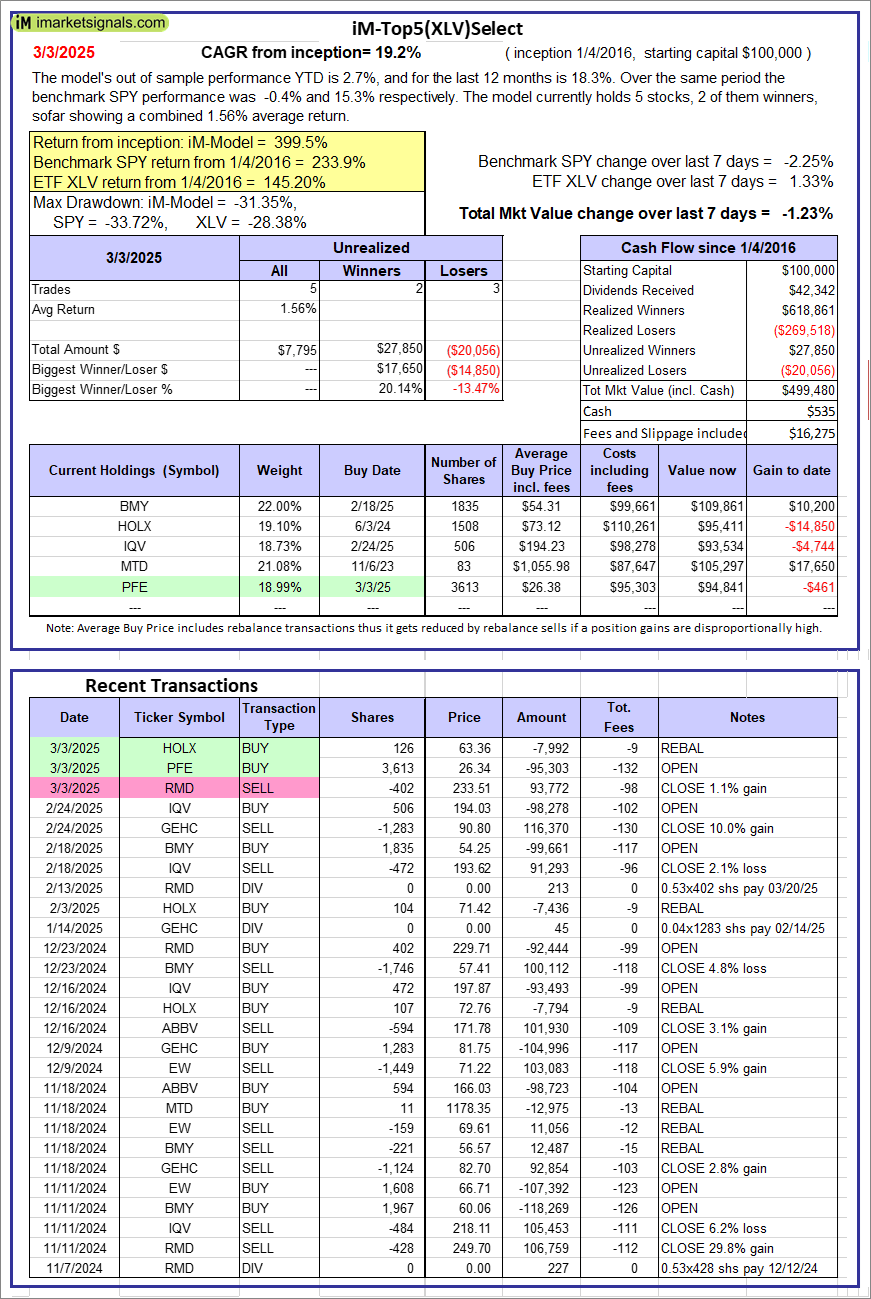  |
iM-Top5(XLV)Select: Since inception, on 1/5/2016, the model gained 399.48% while the benchmark SPY gained 233.93% over the same period. Over the previous week the market value of iM-Top5(XLV)Select gained -1.23% at a time when SPY gained -2.25%. A starting capital of $100,000 at inception on 1/5/2016 would have grown to $499,480 which includes $535 cash and excludes $16,275 spent on fees and slippage. |
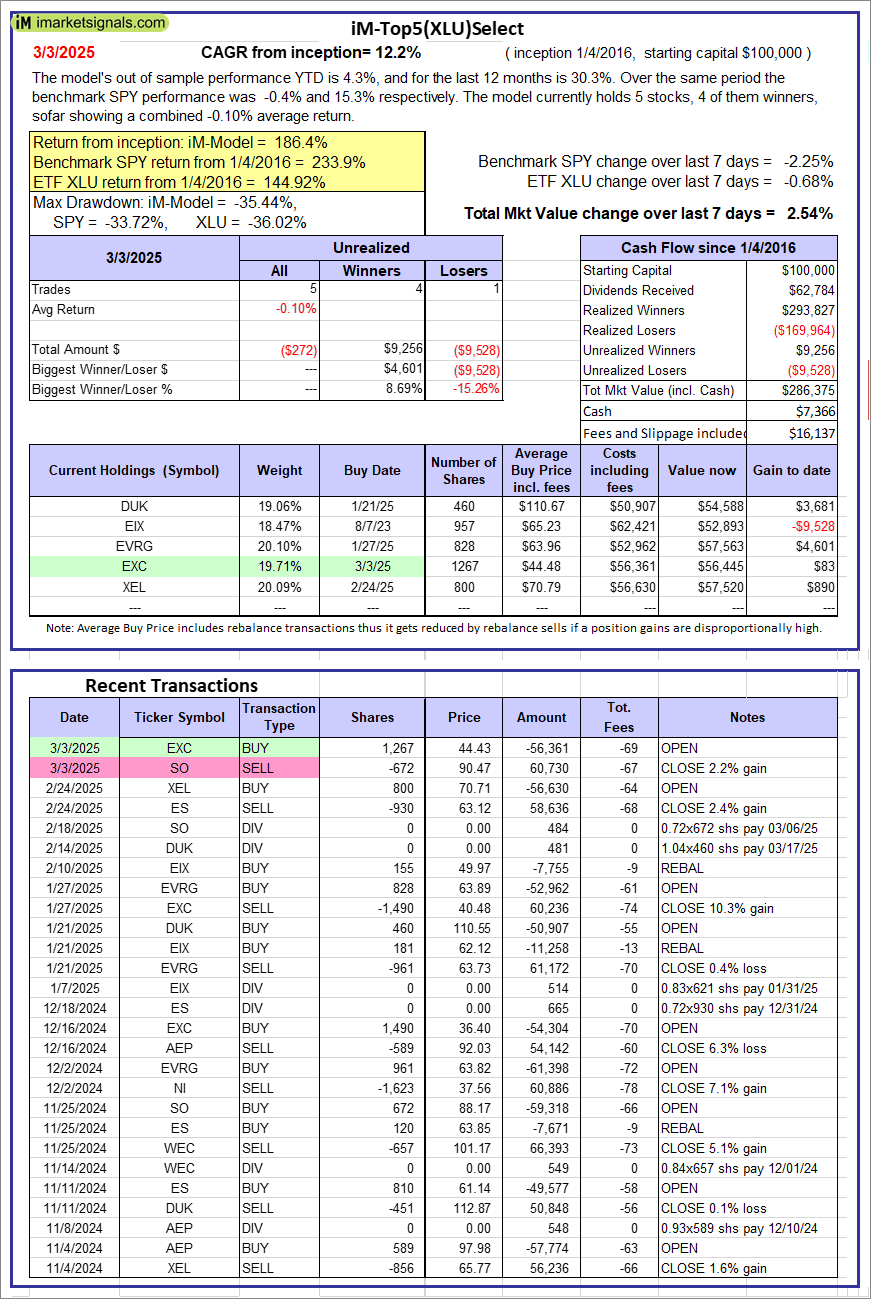  |
iM-Top5(XLU)Select: Since inception, on 1/5/2016, the model gained 186.37% while the benchmark SPY gained 233.93% over the same period. Over the previous week the market value of iM-Top5(XLU)Select gained 2.54% at a time when SPY gained -2.25%. A starting capital of $100,000 at inception on 1/5/2016 would have grown to $286,375 which includes $7,366 cash and excludes $16,137 spent on fees and slippage. |
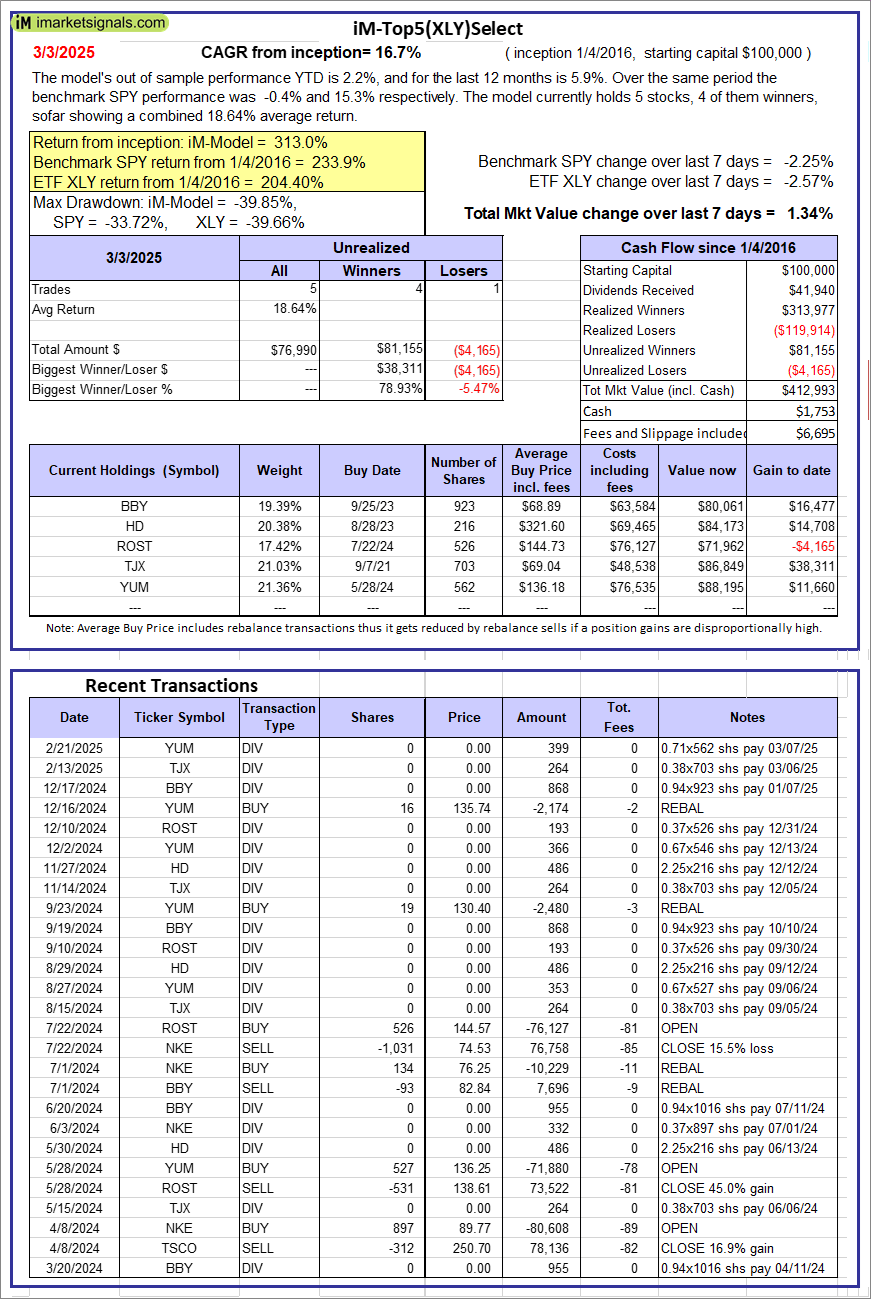  |
iM-Top5(XLY)Select: Since inception, on 1/5/2016, the model gained 312.99% while the benchmark SPY gained 233.93% over the same period. Over the previous week the market value of iM-Top5(XLY)Select gained 1.34% at a time when SPY gained -2.25%. A starting capital of $100,000 at inception on 1/5/2016 would have grown to $412,993 which includes $1,753 cash and excludes $6,695 spent on fees and slippage. |
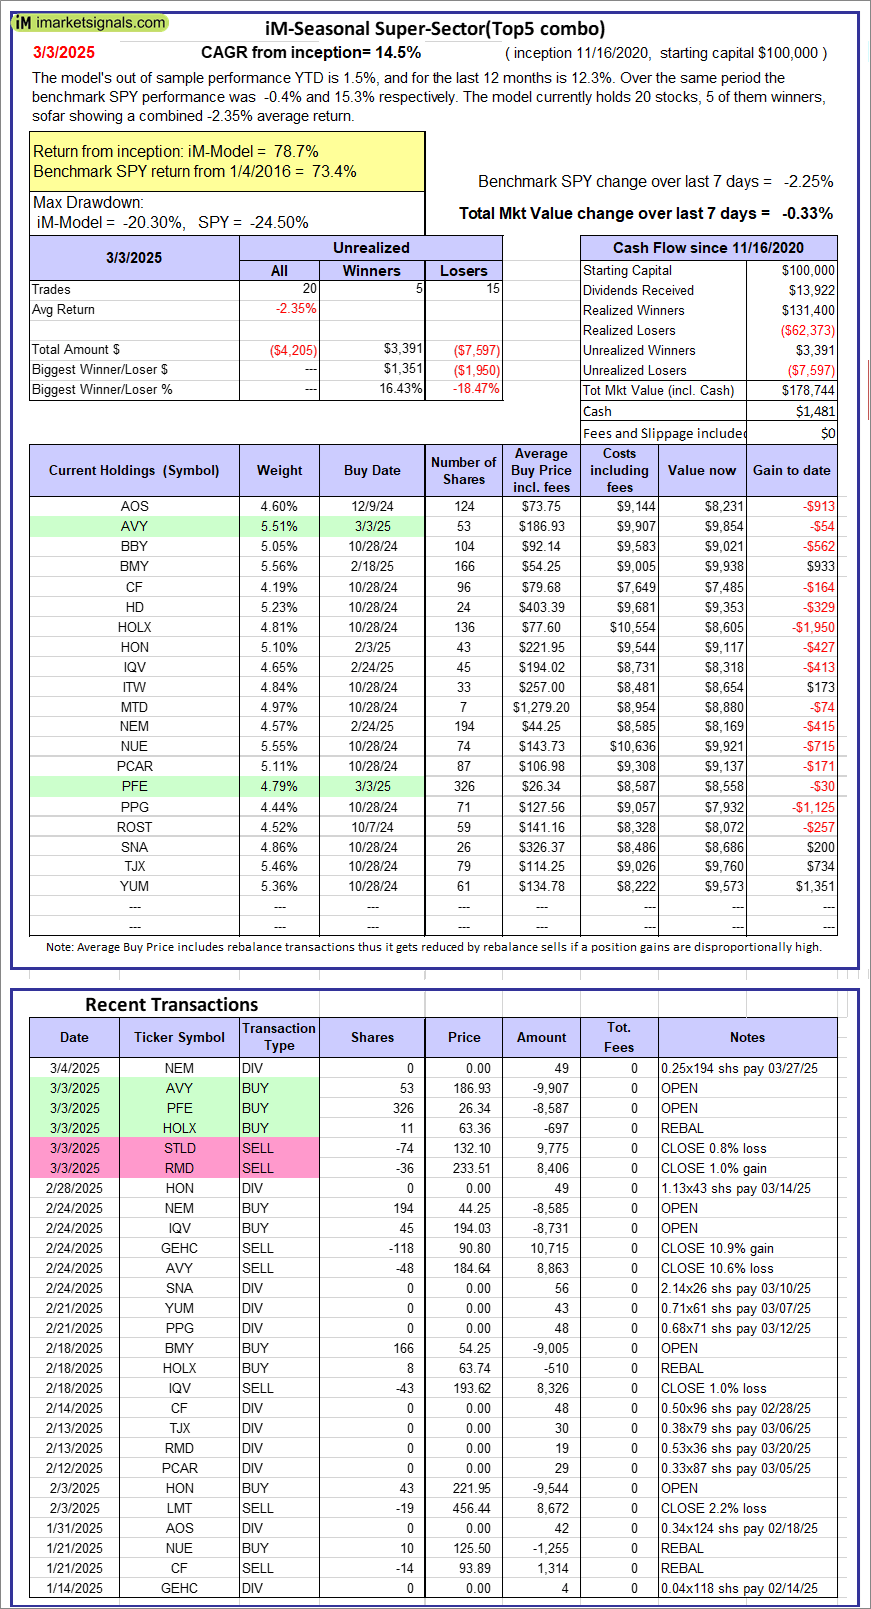 |
iM-Seasonal Super-Sectors (Top5 combo) : Since inception, on 11/17/2020, the model gained 78.74% while the benchmark SPY gained 73.35% over the same period. Over the previous week the market value of iM-Seasonal Super-Sectors (Top5 combo) gained -0.33% at a time when SPY gained -2.25%. A starting capital of $100,000 at inception on 11/17/2020 would have grown to $178,744 which includes $1,481 cash and excludes $00 spent on fees and slippage. |
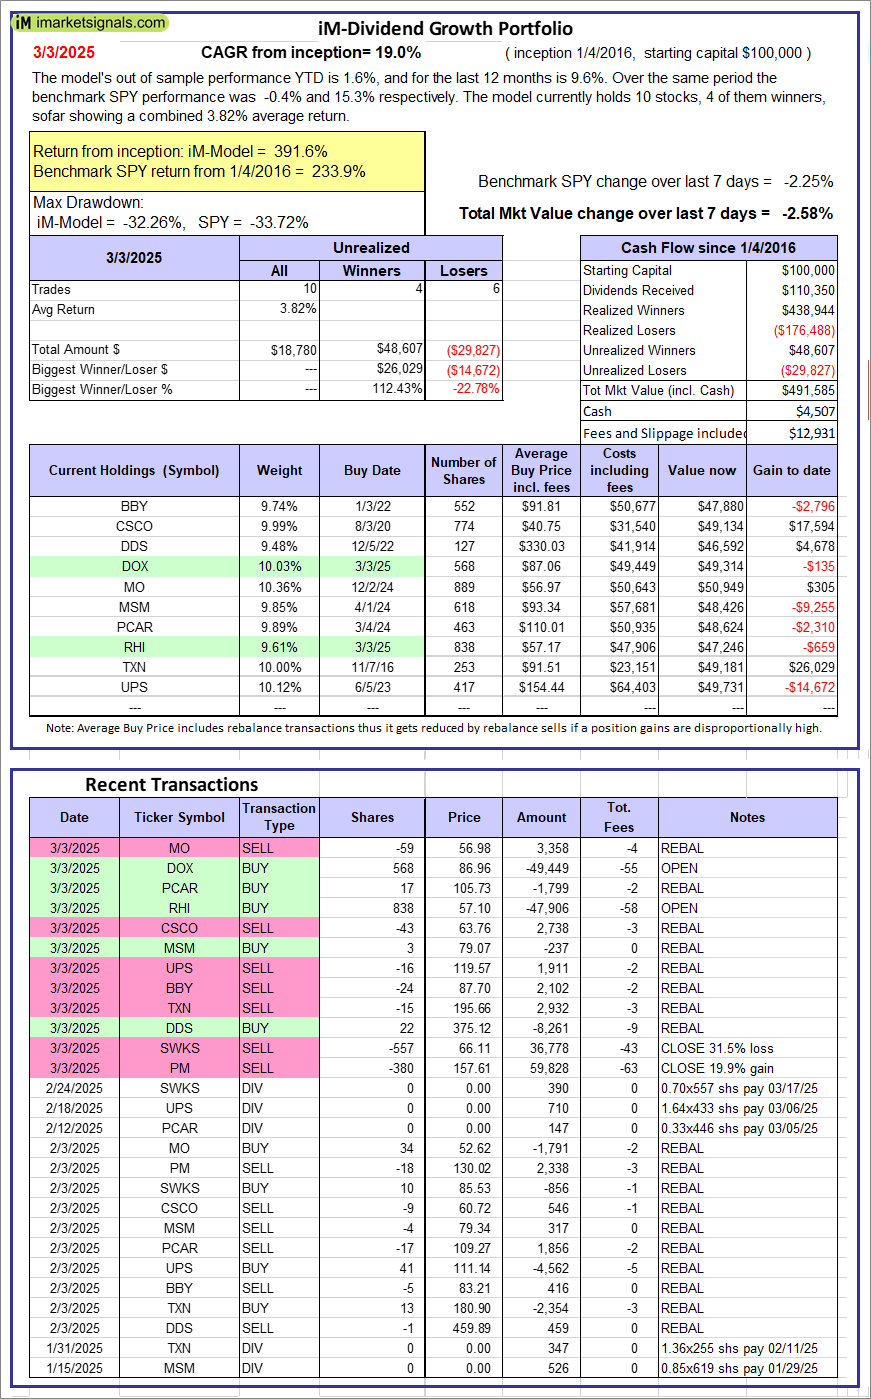 |
iM-Dividend Growth Portfolio: The model’s out of sample performance YTD is 1.6%, and for the last 12 months is 9.6%. Over the same period the benchmark SPY performance was -0.4% and 15.3% respectively. Over the previous week the market value of the iM-Dividend Growth Portfolio gained -2.58% at a time when SPY gained -2.25%. A starting capital of $100,000 at inception on 6/30/2016 would have grown to $491,585 which includes $4,507 cash and excludes $12,931 spent on fees and slippage. |
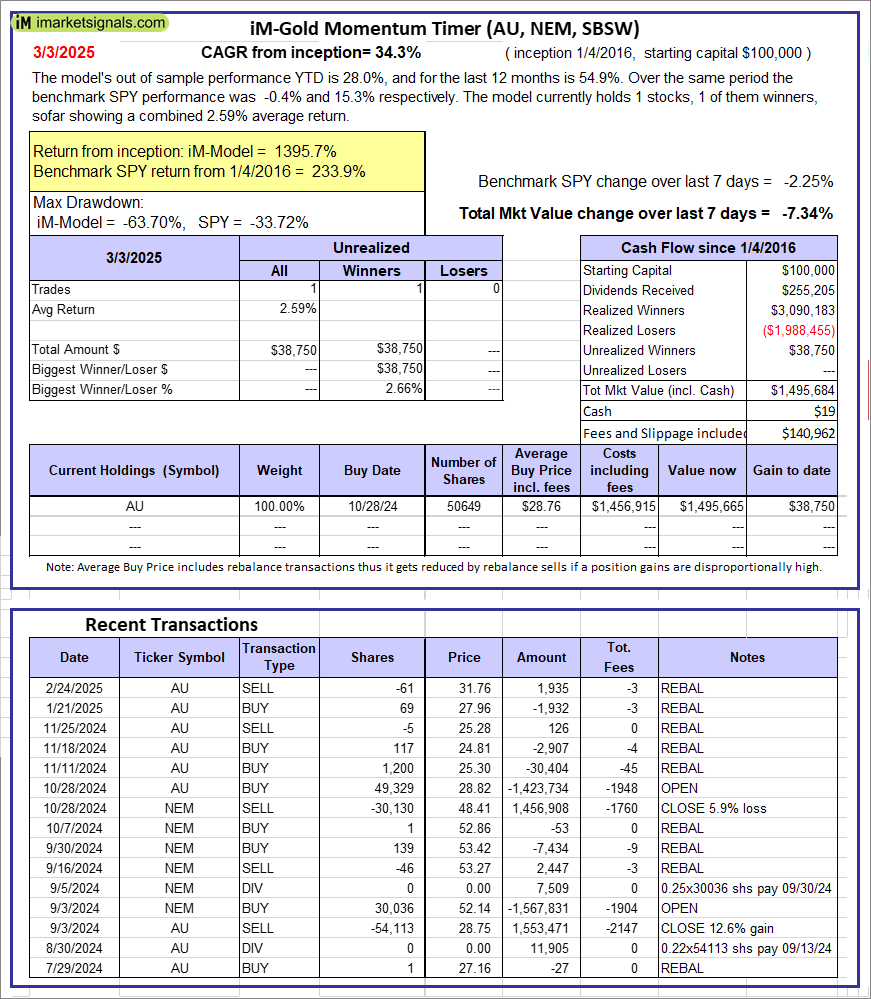 |
iM-Gold Momentum Timer (AU, NEM, SBSW): The model’s out of sample performance YTD is 28.0%, and for the last 12 months is 54.9%. Over the same period the benchmark SPY performance was -0.4% and 15.3% respectively. Over the previous week the market value of iM-Gold Momentum Timer (AU, NEM, SBSW) gained -7.34% at a time when SPY gained -2.25%. A starting capital of $100,000 at inception on 6/30/2016 would have grown to $19 which includes $140,962 cash and excludes Gain to date spent on fees and slippage. |
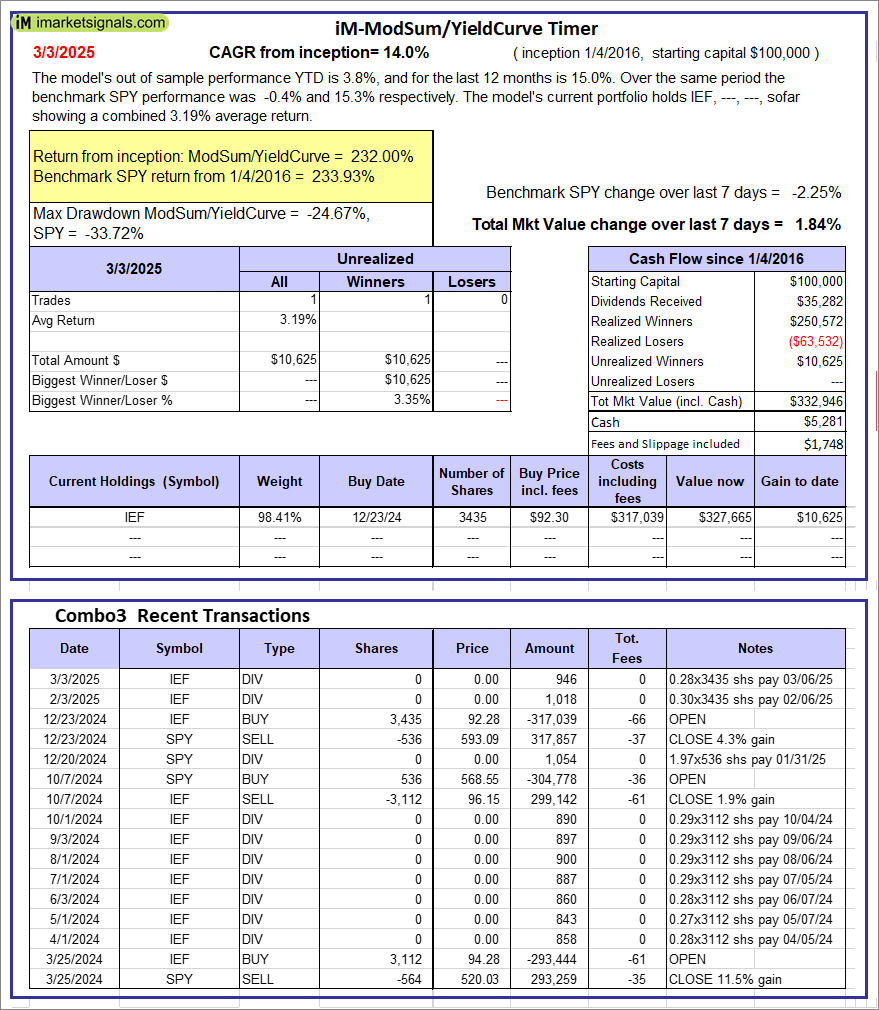 |
iM-ModSum/YieldCurve Timer: The model’s out of sample performance YTD is 3.8%, and for the last 12 months is 15.0%. Over the same period the benchmark SPY performance was -0.4% and 15.3% respectively. Over the previous week the market value of iM-PortSum/YieldCurve Timer gained 1.84% at a time when SPY gained -2.25%. A starting capital of $100,000 at inception on 1/1/2016 would have grown to $332,946 which includes $5,281 cash and excludes $1,748 spent on fees and slippage. |
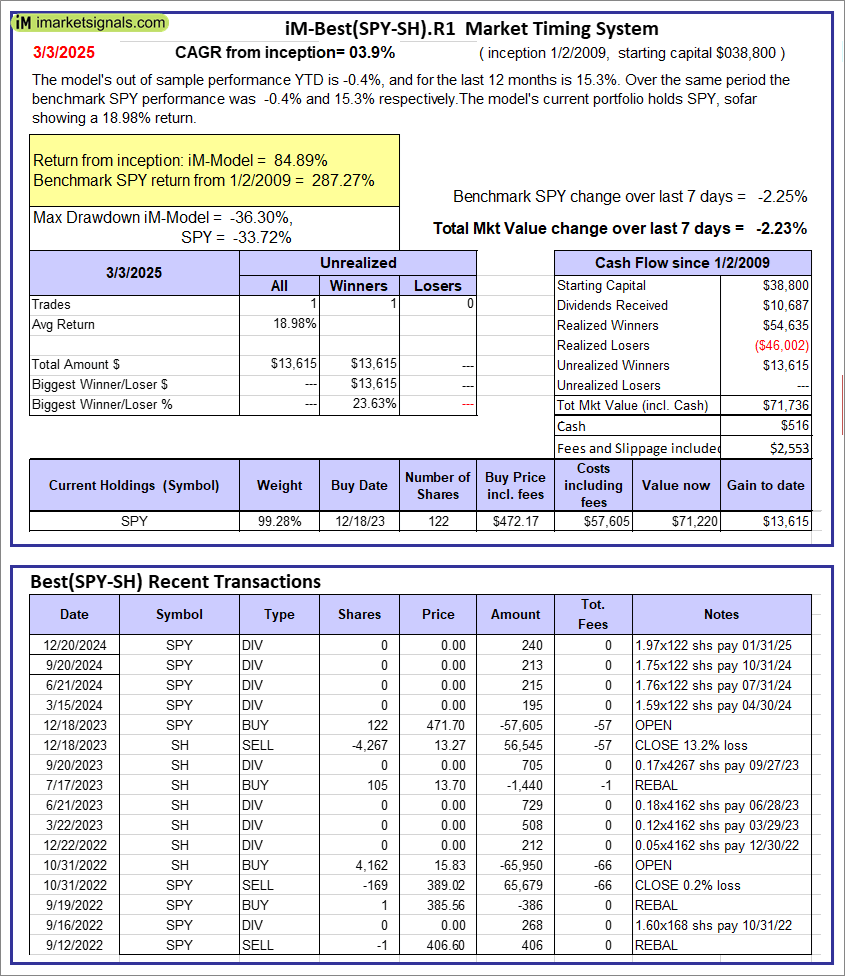 |
iM-Best(SPY-SH).R1: The model’s out of sample performance YTD is -0.4%, and for the last 12 months is 15.3%. Over the same period the benchmark SPY performance was -0.4% and 15.3% respectively. Over the previous week the market value of Best(SPY-SH) gained -2.23% at a time when SPY gained -2.25%. A starting capital of $100,000 at inception on 1/2/2009 would have grown to $71,736 which includes $516 cash and excludes $2,553 spent on fees and slippage. |
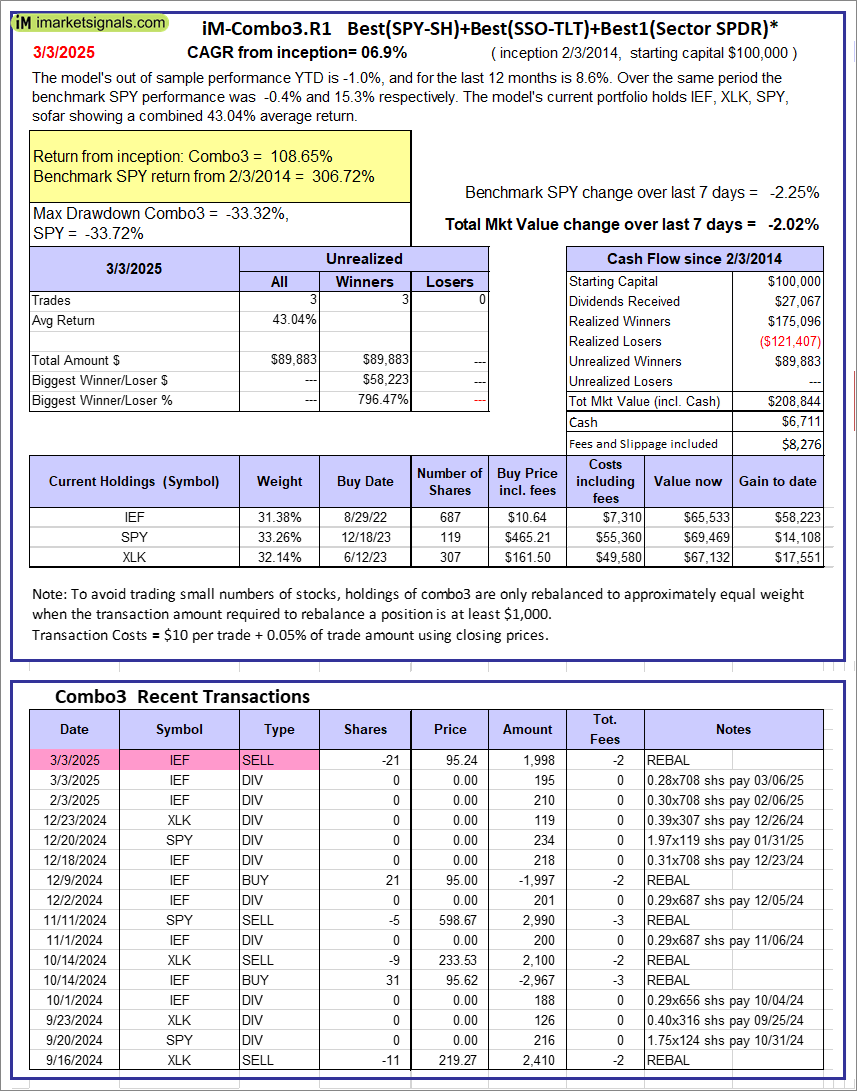 |
iM-Combo3.R1: The model’s out of sample performance YTD is -1.0%, and for the last 12 months is 8.6%. Over the same period the benchmark SPY performance was -0.4% and 15.3% respectively. Over the previous week the market value of iM-Combo3.R1 gained -2.02% at a time when SPY gained -2.25%. A starting capital of $100,000 at inception on 2/3/2014 would have grown to $208,844 which includes $6,711 cash and excludes $8,276 spent on fees and slippage. |
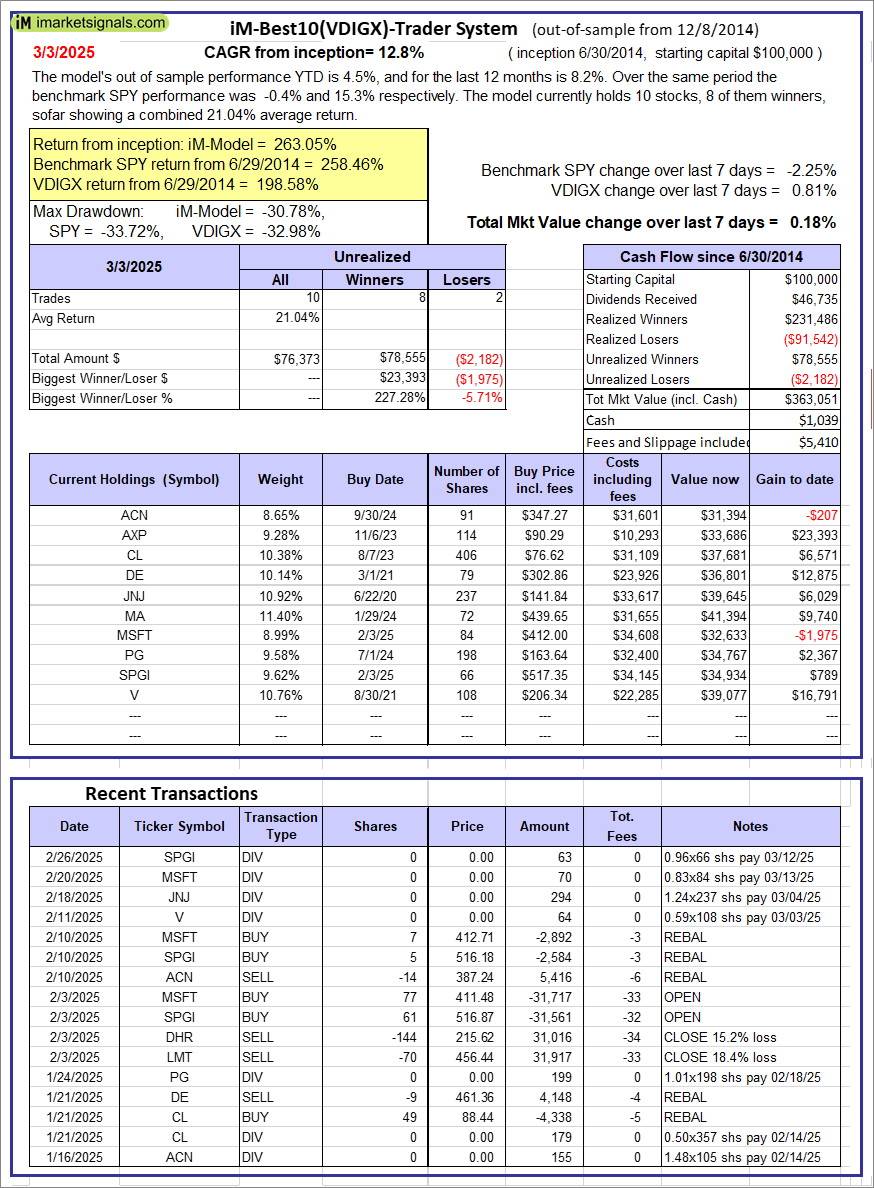  |
iM-Best10(VDIGX)-Trader: The model’s out of sample performance YTD is 4.5%, and for the last 12 months is 8.2%. Over the same period the benchmark SPY performance was -0.4% and 15.3% respectively. Since inception, on 7/1/2014, the model gained 263.05% while the benchmark SPY gained 258.46% and VDIGX gained 198.58% over the same period. Over the previous week the market value of iM-Best10(VDIGX) gained 0.18% at a time when SPY gained -2.25%. A starting capital of $100,000 at inception on 7/1/2014 would have grown to $363,051 which includes $1,039 cash and excludes $5,410 spent on fees and slippage. |
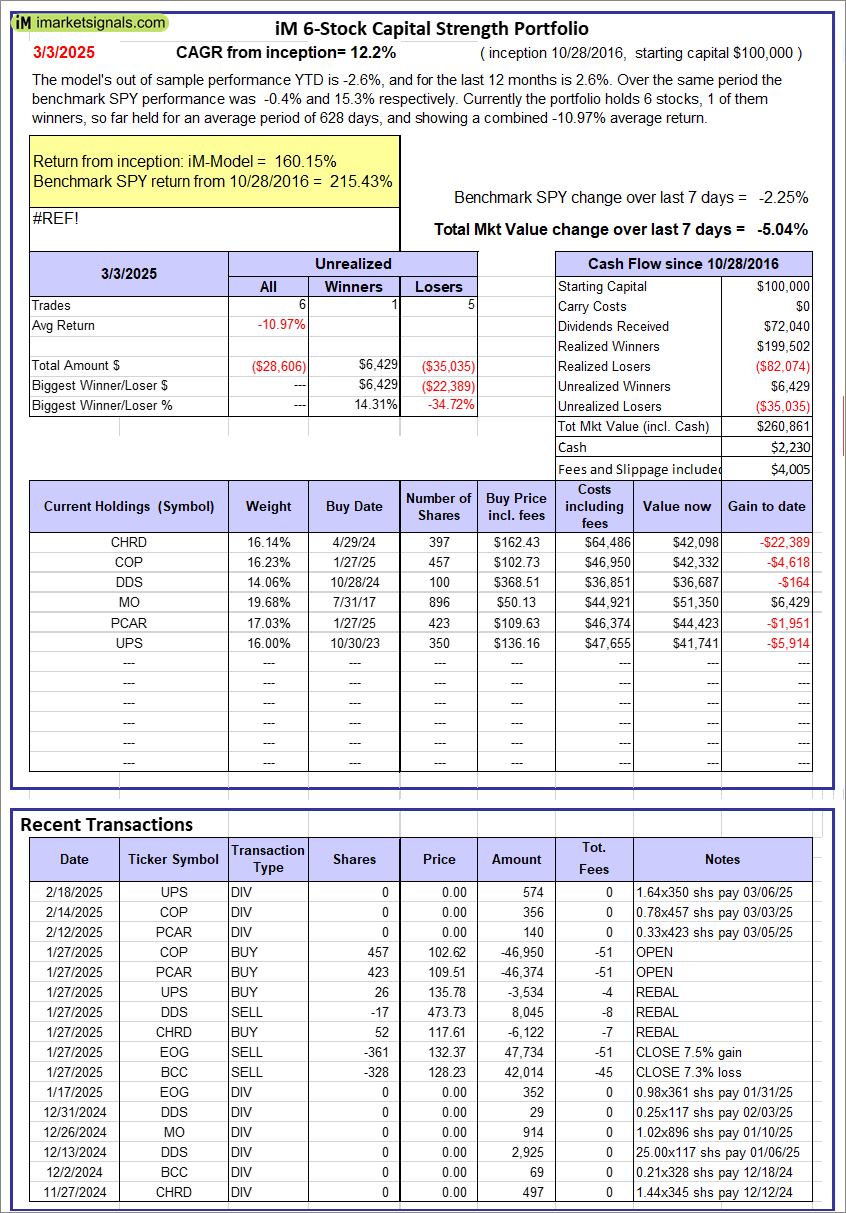 |
iM 6-Stock Capital Strength Portfolio: The model’s out of sample performance YTD is -2.6%, and for the last 12 months is 2.6%. Over the same period the benchmark SPY performance was -0.4% and 15.3% respectively. Over the previous week the market value of the iM 6-Stock Capital Strength Portfolio gained -5.04% at a time when SPY gained -2.25%. A starting capital of $100,000 at inception on 10/28/2016 would have grown to $260,861 which includes $2,230 cash and excludes $4,005 spent on fees and slippage. |
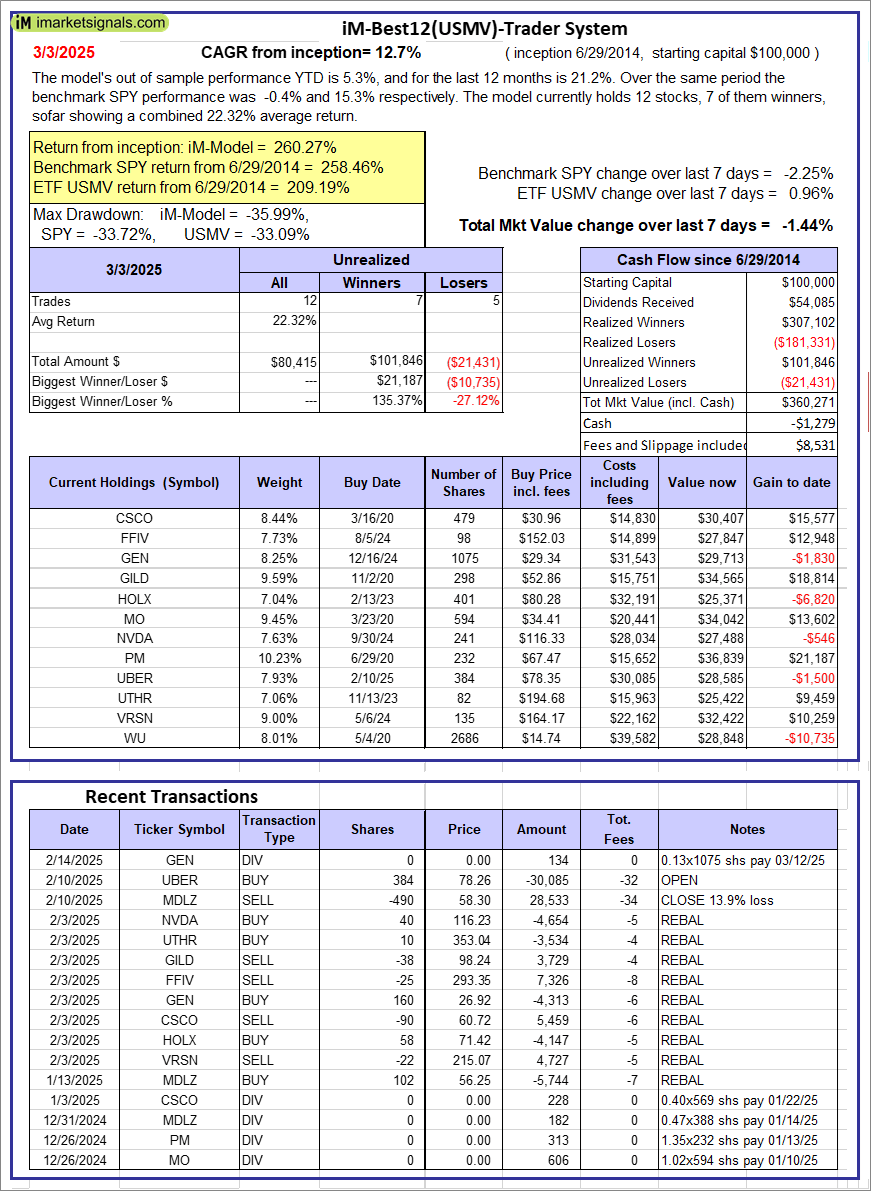  |
iM-Best12(USMV)-Trader: The model’s out of sample performance YTD is 5.3%, and for the last 12 months is 21.2%. Over the same period the benchmark SPY performance was -0.4% and 15.3% respectively. Since inception, on 6/30/2014, the model gained 260.27% while the benchmark SPY gained 258.46% and the ETF USMV gained 209.19% over the same period. Over the previous week the market value of iM-Best12(USMV)-Trader gained -1.44% at a time when SPY gained -2.25%. A starting capital of $100,000 at inception on 6/30/2014 would have grown to $360,271 which includes -$1,279 cash and excludes $8,531 spent on fees and slippage. |
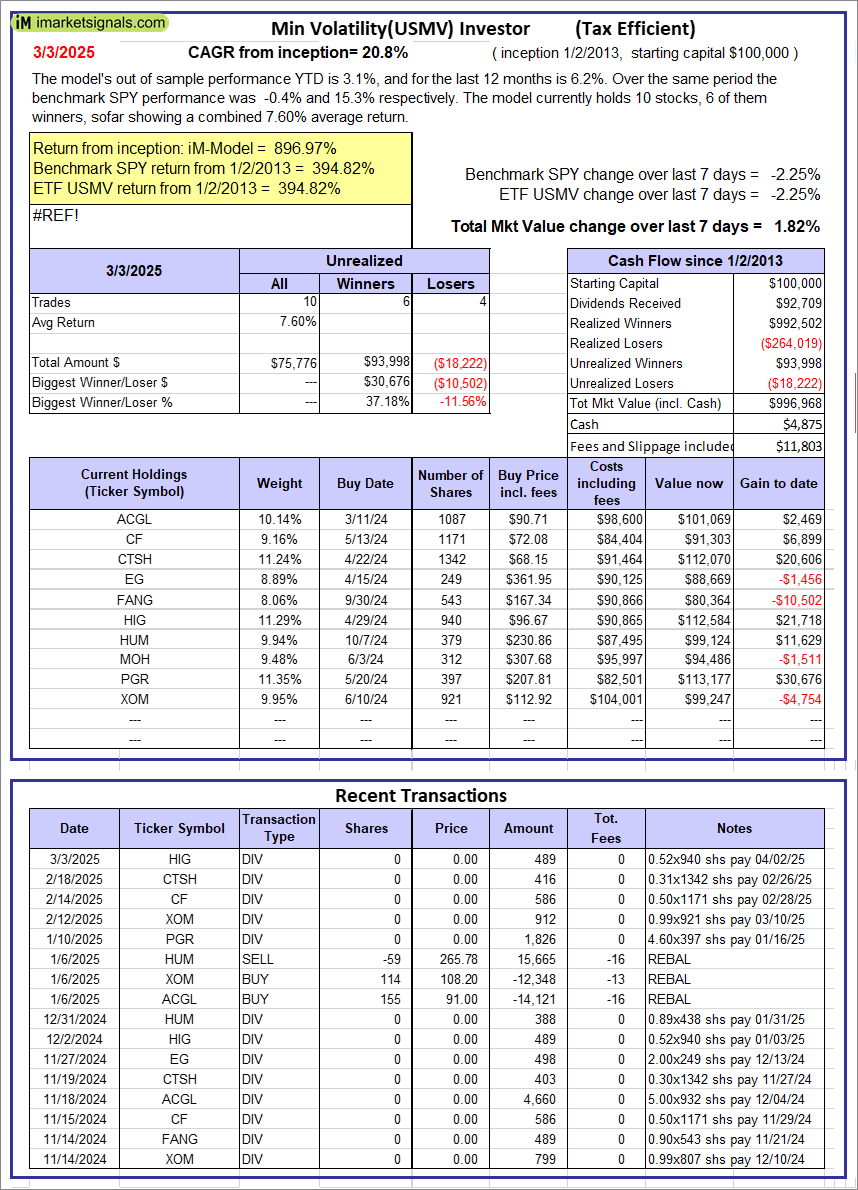  |
iM-Min Volatility(USMV) Investor (Tax Efficient): The model’s out of sample performance YTD is 3.1%, and for the last 12 months is 6.2%. Over the same period the benchmark SPY performance was -0.4% and 15.3% respectively. Since inception, on 1/3/2013, the model gained 896.97% while the benchmark SPY gained 394.82% and the ETF USMV gained 394.82% over the same period. Over the previous week the market value of iM-Best12(USMV)Q1 gained 1.82% at a time when SPY gained -2.25%. A starting capital of $100,000 at inception on 1/3/2013 would have grown to $996,968 which includes $4,875 cash and excludes $11,803 spent on fees and slippage. |
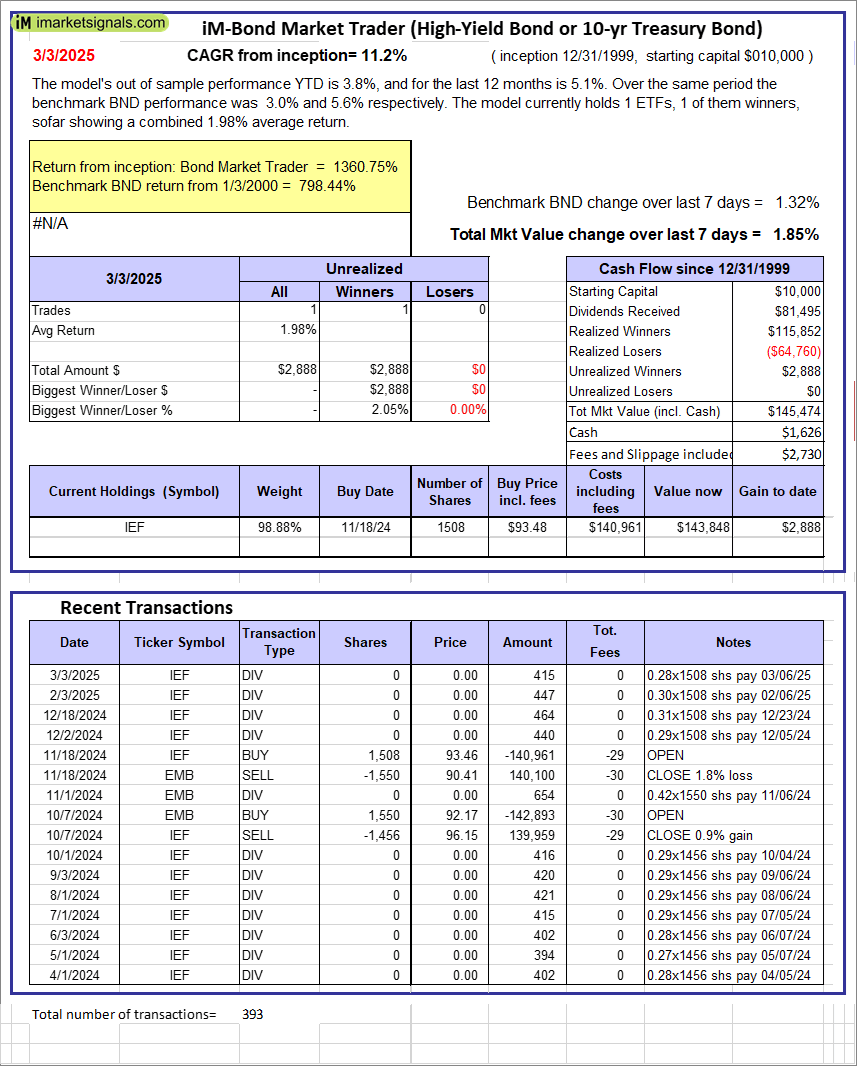 |
iM-Bond Market Trader (High-Yield Bond or 10-yr Treasury Bond): The model’s out of sample performance YTD is 3.8%, and for the last 12 months is 5.1%. Over the same period the benchmark BND performance was 3.0% and 5.6% respectively. Over the previous week the market value of the iM-Bond Market Trader (High-Yield Bond or 10-yr Treasury Bond) gained 1.85% at a time when BND gained 1.32%. A starting capital of $10,000 at inception on 1/3/2000 would have grown to $145,474 which includes $1,626 cash and excludes $2,730 spent on fees and slippage. |
|
|
iM-ModSum/YieldCurve Timer: The model’s out of sample performance YTD is 3.8%, and for the last 12 months is 15.0%. Over the same period the benchmark SPY performance was -0.4% and 15.3% respectively. Over the previous week the market value of iM-PortSum/YieldCurve Timer gained 1.84% at a time when SPY gained -2.25%. A starting capital of $100,000 at inception on 1/1/2016 would have grown to $332,946 which includes $5,281 cash and excludes $1,748 spent on fees and slippage. |
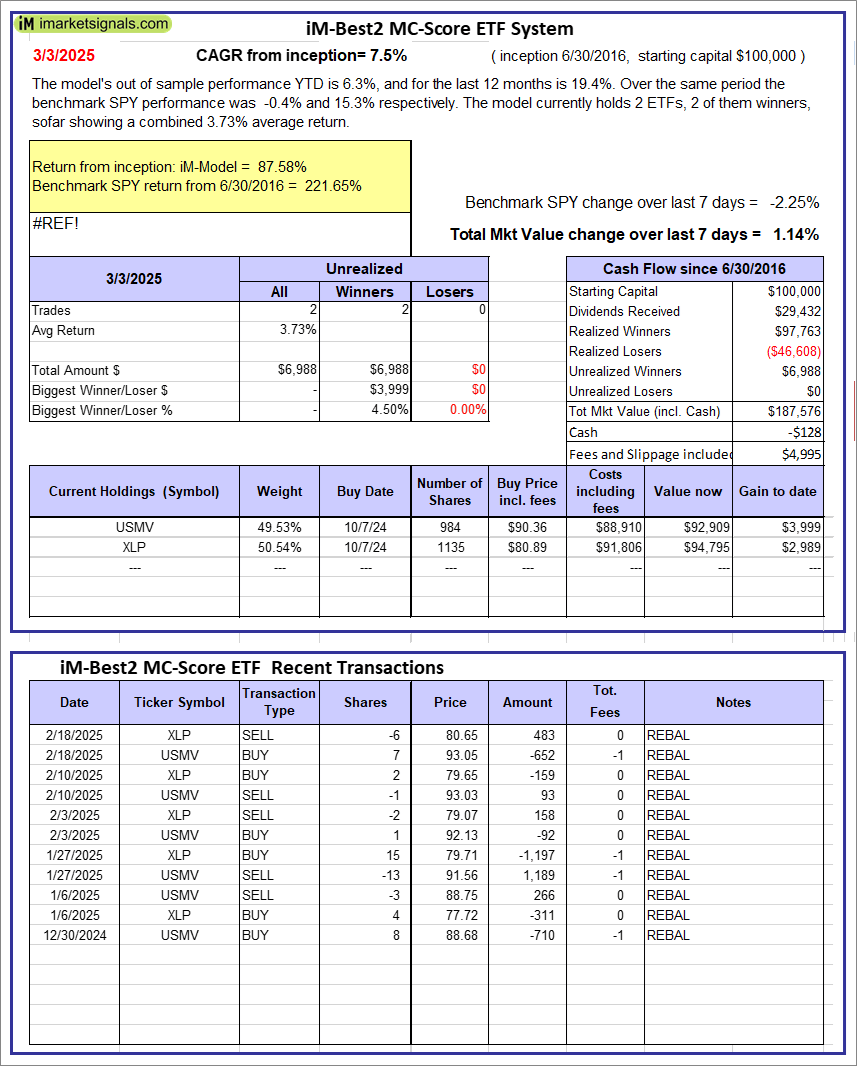 |
iM-Best2 MC-Score ETF System: The model’s out of sample performance YTD is 6.3%, and for the last 12 months is 19.4%. Over the same period the benchmark SPY performance was -0.4% and 15.3% respectively. Over the previous week the market value of the iM-Best2 MC-Score ETF System gained 1.14% at a time when SPY gained -2.25%. A starting capital of $100,000 at inception on 6/30/2016 would have grown to $187,576 which includes -$128 cash and excludes $4,995 spent on fees and slippage. |
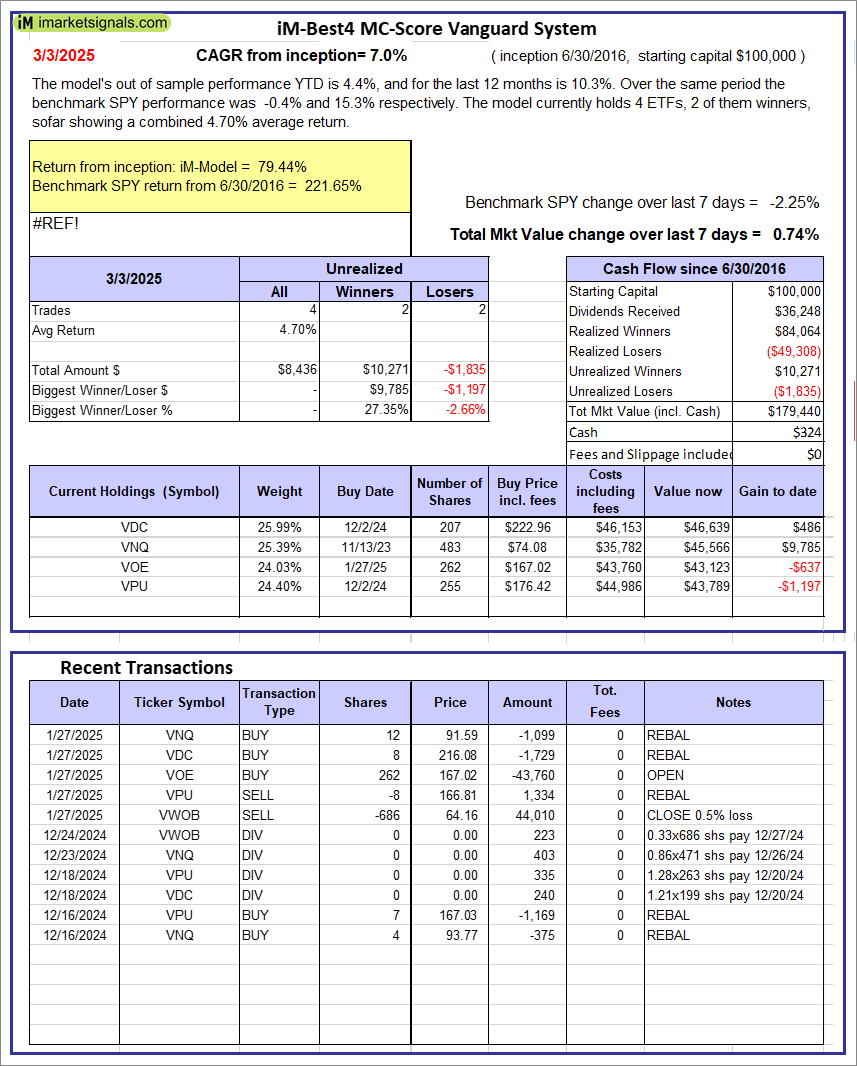 |
iM-Best4 MC-Score Vanguard System: The model’s out of sample performance YTD is 4.4%, and for the last 12 months is 10.3%. Over the same period the benchmark SPY performance was -0.4% and 15.3% respectively. Over the previous week the market value of the iM-Best4 MC-Score Vanguard System gained 0.74% at a time when SPY gained -2.25%. A starting capital of $100,000 at inception on 6/30/2016 would have grown to $179,440 which includes $324 cash and excludes $00 spent on fees and slippage. |
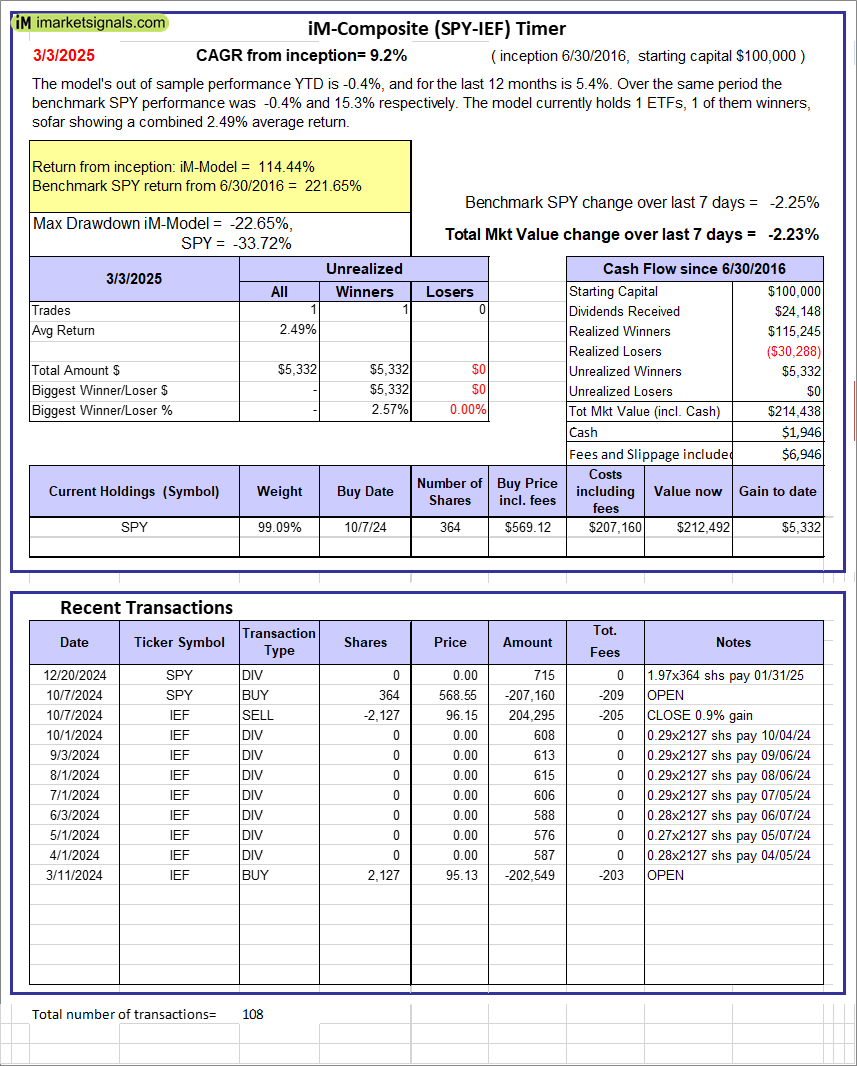 |
iM-Composite (SPY-IEF) Timer: The model’s out of sample performance YTD is -0.4%, and for the last 12 months is 5.4%. Over the same period the benchmark SPY performance was -0.4% and 15.3% respectively. Over the previous week the market value of the iM-Composite (SPY-IEF) Timer gained -2.23% at a time when SPY gained -2.25%. A starting capital of $100,000 at inception on 6/30/2016 would have grown to $214,438 which includes $1,946 cash and excludes $6,946 spent on fees and slippage. |
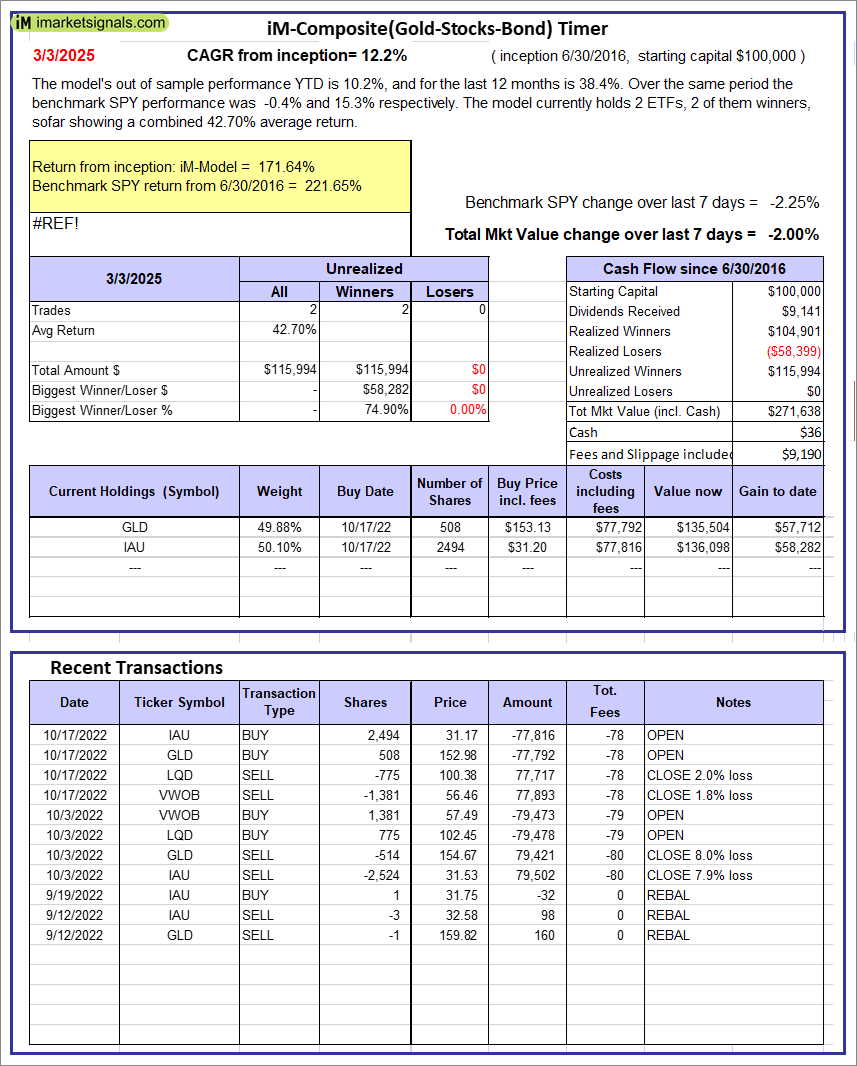 |
iM-Composite(Gold-Stocks-Bond) Timer: The model’s out of sample performance YTD is 10.2%, and for the last 12 months is 38.4%. Over the same period the benchmark SPY performance was -0.4% and 15.3% respectively. Over the previous week the market value of the iM-Composite(Gold-Stocks-Bond) Timer gained -2.00% at a time when SPY gained -2.25%. A starting capital of $100,000 at inception on 6/30/2016 would have grown to $271,638 which includes $36 cash and excludes $9,190 spent on fees and slippage. |
iM-Best Reports – 3/3/2025
Posted in pmp SPY-SH
Leave a Reply
You must be logged in to post a comment.