
  |
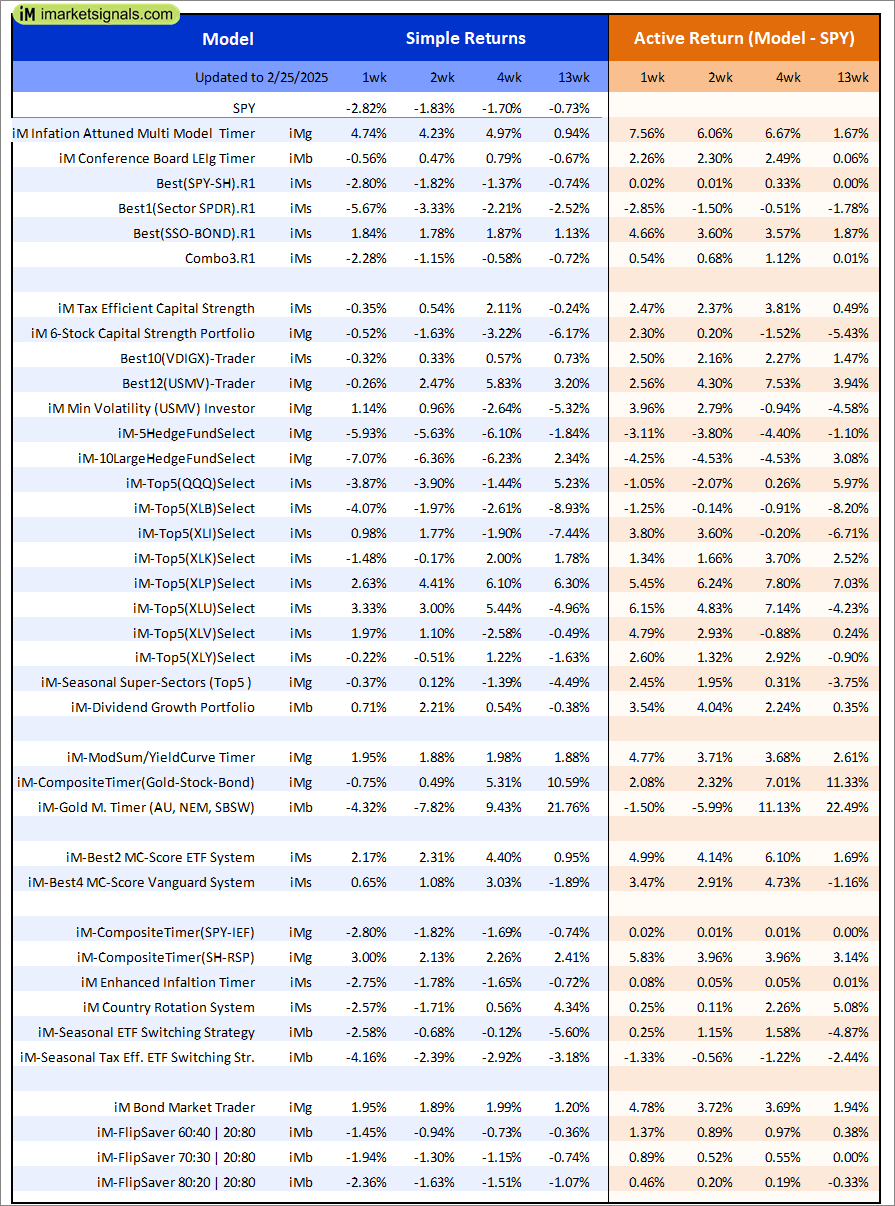
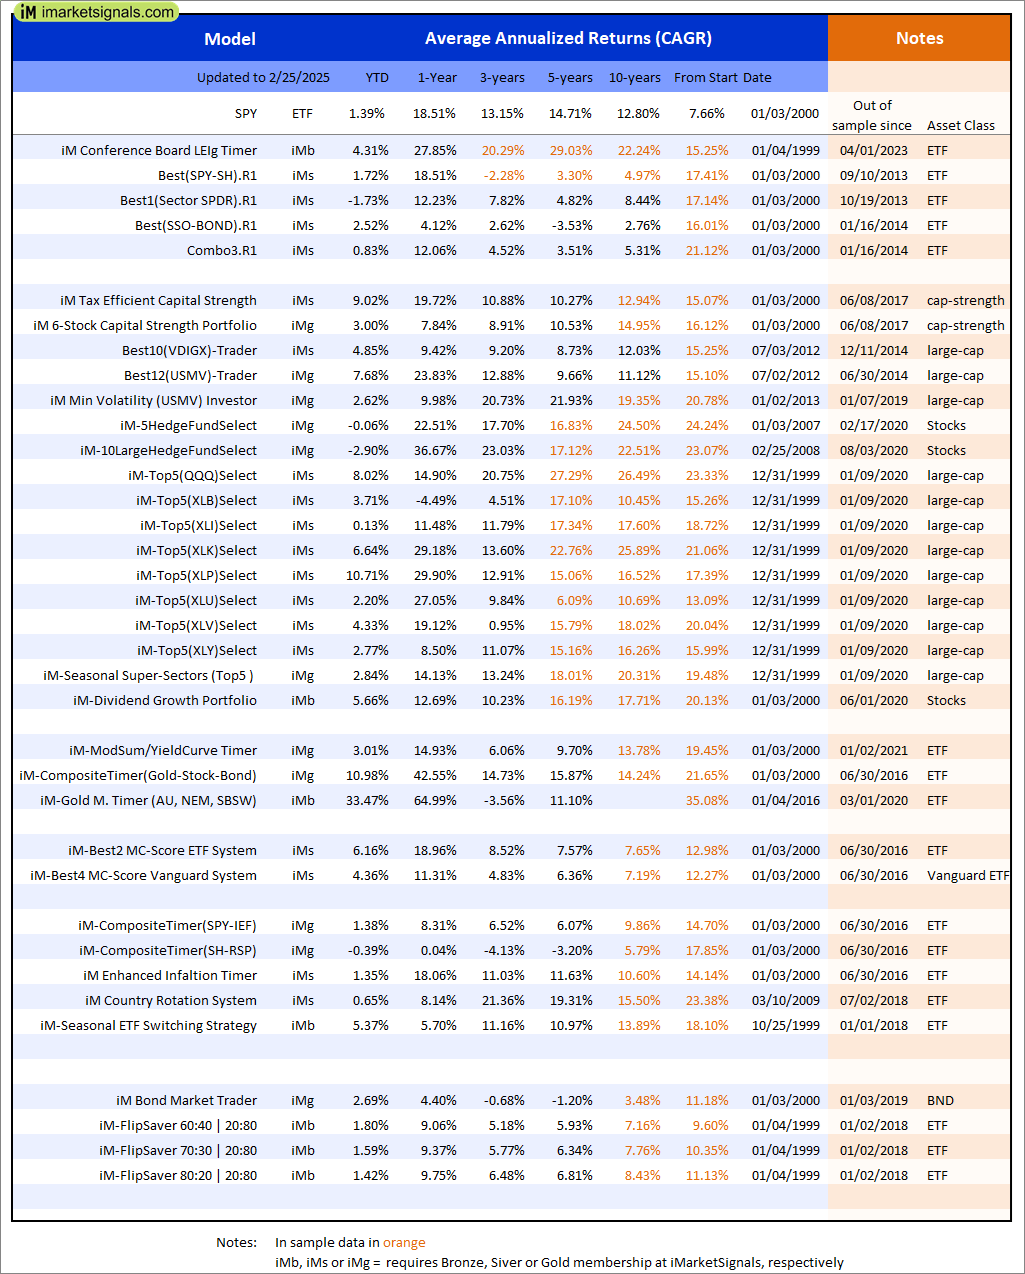
Out of sample performance summary of our models for the past 1, 2, 4 and 13 week periods. The active active return indicates how the models over- or underperformed the benchmark ETF SPY. Also the YTD, and the 1-, 3-, 5- and 10-year annualized returns are shown in the second table |
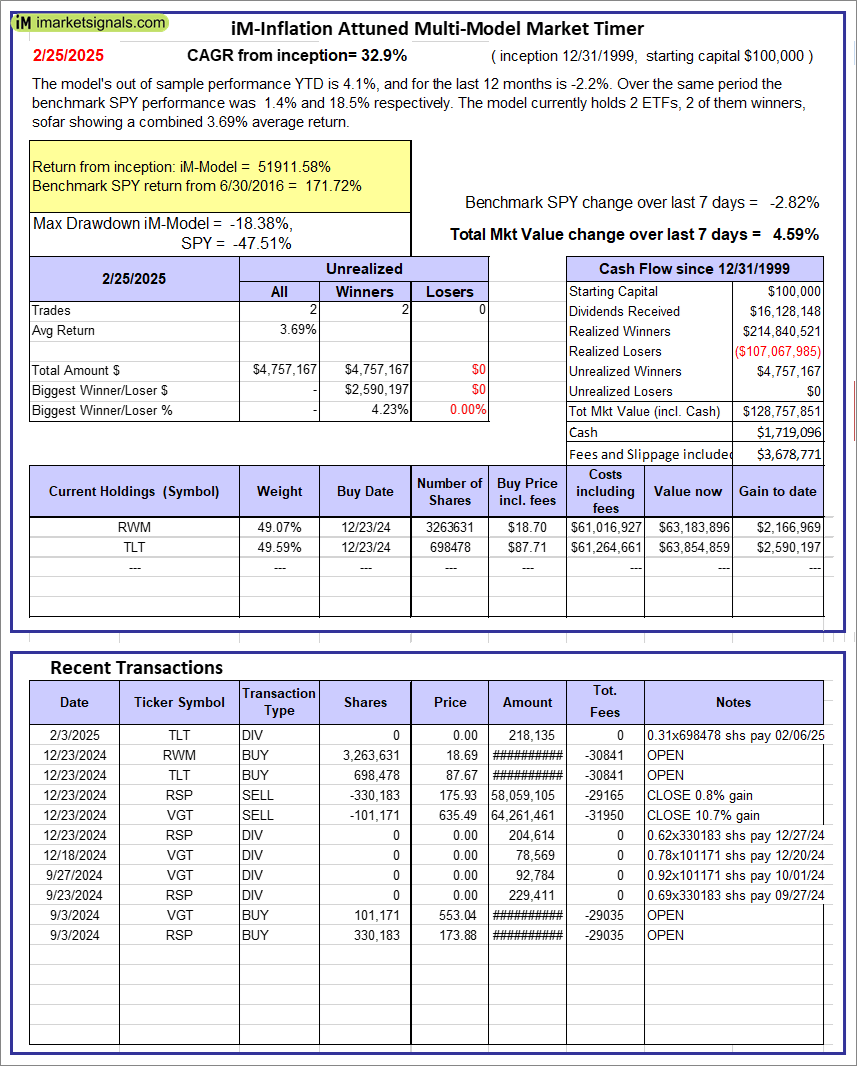 |
iM-Inflation Attuned Multi-Model Market Timer: The model’s out of sample performance YTD is 4.1%, and for the last 12 months is -2.2%. Over the same period the benchmark SPY performance was 1.4% and 18.5% respectively. Over the previous week the market value of the iM-Inflation Attuned Multi-Model Market Timer gained 4.59% at a time when SPY gained -2.82%. A starting capital of $100,000 at inception on 3/24/2017 would have grown to $128,757,851 which includes $1,719,096 cash and excludes $3,678,771 spent on fees and slippage. |
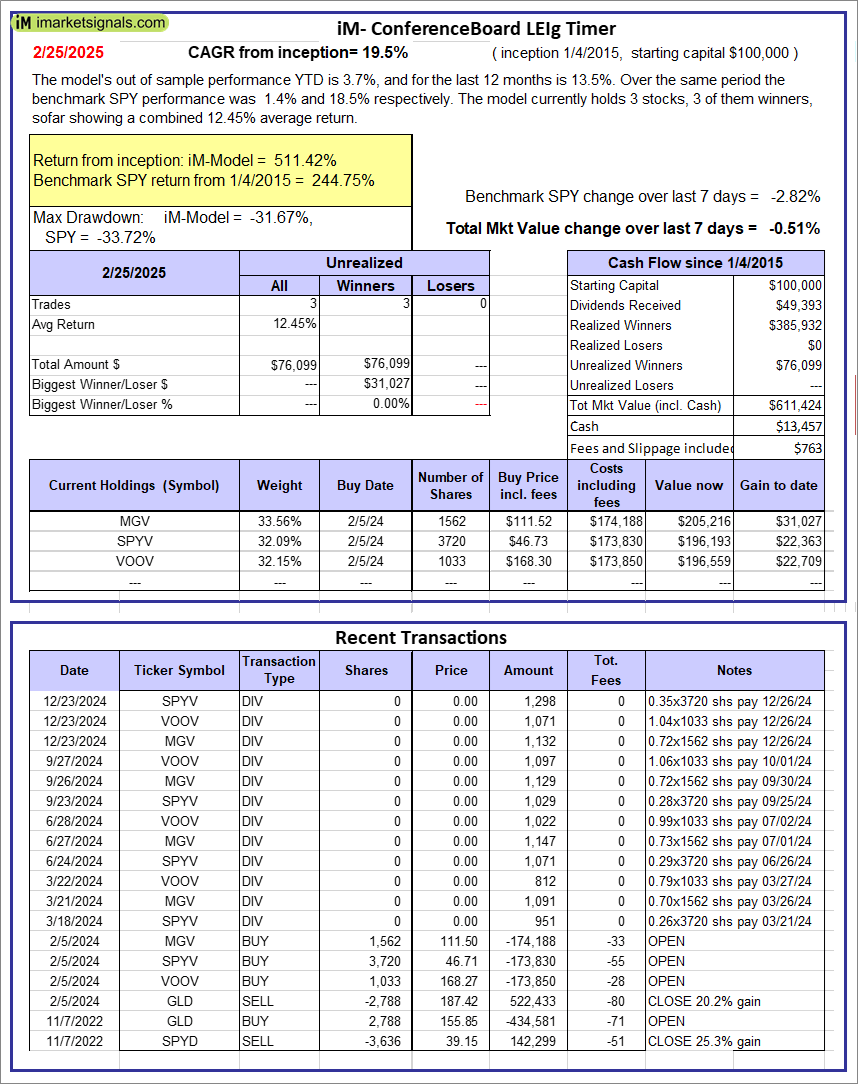 |
iM-Conference Board LEIg Timer: The model’s performance YTD is 14.3%, and for the last 12 months is 7.3%. Over the same period the benchmark SPY performance was 20.1% and 9.4% respectively. Over the previous week the market value of the iM-Conference Board LEIg Timer gained -0.51% at a time when SPY gained -2.82%. A starting capital of $100,000 at inception on 4/5/2017 would have grown to $611,424 which includes $13,457 cash and excludes $763 spent on fees and slippage. |
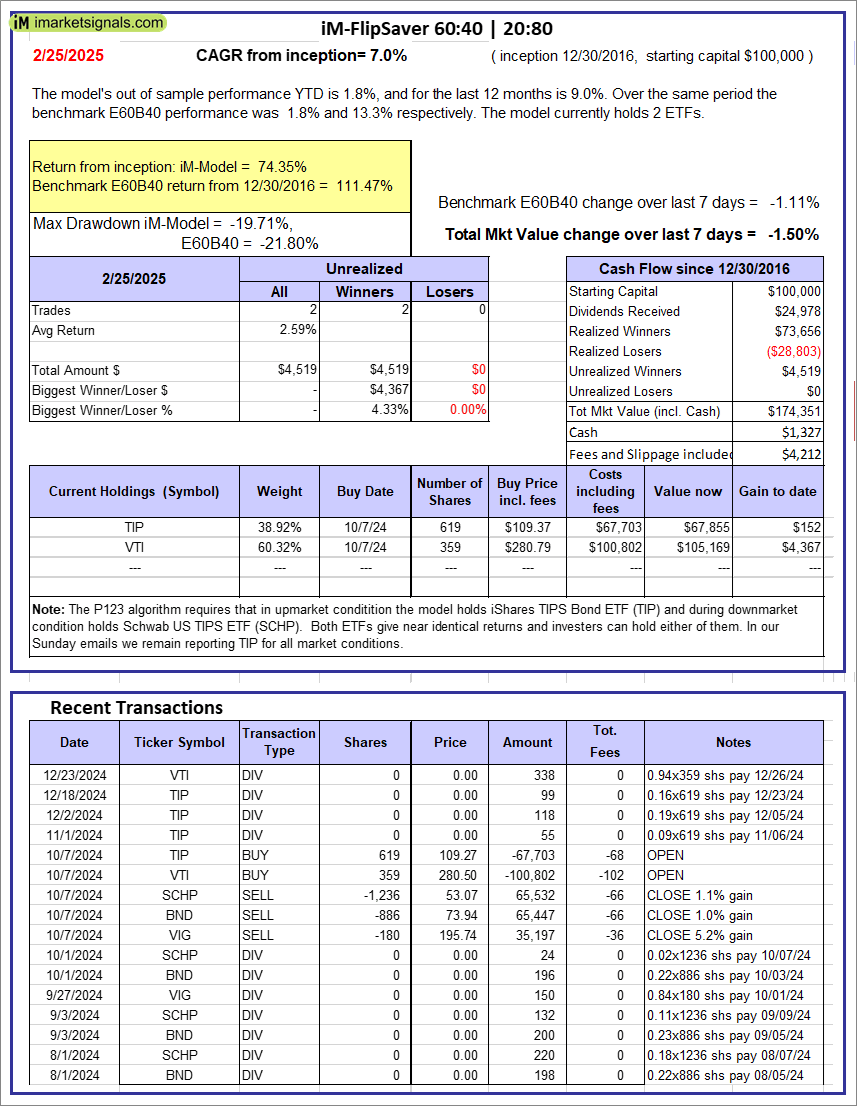 |
iM-FlipSaver 60:40 | 20:80 – 2017: The model’s out of sample performance YTD is 1.8%, and for the last 12 months is 9.0%. Over the same period the benchmark E60B40 performance was 1.8% and 13.3% respectively. Over the previous week the market value of iM-FlipSaver 80:20 | 20:80 gained -1.50% at a time when SPY gained -1.11%. A starting capital of $100,000 at inception on 7/16/2015 would have grown to $174,351 which includes $1,327 cash and excludes $4,212 spent on fees and slippage. |
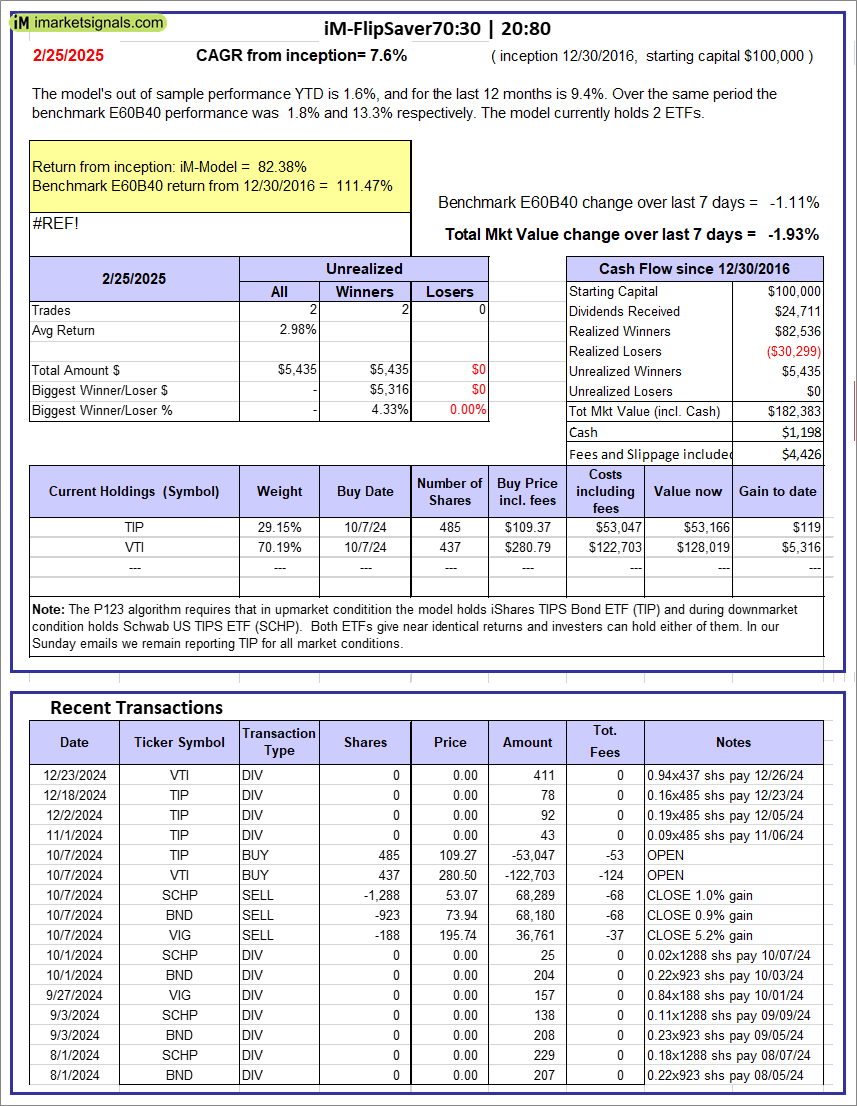 |
iM-FlipSaver 70:30 | 20:80 – 2017: The model’s out of sample performance YTD is 1.6%, and for the last 12 months is 9.4%. Over the same period the benchmark E60B40 performance was 1.8% and 13.3% respectively. Over the previous week the market value of iM-FlipSaver 70:30 | 20:80 gained -1.93% at a time when SPY gained -1.11%. A starting capital of $100,000 at inception on 7/15/2015 would have grown to $182,383 which includes $1,198 cash and excludes $4,426 spent on fees and slippage. |
 |
iM-FlipSaver 80:20 | 20:80 – 2017: The model’s out of sample performance YTD is 1.4%, and for the last 12 months is 9.7%. Over the same period the benchmark E60B40 performance was 1.8% and 13.3% respectively. Over the previous week the market value of iM-FlipSaver 80:20 | 20:80 gained -2.36% at a time when SPY gained -1.11%. A starting capital of $100,000 at inception on 1/2/2017 would have grown to $190,398 which includes $1,341 cash and excludes $4,632 spent on fees and slippage. |
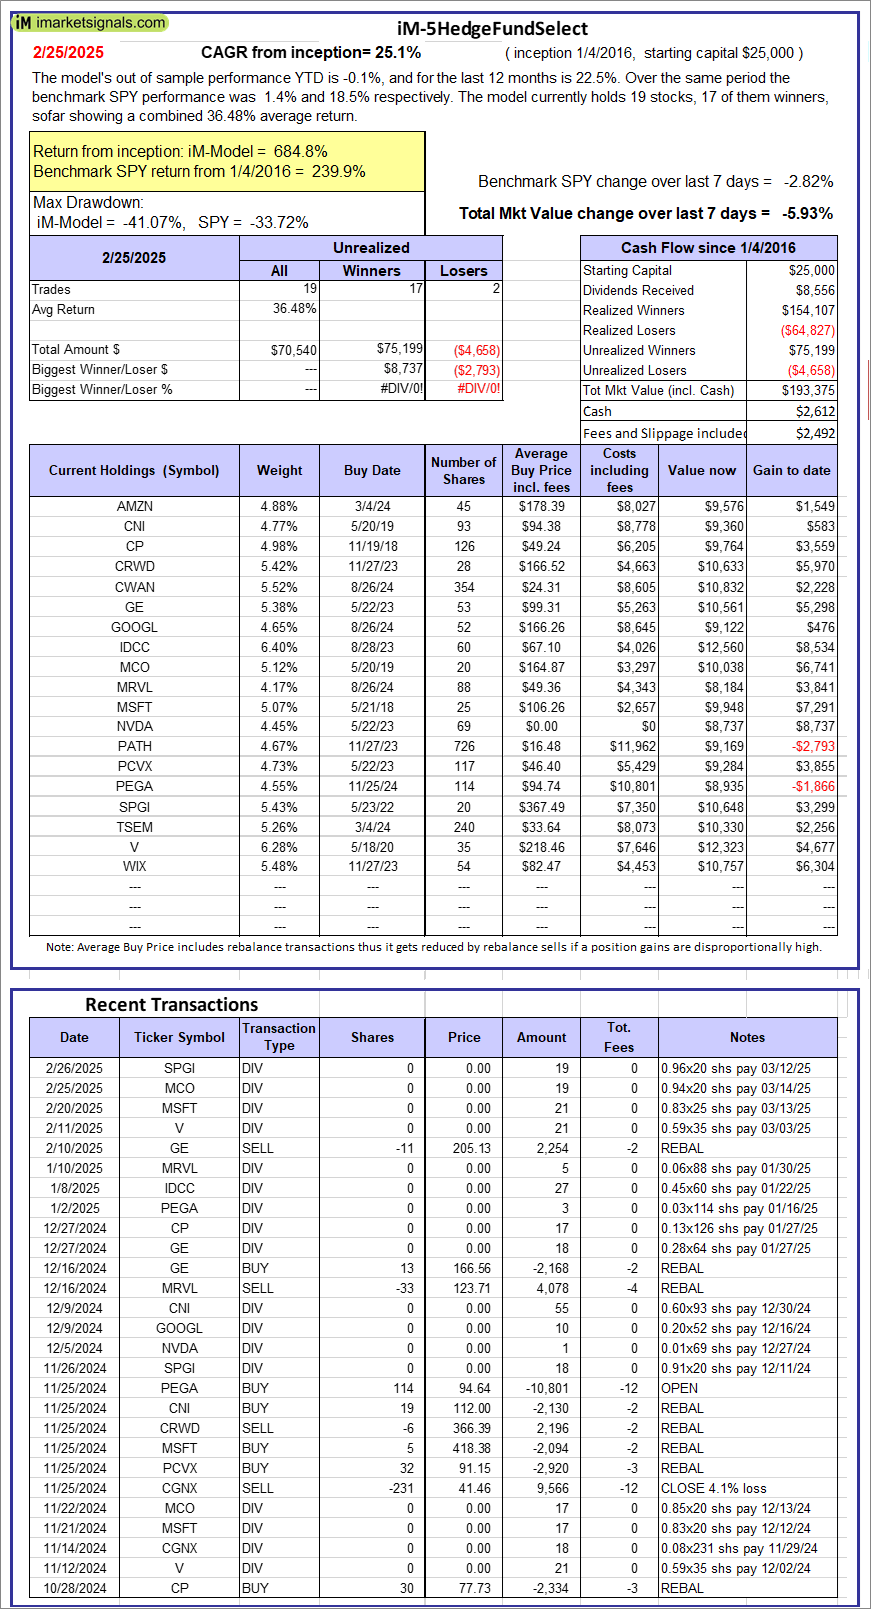 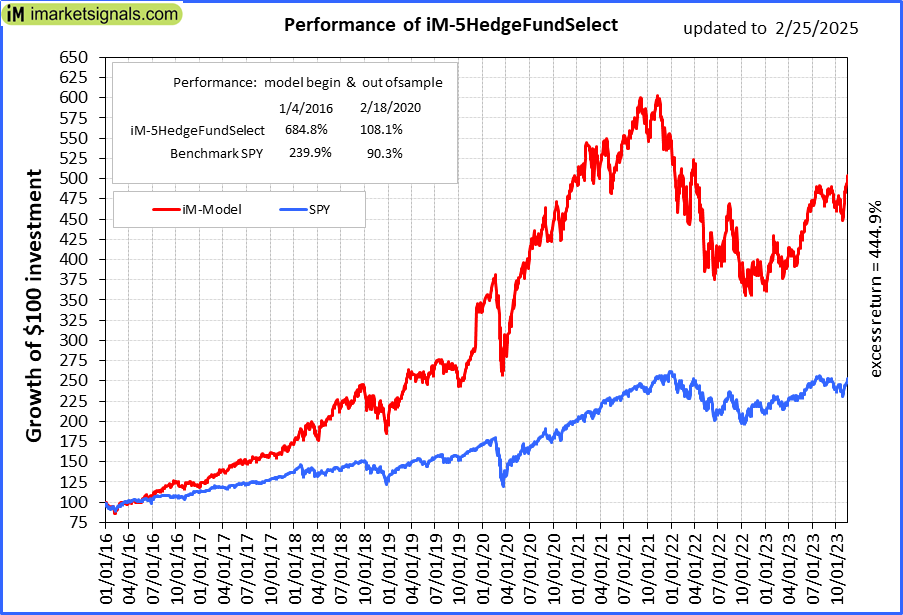 |
iM-5HedgeFundSelect: Since inception, on 1/5/2016, the model gained 684.80% while the benchmark SPY gained 239.92% over the same period. Over the previous week the market value of iM-5HedgeFundSelect gained -5.93% at a time when SPY gained -2.82%. A starting capital of $25,000 at inception on 1/5/2016 would have grown to $193,375 which includes $2,612 cash and excludes $2,492 spent on fees and slippage. |
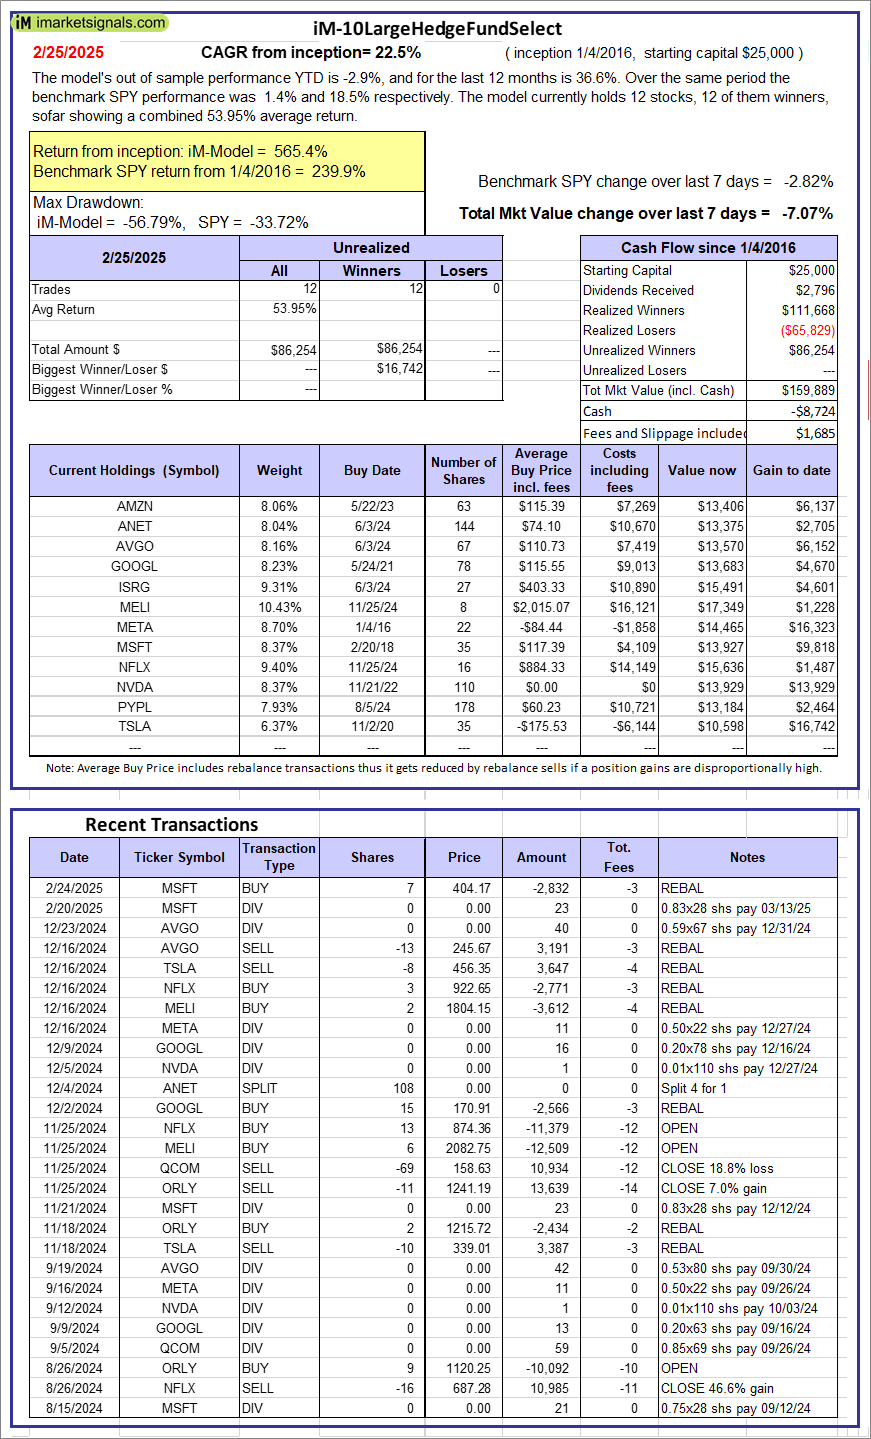 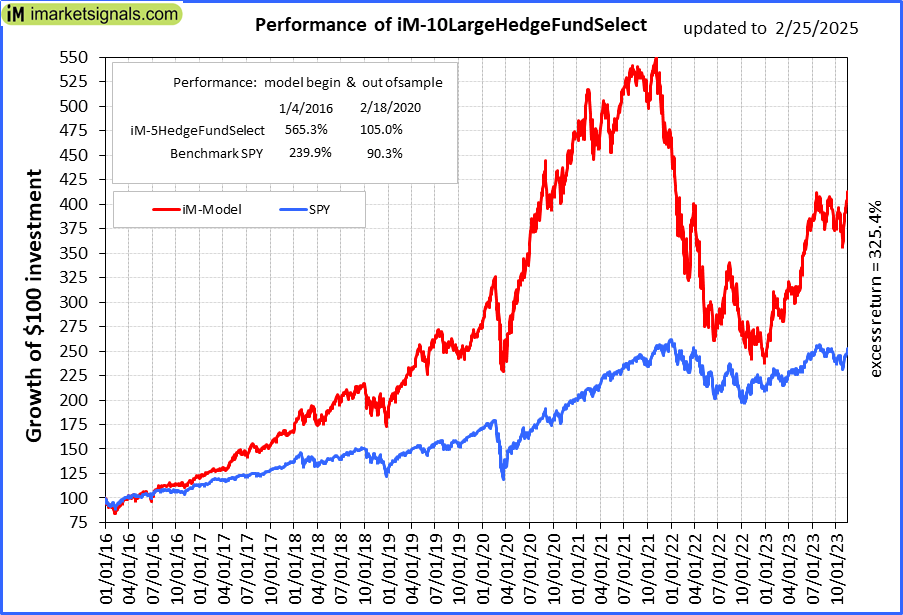 |
iM-10LargeHedgeFundSelect: Since inception, on 1/5/2016, the model gained 565.35% while the benchmark SPY gained 239.92% over the same period. Over the previous week the market value of iM-10LargeHedgeFundSelect gained -7.07% at a time when SPY gained -2.82%. A starting capital of $25,000 at inception on 1/5/2016 would have grown to $159,889 which includes -$8,724 cash and excludes $1,685 spent on fees and slippage. |
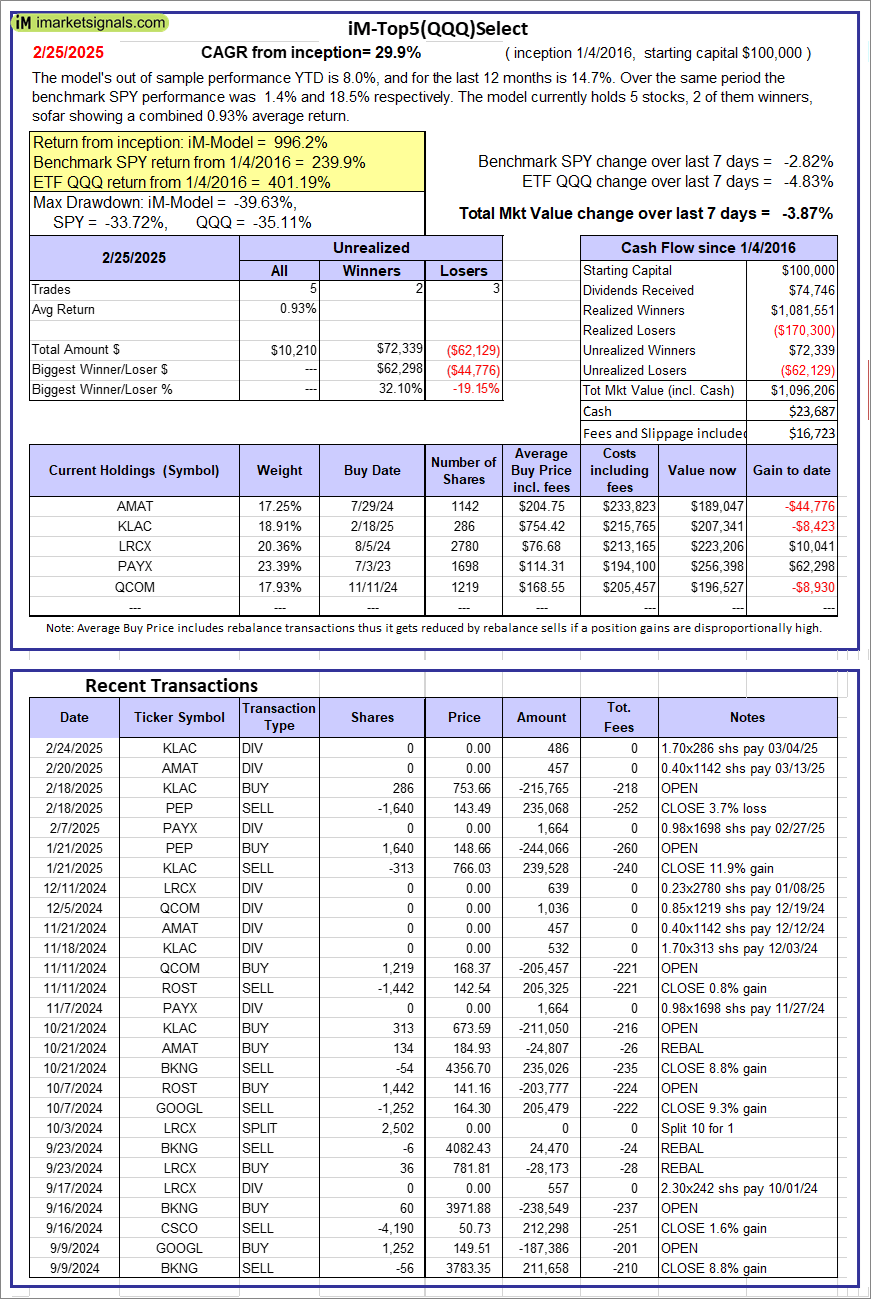 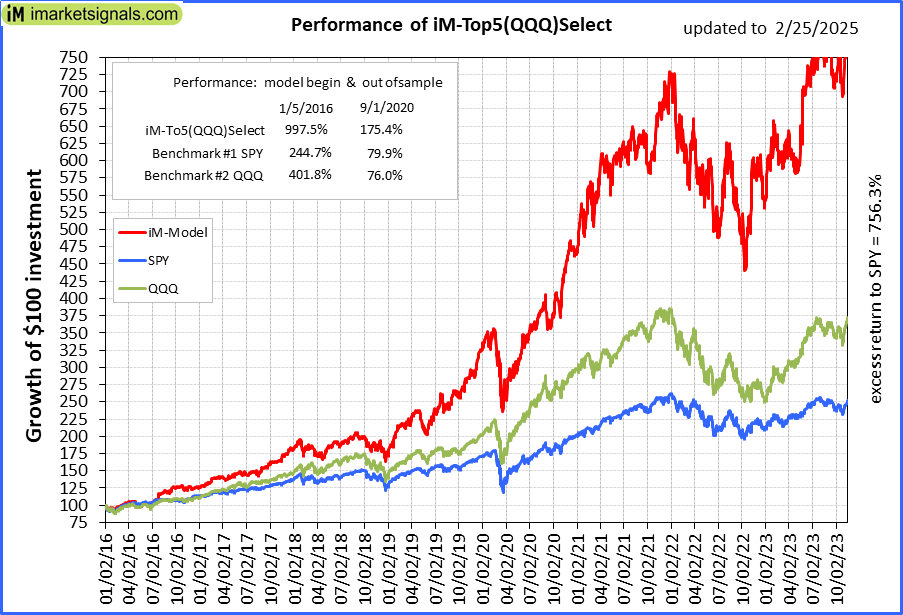 |
iM-Top5(QQQ)Select: Since inception, on 1/5/2016, the model gained 996.21% while the benchmark SPY gained 239.92% over the same period. Over the previous week the market value of iM-Top5(QQQ)Select gained -3.87% at a time when SPY gained -2.82%. A starting capital of $100,000 at inception on 1/5/2016 would have grown to $1,096,206 which includes $23,687 cash and excludes $16,723 spent on fees and slippage. |
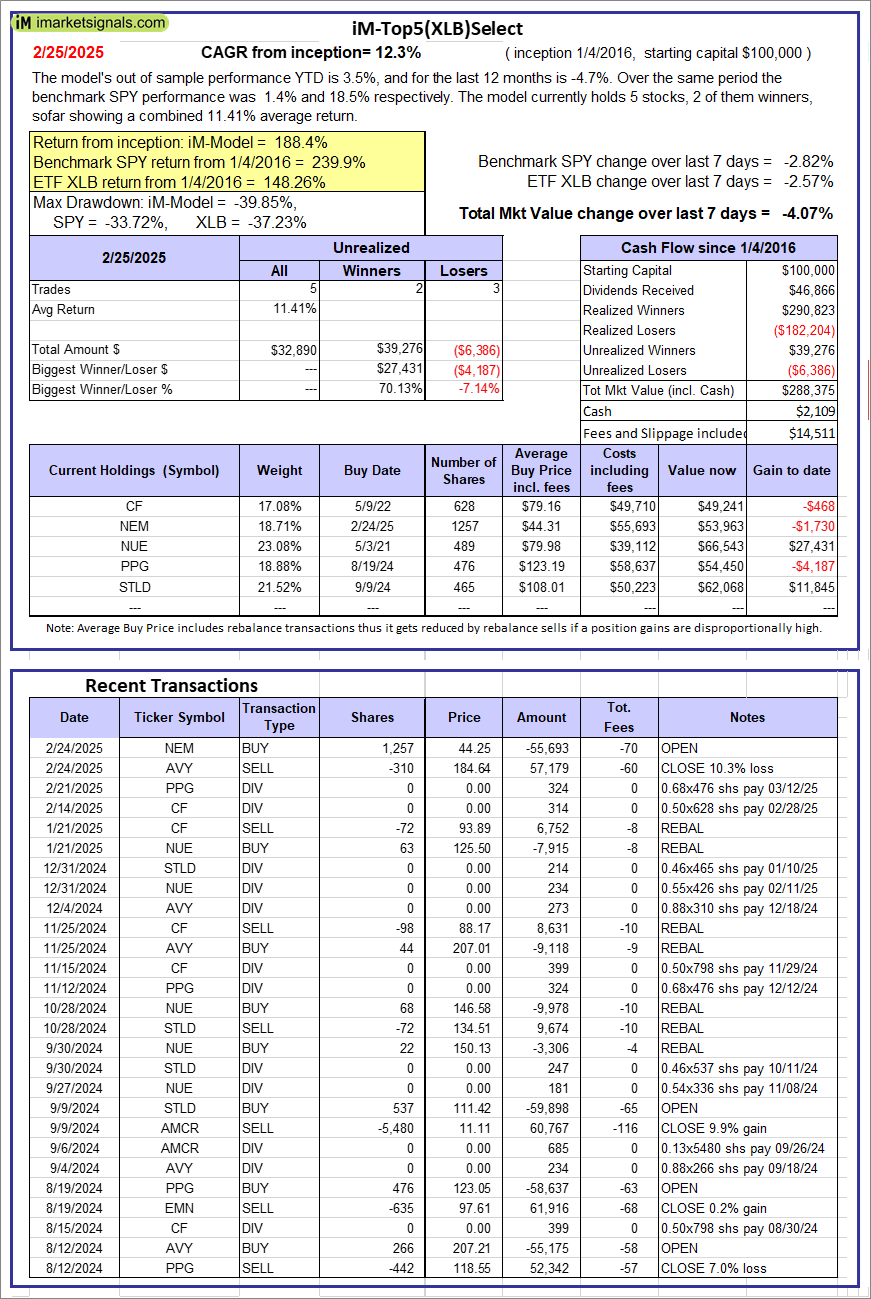 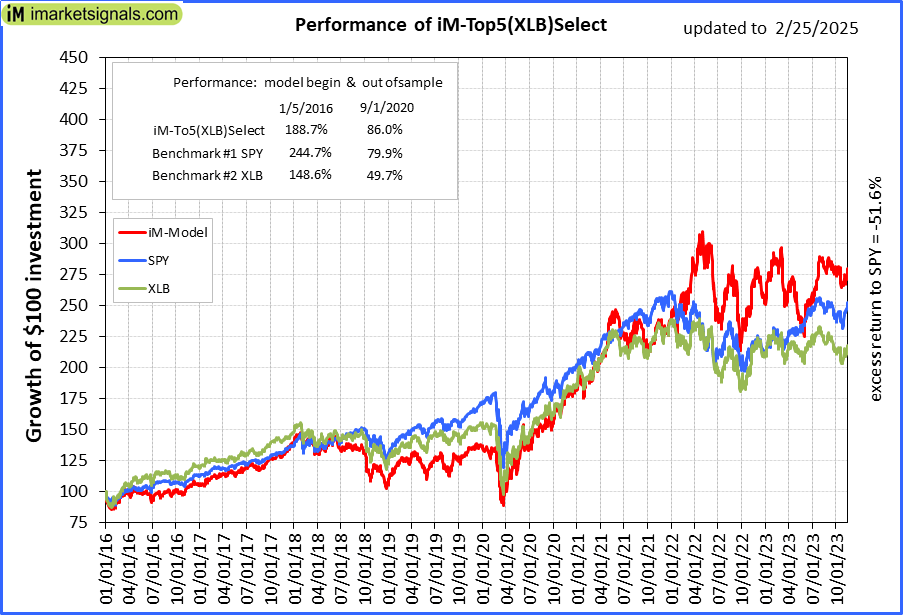 |
iM-Top5(XLB)Select: Since inception, on 1/5/2016, the model gained 188.37% while the benchmark SPY gained 239.92% over the same period. Over the previous week the market value of iM-Top5(XLB)Select gained -4.07% at a time when SPY gained -2.82%. A starting capital of $100,000 at inception on 1/5/2016 would have grown to $288,375 which includes $2,109 cash and excludes $14,511 spent on fees and slippage. |
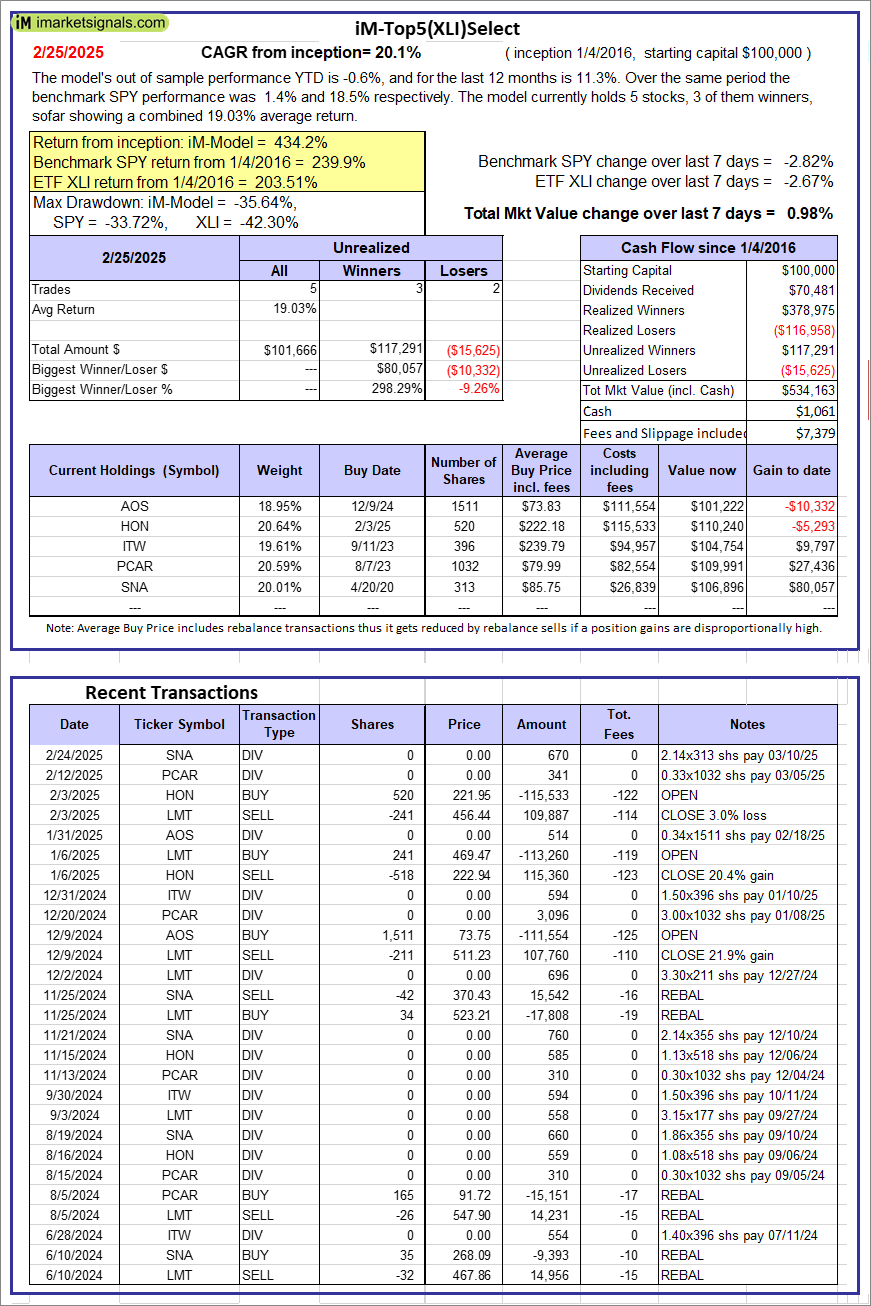 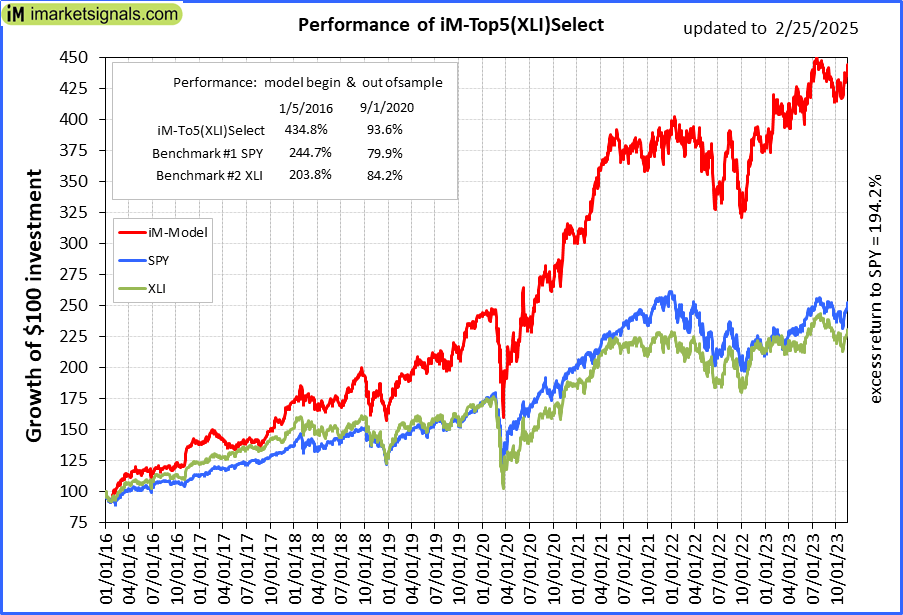 |
iM-Top5(XLI)Select: Since inception, on 1/5/2016, the model gained 434.16% while the benchmark SPY gained 239.92% over the same period. Over the previous week the market value of iM-Top5(XLI)Select gained 0.98% at a time when SPY gained -2.82%. A starting capital of $100,000 at inception on 1/5/2016 would have grown to $534,163 which includes $1,061 cash and excludes $7,379 spent on fees and slippage. |
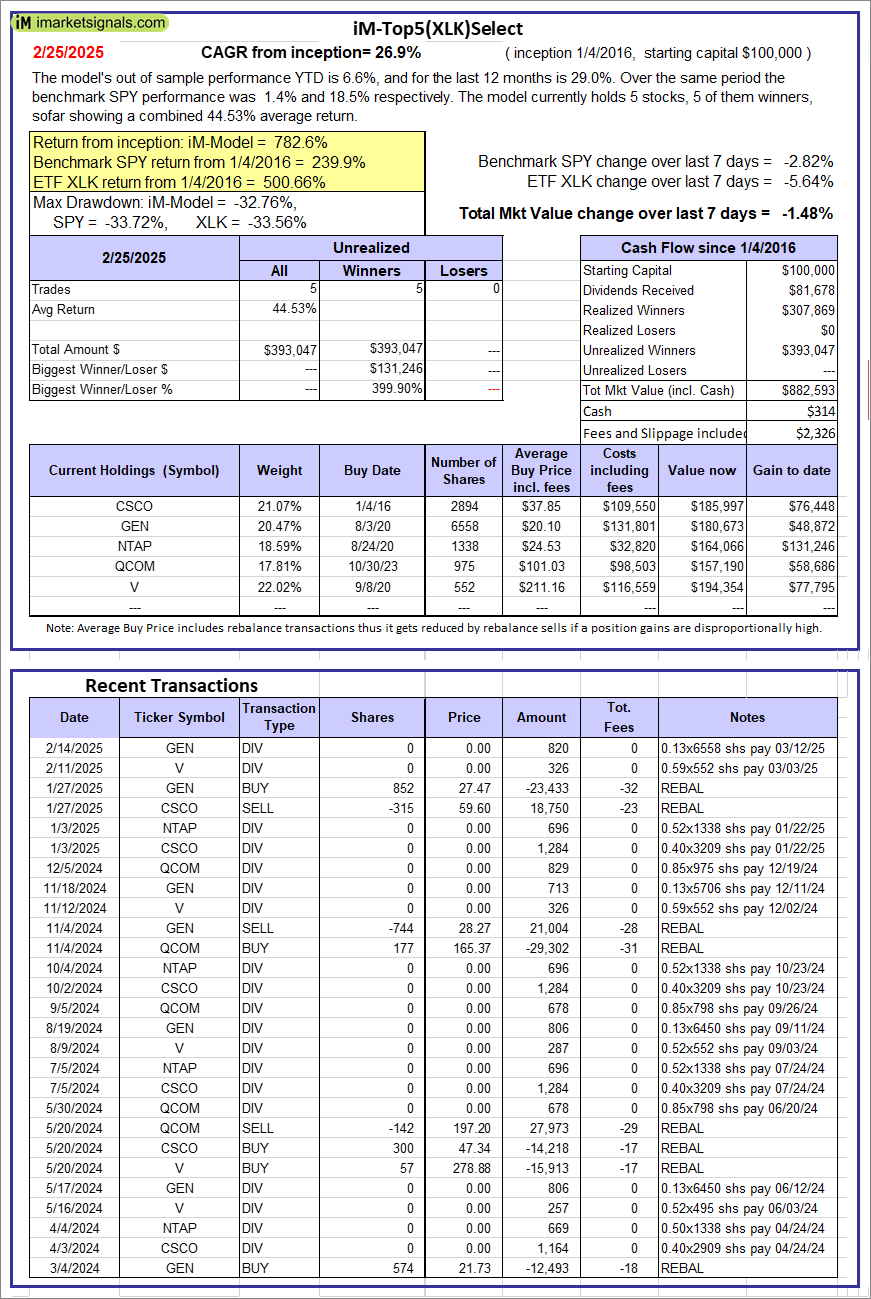 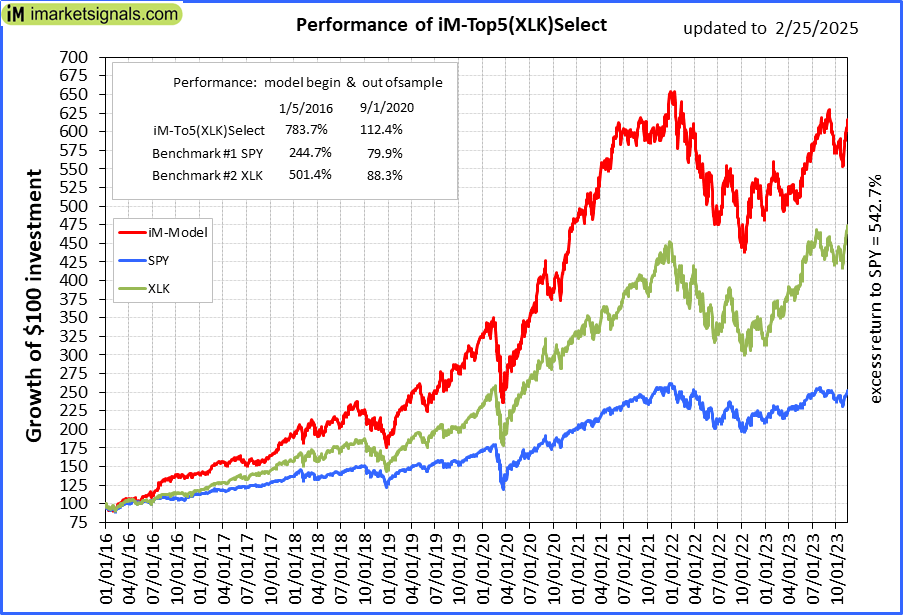 |
iM-Top5(XLK)Select: Since inception, on 1/5/2016, the model gained 782.59% while the benchmark SPY gained 239.92% over the same period. Over the previous week the market value of iM-Top5(XLK)Select gained -1.48% at a time when SPY gained -2.82%. A starting capital of $100,000 at inception on 1/5/2016 would have grown to $882,593 which includes $314 cash and excludes $2,326 spent on fees and slippage. |
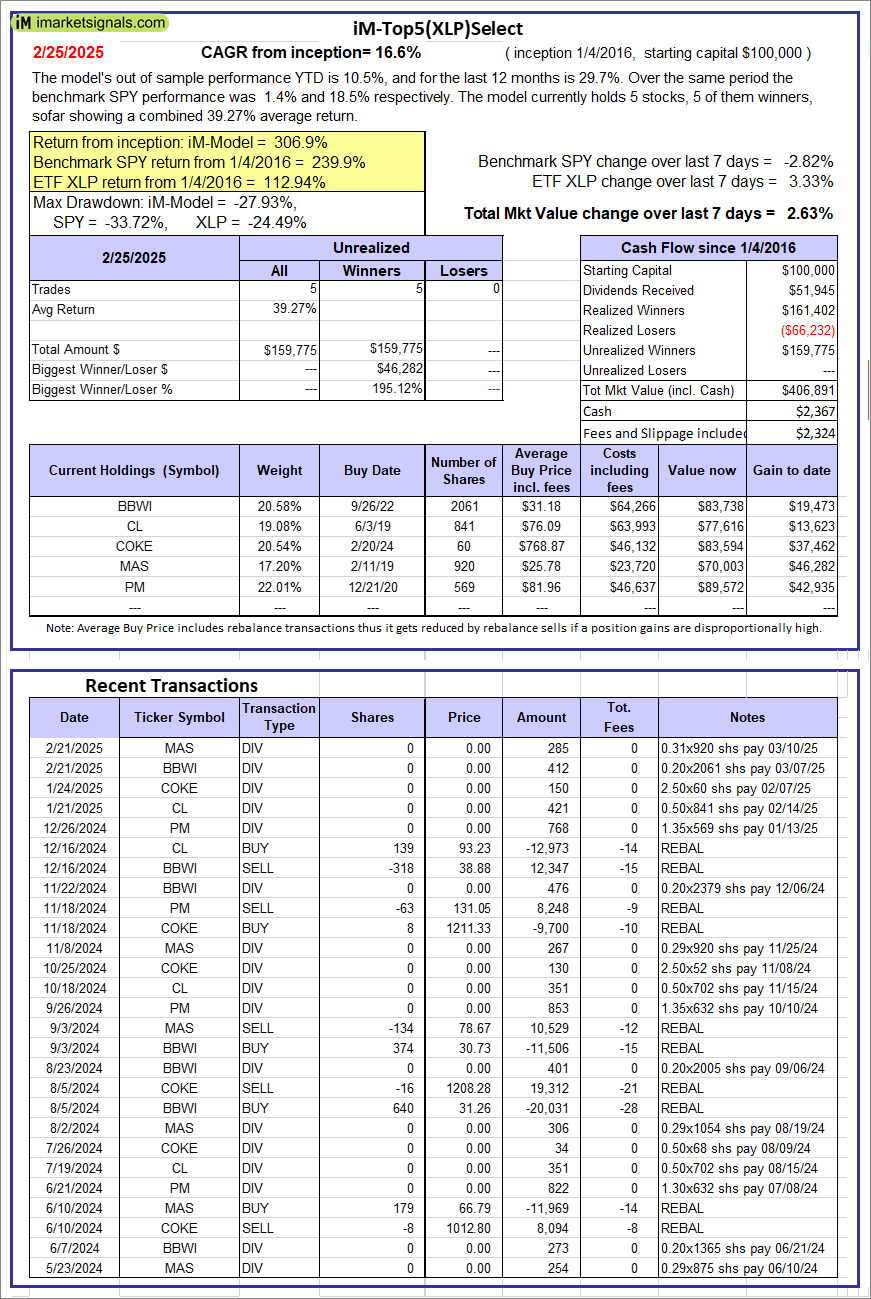 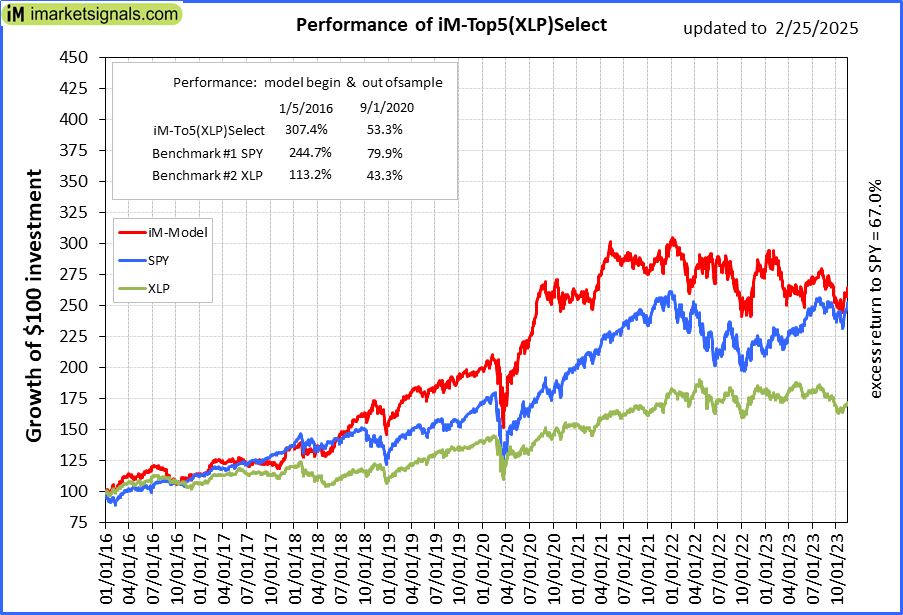 |
iM-Top5(XLP)Select: Since inception, on 1/5/2016, the model gained 306.89% while the benchmark SPY gained 239.92% over the same period. Over the previous week the market value of iM-Top5(XLP)Select gained 2.63% at a time when SPY gained -2.82%. A starting capital of $100,000 at inception on 1/5/2016 would have grown to $406,891 which includes $2,367 cash and excludes $2,324 spent on fees and slippage. |
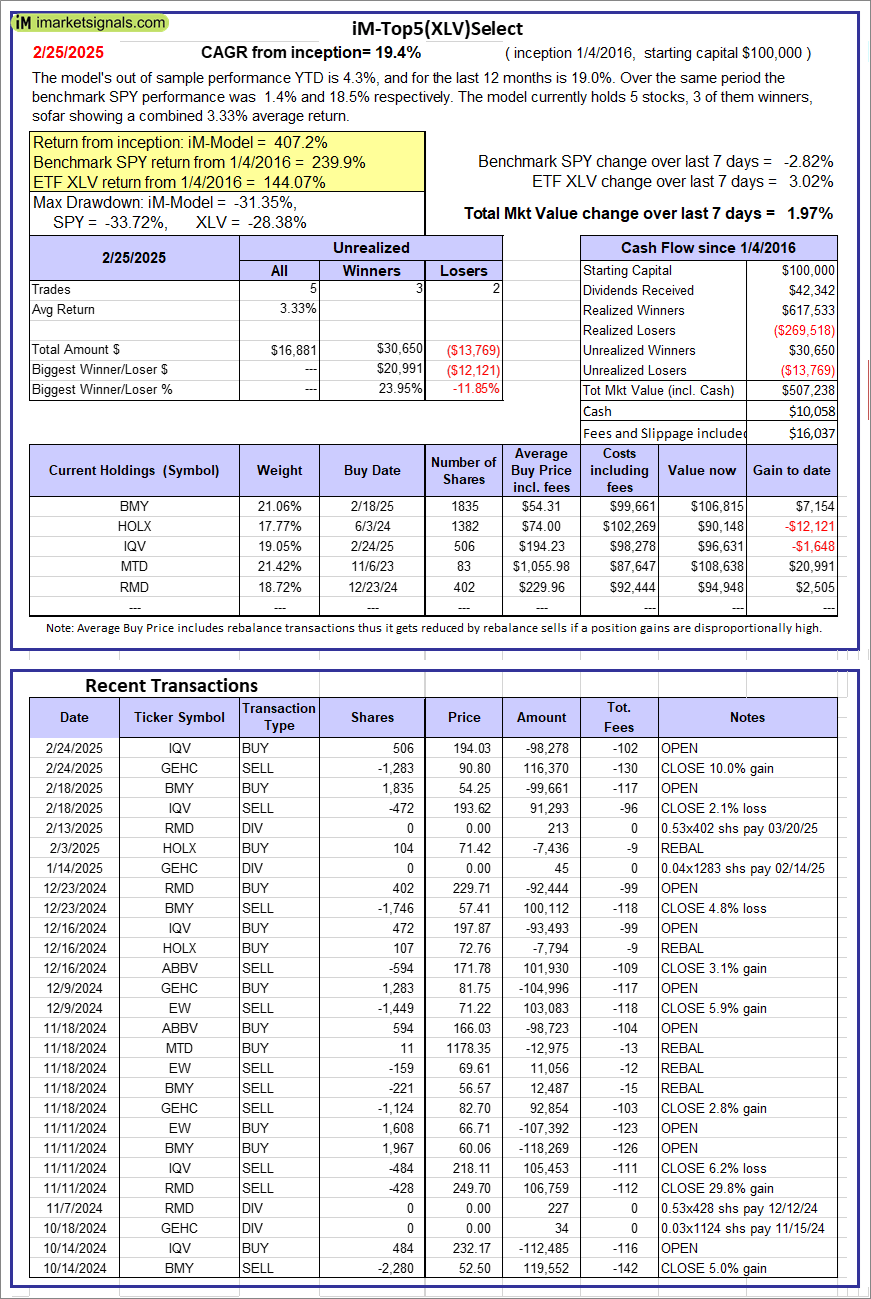 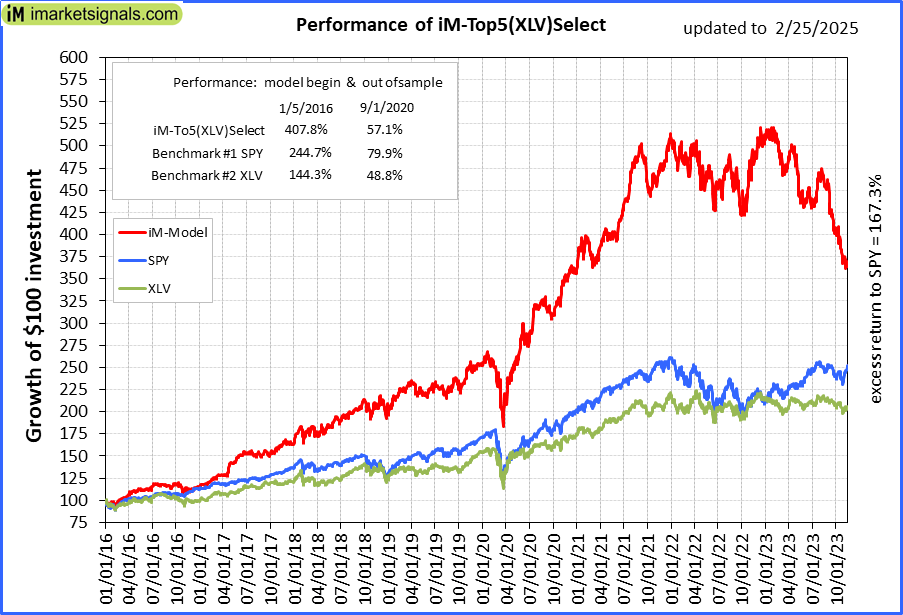 |
iM-Top5(XLV)Select: Since inception, on 1/5/2016, the model gained 407.24% while the benchmark SPY gained 239.92% over the same period. Over the previous week the market value of iM-Top5(XLV)Select gained 1.97% at a time when SPY gained -2.82%. A starting capital of $100,000 at inception on 1/5/2016 would have grown to $507,238 which includes $10,058 cash and excludes $16,037 spent on fees and slippage. |
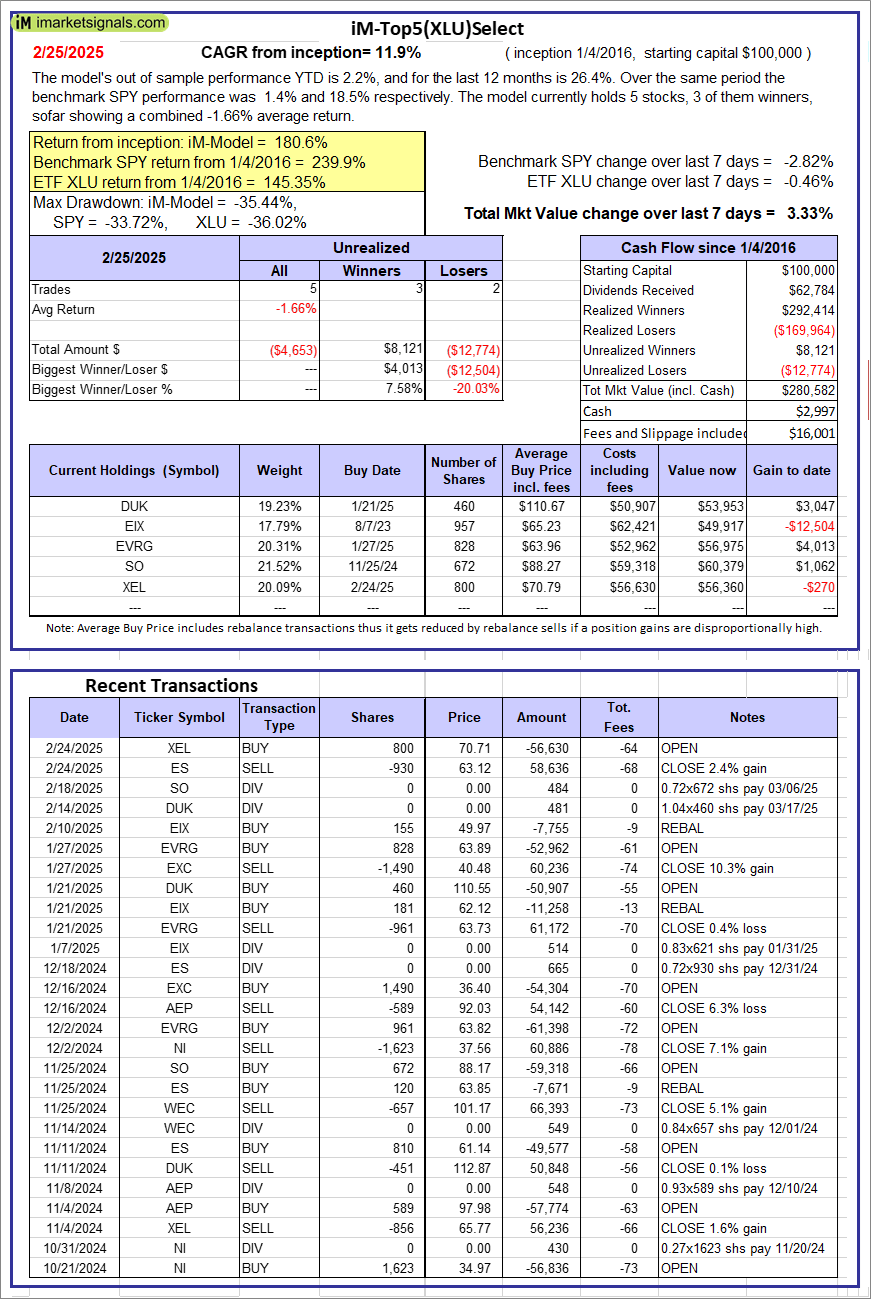 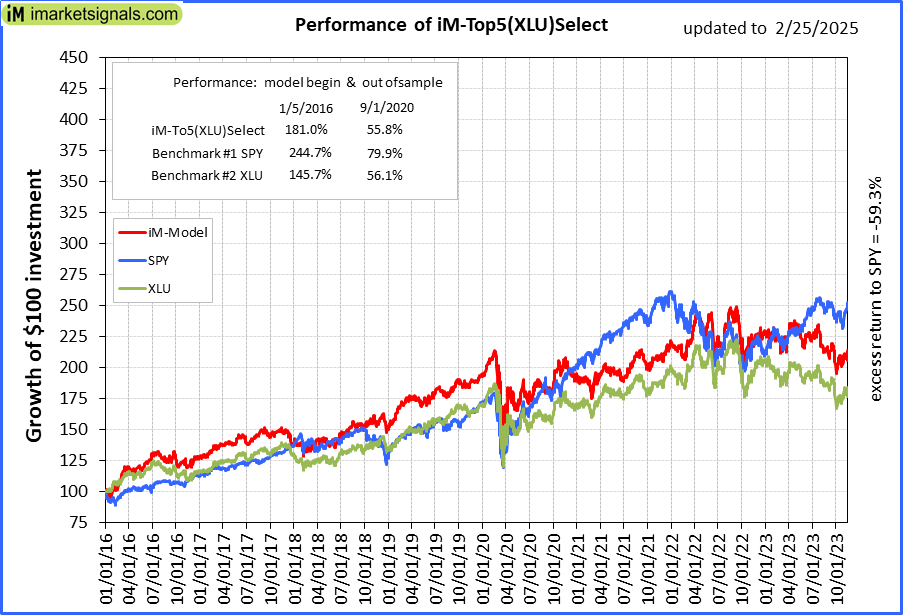 |
iM-Top5(XLU)Select: Since inception, on 1/5/2016, the model gained 180.58% while the benchmark SPY gained 239.92% over the same period. Over the previous week the market value of iM-Top5(XLU)Select gained 3.33% at a time when SPY gained -2.82%. A starting capital of $100,000 at inception on 1/5/2016 would have grown to $280,582 which includes $2,997 cash and excludes $16,001 spent on fees and slippage. |
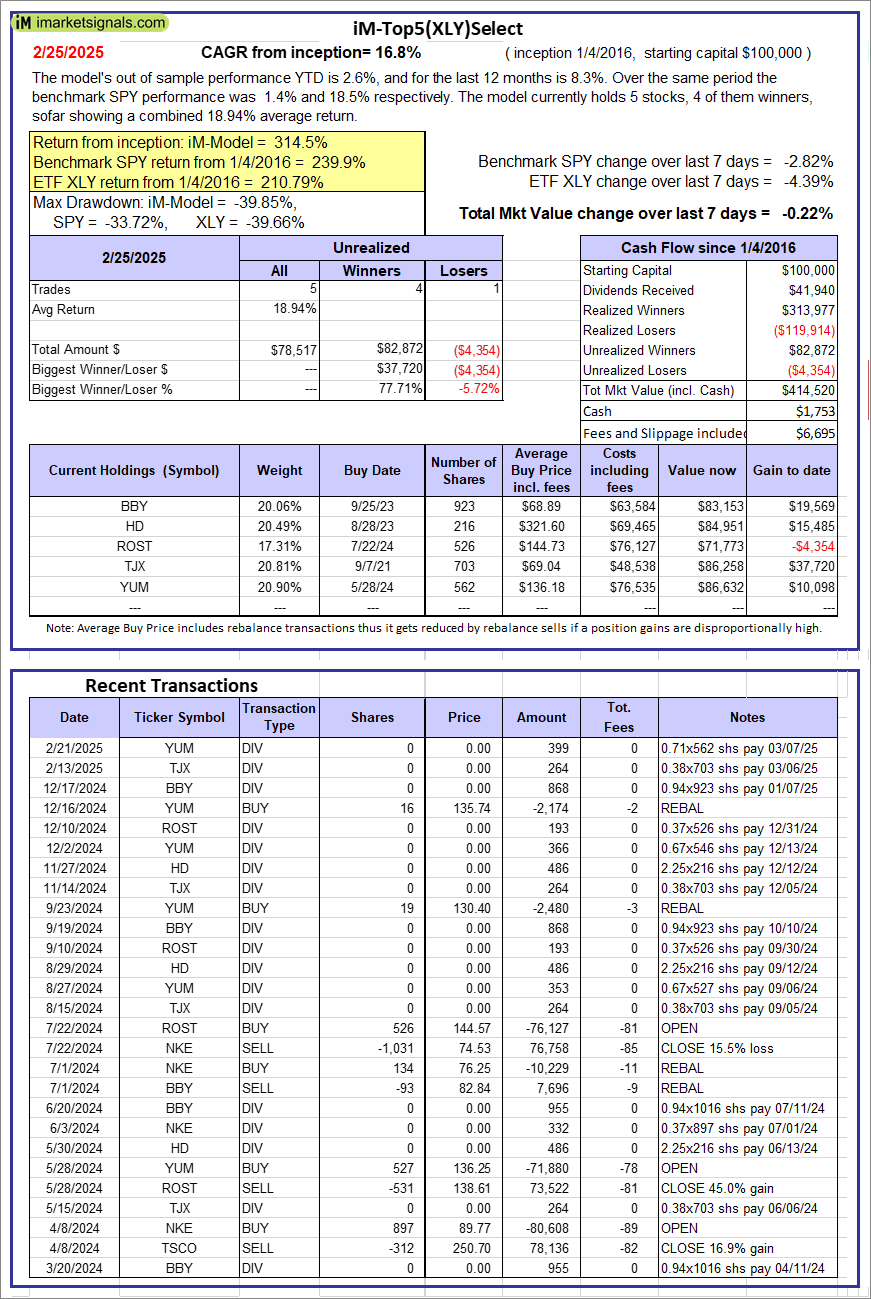 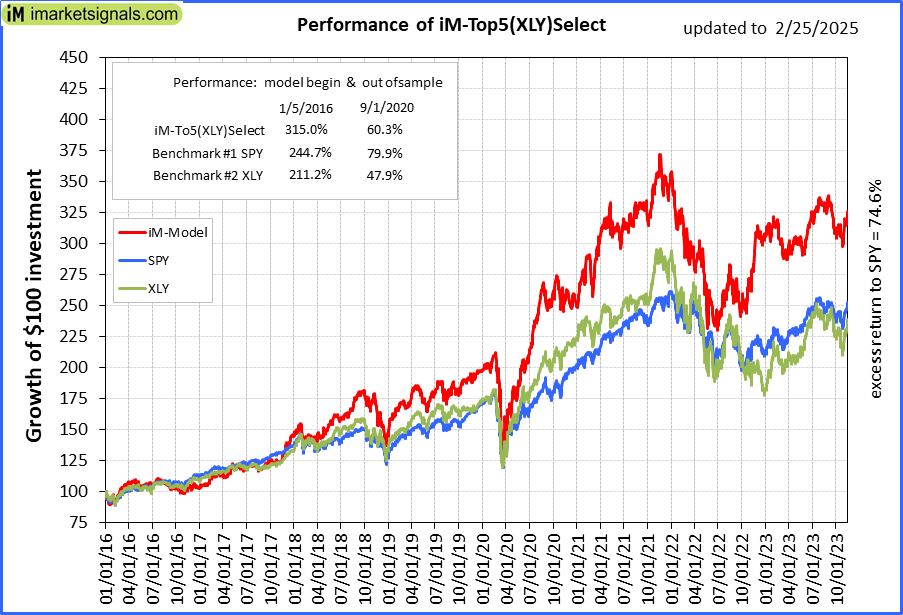 |
iM-Top5(XLY)Select: Since inception, on 1/5/2016, the model gained 314.52% while the benchmark SPY gained 239.92% over the same period. Over the previous week the market value of iM-Top5(XLY)Select gained -0.22% at a time when SPY gained -2.82%. A starting capital of $100,000 at inception on 1/5/2016 would have grown to $414,520 which includes $1,753 cash and excludes $6,695 spent on fees and slippage. |
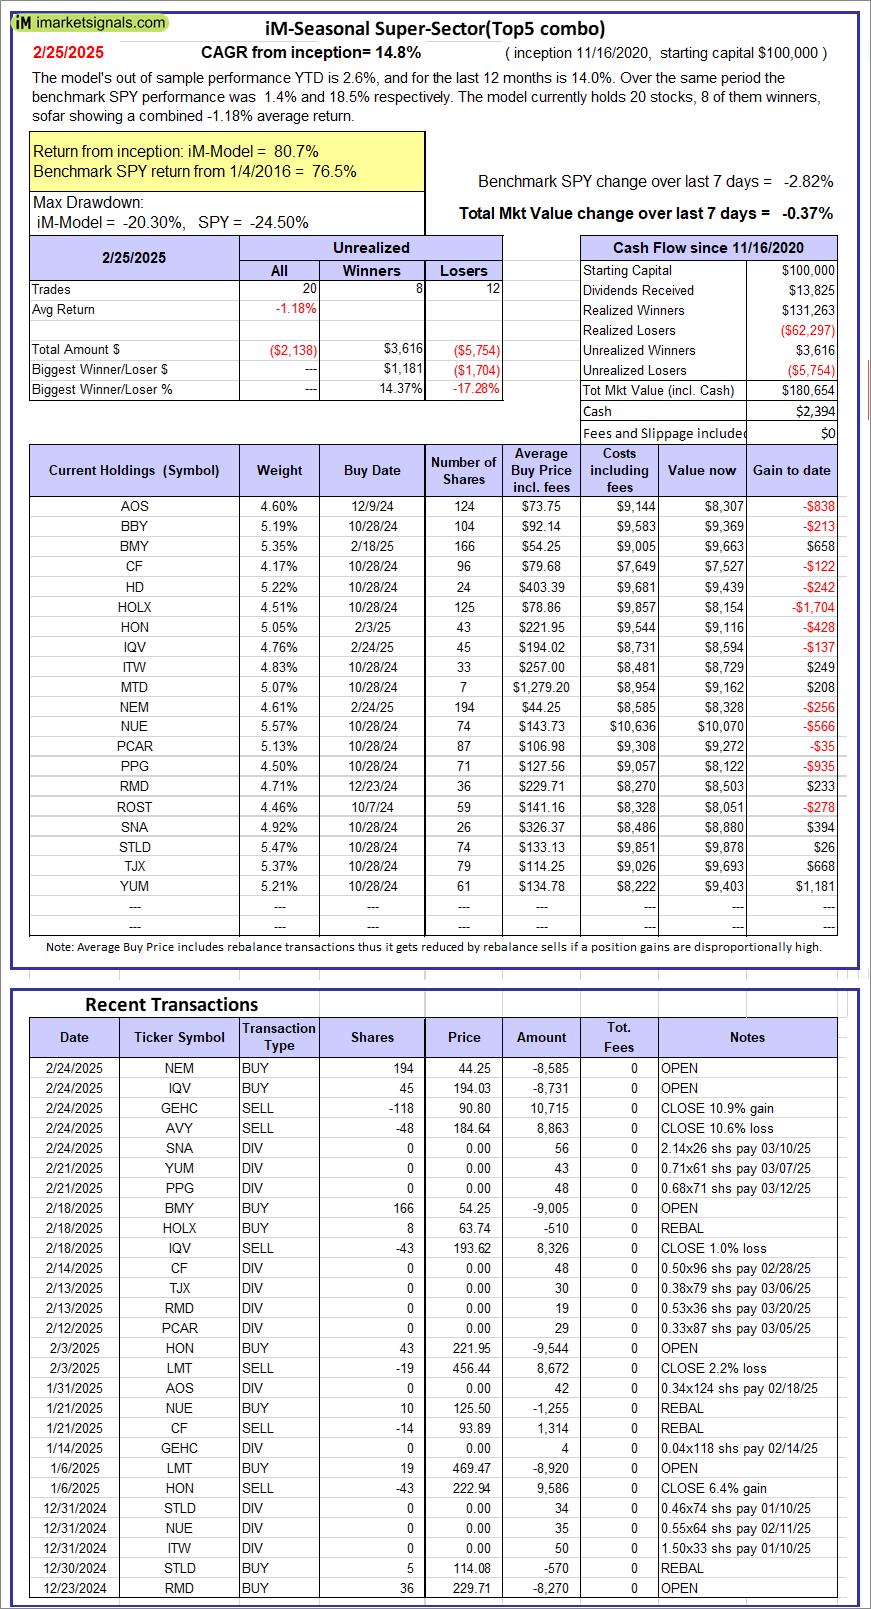 |
iM-Seasonal Super-Sectors (Top5 combo) : Since inception, on 11/17/2020, the model gained 80.65% while the benchmark SPY gained 76.46% over the same period. Over the previous week the market value of iM-Seasonal Super-Sectors (Top5 combo) gained -0.37% at a time when SPY gained -2.82%. A starting capital of $100,000 at inception on 11/17/2020 would have grown to $180,654 which includes $2,394 cash and excludes $00 spent on fees and slippage. |
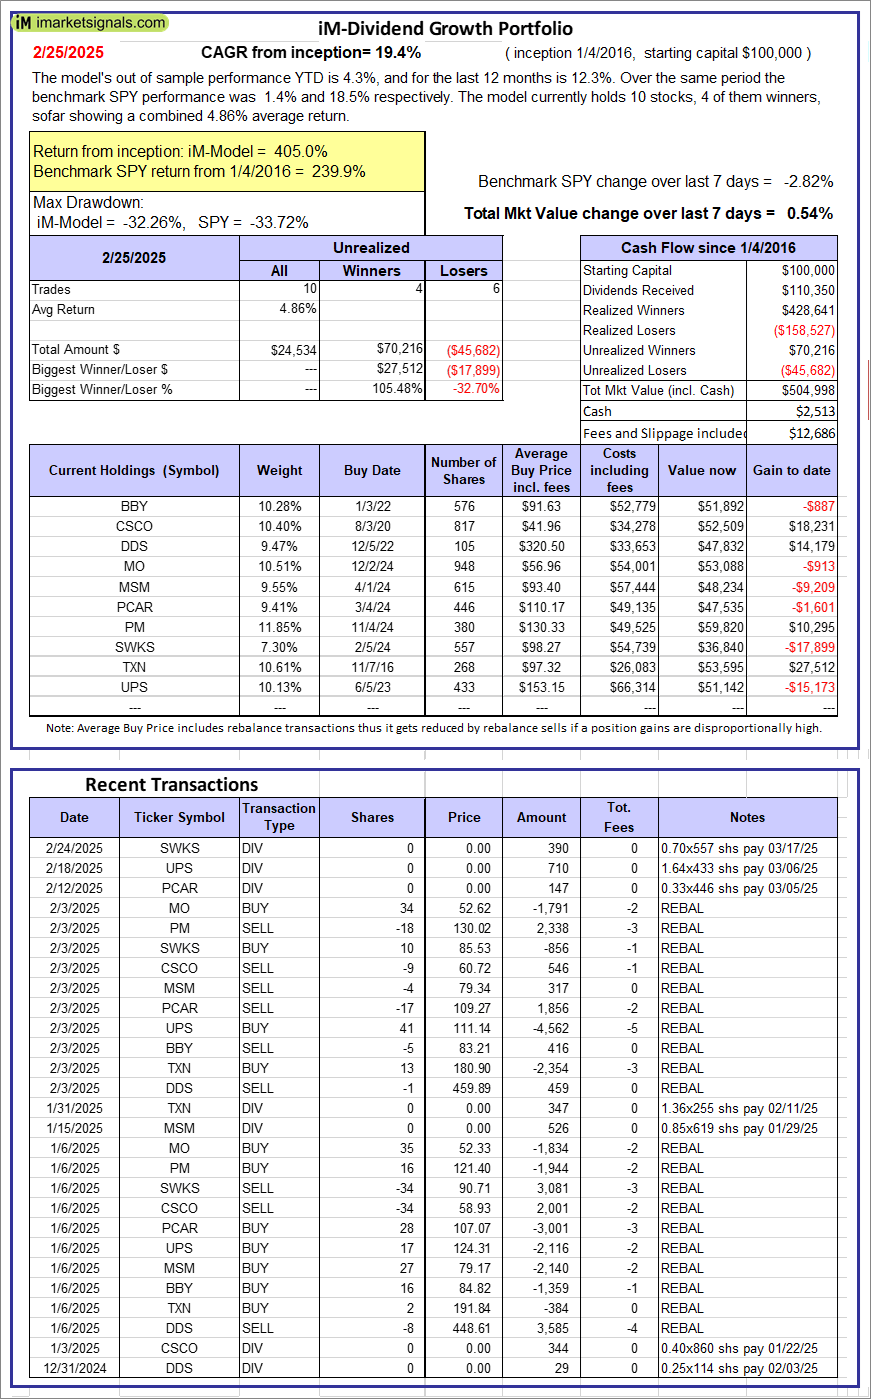 |
iM-Dividend Growth Portfolio: The model’s out of sample performance YTD is 4.3%, and for the last 12 months is 12.3%. Over the same period the benchmark SPY performance was 1.4% and 18.5% respectively. Over the previous week the market value of the iM-Dividend Growth Portfolio gained 0.54% at a time when SPY gained -2.82%. A starting capital of $100,000 at inception on 6/30/2016 would have grown to $504,998 which includes $2,513 cash and excludes $12,686 spent on fees and slippage. |
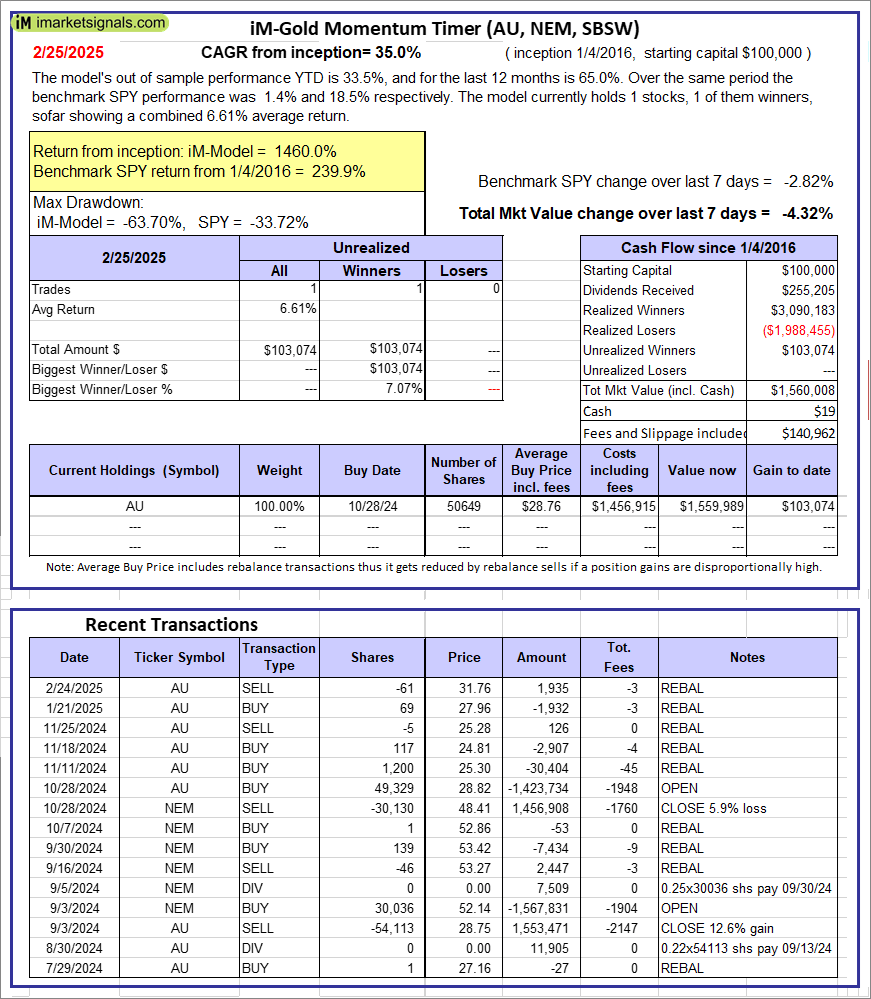 |
iM-Gold Momentum Timer (AU, NEM, SBSW): The model’s out of sample performance YTD is 33.5%, and for the last 12 months is 65.0%. Over the same period the benchmark SPY performance was 1.4% and 18.5% respectively. Over the previous week the market value of iM-Gold Momentum Timer (AU, NEM, SBSW) gained -4.32% at a time when SPY gained -2.82%. A starting capital of $100,000 at inception on 6/30/2016 would have grown to $19 which includes $140,962 cash and excludes Gain to date spent on fees and slippage. |
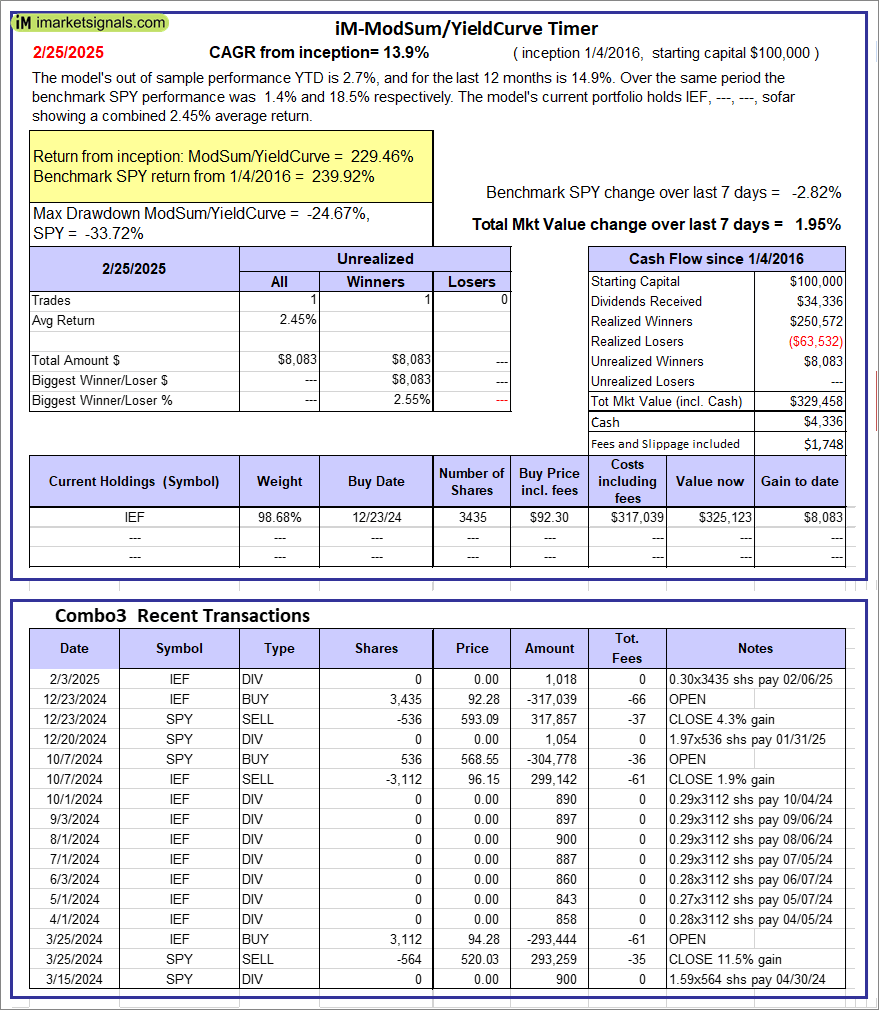 |
iM-ModSum/YieldCurve Timer: The model’s out of sample performance YTD is 2.7%, and for the last 12 months is 14.9%. Over the same period the benchmark SPY performance was 1.4% and 18.5% respectively. Over the previous week the market value of iM-PortSum/YieldCurve Timer gained 1.95% at a time when SPY gained -2.82%. A starting capital of $100,000 at inception on 1/1/2016 would have grown to $329,458 which includes $4,336 cash and excludes $1,748 spent on fees and slippage. |
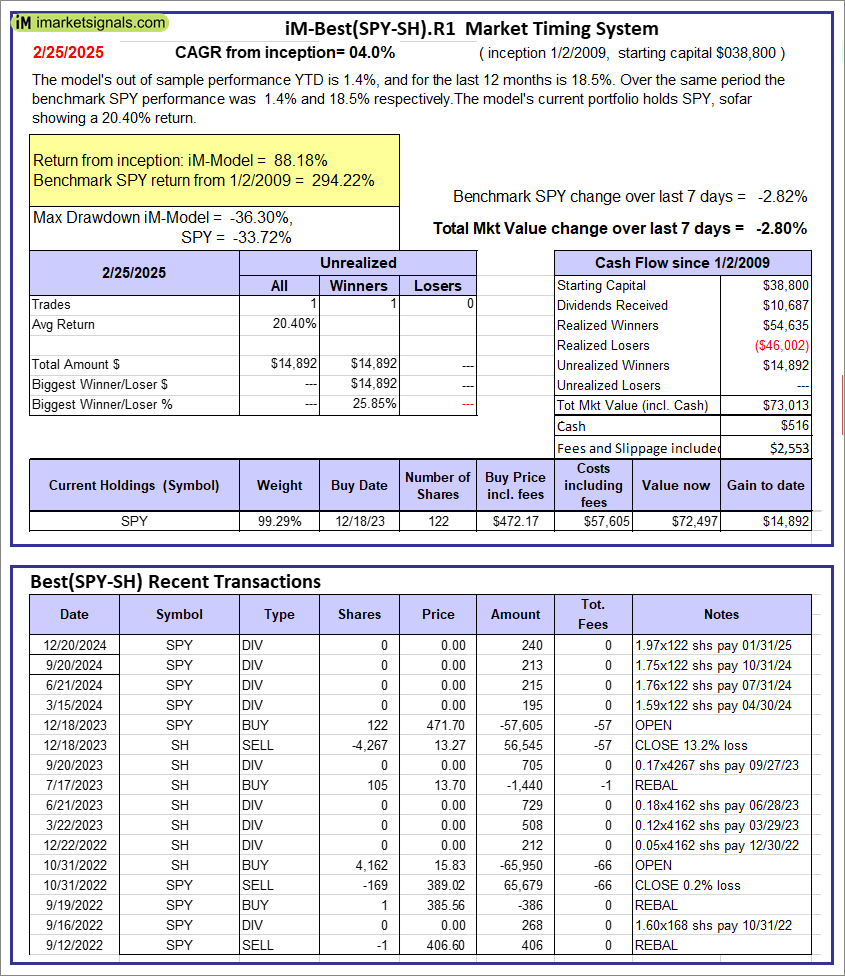 |
iM-Best(SPY-SH).R1: The model’s out of sample performance YTD is 1.4%, and for the last 12 months is 18.5%. Over the same period the benchmark SPY performance was 1.4% and 18.5% respectively. Over the previous week the market value of Best(SPY-SH) gained -2.80% at a time when SPY gained -2.82%. A starting capital of $100,000 at inception on 1/2/2009 would have grown to $73,013 which includes $516 cash and excludes $2,553 spent on fees and slippage. |
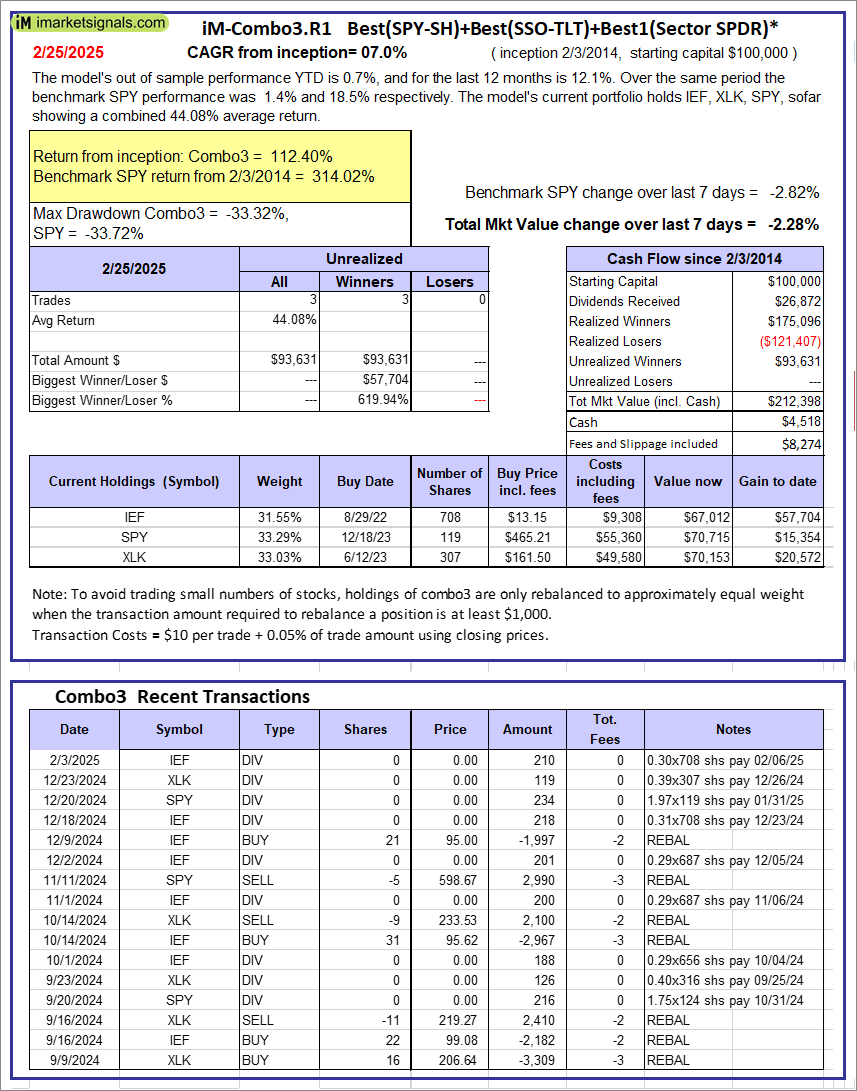 |
iM-Combo3.R1: The model’s out of sample performance YTD is 0.7%, and for the last 12 months is 12.1%. Over the same period the benchmark SPY performance was 1.4% and 18.5% respectively. Over the previous week the market value of iM-Combo3.R1 gained -2.28% at a time when SPY gained -2.82%. A starting capital of $100,000 at inception on 2/3/2014 would have grown to $212,398 which includes $4,518 cash and excludes $8,274 spent on fees and slippage. |
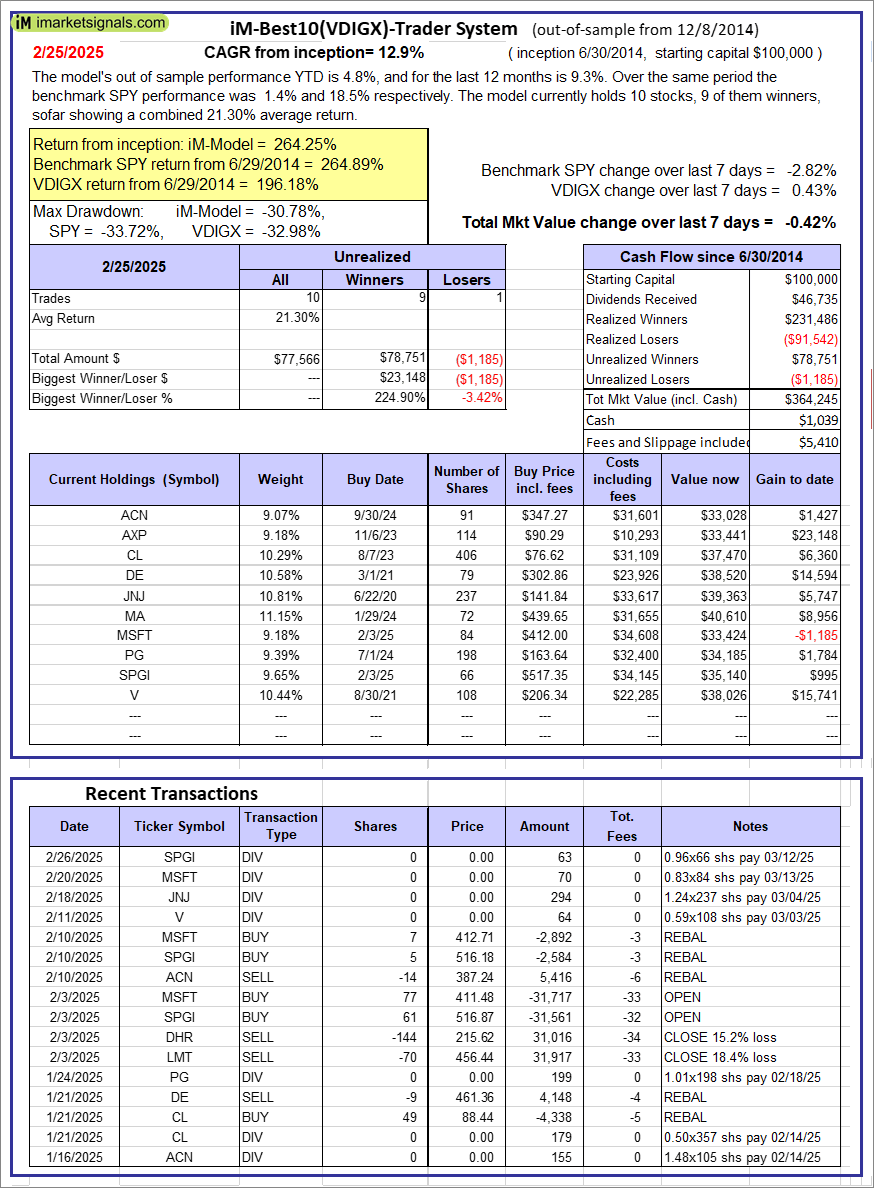 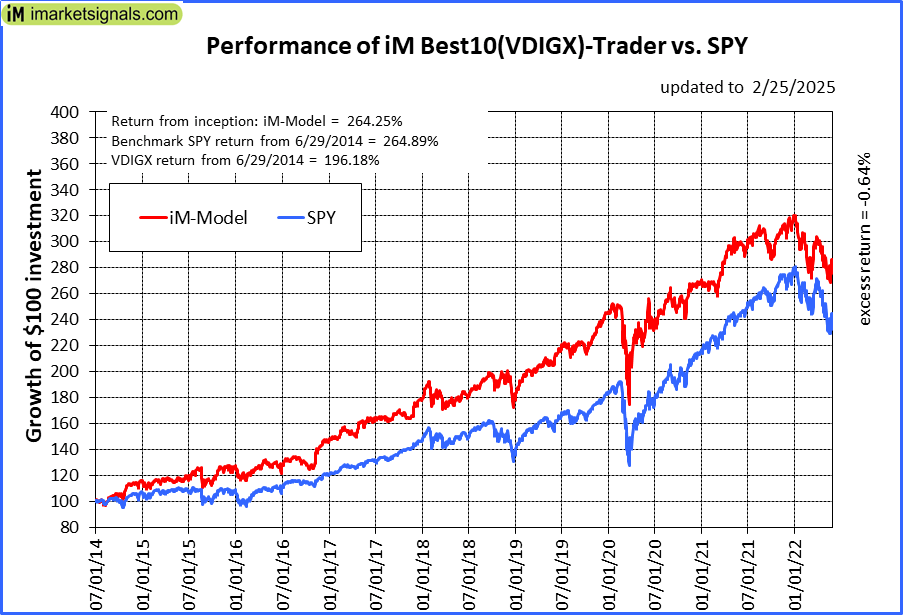 |
iM-Best10(VDIGX)-Trader: The model’s out of sample performance YTD is 4.8%, and for the last 12 months is 9.3%. Over the same period the benchmark SPY performance was 1.4% and 18.5% respectively. Since inception, on 7/1/2014, the model gained 264.25% while the benchmark SPY gained 264.89% and VDIGX gained 196.18% over the same period. Over the previous week the market value of iM-Best10(VDIGX) gained -0.42% at a time when SPY gained -2.82%. A starting capital of $100,000 at inception on 7/1/2014 would have grown to $364,245 which includes $1,039 cash and excludes $5,410 spent on fees and slippage. |
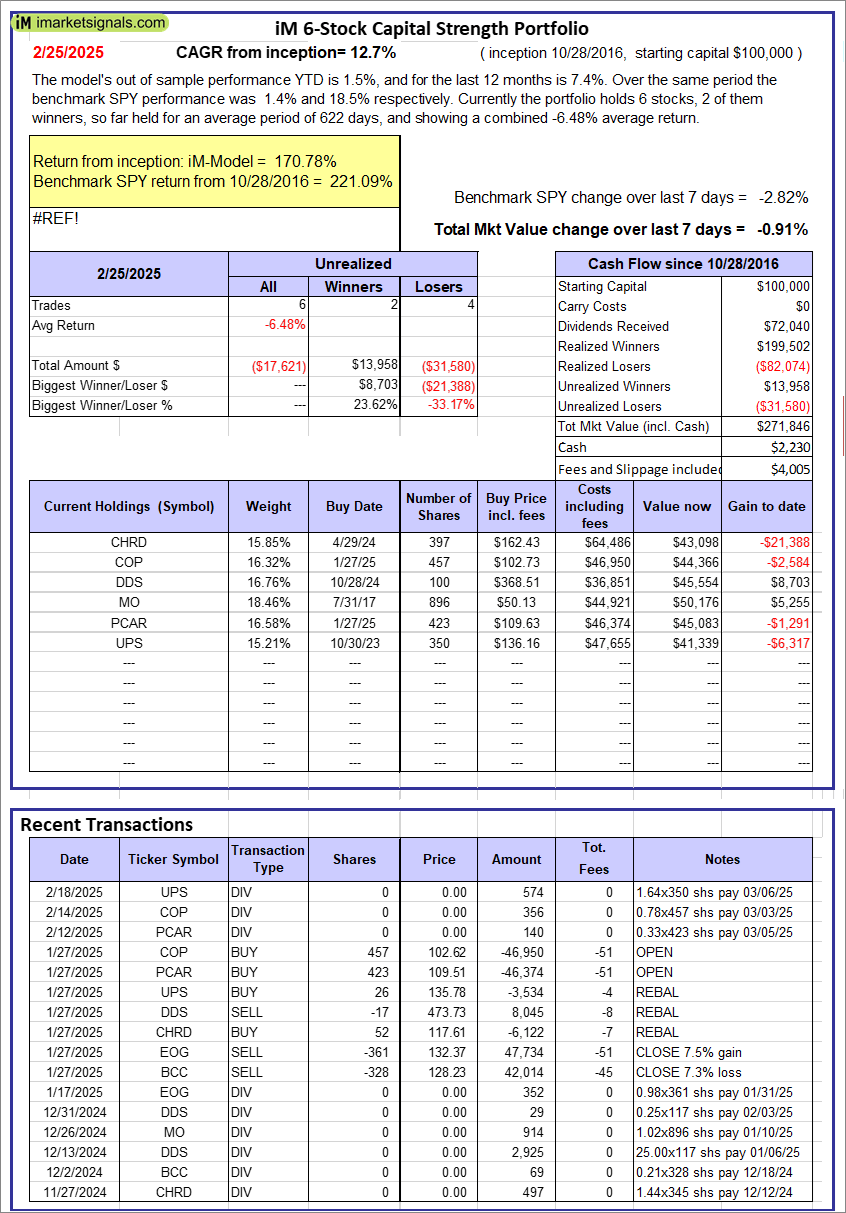 |
iM 6-Stock Capital Strength Portfolio: The model’s out of sample performance YTD is 1.5%, and for the last 12 months is 7.4%. Over the same period the benchmark SPY performance was 1.4% and 18.5% respectively. Over the previous week the market value of the iM 6-Stock Capital Strength Portfolio gained -0.91% at a time when SPY gained -2.82%. A starting capital of $100,000 at inception on 10/28/2016 would have grown to $271,846 which includes $2,230 cash and excludes $4,005 spent on fees and slippage. |
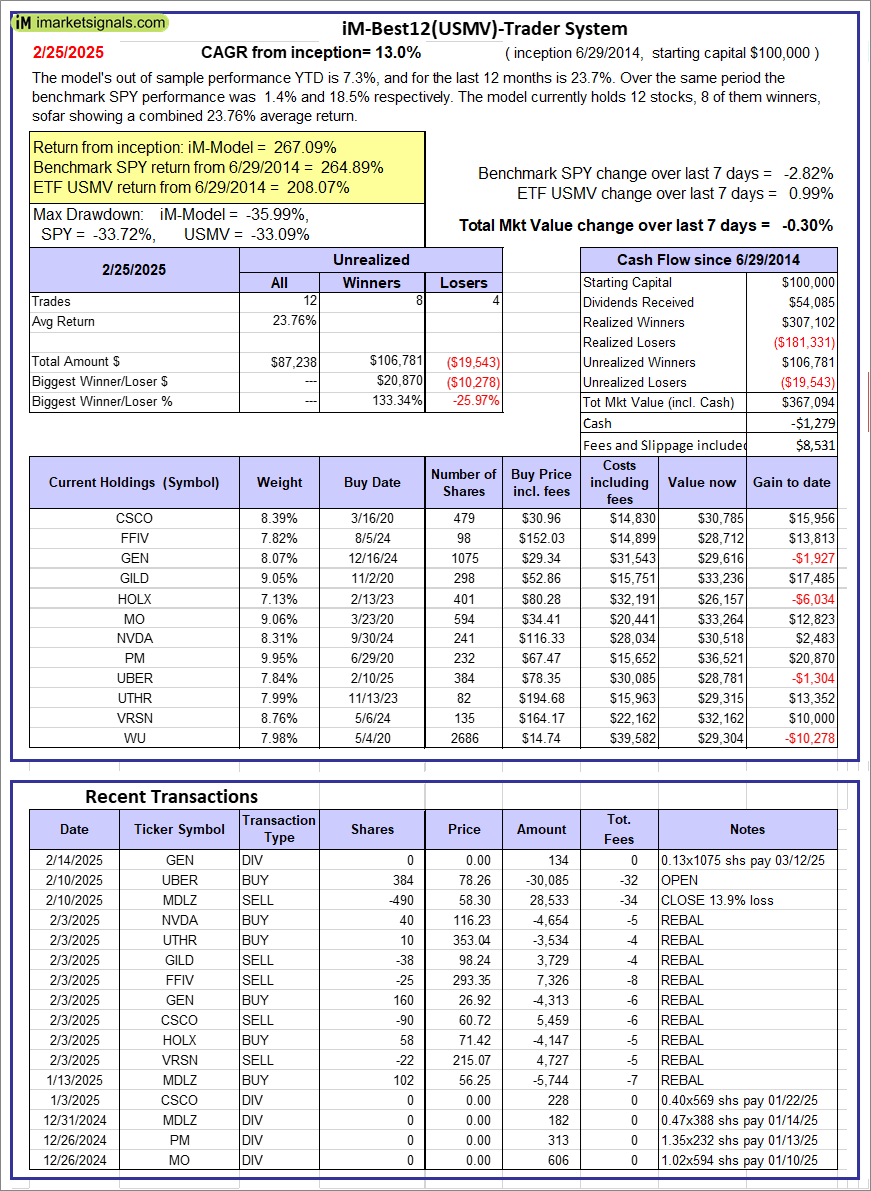 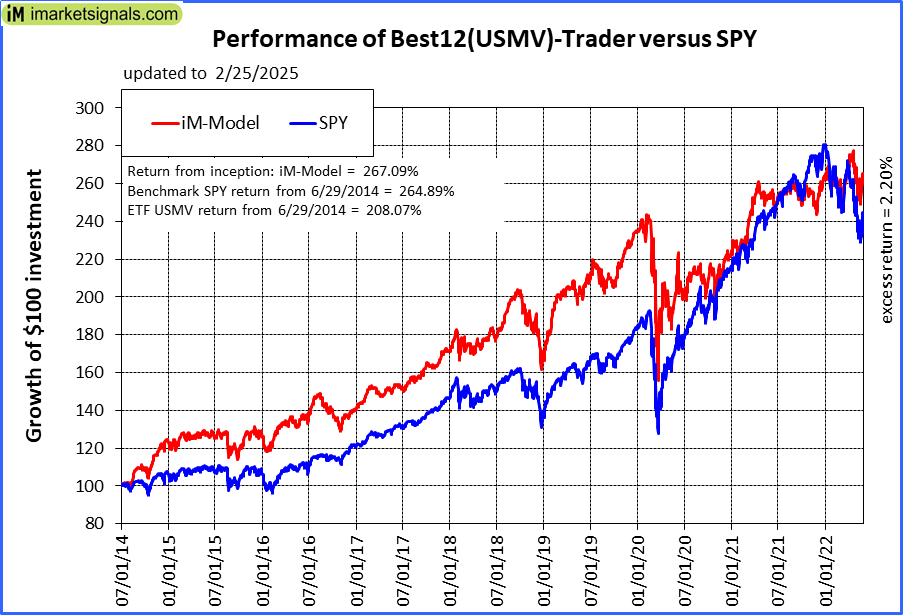 |
iM-Best12(USMV)-Trader: The model’s out of sample performance YTD is 7.3%, and for the last 12 months is 23.7%. Over the same period the benchmark SPY performance was 1.4% and 18.5% respectively. Since inception, on 6/30/2014, the model gained 267.09% while the benchmark SPY gained 264.89% and the ETF USMV gained 208.07% over the same period. Over the previous week the market value of iM-Best12(USMV)-Trader gained -0.30% at a time when SPY gained -2.82%. A starting capital of $100,000 at inception on 6/30/2014 would have grown to $367,094 which includes -$1,279 cash and excludes $8,531 spent on fees and slippage. |
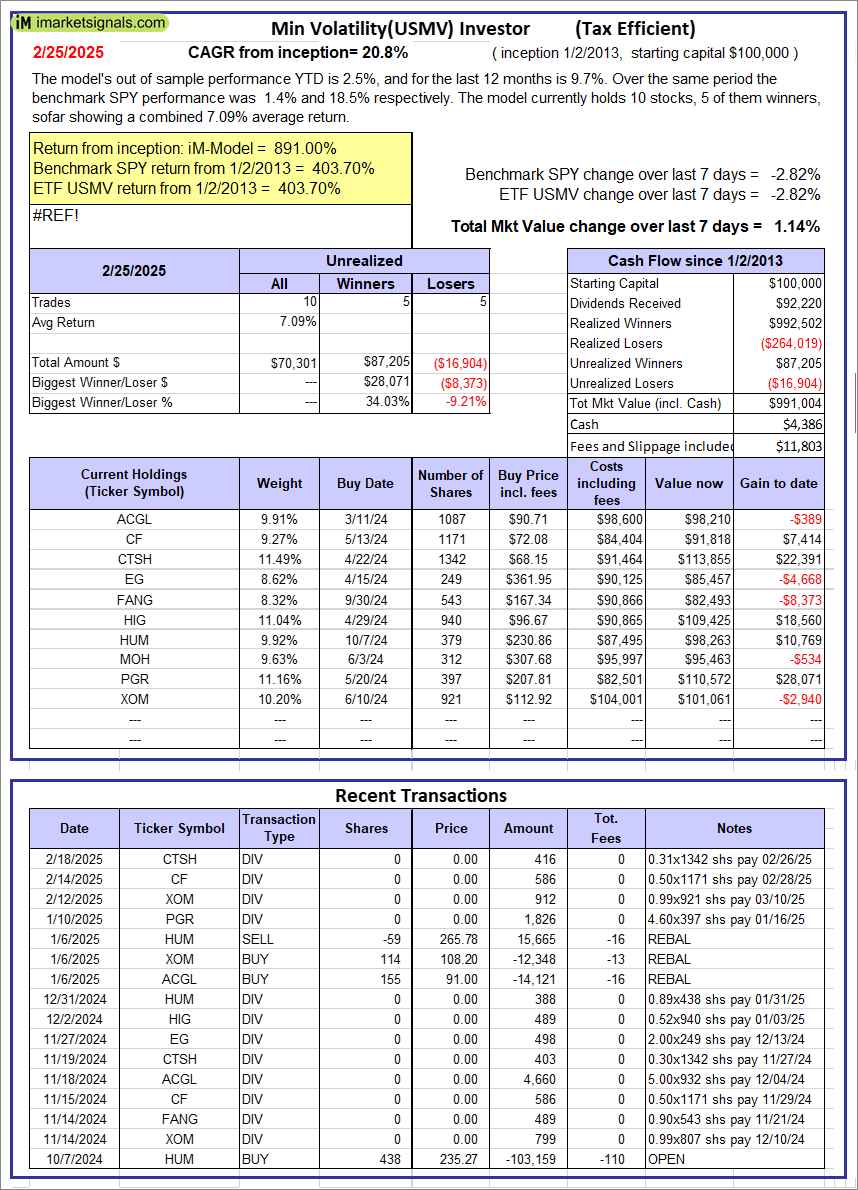 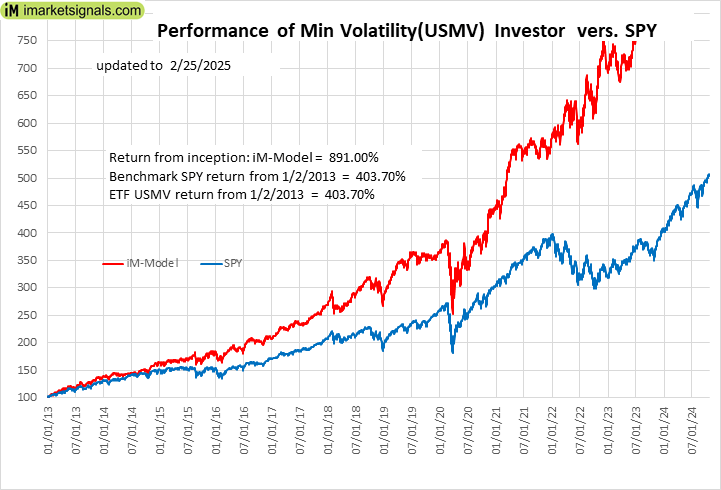 |
iM-Min Volatility(USMV) Investor (Tax Efficient): The model’s out of sample performance YTD is 2.5%, and for the last 12 months is 9.7%. Over the same period the benchmark SPY performance was 1.4% and 18.5% respectively. Since inception, on 1/3/2013, the model gained 891.00% while the benchmark SPY gained 403.70% and the ETF USMV gained 403.70% over the same period. Over the previous week the market value of iM-Best12(USMV)Q1 gained 1.14% at a time when SPY gained -2.82%. A starting capital of $100,000 at inception on 1/3/2013 would have grown to $991,004 which includes $4,386 cash and excludes $11,803 spent on fees and slippage. |
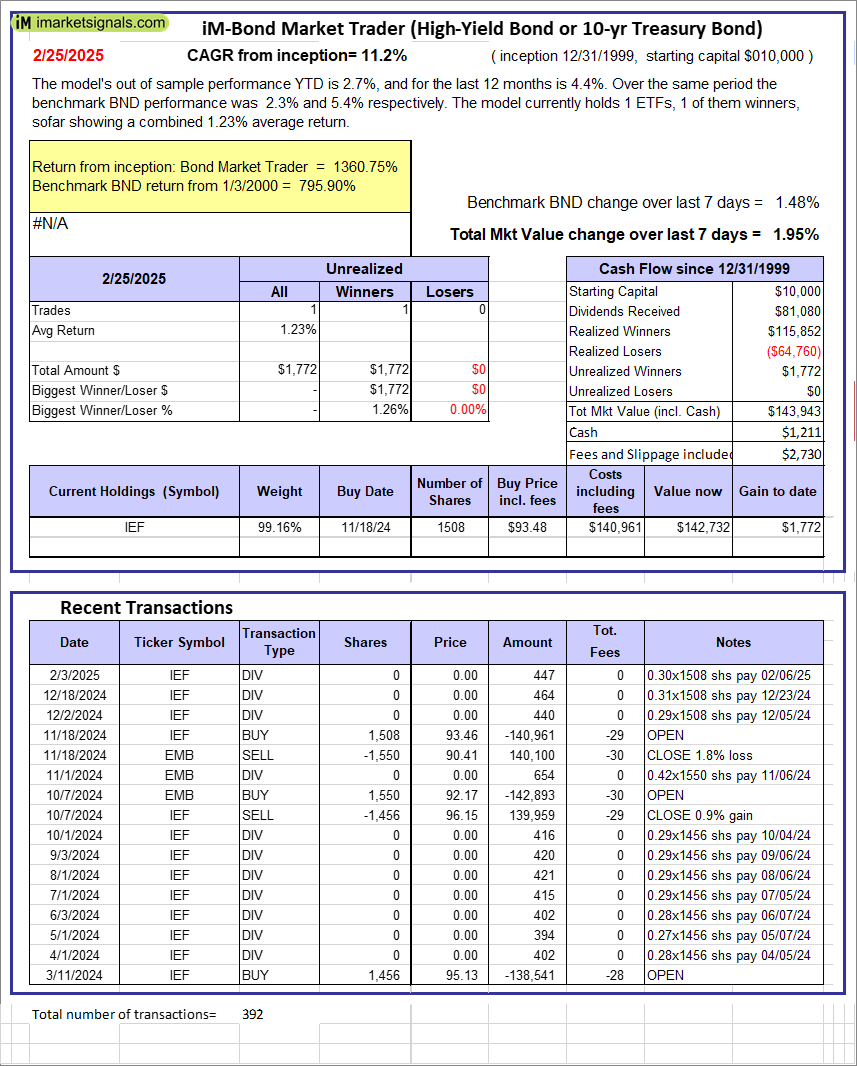 |
iM-Bond Market Trader (High-Yield Bond or 10-yr Treasury Bond): The model’s out of sample performance YTD is 2.7%, and for the last 12 months is 4.4%. Over the same period the benchmark BND performance was 2.3% and 5.4% respectively. Over the previous week the market value of the iM-Bond Market Trader (High-Yield Bond or 10-yr Treasury Bond) gained 1.95% at a time when BND gained 1.48%. A starting capital of $10,000 at inception on 1/3/2000 would have grown to $143,943 which includes $1,211 cash and excludes $2,730 spent on fees and slippage. |
|
|
iM-ModSum/YieldCurve Timer: The model’s out of sample performance YTD is 2.7%, and for the last 12 months is 14.9%. Over the same period the benchmark SPY performance was 1.4% and 18.5% respectively. Over the previous week the market value of iM-PortSum/YieldCurve Timer gained 1.95% at a time when SPY gained -2.82%. A starting capital of $100,000 at inception on 1/1/2016 would have grown to $329,458 which includes $4,336 cash and excludes $1,748 spent on fees and slippage. |
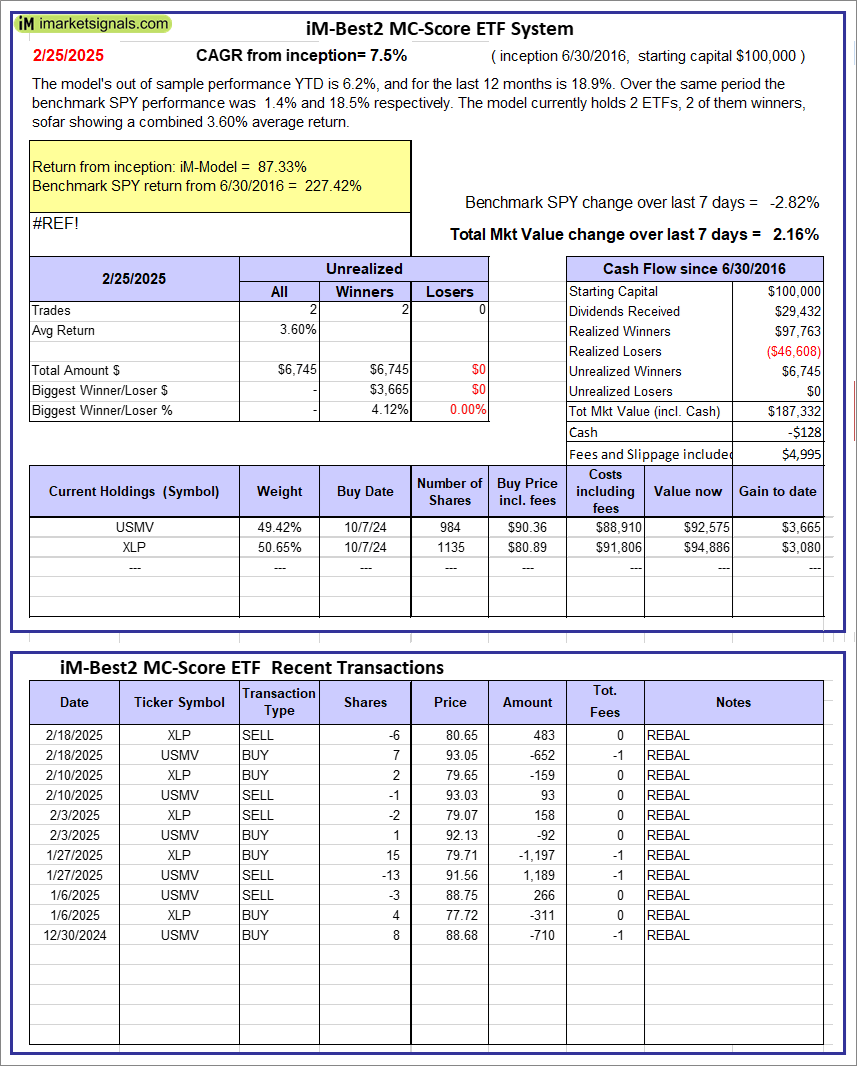 |
iM-Best2 MC-Score ETF System: The model’s out of sample performance YTD is 6.2%, and for the last 12 months is 18.9%. Over the same period the benchmark SPY performance was 1.4% and 18.5% respectively. Over the previous week the market value of the iM-Best2 MC-Score ETF System gained 2.16% at a time when SPY gained -2.82%. A starting capital of $100,000 at inception on 6/30/2016 would have grown to $187,332 which includes -$128 cash and excludes $4,995 spent on fees and slippage. |
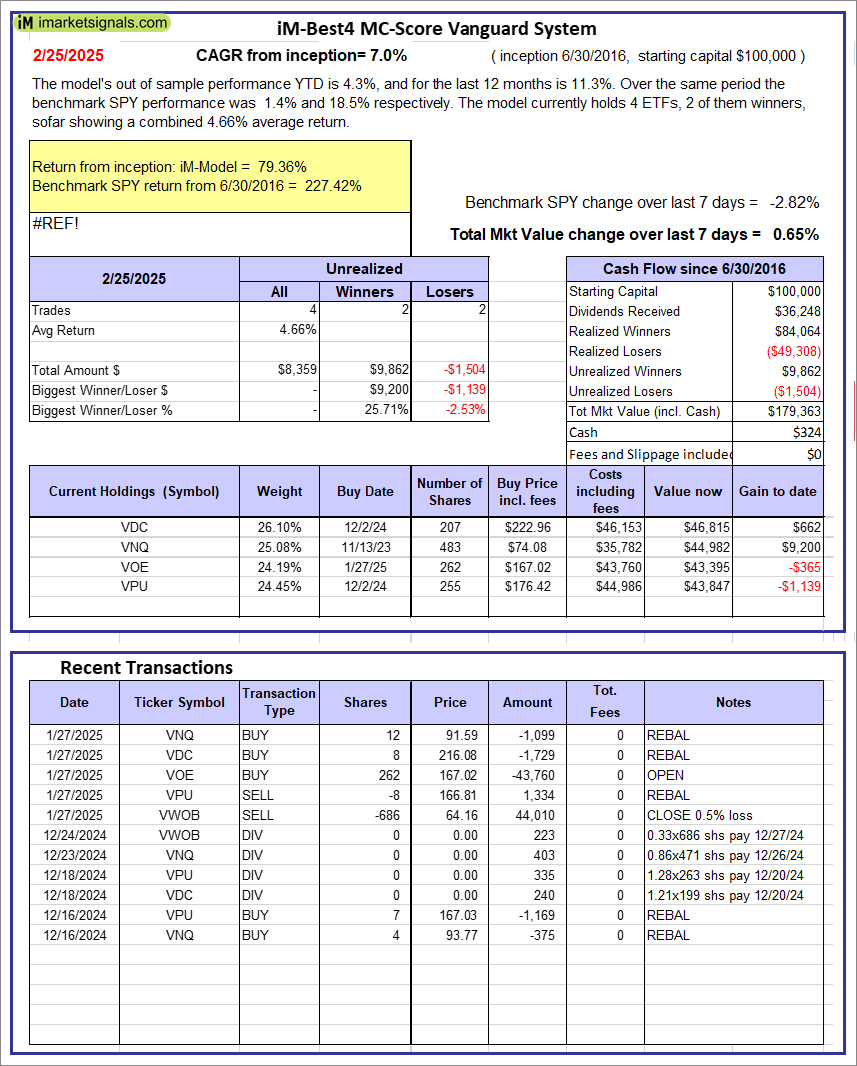 |
iM-Best4 MC-Score Vanguard System: The model’s out of sample performance YTD is 4.3%, and for the last 12 months is 11.3%. Over the same period the benchmark SPY performance was 1.4% and 18.5% respectively. Over the previous week the market value of the iM-Best4 MC-Score Vanguard System gained 0.65% at a time when SPY gained -2.82%. A starting capital of $100,000 at inception on 6/30/2016 would have grown to $179,363 which includes $324 cash and excludes $00 spent on fees and slippage. |
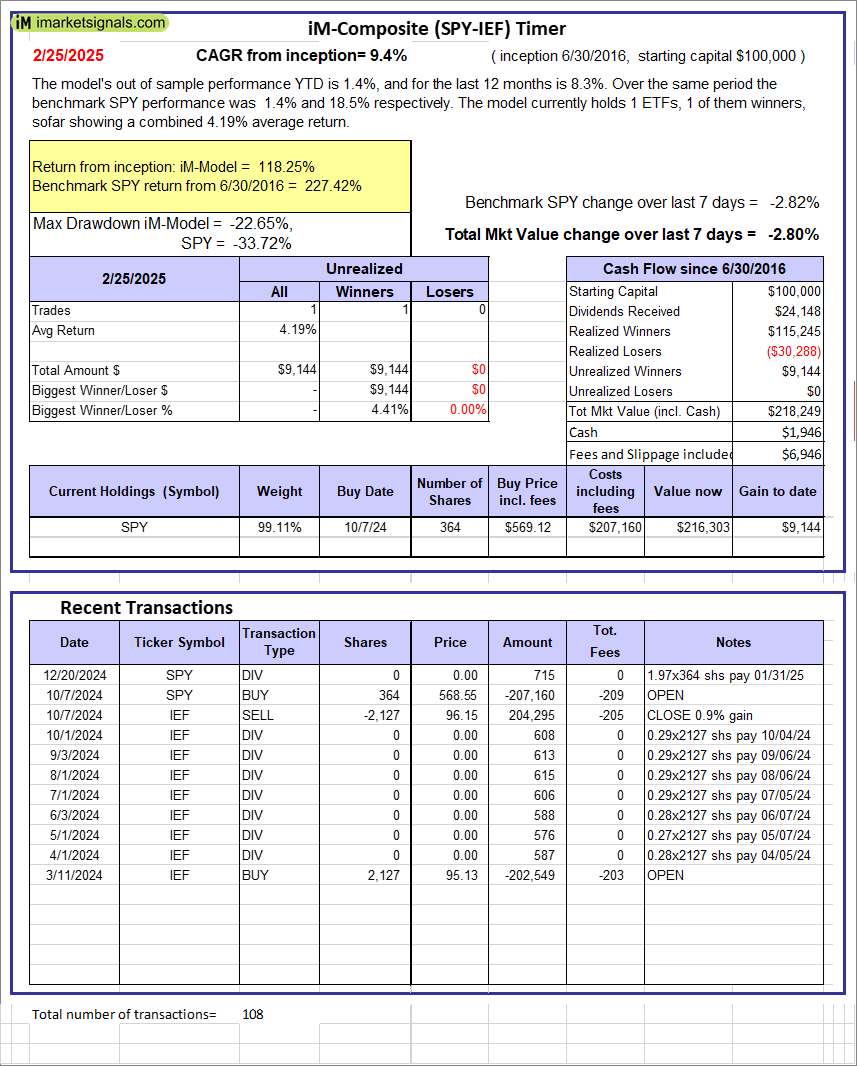 |
iM-Composite (SPY-IEF) Timer: The model’s out of sample performance YTD is 1.4%, and for the last 12 months is 8.3%. Over the same period the benchmark SPY performance was 1.4% and 18.5% respectively. Over the previous week the market value of the iM-Composite (SPY-IEF) Timer gained -2.80% at a time when SPY gained -2.82%. A starting capital of $100,000 at inception on 6/30/2016 would have grown to $218,249 which includes $1,946 cash and excludes $6,946 spent on fees and slippage. |
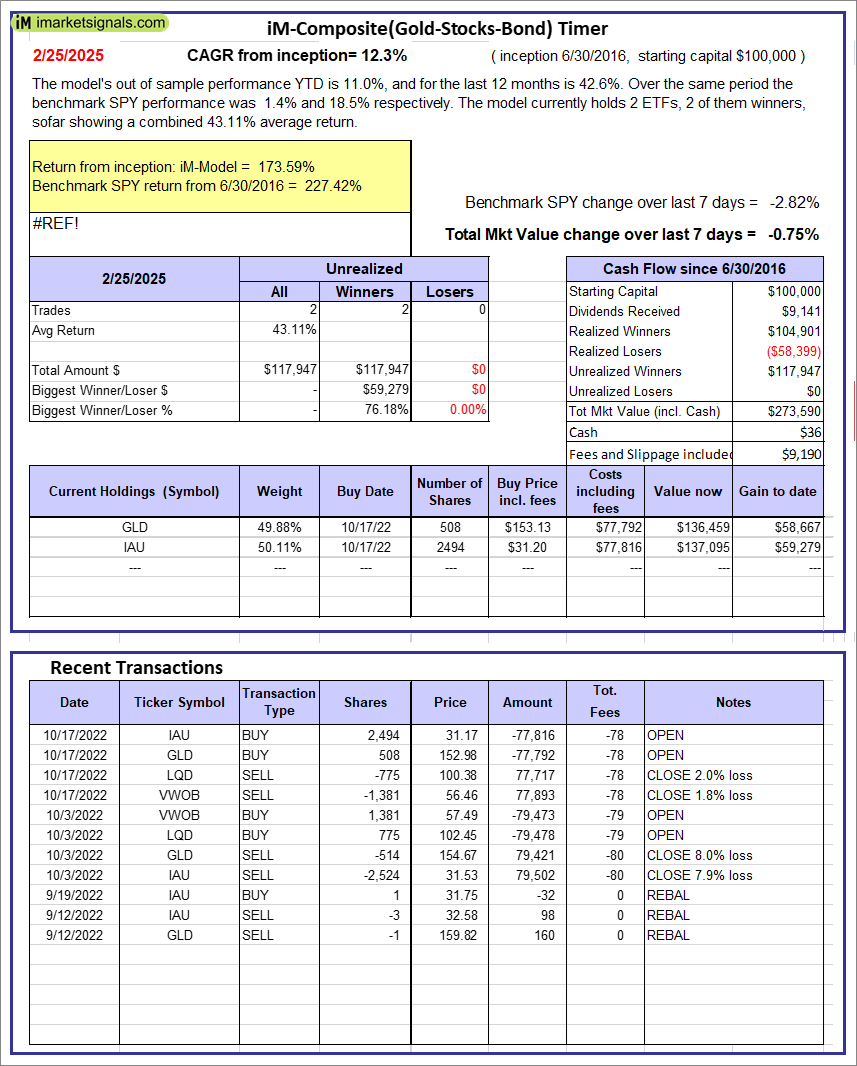 |
iM-Composite(Gold-Stocks-Bond) Timer: The model’s out of sample performance YTD is 11.0%, and for the last 12 months is 42.6%. Over the same period the benchmark SPY performance was 1.4% and 18.5% respectively. Over the previous week the market value of the iM-Composite(Gold-Stocks-Bond) Timer gained -0.75% at a time when SPY gained -2.82%. A starting capital of $100,000 at inception on 6/30/2016 would have grown to $273,590 which includes $36 cash and excludes $9,190 spent on fees and slippage. |
iM-Best Reports – 2/25/2025
Posted in pmp SPY-SH
Leave a Reply
You must be logged in to post a comment.