
  |
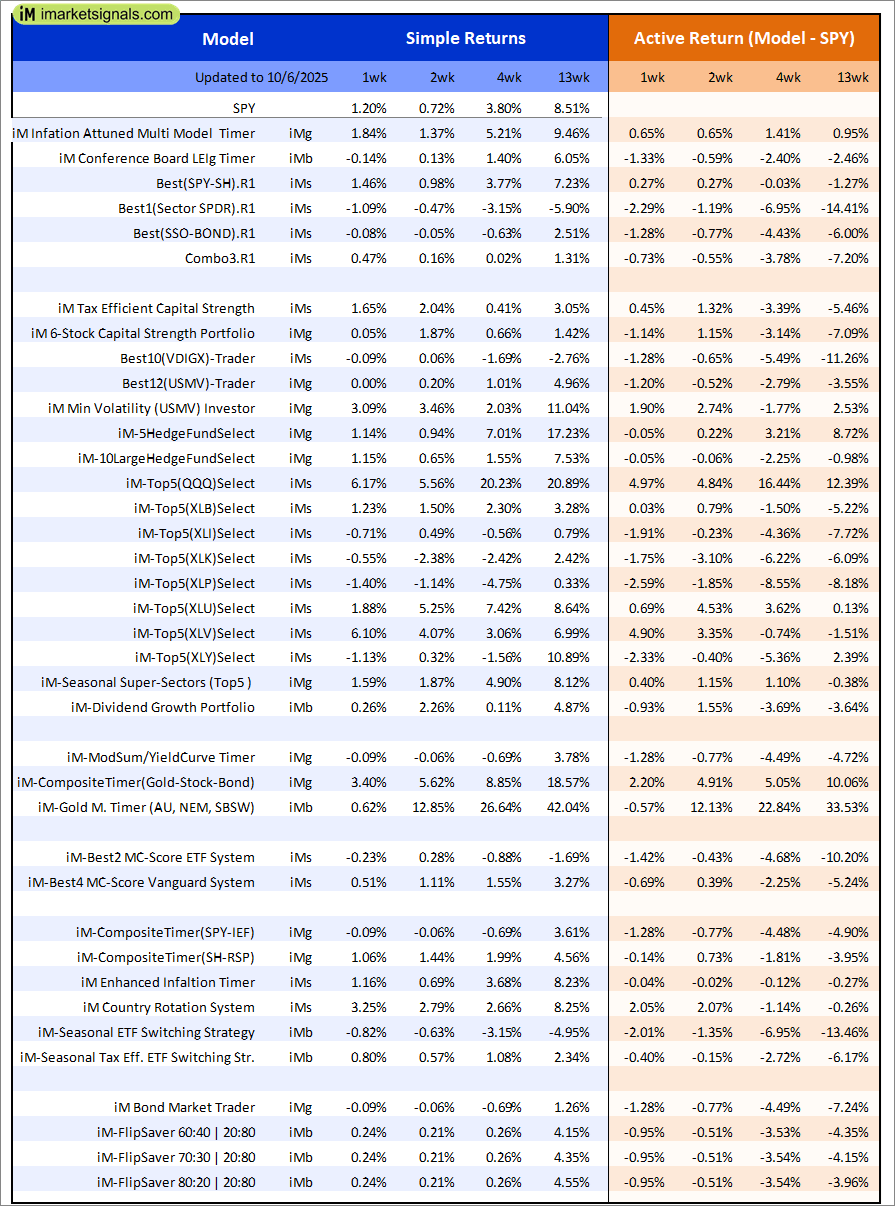
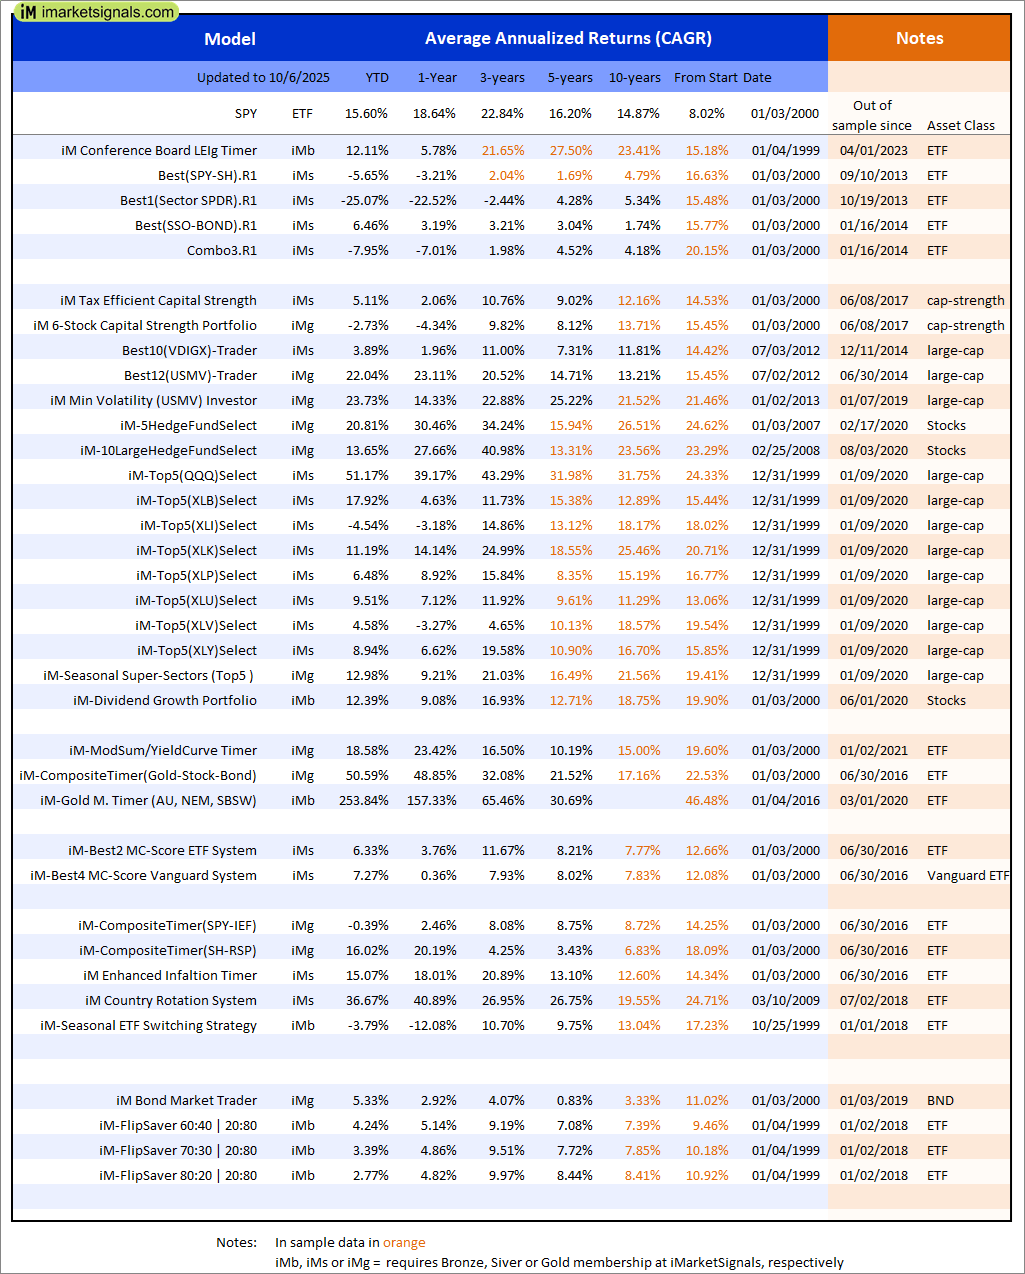
Out of sample performance summary of our models for the past 1, 2, 4 and 13 week periods. The active active return indicates how the models over- or underperformed the benchmark ETF SPY. Also the YTD, and the 1-, 3-, 5- and 10-year annualized returns are shown in the second table |
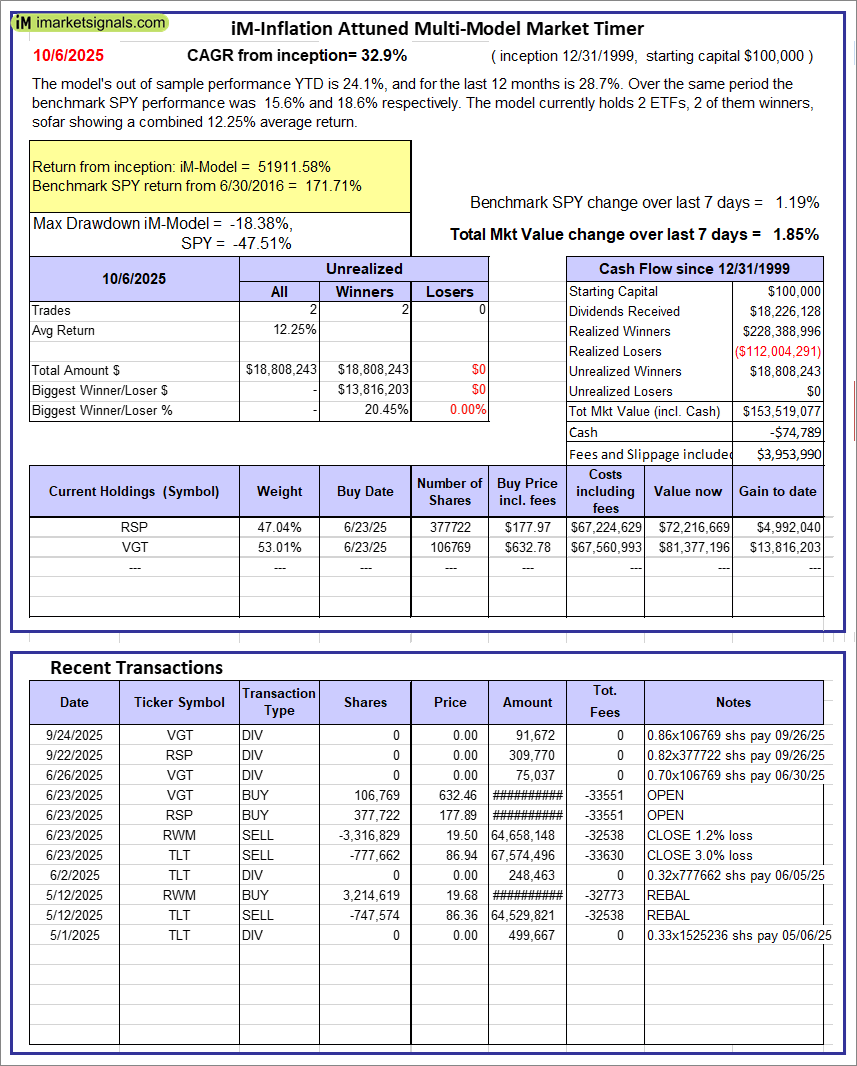 |
iM-Inflation Attuned Multi-Model Market Timer: The model’s out of sample performance YTD is 24.1%, and for the last 12 months is 28.7%. Over the same period the benchmark SPY performance was 15.6% and 18.6% respectively. Over the previous week the market value of the iM-Inflation Attuned Multi-Model Market Timer gained 1.85% at a time when SPY gained 1.19%. A starting capital of $100,000 at inception on 3/24/2017 would have grown to $153,519,077 which includes -$74,789 cash and excludes $3,953,990 spent on fees and slippage. |
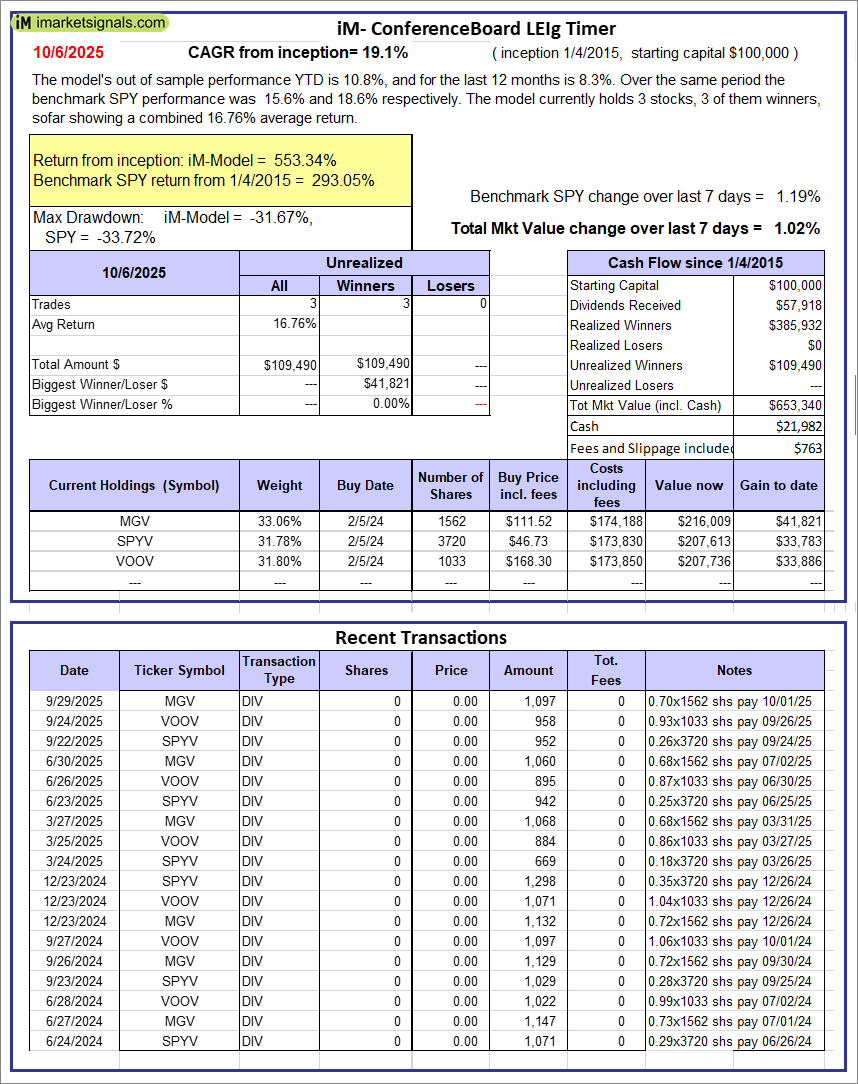 |
iM-Conference Board LEIg Timer: The model’s performance YTD is 14.3%, and for the last 12 months is 7.3%. Over the same period the benchmark SPY performance was 20.1% and 9.4% respectively. Over the previous week the market value of the iM-Conference Board LEIg Timer gained 1.02% at a time when SPY gained 1.19%. A starting capital of $100,000 at inception on 4/5/2017 would have grown to $653,340 which includes $21,982 cash and excludes $763 spent on fees and slippage. |
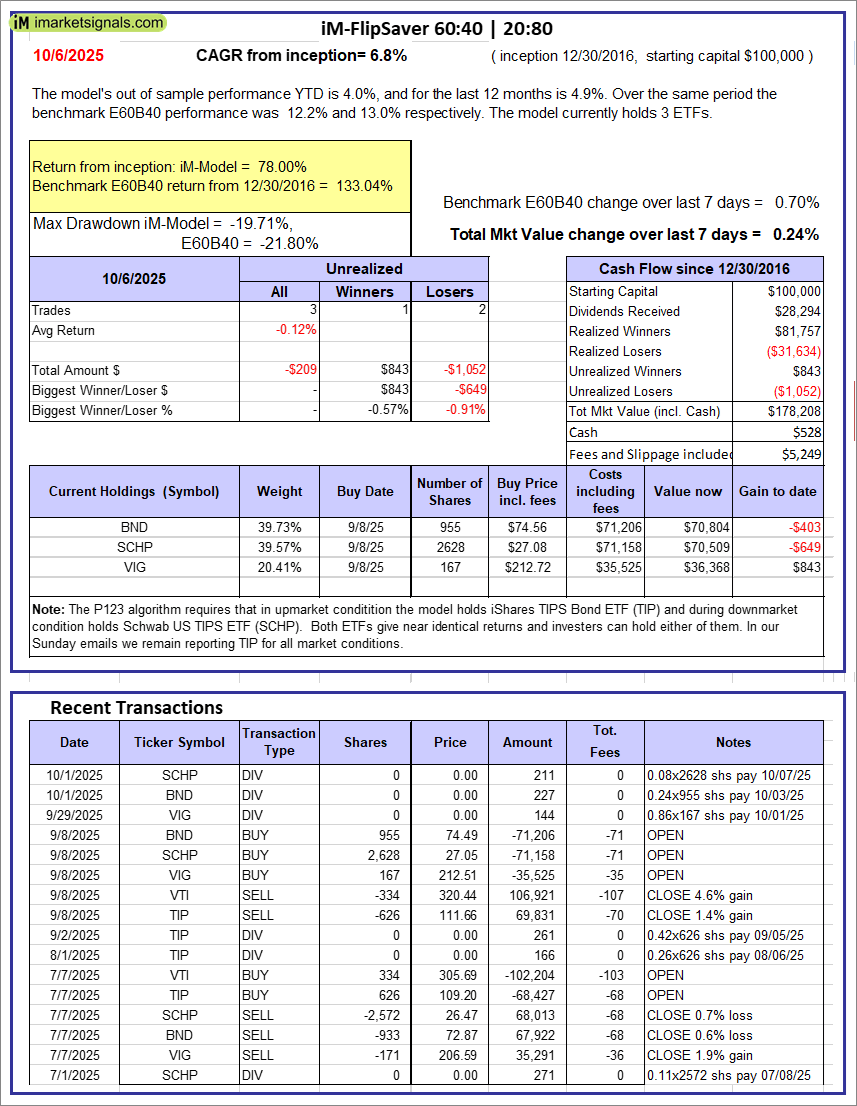 |
iM-FlipSaver 60:40 | 20:80 – 2017: The model’s out of sample performance YTD is 4.0%, and for the last 12 months is 4.9%. Over the same period the benchmark E60B40 performance was 12.2% and 13.0% respectively. Over the previous week the market value of iM-FlipSaver 80:20 | 20:80 gained 0.24% at a time when SPY gained 0.70%. A starting capital of $100,000 at inception on 7/16/2015 would have grown to $178,208 which includes $528 cash and excludes $5,249 spent on fees and slippage. |
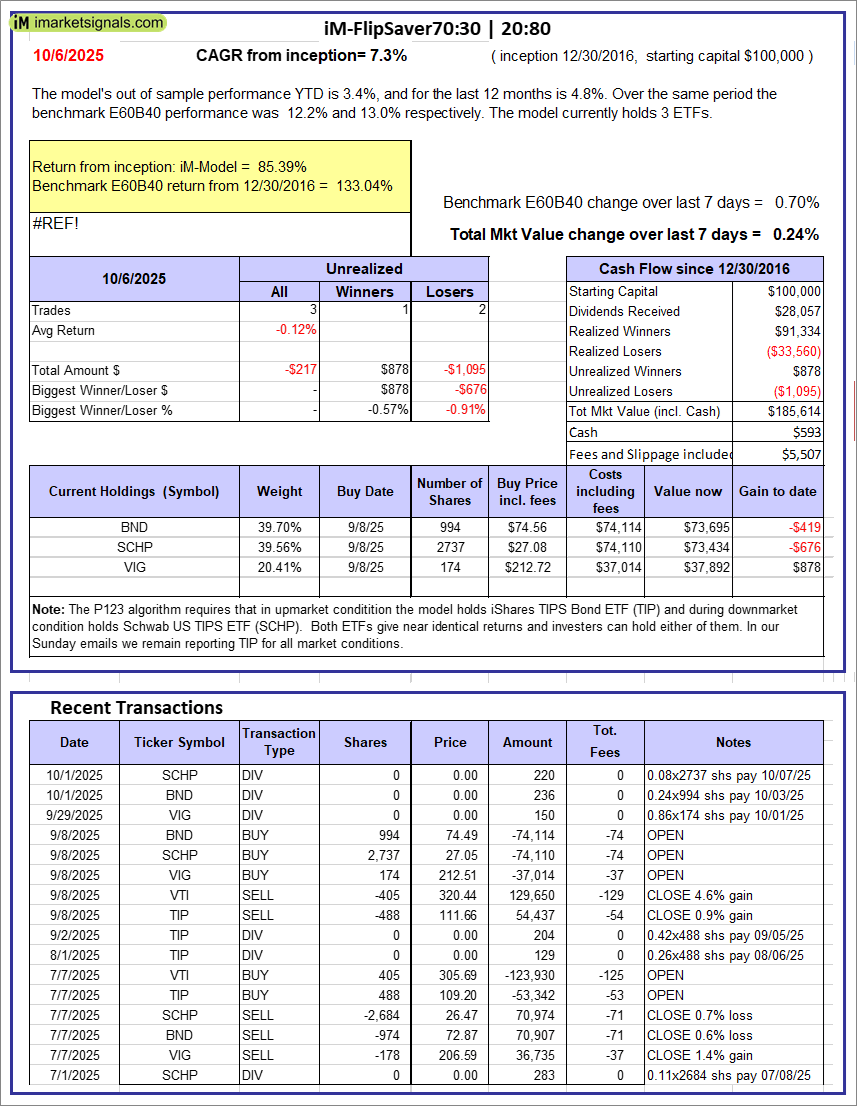 |
iM-FlipSaver 70:30 | 20:80 – 2017: The model’s out of sample performance YTD is 3.4%, and for the last 12 months is 4.8%. Over the same period the benchmark E60B40 performance was 12.2% and 13.0% respectively. Over the previous week the market value of iM-FlipSaver 70:30 | 20:80 gained 0.24% at a time when SPY gained 0.70%. A starting capital of $100,000 at inception on 7/15/2015 would have grown to $185,614 which includes $593 cash and excludes $5,507 spent on fees and slippage. |
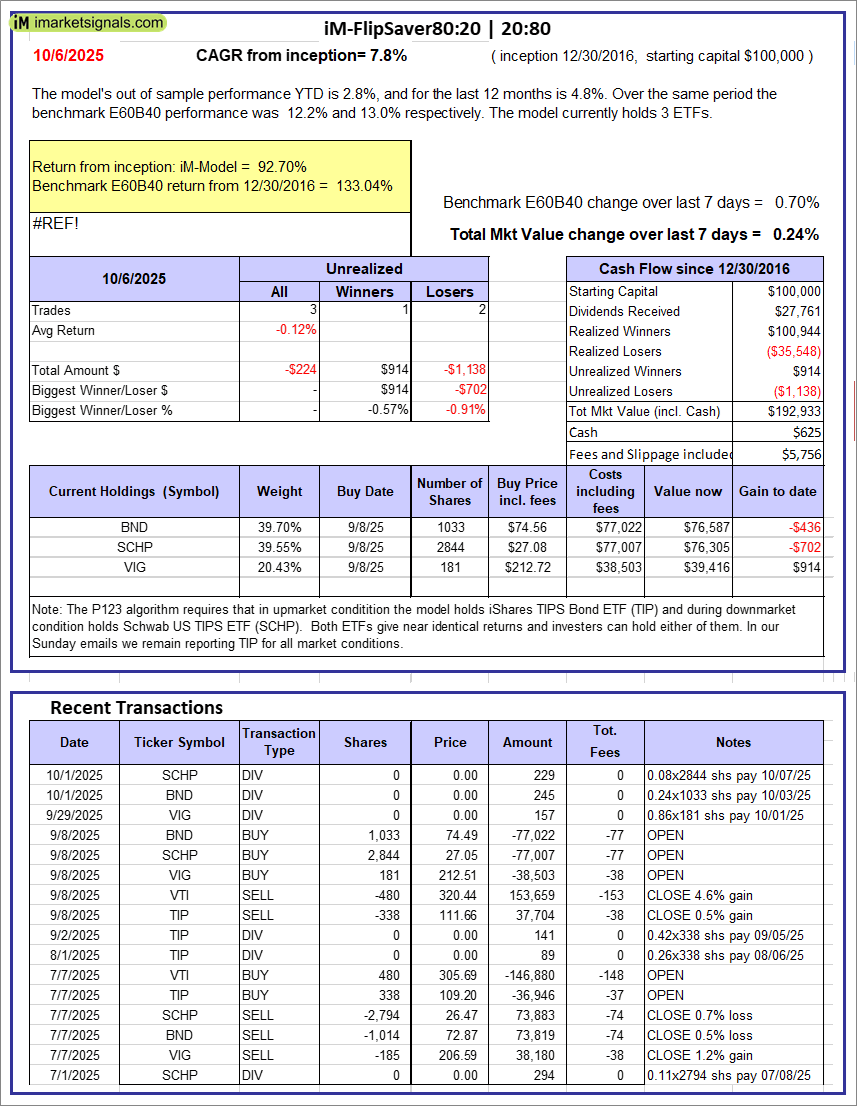 |
iM-FlipSaver 80:20 | 20:80 – 2017: The model’s out of sample performance YTD is 2.8%, and for the last 12 months is 4.8%. Over the same period the benchmark E60B40 performance was 12.2% and 13.0% respectively. Over the previous week the market value of iM-FlipSaver 80:20 | 20:80 gained 0.24% at a time when SPY gained 0.70%. A starting capital of $100,000 at inception on 1/2/2017 would have grown to $192,933 which includes $625 cash and excludes $5,756 spent on fees and slippage. |
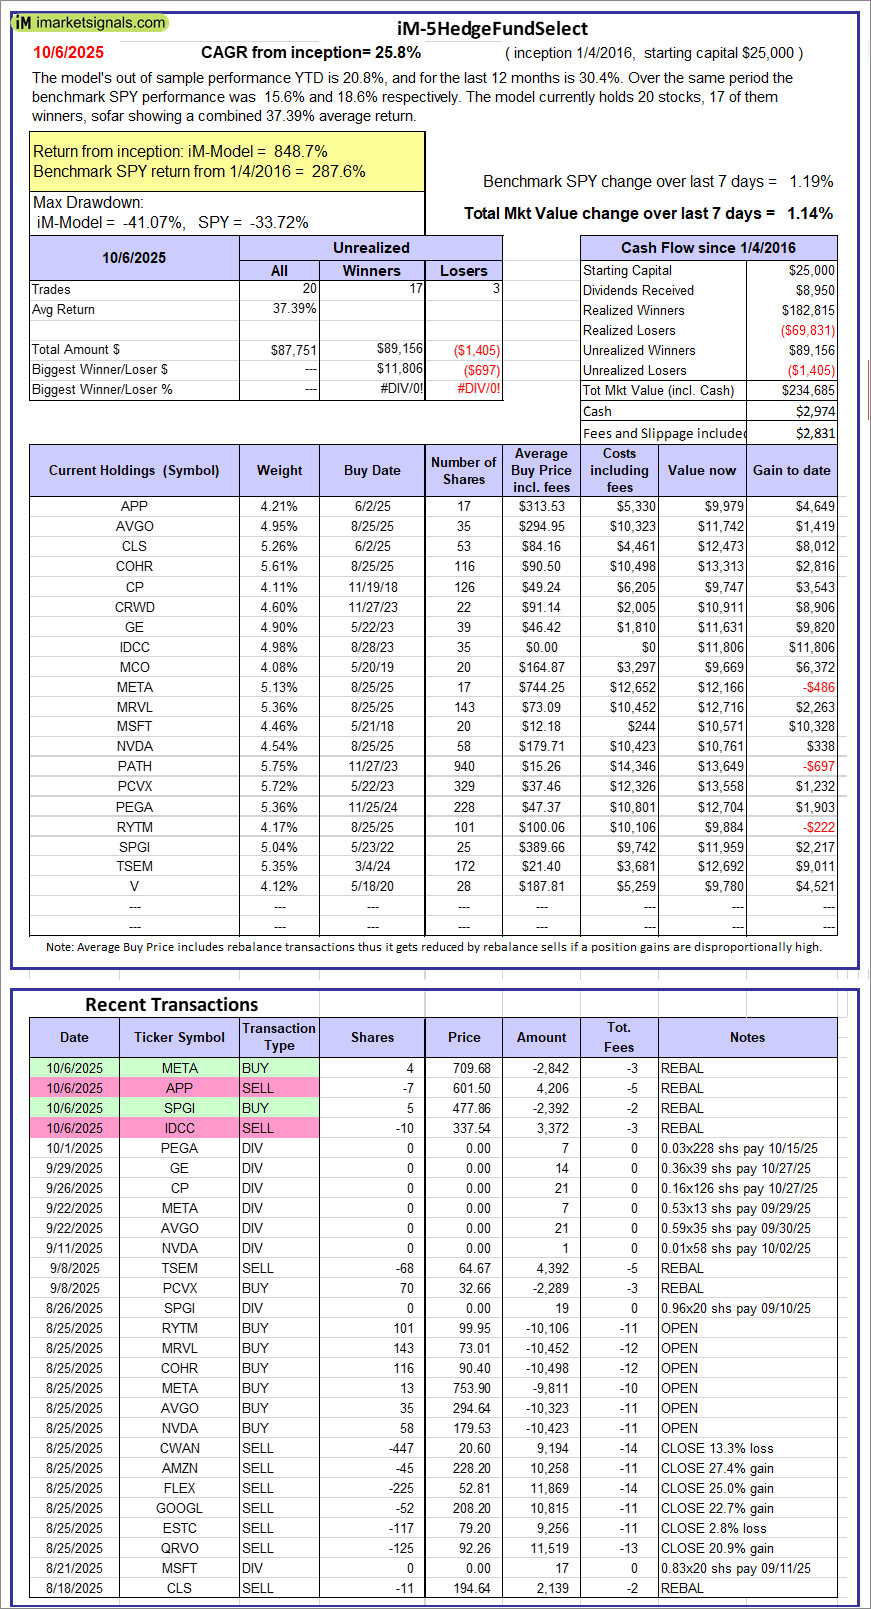 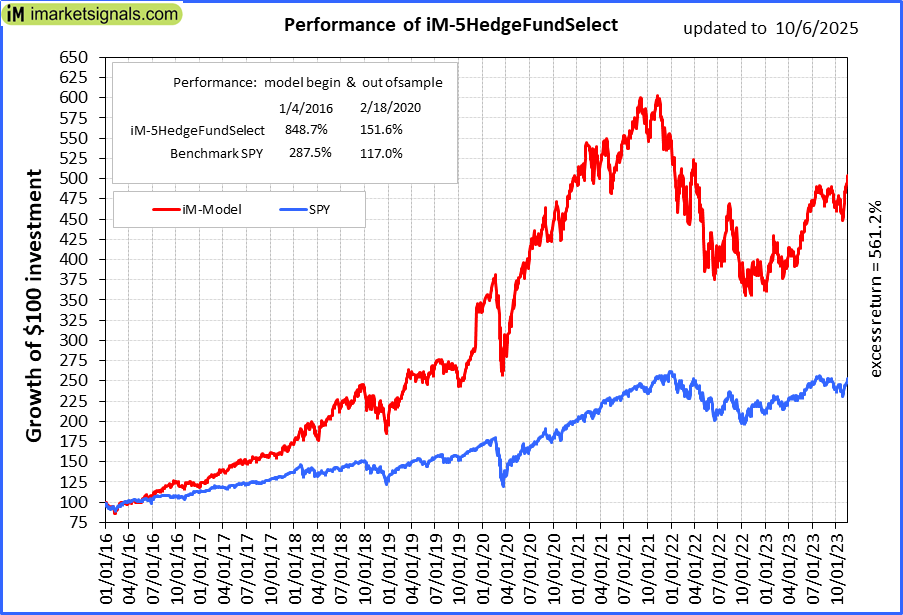 |
iM-5HedgeFundSelect: Since inception, on 1/5/2016, the model gained 848.72% while the benchmark SPY gained 287.55% over the same period. Over the previous week the market value of iM-5HedgeFundSelect gained 1.14% at a time when SPY gained 1.19%. A starting capital of $25,000 at inception on 1/5/2016 would have grown to $234,685 which includes $2,974 cash and excludes $2,831 spent on fees and slippage. |
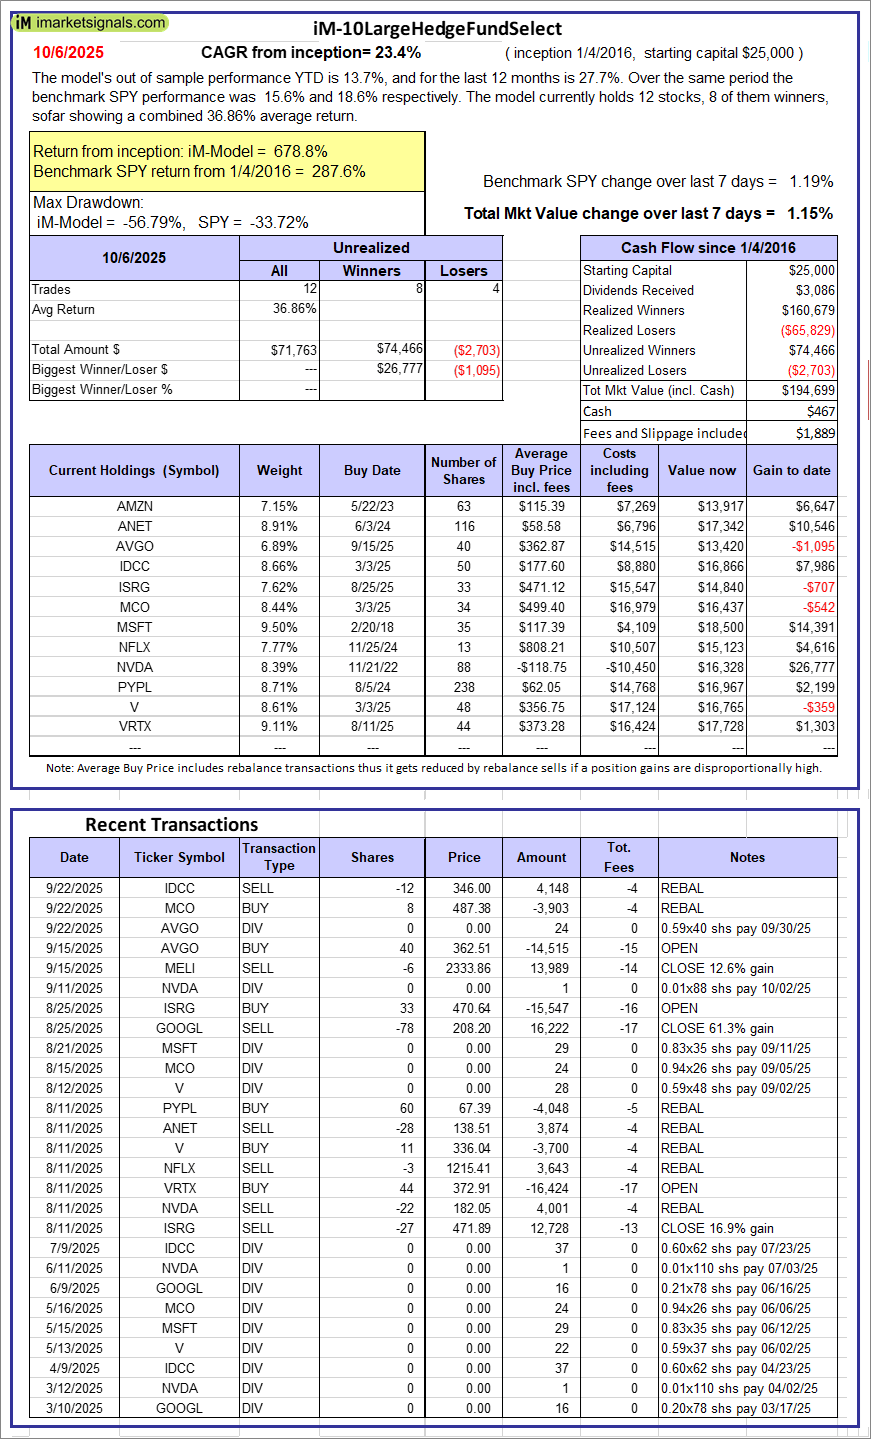 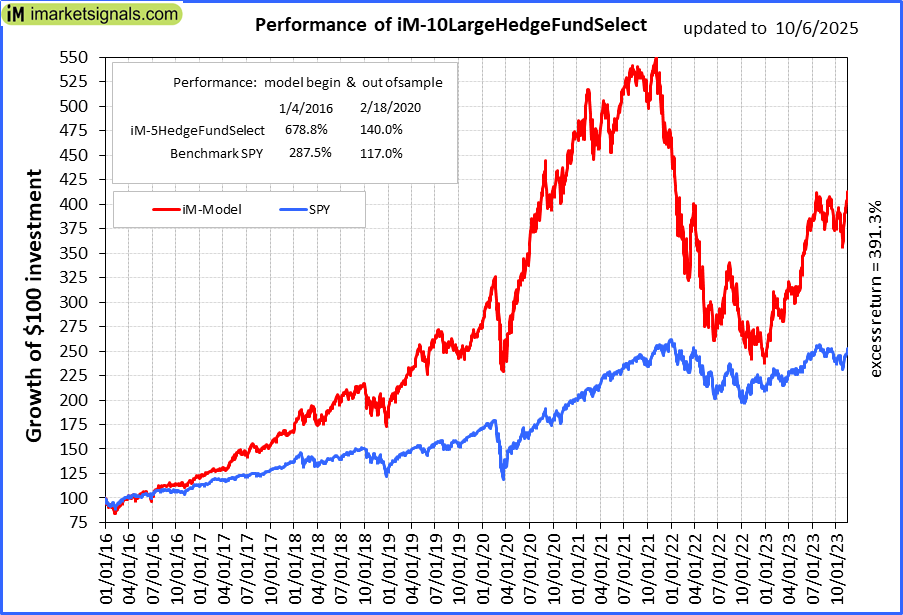 |
iM-10LargeHedgeFundSelect: Since inception, on 1/5/2016, the model gained 678.80% while the benchmark SPY gained 287.55% over the same period. Over the previous week the market value of iM-10LargeHedgeFundSelect gained 1.15% at a time when SPY gained 1.19%. A starting capital of $25,000 at inception on 1/5/2016 would have grown to $194,699 which includes $467 cash and excludes $1,889 spent on fees and slippage. |
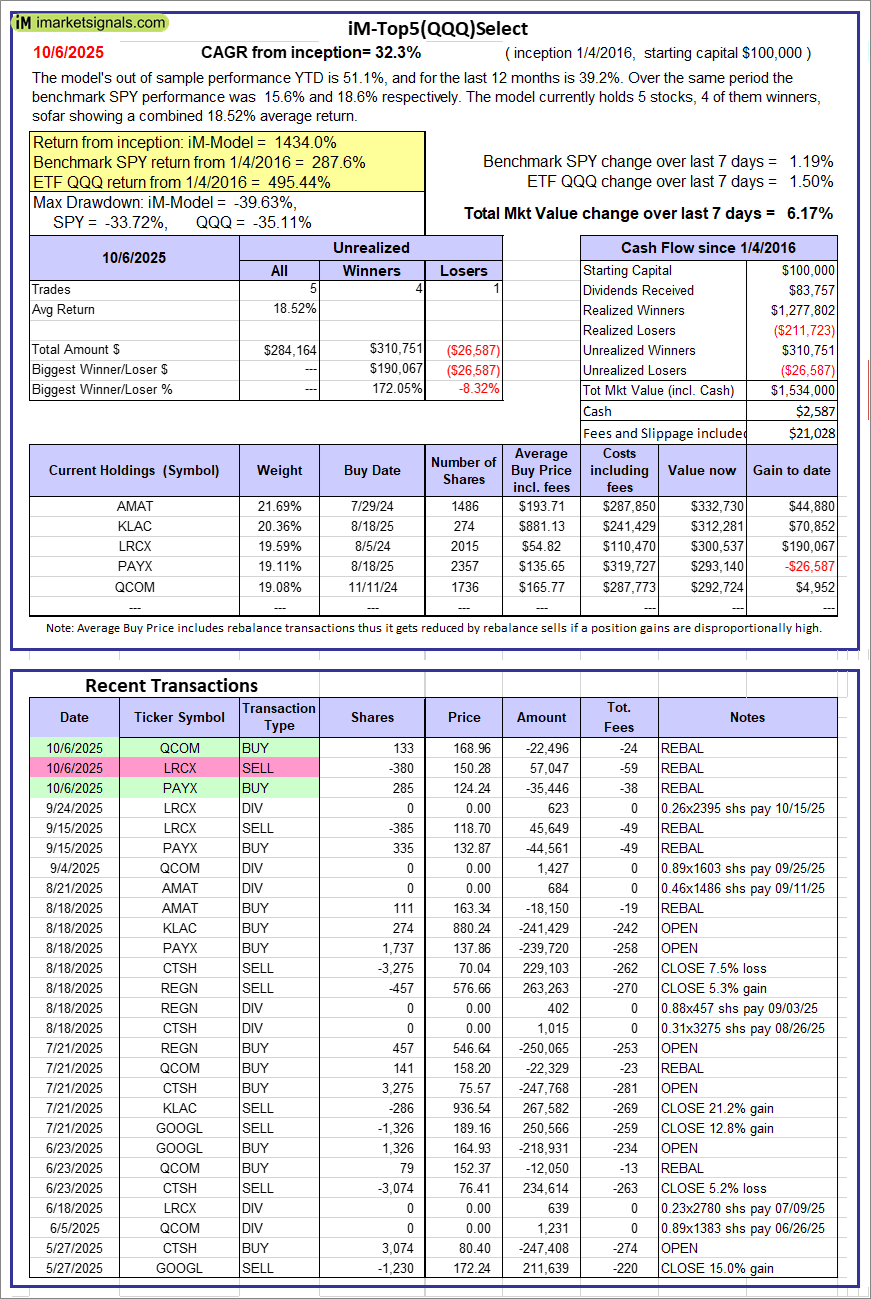 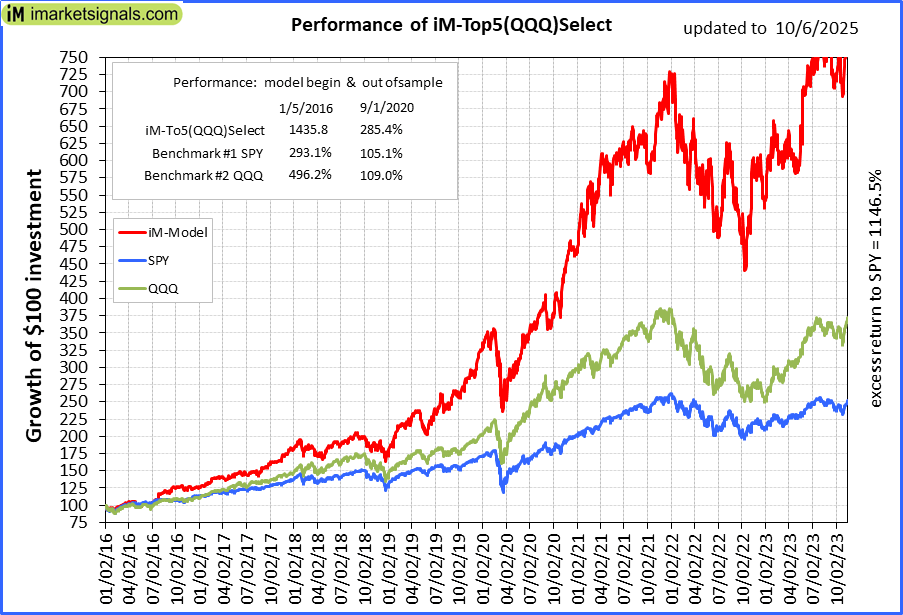 |
iM-Top5(QQQ)Select: Since inception, on 1/5/2016, the model gained 1434.00% while the benchmark SPY gained 287.55% over the same period. Over the previous week the market value of iM-Top5(QQQ)Select gained 6.17% at a time when SPY gained 1.19%. A starting capital of $100,000 at inception on 1/5/2016 would have grown to $1,534,000 which includes $2,587 cash and excludes $21,028 spent on fees and slippage. |
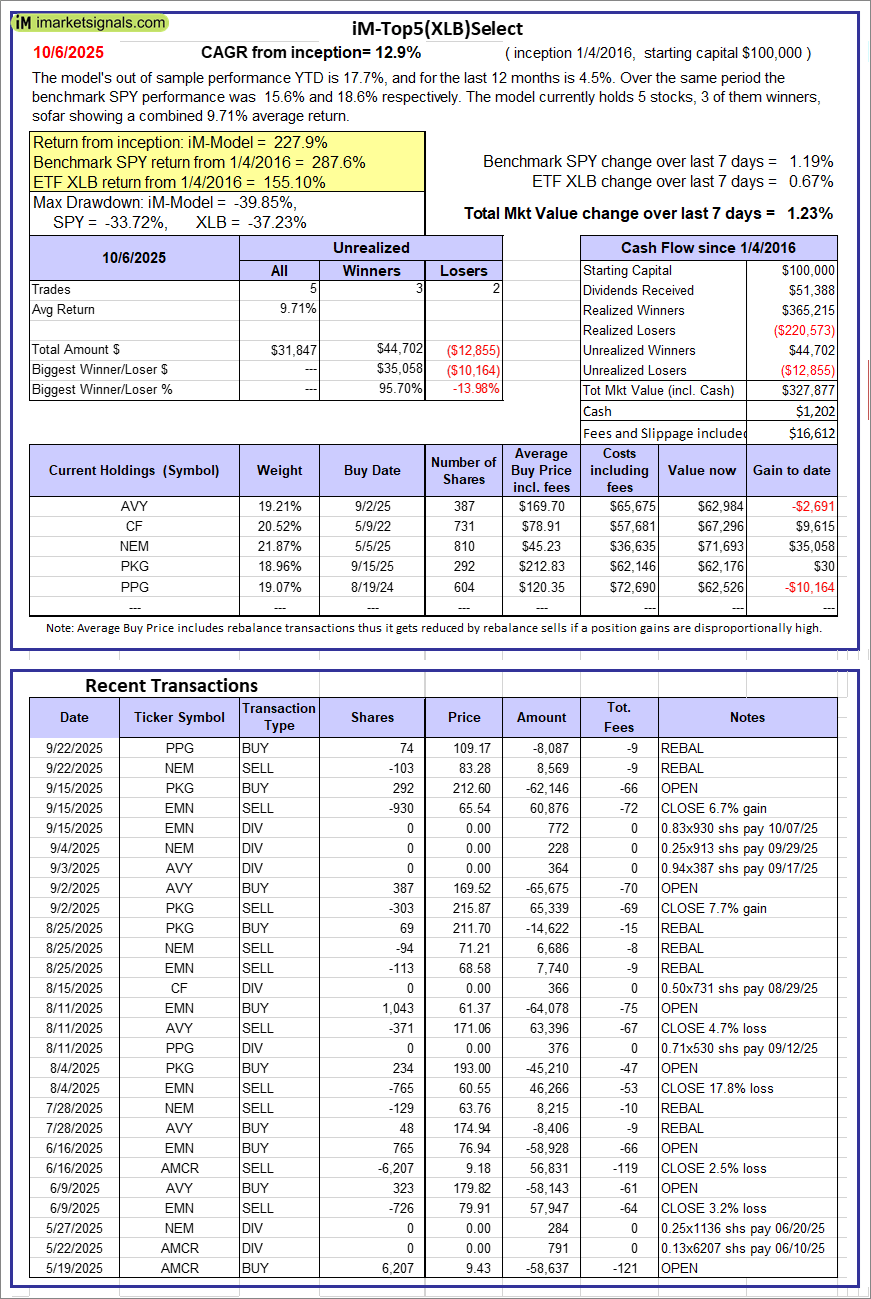 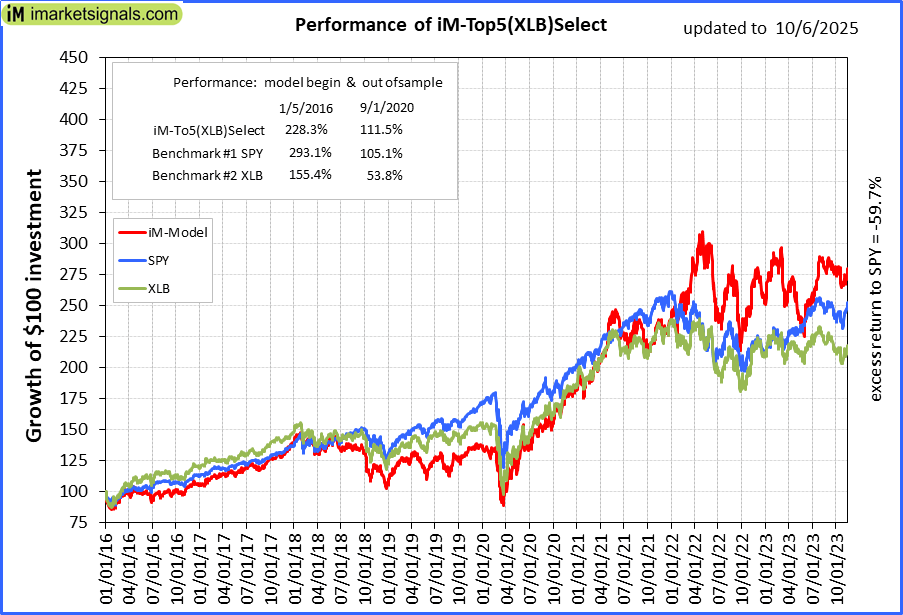 |
iM-Top5(XLB)Select: Since inception, on 1/5/2016, the model gained 227.88% while the benchmark SPY gained 287.55% over the same period. Over the previous week the market value of iM-Top5(XLB)Select gained 1.23% at a time when SPY gained 1.19%. A starting capital of $100,000 at inception on 1/5/2016 would have grown to $327,877 which includes $1,202 cash and excludes $16,612 spent on fees and slippage. |
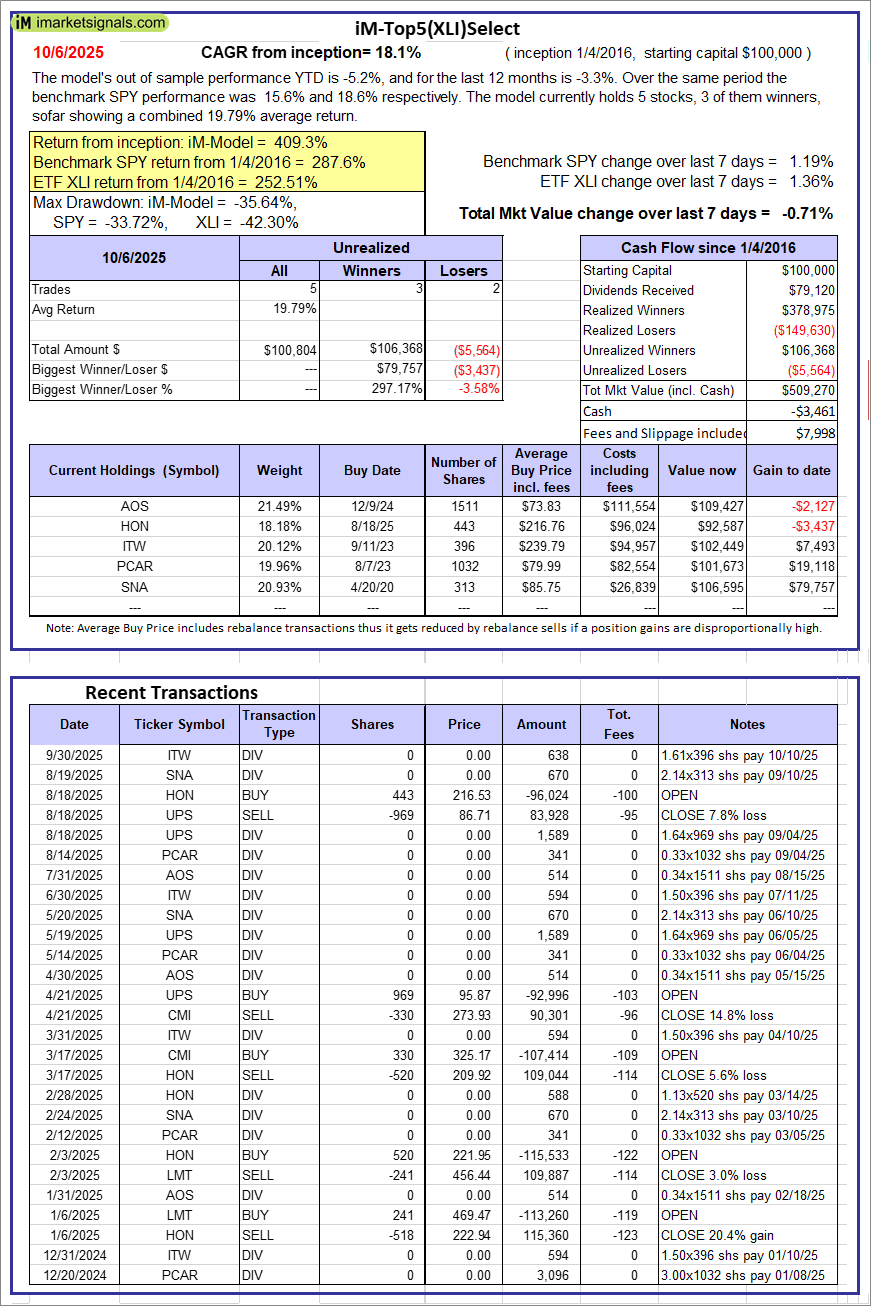 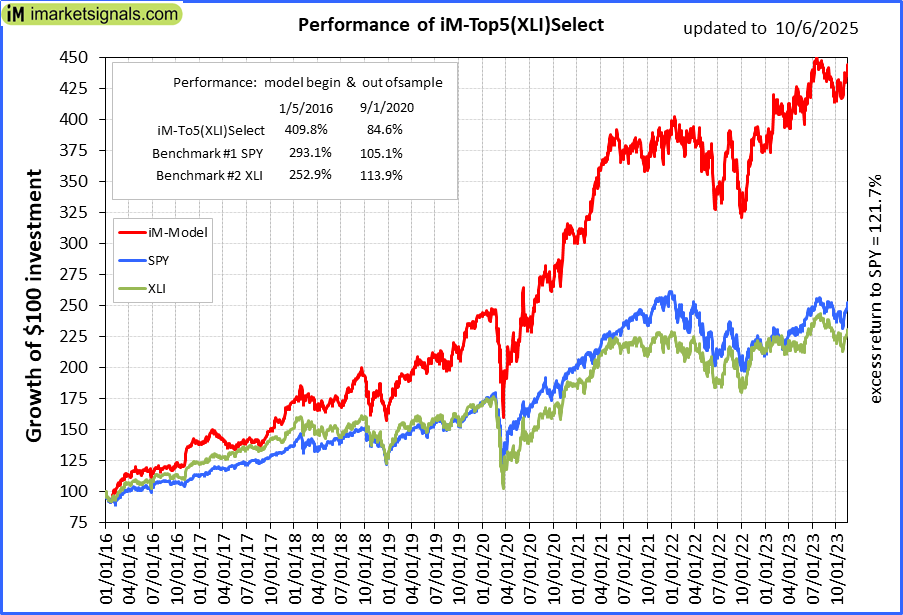 |
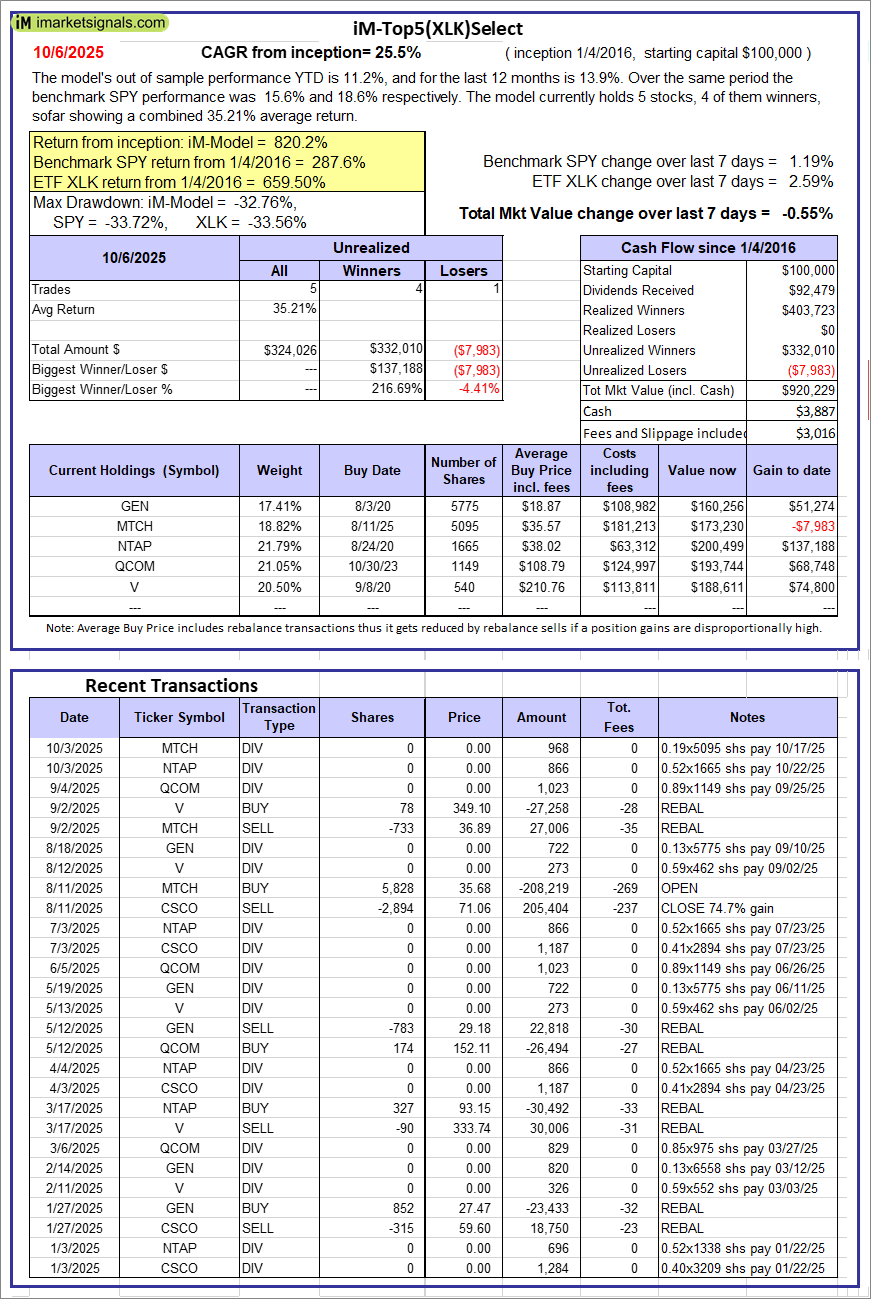
iM-Top5(XLI)Select: Since inception, on 1/5/2016, the model gained 409.27% while the benchmark SPY gained 287.55% over the same period. Over the previous week the market value of iM-Top5(XLI)Select gained -0.71% at a time when SPY gained 1.19%. A starting capital of $100,000 at inception on 1/5/2016 would have grown to $509,270 which includes -$3,461 cash and excludes $7,998 spent on fees and slippage. |
 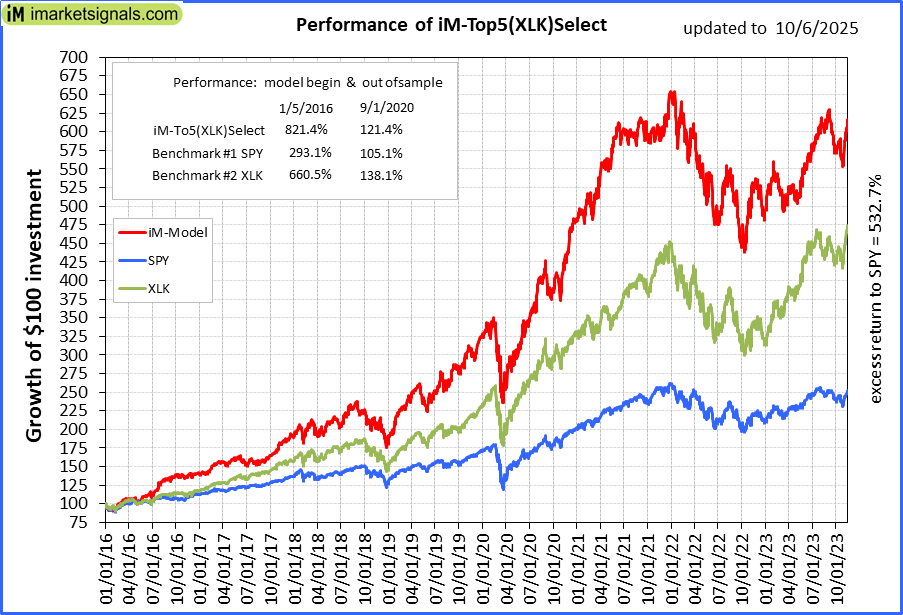 |
iM-Top5(XLK)Select: Since inception, on 1/5/2016, the model gained 820.23% while the benchmark SPY gained 287.55% over the same period. Over the previous week the market value of iM-Top5(XLK)Select gained -0.55% at a time when SPY gained 1.19%. A starting capital of $100,000 at inception on 1/5/2016 would have grown to $920,229 which includes $3,887 cash and excludes $3,016 spent on fees and slippage. |
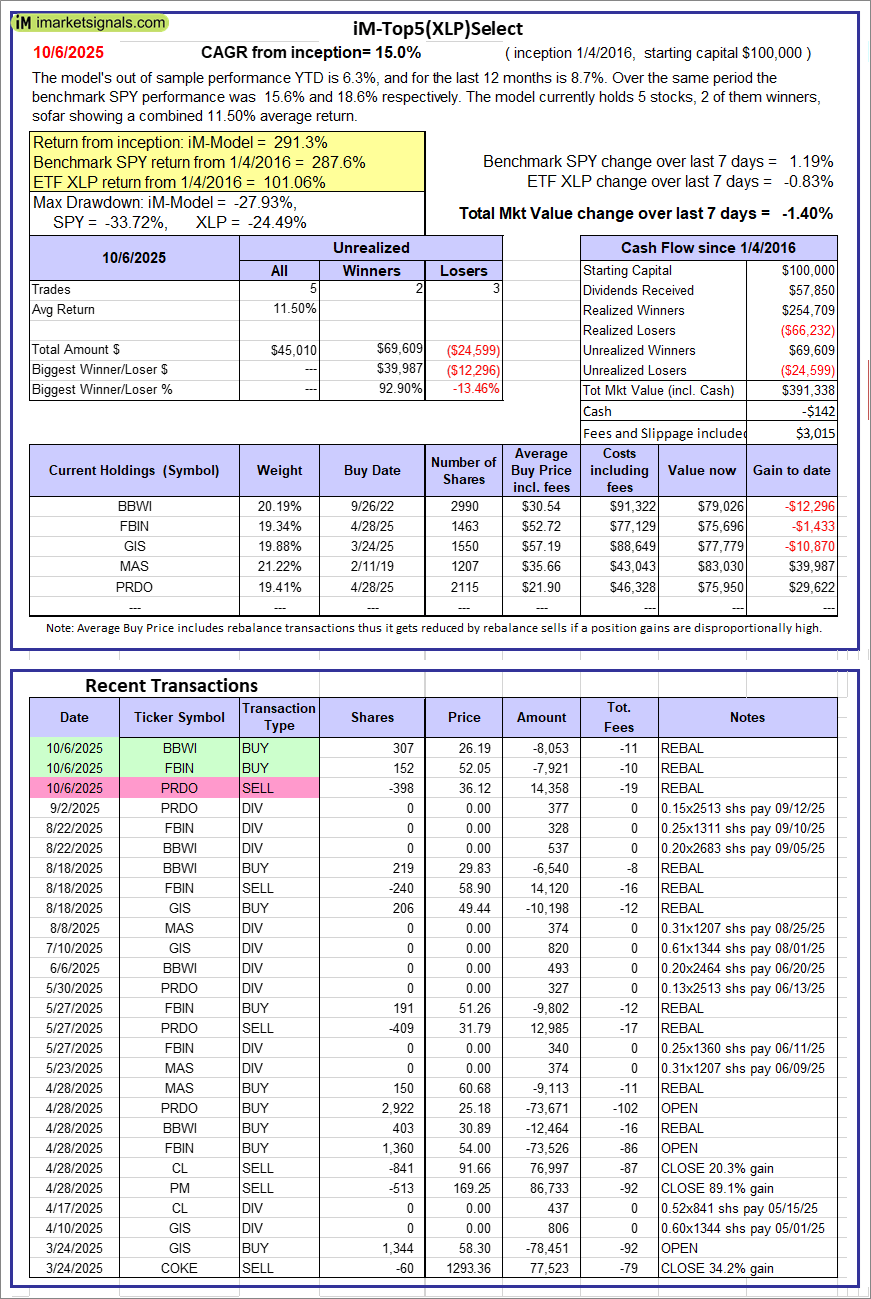 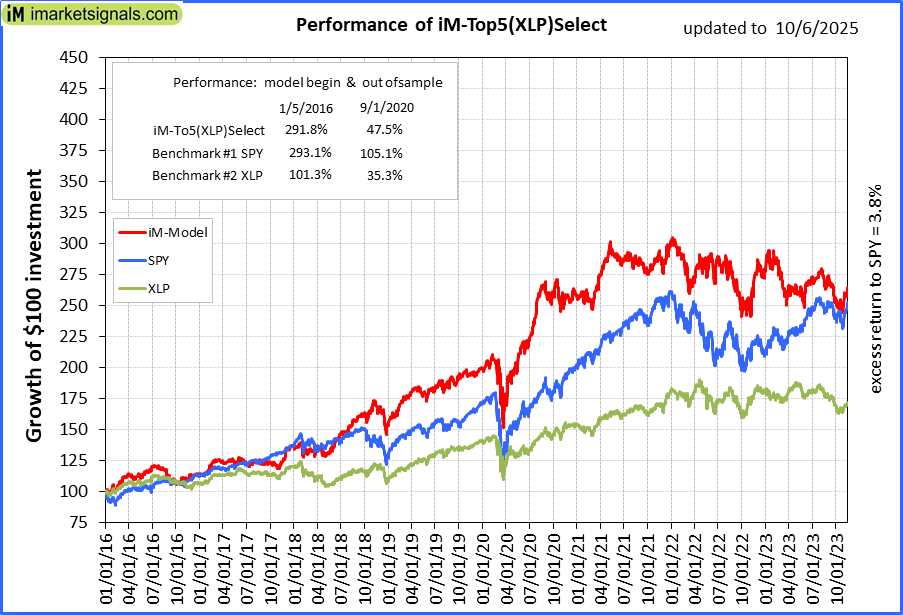 |
iM-Top5(XLP)Select: Since inception, on 1/5/2016, the model gained 291.34% while the benchmark SPY gained 287.55% over the same period. Over the previous week the market value of iM-Top5(XLP)Select gained -1.40% at a time when SPY gained 1.19%. A starting capital of $100,000 at inception on 1/5/2016 would have grown to $391,338 which includes -$142 cash and excludes $3,015 spent on fees and slippage. |
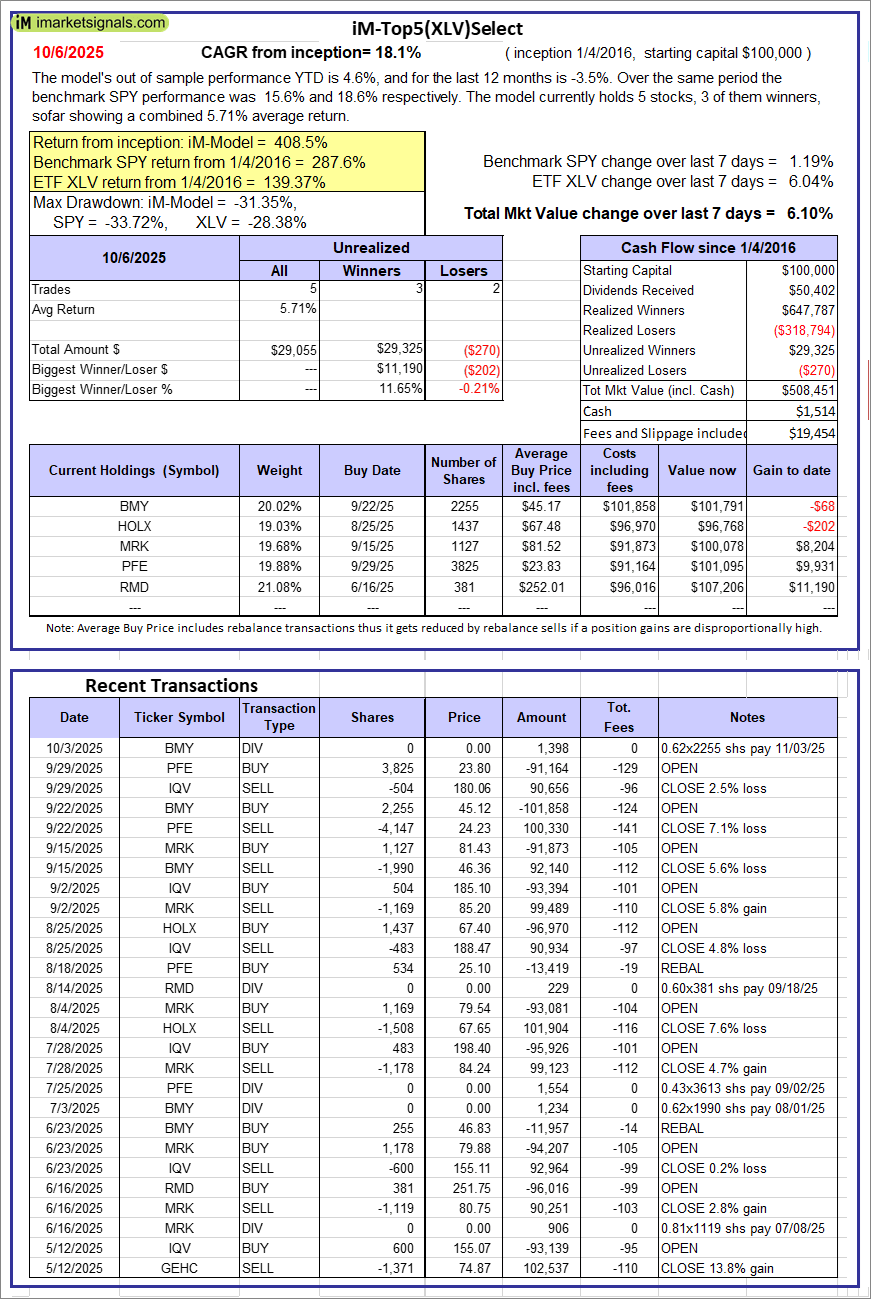 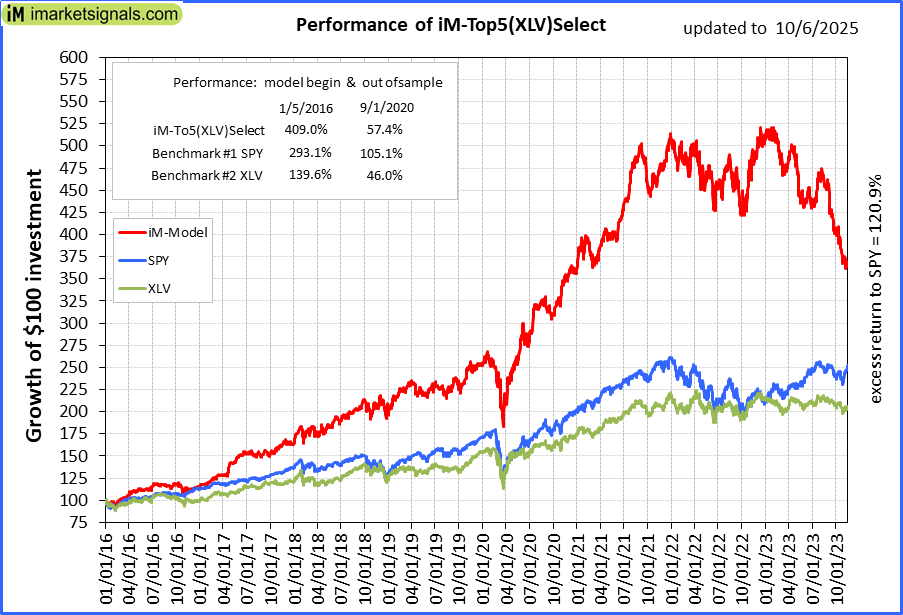 |
iM-Top5(XLV)Select: Since inception, on 1/5/2016, the model gained 408.45% while the benchmark SPY gained 287.55% over the same period. Over the previous week the market value of iM-Top5(XLV)Select gained 6.10% at a time when SPY gained 1.19%. A starting capital of $100,000 at inception on 1/5/2016 would have grown to $508,451 which includes $1,514 cash and excludes $19,454 spent on fees and slippage. |
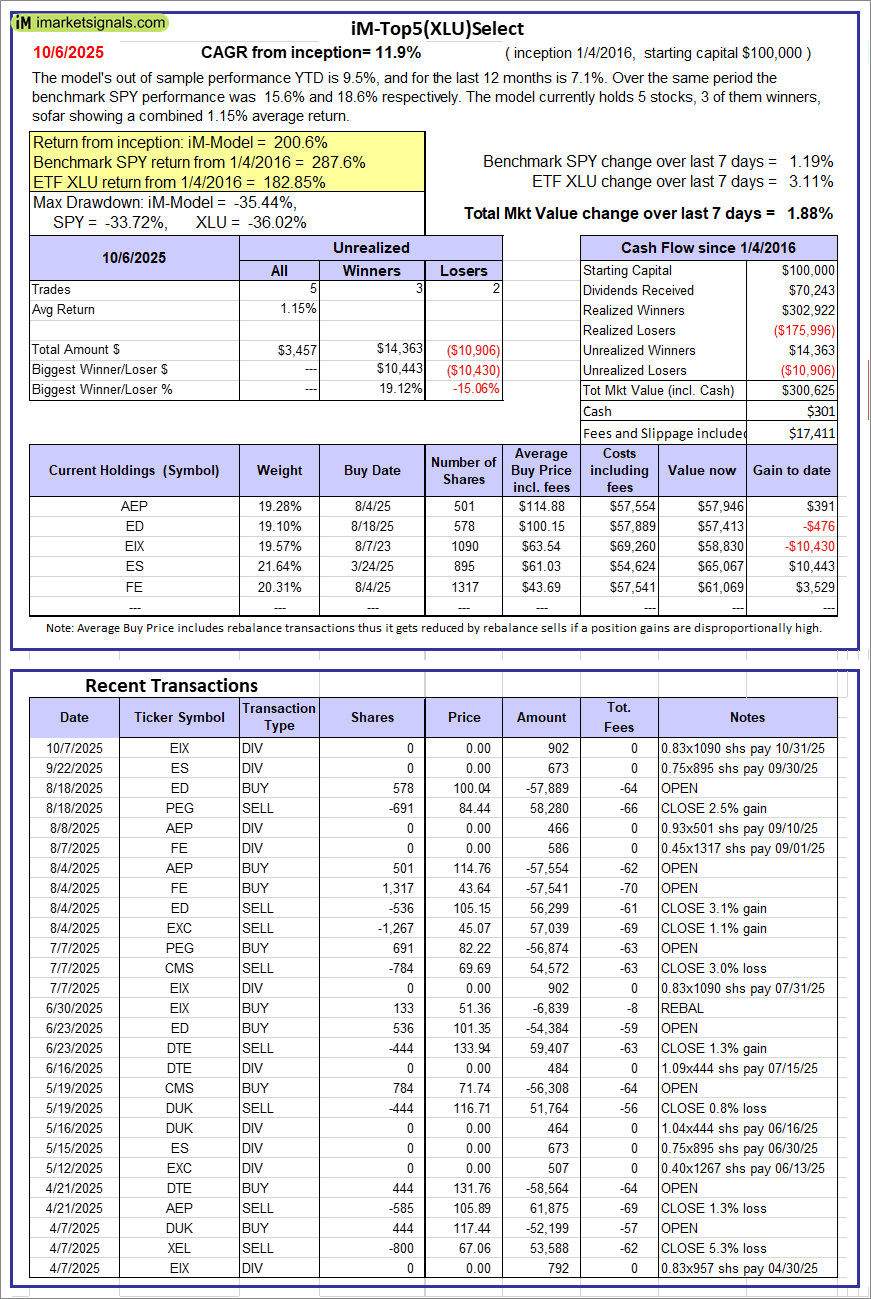 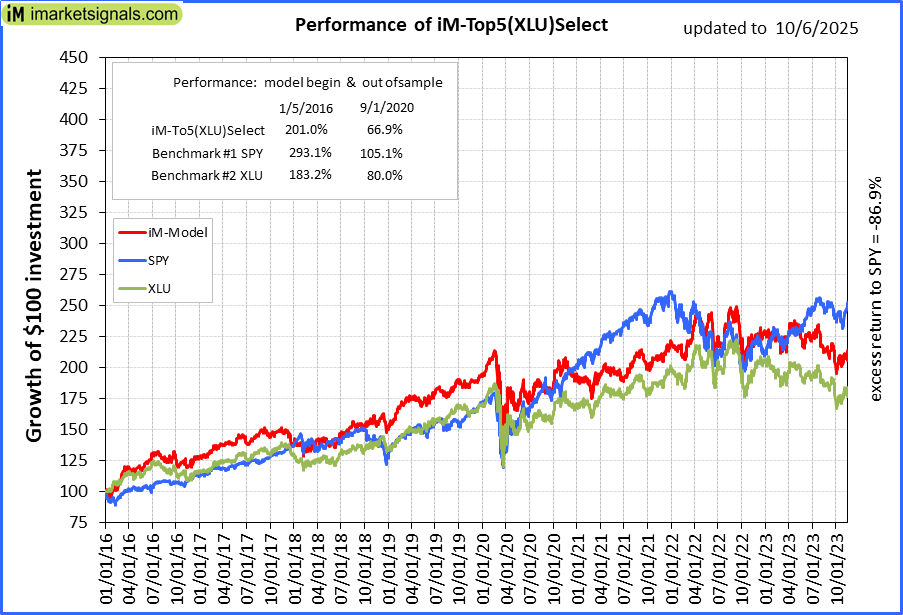 |
iM-Top5(XLU)Select: Since inception, on 1/5/2016, the model gained 200.63% while the benchmark SPY gained 287.55% over the same period. Over the previous week the market value of iM-Top5(XLU)Select gained 1.88% at a time when SPY gained 1.19%. A starting capital of $100,000 at inception on 1/5/2016 would have grown to $300,625 which includes $301 cash and excludes $17,411 spent on fees and slippage. |
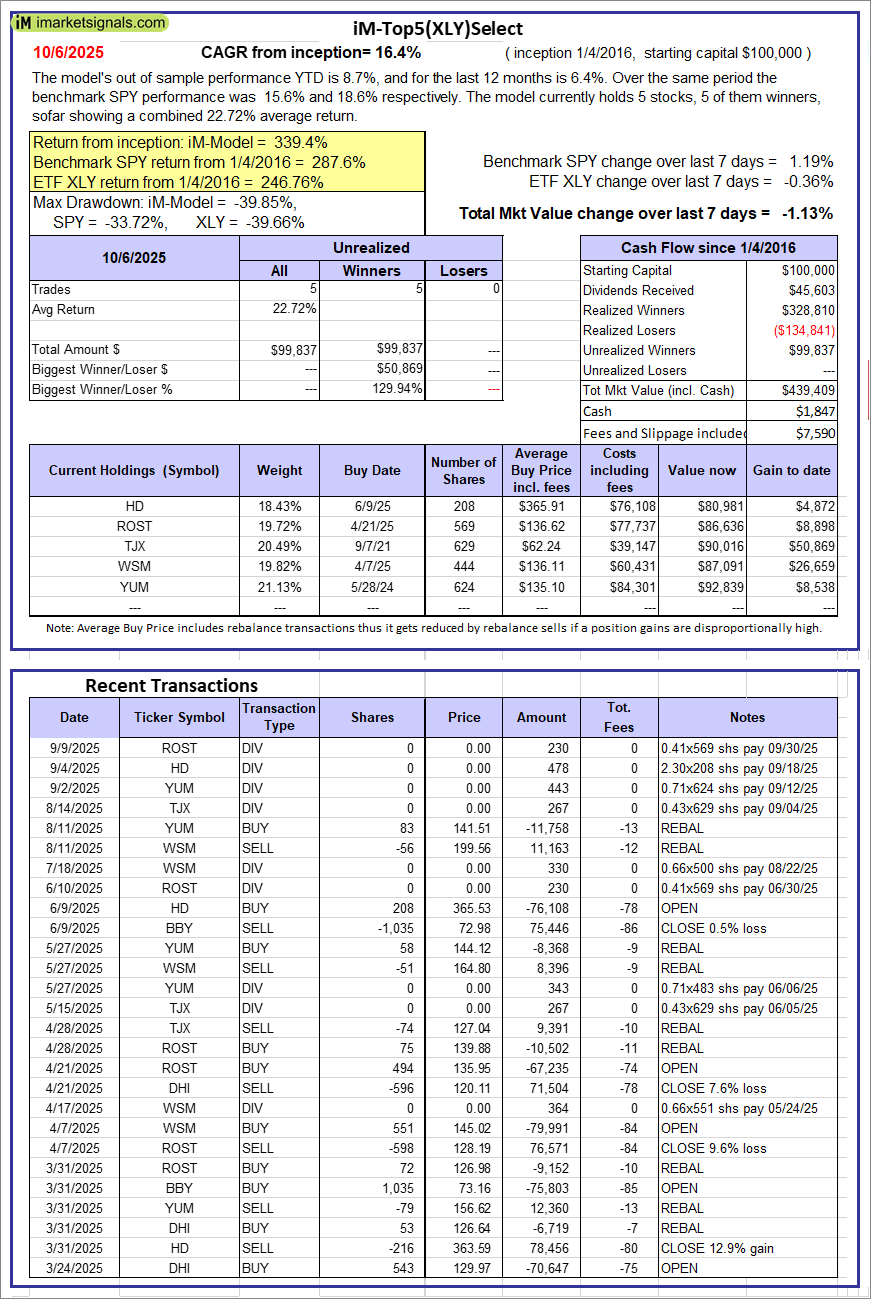 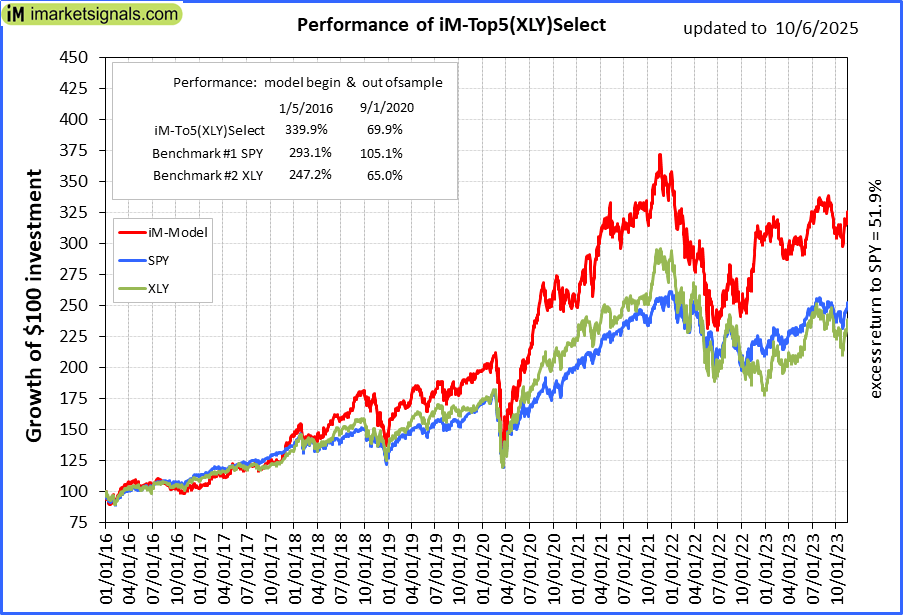 |
iM-Top5(XLY)Select: Since inception, on 1/5/2016, the model gained 339.41% while the benchmark SPY gained 287.55% over the same period. Over the previous week the market value of iM-Top5(XLY)Select gained -1.13% at a time when SPY gained 1.19%. A starting capital of $100,000 at inception on 1/5/2016 would have grown to $439,409 which includes $1,847 cash and excludes $7,590 spent on fees and slippage. |
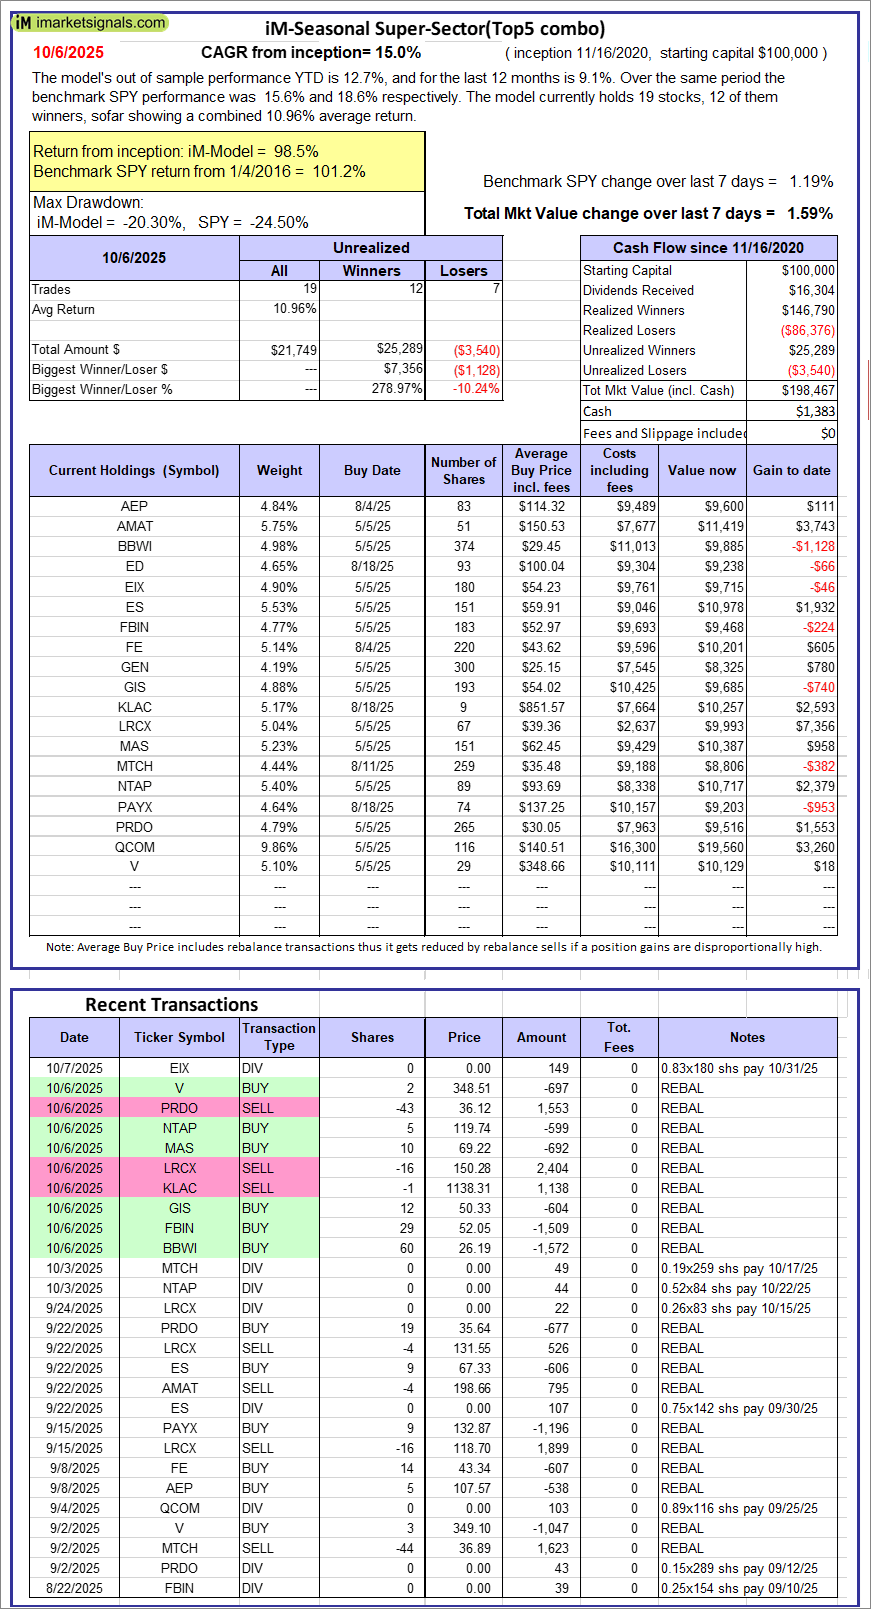 |
iM-Seasonal Super-Sectors (Top5 combo) : Since inception, on 11/17/2020, the model gained 98.47% while the benchmark SPY gained 101.18% over the same period. Over the previous week the market value of iM-Seasonal Super-Sectors (Top5 combo) gained 1.59% at a time when SPY gained 1.19%. A starting capital of $100,000 at inception on 11/17/2020 would have grown to $198,467 which includes $1,383 cash and excludes $00 spent on fees and slippage. |
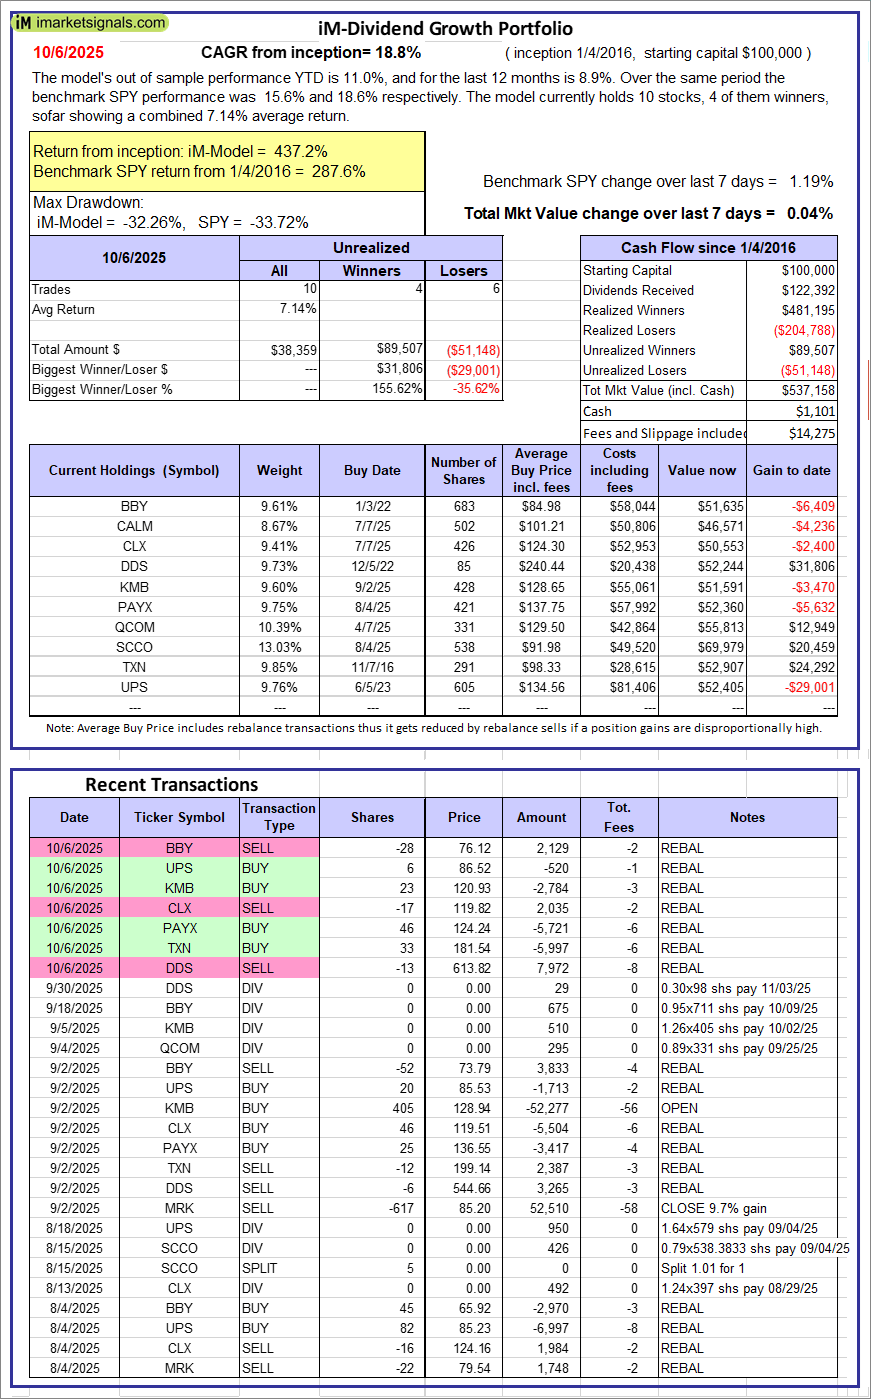 |
iM-Dividend Growth Portfolio: The model’s out of sample performance YTD is 11.0%, and for the last 12 months is 8.9%. Over the same period the benchmark SPY performance was 15.6% and 18.6% respectively. Over the previous week the market value of the iM-Dividend Growth Portfolio gained 0.04% at a time when SPY gained 1.19%. A starting capital of $100,000 at inception on 6/30/2016 would have grown to $537,158 which includes $1,101 cash and excludes $14,275 spent on fees and slippage. |
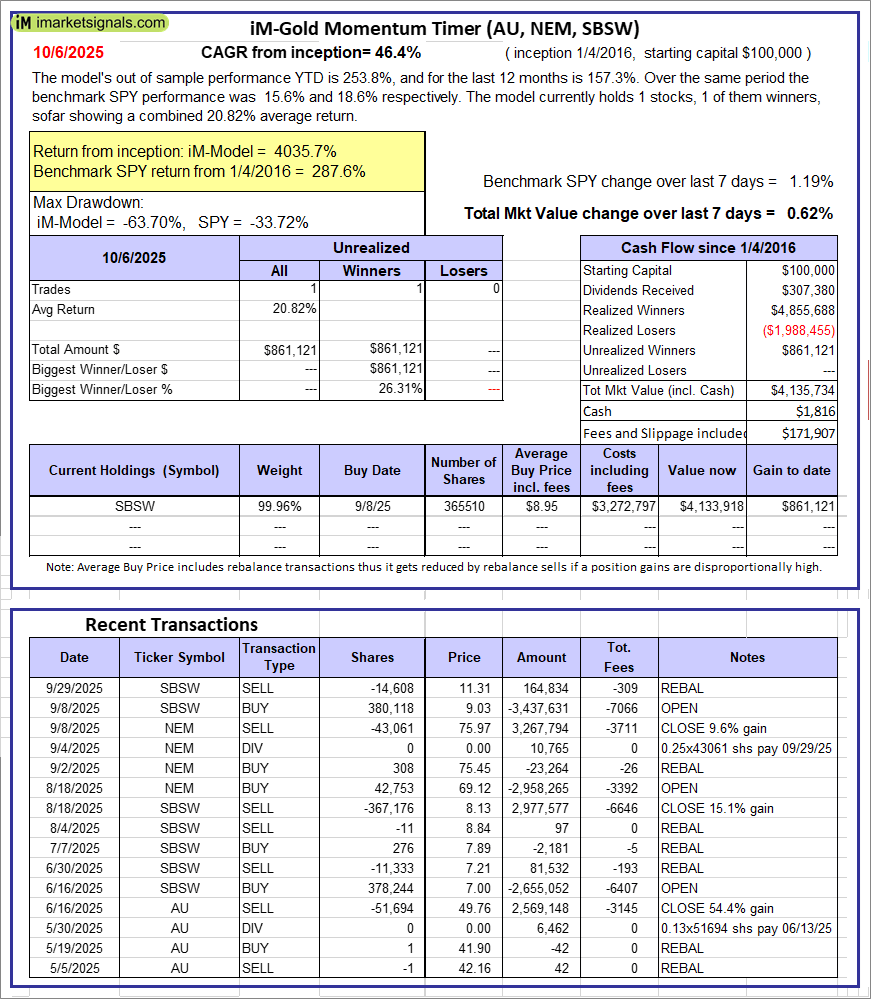 |
iM-Gold Momentum Timer (AU, NEM, SBSW): The model’s out of sample performance YTD is 253.8%, and for the last 12 months is 157.3%. Over the same period the benchmark SPY performance was 15.6% and 18.6% respectively. Over the previous week the market value of iM-Gold Momentum Timer (AU, NEM, SBSW) gained 0.62% at a time when SPY gained 1.19%. A starting capital of $100,000 at inception on 6/30/2016 would have grown to $1,816 which includes $171,907 cash and excludes Gain to date spent on fees and slippage. |
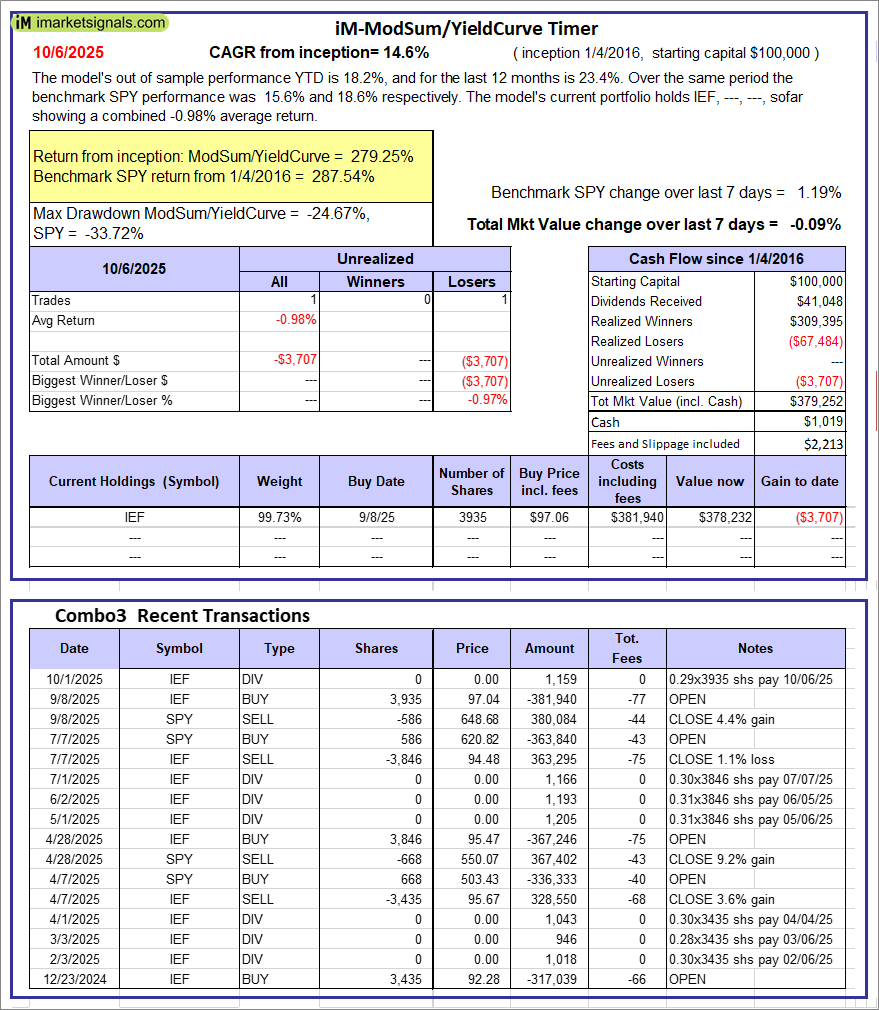 |
iM-ModSum/YieldCurve Timer: The model’s out of sample performance YTD is 18.2%, and for the last 12 months is 23.4%. Over the same period the benchmark SPY performance was 15.6% and 18.6% respectively. Over the previous week the market value of iM-PortSum/YieldCurve Timer gained -0.09% at a time when SPY gained 1.19%. A starting capital of $100,000 at inception on 1/1/2016 would have grown to $379,252 which includes $1,019 cash and excludes $2,213 spent on fees and slippage. |
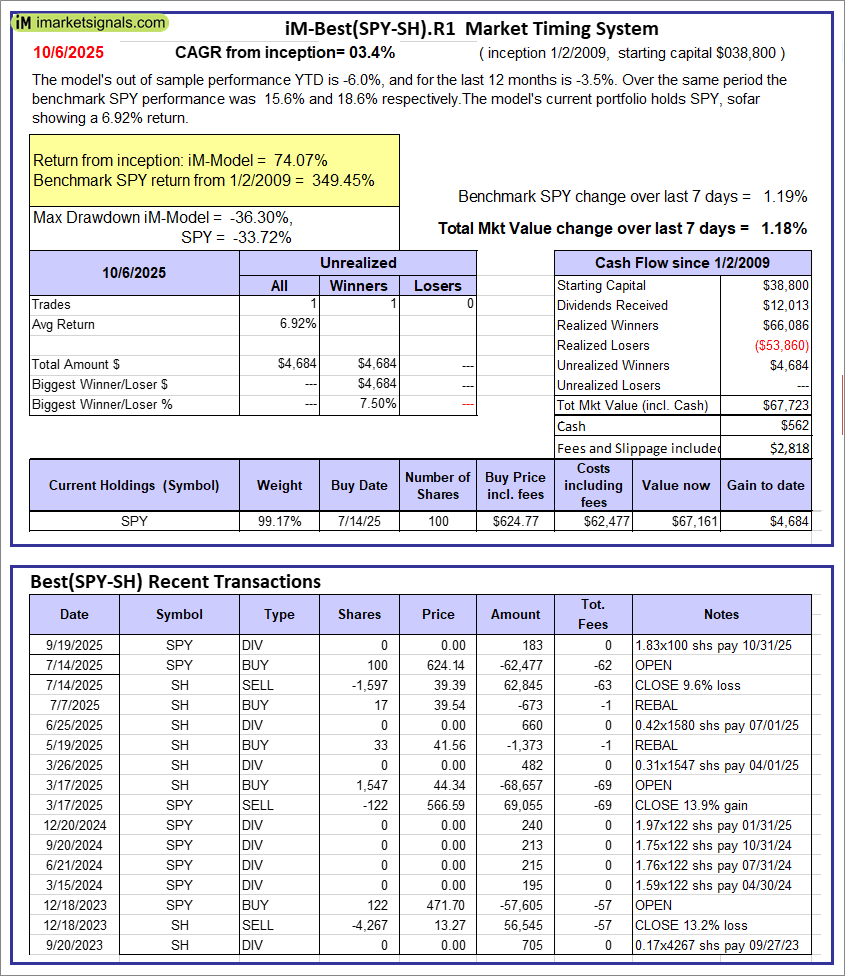 |
iM-Best(SPY-SH).R1: The model’s out of sample performance YTD is -6.0%, and for the last 12 months is -3.5%. Over the same period the benchmark SPY performance was 15.6% and 18.6% respectively. Over the previous week the market value of Best(SPY-SH) gained 1.18% at a time when SPY gained 1.19%. A starting capital of $100,000 at inception on 1/2/2009 would have grown to $67,723 which includes $562 cash and excludes $2,818 spent on fees and slippage. |
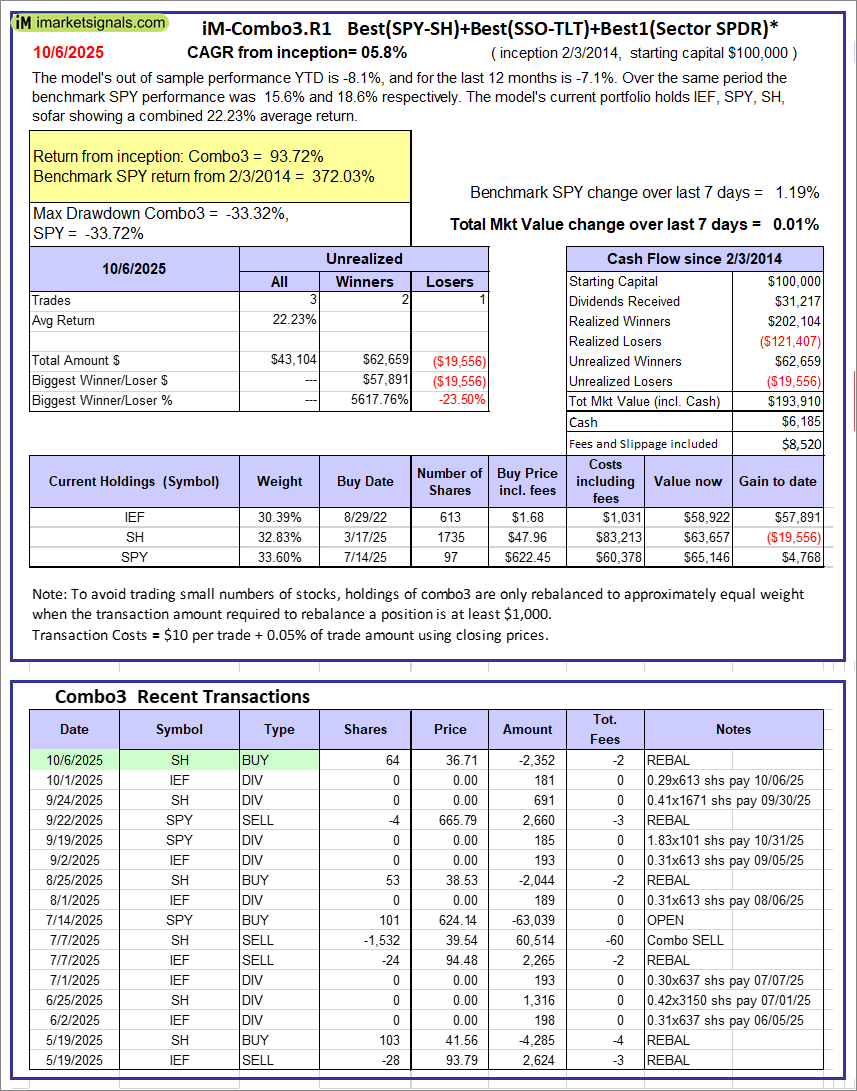 |
iM-Combo3.R1: The model’s out of sample performance YTD is -8.1%, and for the last 12 months is -7.1%. Over the same period the benchmark SPY performance was 15.6% and 18.6% respectively. Over the previous week the market value of iM-Combo3.R1 gained 0.01% at a time when SPY gained 1.19%. A starting capital of $100,000 at inception on 2/3/2014 would have grown to $193,910 which includes $6,185 cash and excludes $8,520 spent on fees and slippage. |
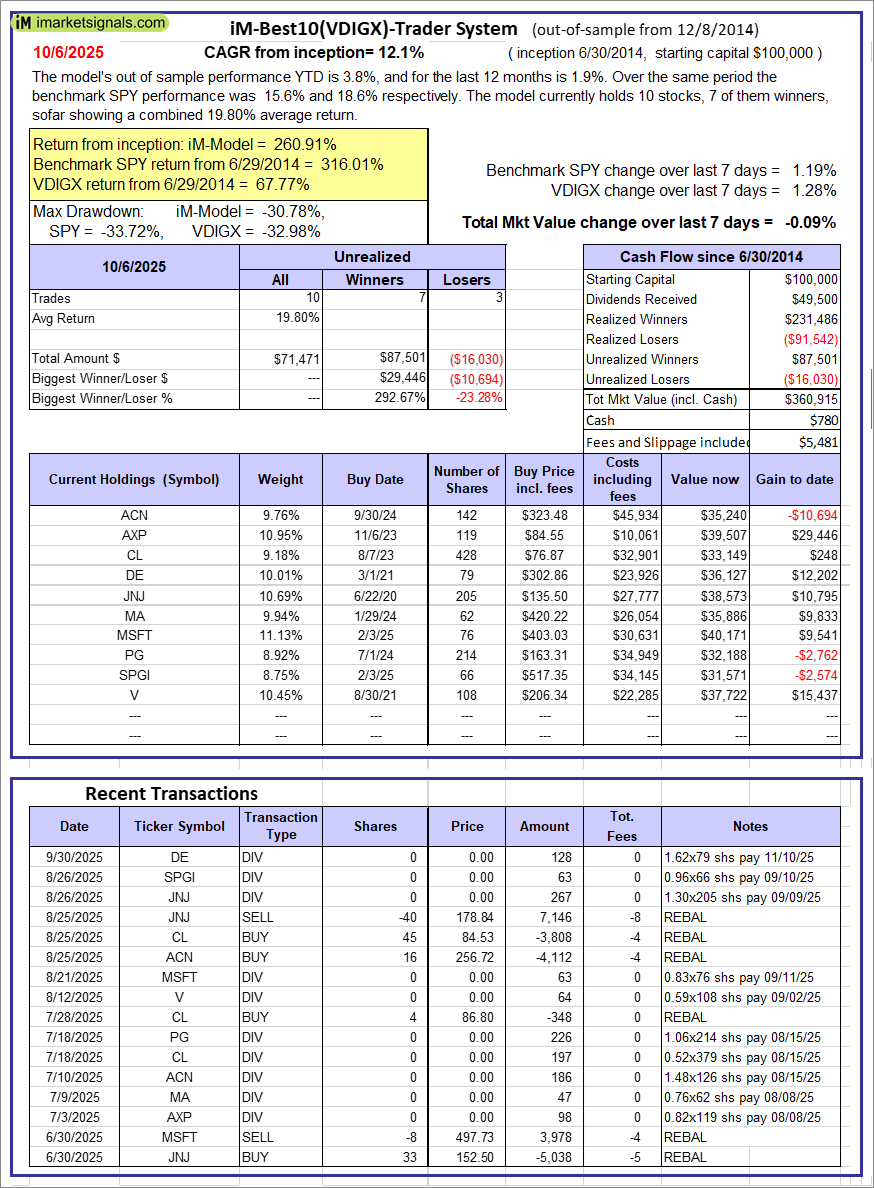 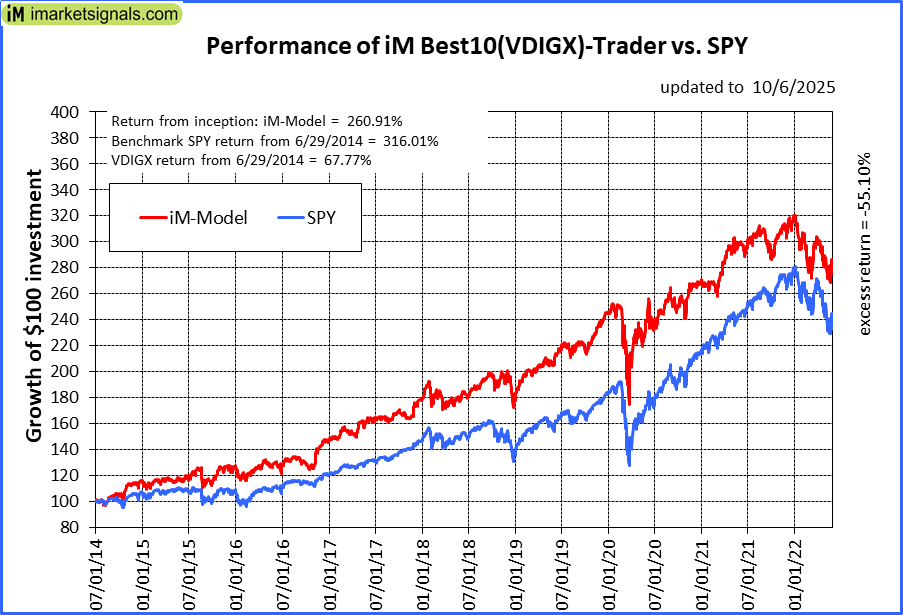 |
iM-Best10(VDIGX)-Trader: The model’s out of sample performance YTD is 3.8%, and for the last 12 months is 1.9%. Over the same period the benchmark SPY performance was 15.6% and 18.6% respectively. Since inception, on 7/1/2014, the model gained 260.91% while the benchmark SPY gained 316.01% and VDIGX gained 67.77% over the same period. Over the previous week the market value of iM-Best10(VDIGX) gained -0.09% at a time when SPY gained 1.19%. A starting capital of $100,000 at inception on 7/1/2014 would have grown to $360,915 which includes $780 cash and excludes $5,481 spent on fees and slippage. |
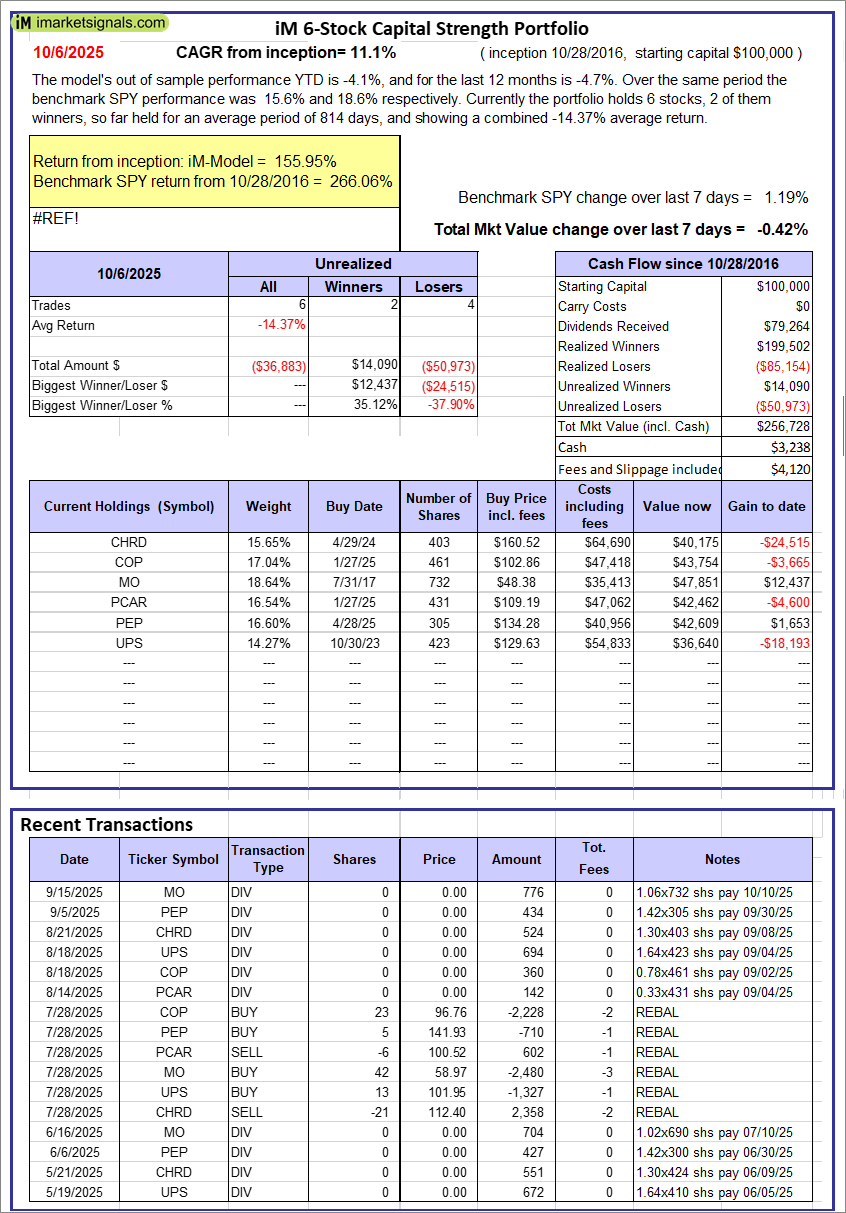 |
iM 6-Stock Capital Strength Portfolio: The model’s out of sample performance YTD is -4.1%, and for the last 12 months is -4.7%. Over the same period the benchmark SPY performance was 15.6% and 18.6% respectively. Over the previous week the market value of the iM 6-Stock Capital Strength Portfolio gained -0.42% at a time when SPY gained 1.19%. A starting capital of $100,000 at inception on 10/28/2016 would have grown to $256,728 which includes $3,238 cash and excludes $4,120 spent on fees and slippage. |
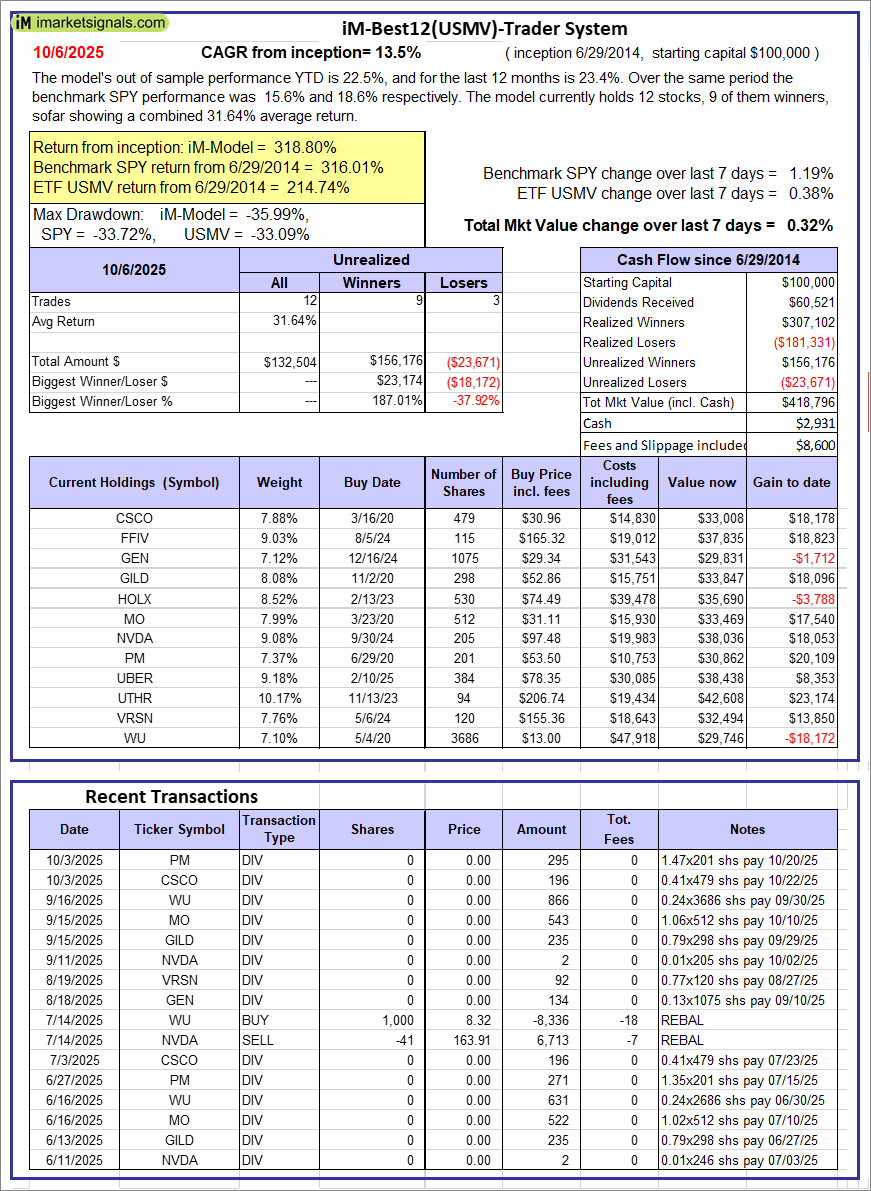 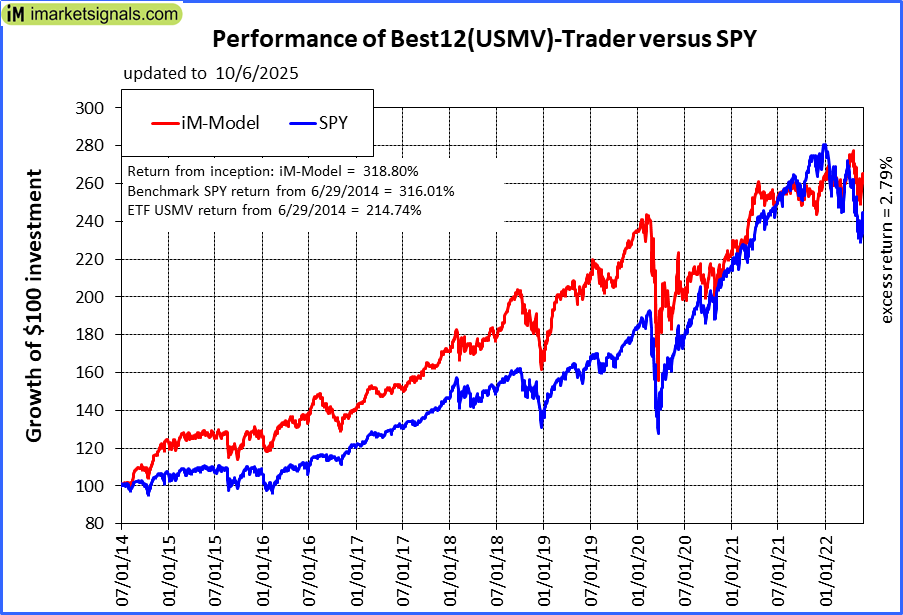 |
iM-Best12(USMV)-Trader: The model’s out of sample performance YTD is 22.5%, and for the last 12 months is 23.4%. Over the same period the benchmark SPY performance was 15.6% and 18.6% respectively. Since inception, on 6/30/2014, the model gained 318.80% while the benchmark SPY gained 316.01% and the ETF USMV gained 214.74% over the same period. Over the previous week the market value of iM-Best12(USMV)-Trader gained 0.32% at a time when SPY gained 1.19%. A starting capital of $100,000 at inception on 6/30/2014 would have grown to $418,796 which includes $2,931 cash and excludes $8,600 spent on fees and slippage. |
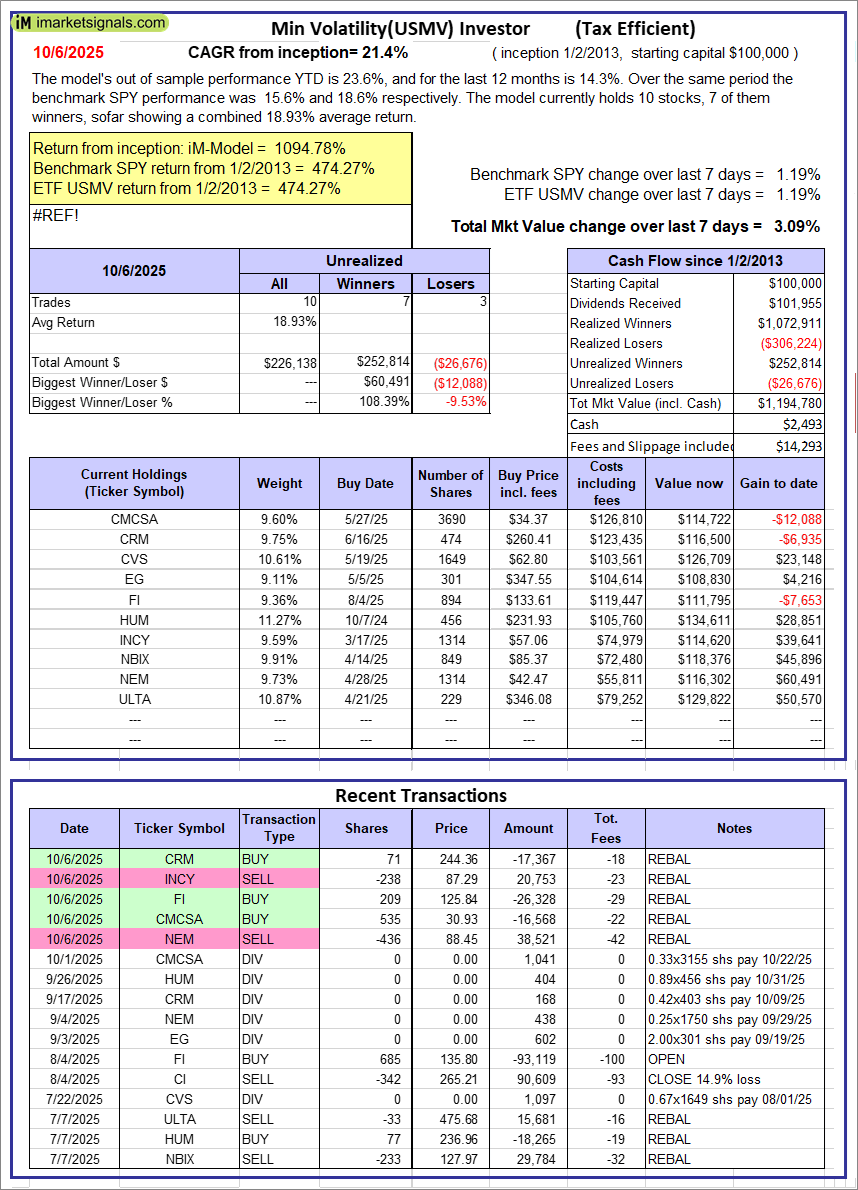 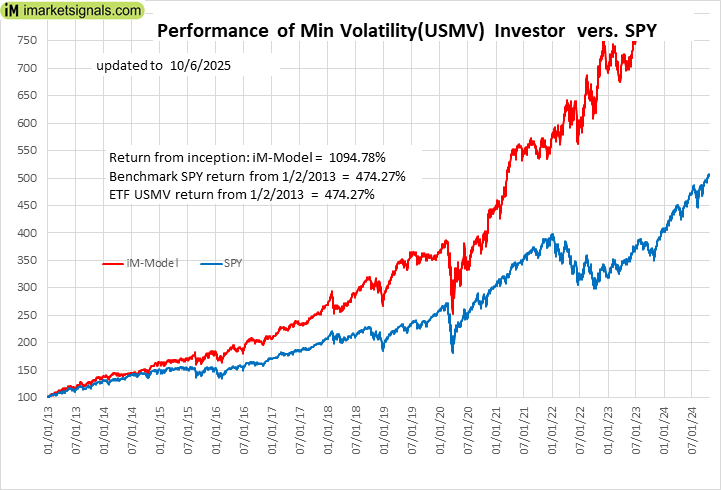 |
iM-Min Volatility(USMV) Investor (Tax Efficient): The model’s out of sample performance YTD is 23.6%, and for the last 12 months is 14.3%. Over the same period the benchmark SPY performance was 15.6% and 18.6% respectively. Since inception, on 1/3/2013, the model gained 1094.78% while the benchmark SPY gained 474.27% and the ETF USMV gained 474.27% over the same period. Over the previous week the market value of iM-Best12(USMV)Q1 gained 3.09% at a time when SPY gained 1.19%. A starting capital of $100,000 at inception on 1/3/2013 would have grown to $1,194,780 which includes $2,493 cash and excludes $14,293 spent on fees and slippage. |
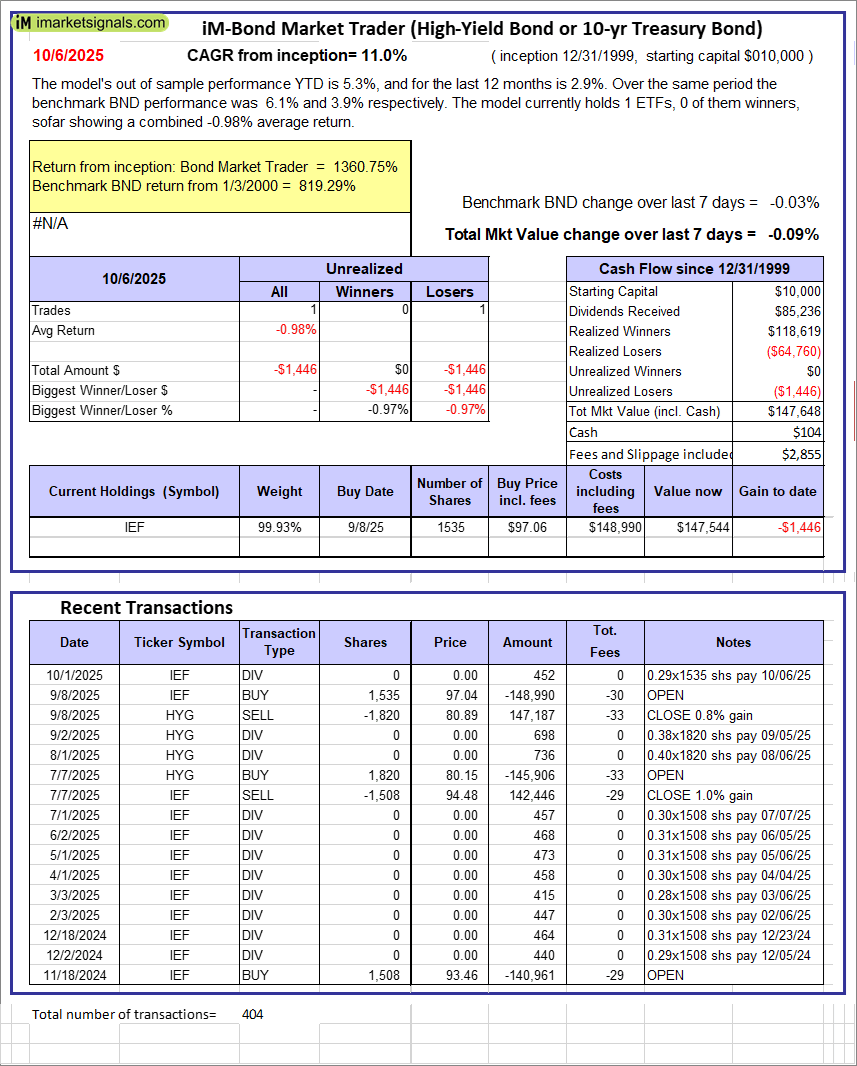 |
iM-Bond Market Trader (High-Yield Bond or 10-yr Treasury Bond): The model’s out of sample performance YTD is 5.3%, and for the last 12 months is 2.9%. Over the same period the benchmark BND performance was 6.1% and 3.9% respectively. Over the previous week the market value of the iM-Bond Market Trader (High-Yield Bond or 10-yr Treasury Bond) gained -0.09% at a time when BND gained -0.03%. A starting capital of $10,000 at inception on 1/3/2000 would have grown to $147,648 which includes $104 cash and excludes $2,855 spent on fees and slippage. |
|
|
iM-ModSum/YieldCurve Timer: The model’s out of sample performance YTD is 18.2%, and for the last 12 months is 23.4%. Over the same period the benchmark SPY performance was 15.6% and 18.6% respectively. Over the previous week the market value of iM-PortSum/YieldCurve Timer gained -0.09% at a time when SPY gained 1.19%. A starting capital of $100,000 at inception on 1/1/2016 would have grown to $379,252 which includes $1,019 cash and excludes $2,213 spent on fees and slippage. |
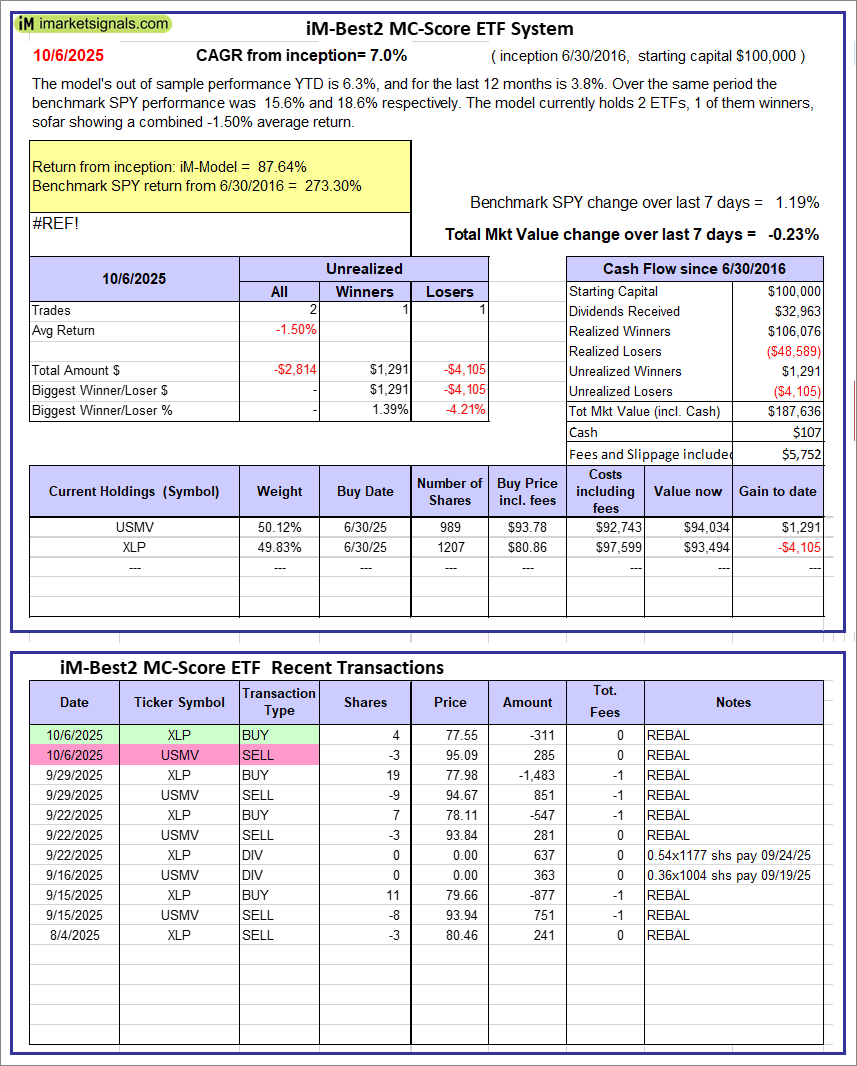 |
iM-Best2 MC-Score ETF System: The model’s out of sample performance YTD is 6.3%, and for the last 12 months is 3.8%. Over the same period the benchmark SPY performance was 15.6% and 18.6% respectively. Over the previous week the market value of the iM-Best2 MC-Score ETF System gained -0.23% at a time when SPY gained 1.19%. A starting capital of $100,000 at inception on 6/30/2016 would have grown to $187,636 which includes $107 cash and excludes $5,752 spent on fees and slippage. |
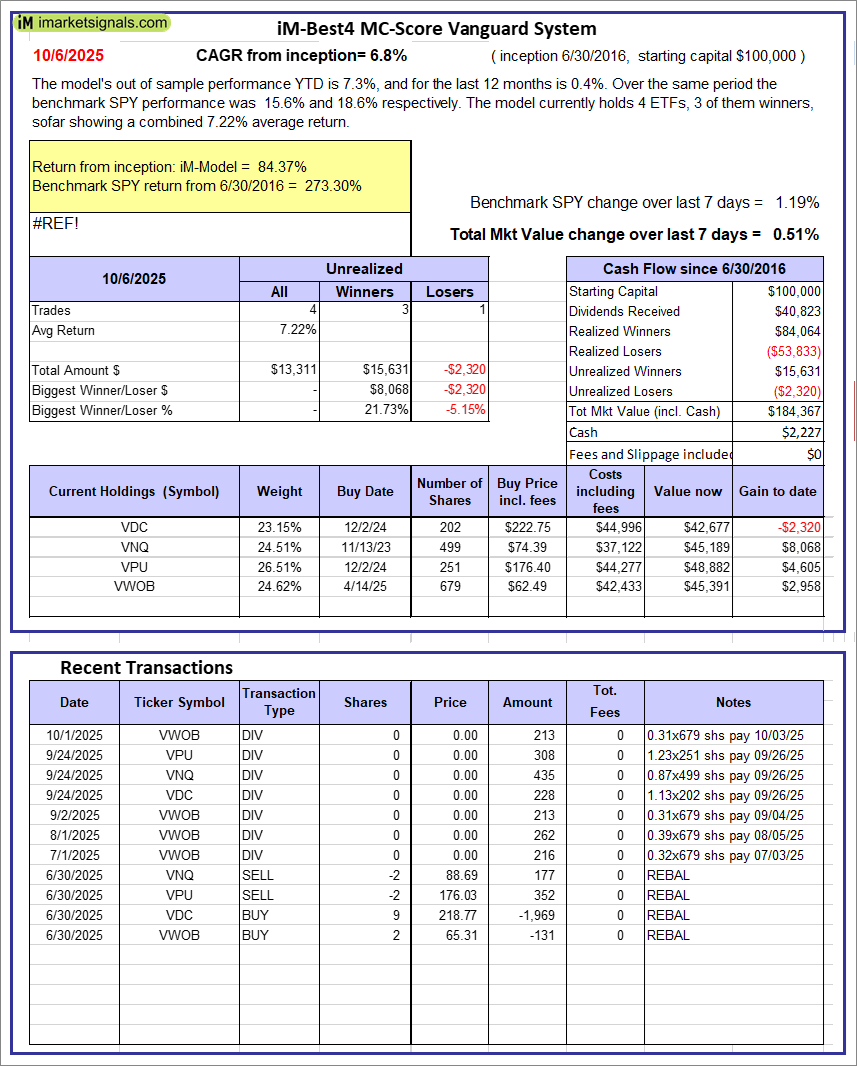 |
iM-Best4 MC-Score Vanguard System: The model’s out of sample performance YTD is 7.3%, and for the last 12 months is 0.4%. Over the same period the benchmark SPY performance was 15.6% and 18.6% respectively. Over the previous week the market value of the iM-Best4 MC-Score Vanguard System gained 0.51% at a time when SPY gained 1.19%. A starting capital of $100,000 at inception on 6/30/2016 would have grown to $184,367 which includes $2,227 cash and excludes $00 spent on fees and slippage. |
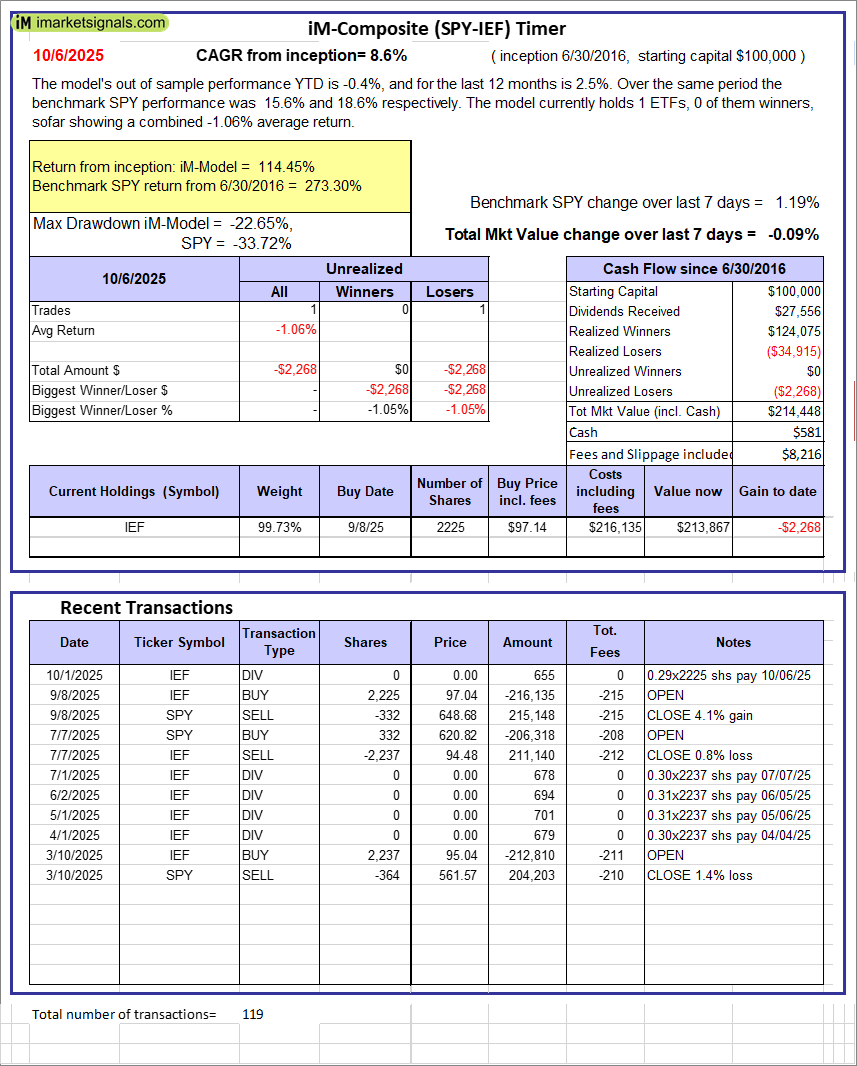 |
iM-Composite (SPY-IEF) Timer: The model’s out of sample performance YTD is -0.4%, and for the last 12 months is 2.5%. Over the same period the benchmark SPY performance was 15.6% and 18.6% respectively. Over the previous week the market value of the iM-Composite (SPY-IEF) Timer gained -0.09% at a time when SPY gained 1.19%. A starting capital of $100,000 at inception on 6/30/2016 would have grown to $214,448 which includes $581 cash and excludes $8,216 spent on fees and slippage. |
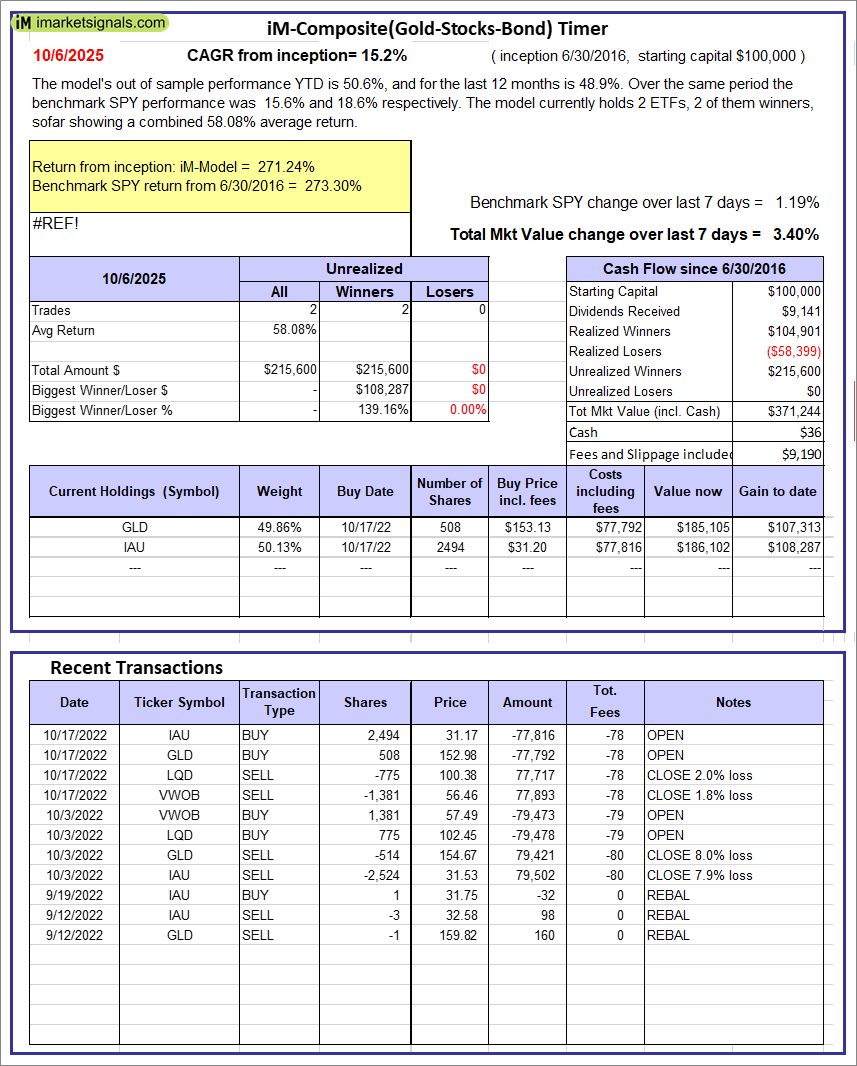 |
iM-Composite(Gold-Stocks-Bond) Timer: The model’s out of sample performance YTD is 50.6%, and for the last 12 months is 48.9%. Over the same period the benchmark SPY performance was 15.6% and 18.6% respectively. Over the previous week the market value of the iM-Composite(Gold-Stocks-Bond) Timer gained 3.40% at a time when SPY gained 1.19%. A starting capital of $100,000 at inception on 6/30/2016 would have grown to $371,244 which includes $36 cash and excludes $9,190 spent on fees and slippage. |
iM-Best Reports – 10/6/2025
Posted in pmp SPY-SH
Leave a Reply
You must be logged in to post a comment.