
  |
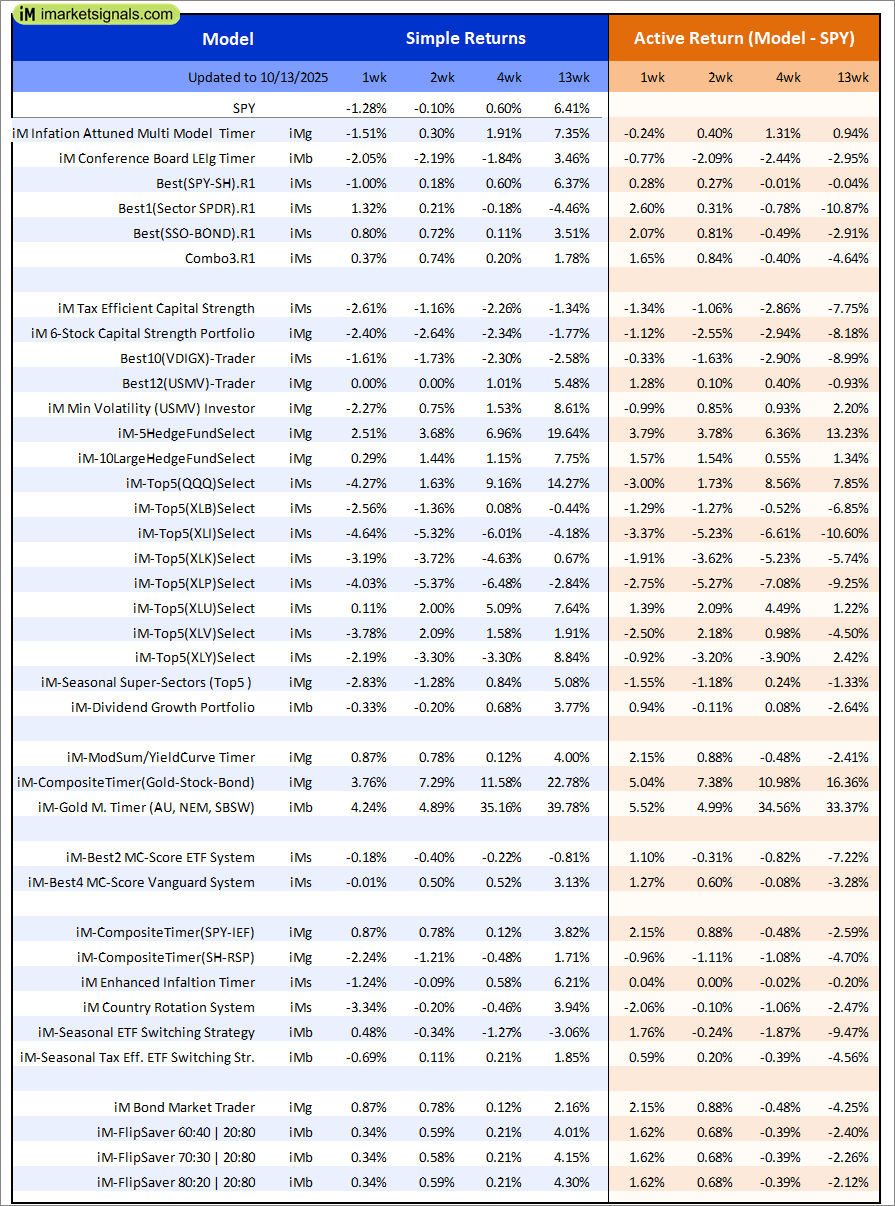
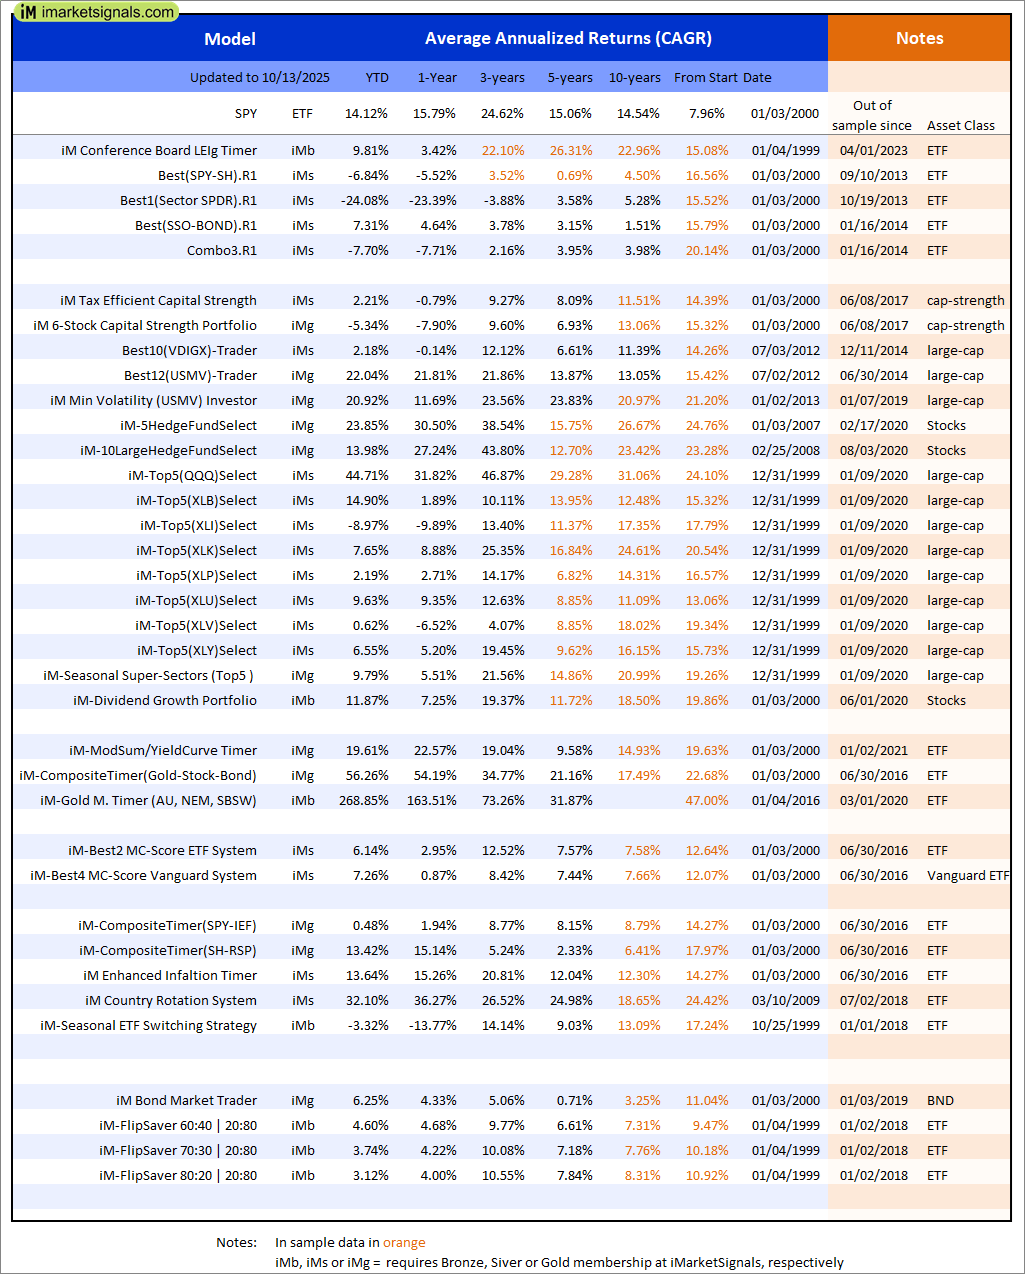
Out of sample performance summary of our models for the past 1, 2, 4 and 13 week periods. The active active return indicates how the models over- or underperformed the benchmark ETF SPY. Also the YTD, and the 1-, 3-, 5- and 10-year annualized returns are shown in the second table |
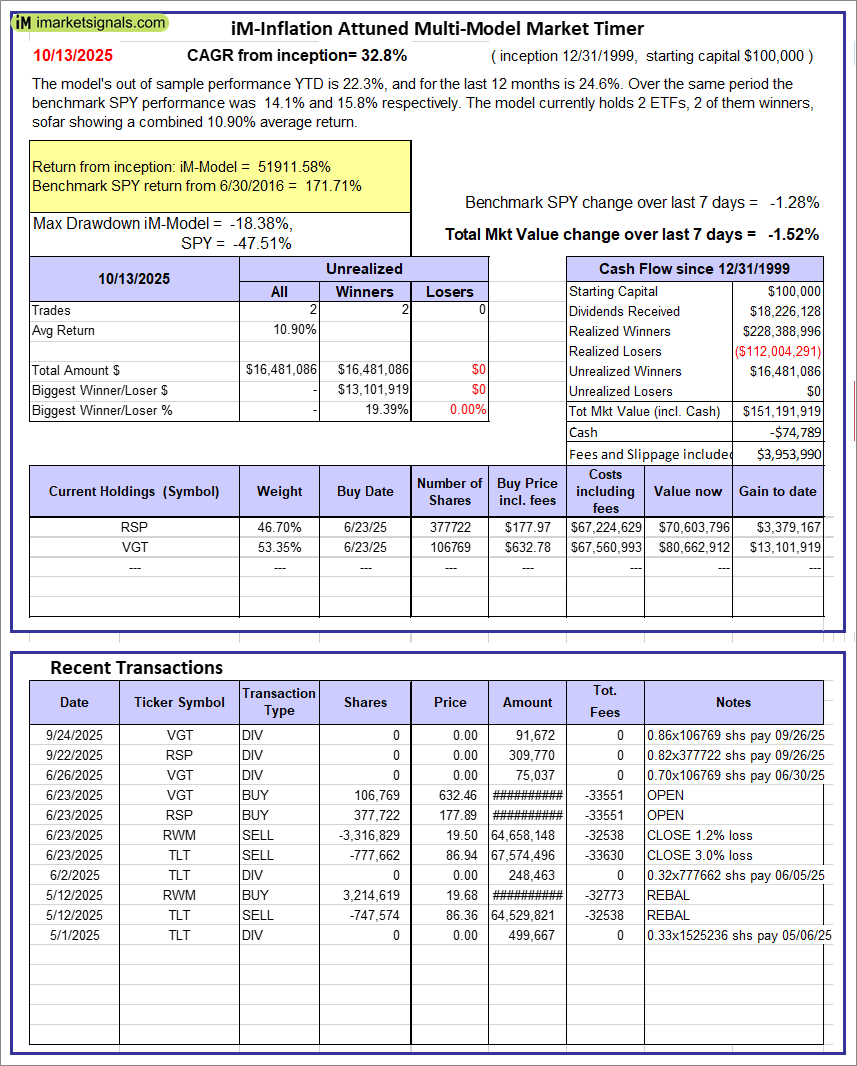 |
iM-Inflation Attuned Multi-Model Market Timer: The model’s out of sample performance YTD is 22.3%, and for the last 12 months is 24.6%. Over the same period the benchmark SPY performance was 14.1% and 15.8% respectively. Over the previous week the market value of the iM-Inflation Attuned Multi-Model Market Timer gained -1.52% at a time when SPY gained -1.28%. A starting capital of $100,000 at inception on 3/24/2017 would have grown to $151,191,919 which includes -$74,789 cash and excludes $3,953,990 spent on fees and slippage. |
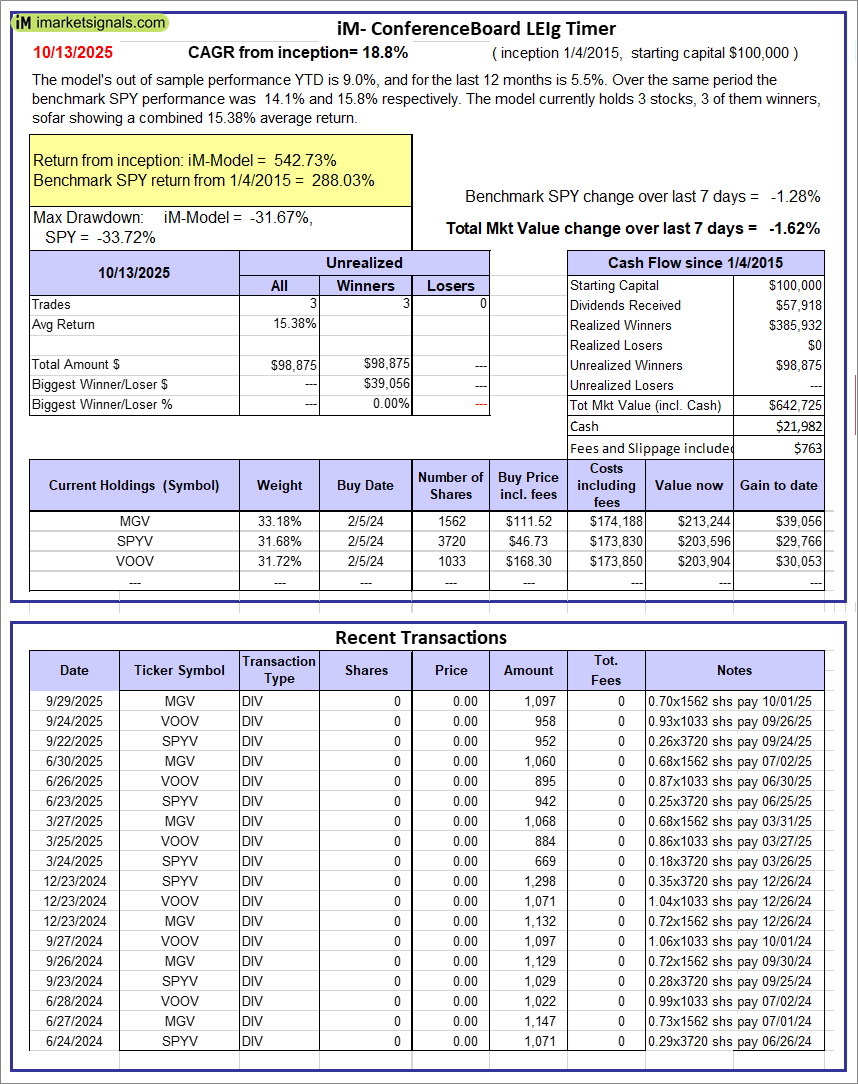 |
iM-Conference Board LEIg Timer: The model’s performance YTD is 14.3%, and for the last 12 months is 7.3%. Over the same period the benchmark SPY performance was 20.1% and 9.4% respectively. Over the previous week the market value of the iM-Conference Board LEIg Timer gained -1.62% at a time when SPY gained -1.28%. A starting capital of $100,000 at inception on 4/5/2017 would have grown to $642,725 which includes $21,982 cash and excludes $763 spent on fees and slippage. |
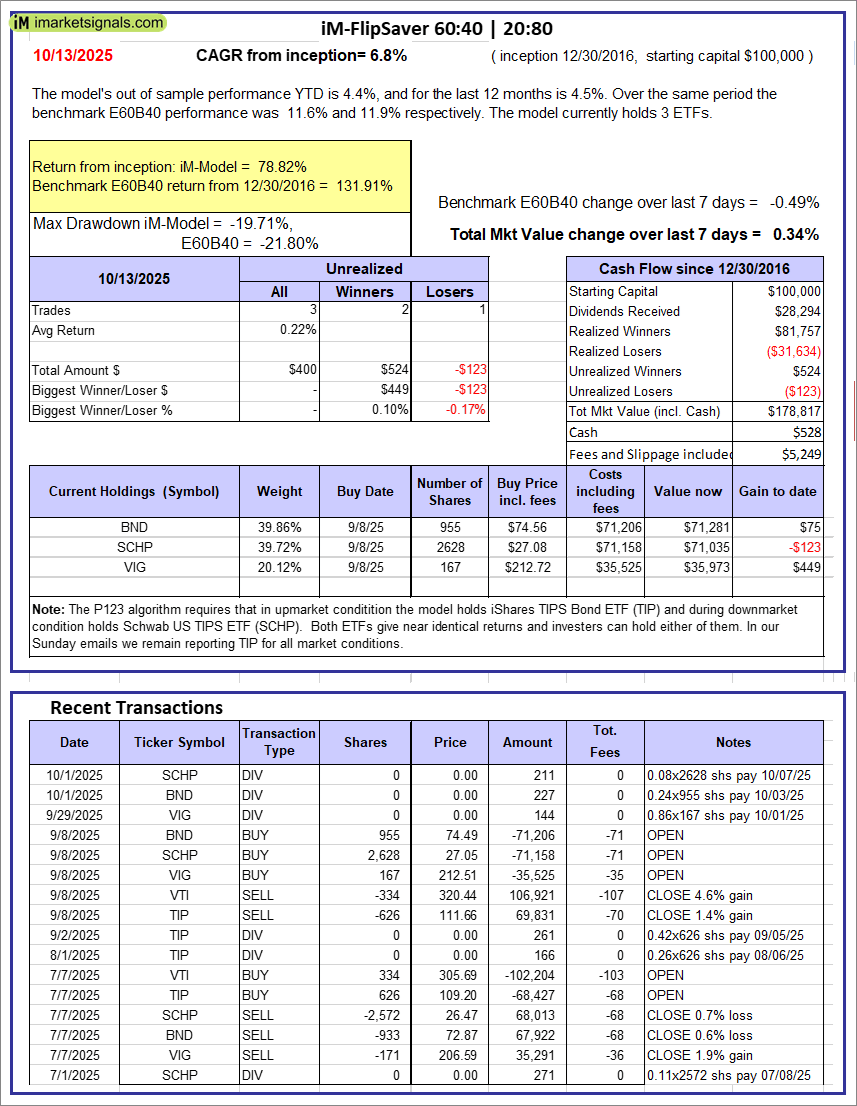 |
iM-FlipSaver 60:40 | 20:80 – 2017: The model’s out of sample performance YTD is 4.4%, and for the last 12 months is 4.5%. Over the same period the benchmark E60B40 performance was 11.6% and 11.9% respectively. Over the previous week the market value of iM-FlipSaver 80:20 | 20:80 gained 0.34% at a time when SPY gained -0.49%. A starting capital of $100,000 at inception on 7/16/2015 would have grown to $178,817 which includes $528 cash and excludes $5,249 spent on fees and slippage. |
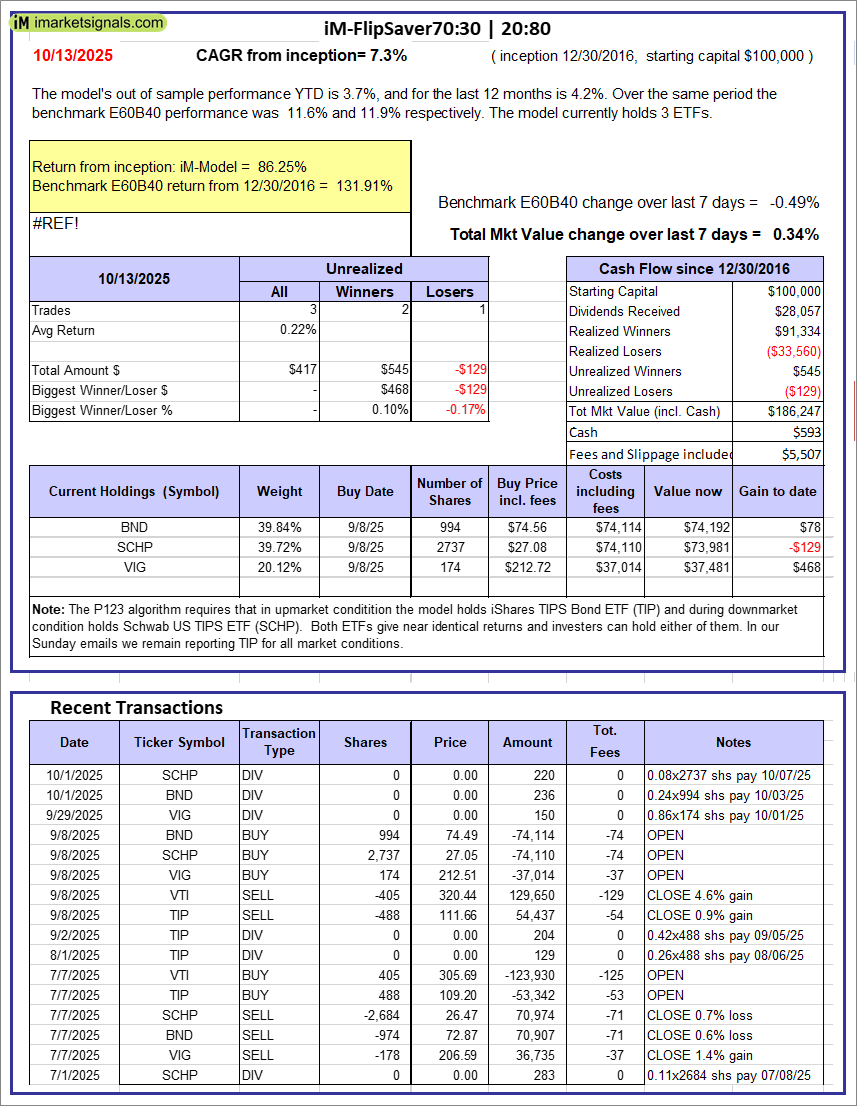 |
iM-FlipSaver 70:30 | 20:80 – 2017: The model’s out of sample performance YTD is 3.7%, and for the last 12 months is 4.2%. Over the same period the benchmark E60B40 performance was 11.6% and 11.9% respectively. Over the previous week the market value of iM-FlipSaver 70:30 | 20:80 gained 0.34% at a time when SPY gained -0.49%. A starting capital of $100,000 at inception on 7/15/2015 would have grown to $186,247 which includes $593 cash and excludes $5,507 spent on fees and slippage. |
 |
iM-FlipSaver 80:20 | 20:80 – 2017: The model’s out of sample performance YTD is 3.1%, and for the last 12 months is 4.0%. Over the same period the benchmark E60B40 performance was 11.6% and 11.9% respectively. Over the previous week the market value of iM-FlipSaver 80:20 | 20:80 gained 0.34% at a time when SPY gained -0.49%. A starting capital of $100,000 at inception on 1/2/2017 would have grown to $193,591 which includes $625 cash and excludes $5,756 spent on fees and slippage. |
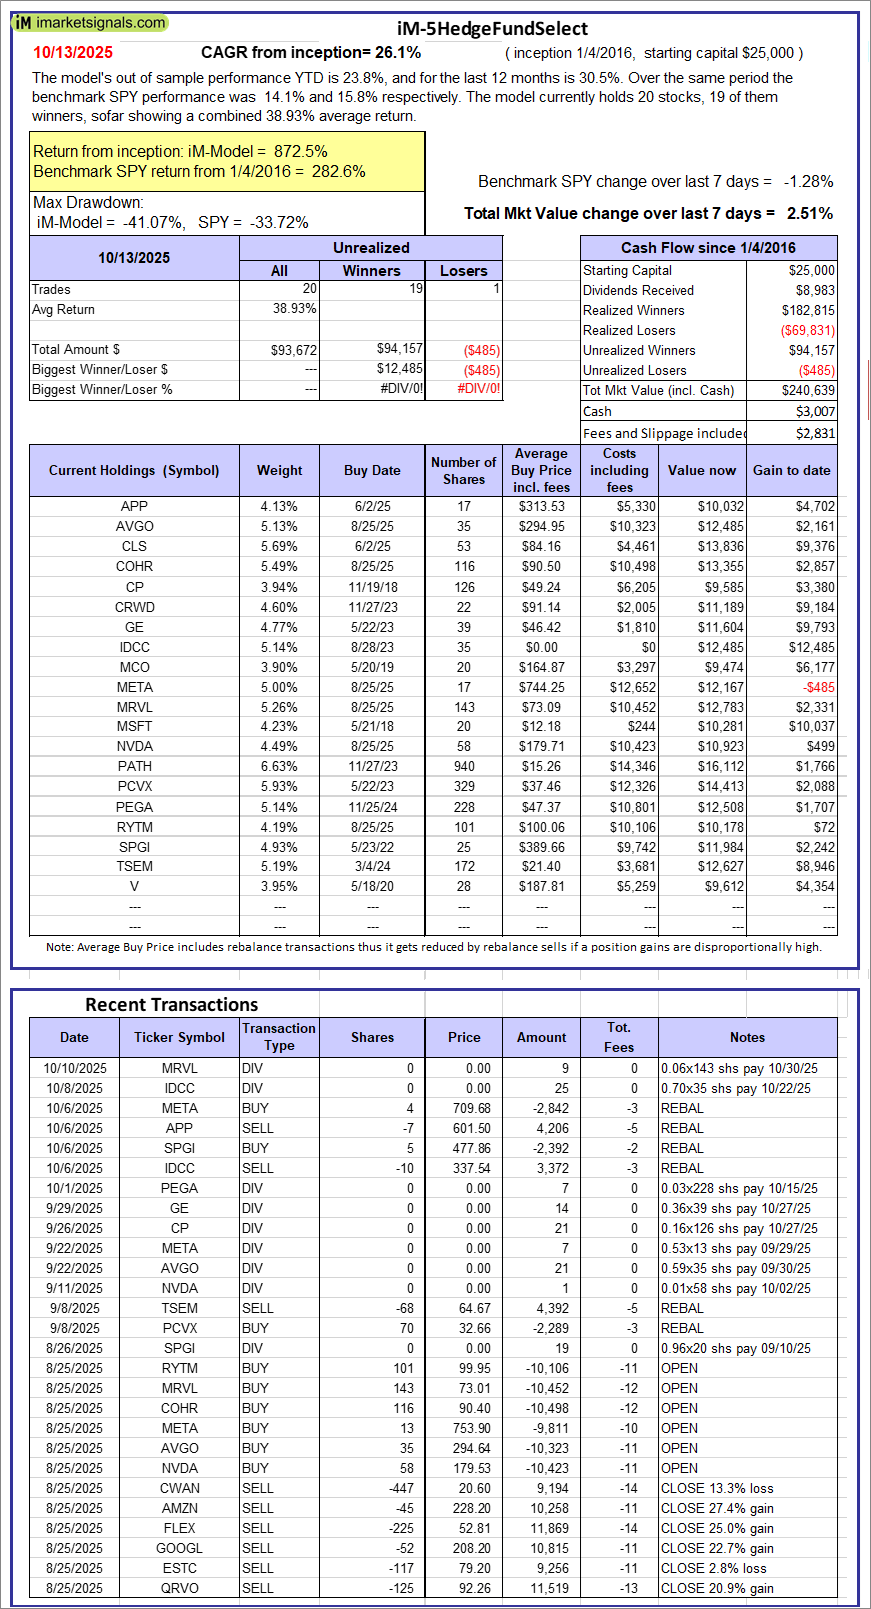 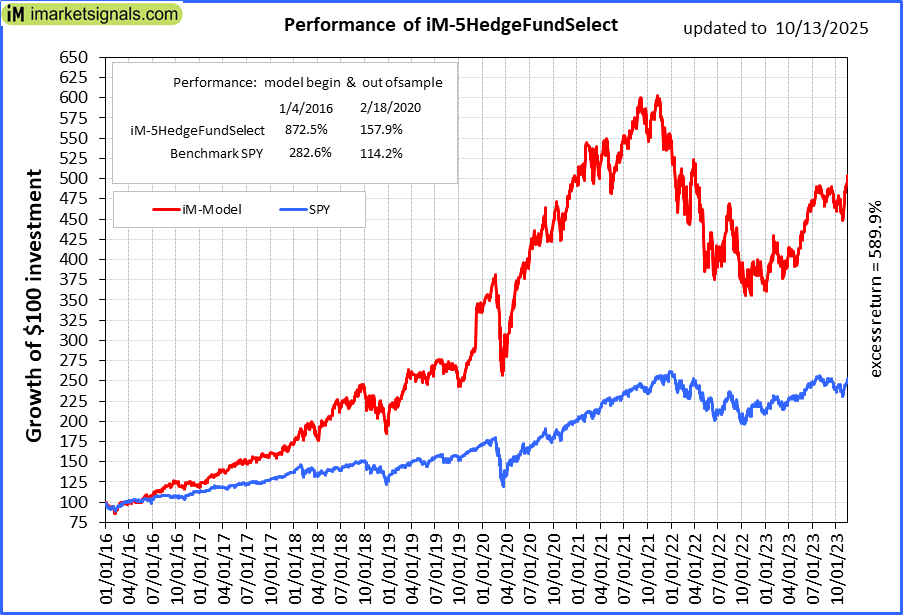 |
iM-5HedgeFundSelect: Since inception, on 1/5/2016, the model gained 872.54% while the benchmark SPY gained 282.60% over the same period. Over the previous week the market value of iM-5HedgeFundSelect gained 2.51% at a time when SPY gained -1.28%. A starting capital of $25,000 at inception on 1/5/2016 would have grown to $240,639 which includes $3,007 cash and excludes $2,831 spent on fees and slippage. |
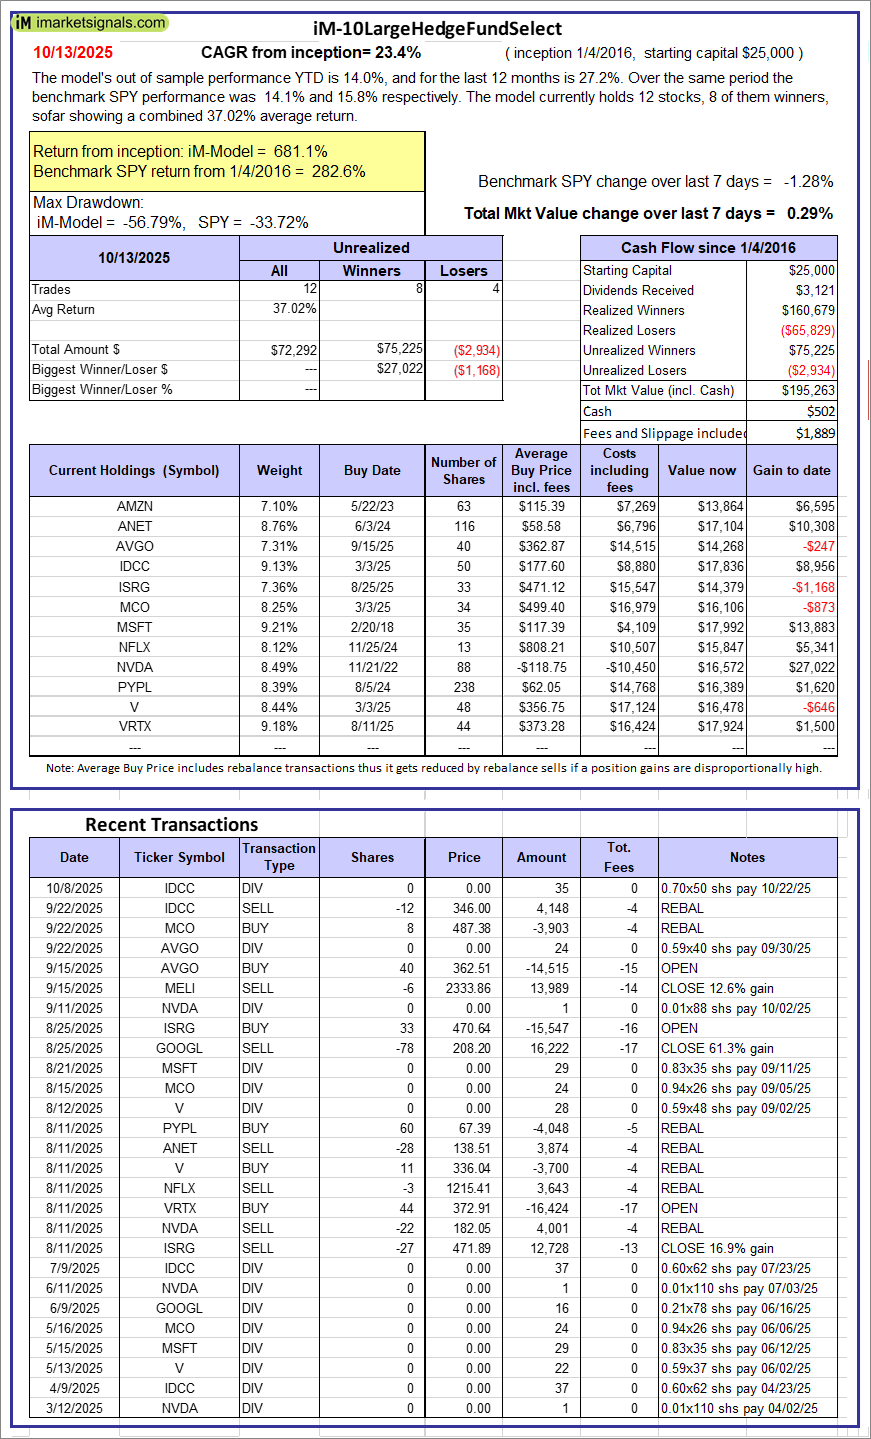 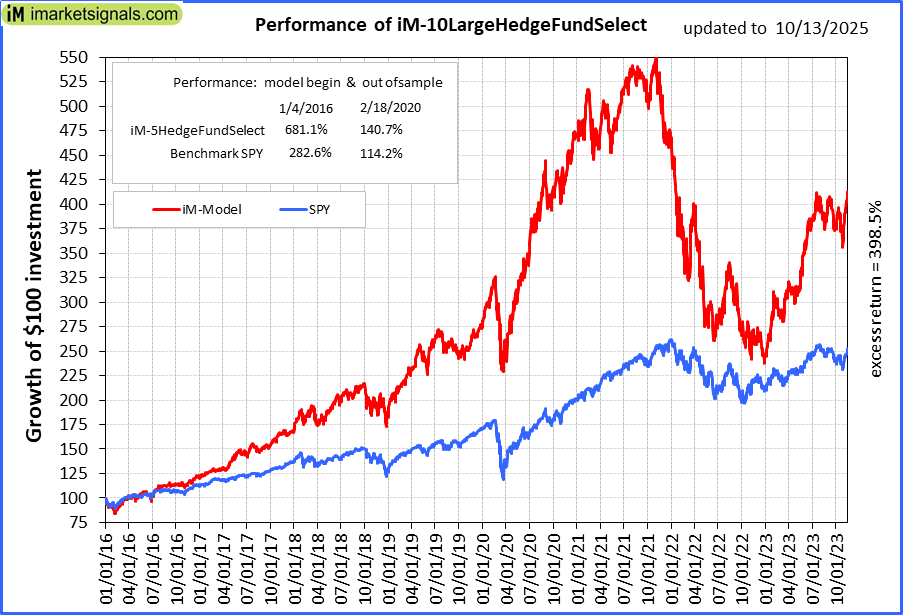 |
iM-10LargeHedgeFundSelect: Since inception, on 1/5/2016, the model gained 681.05% while the benchmark SPY gained 282.60% over the same period. Over the previous week the market value of iM-10LargeHedgeFundSelect gained 0.29% at a time when SPY gained -1.28%. A starting capital of $25,000 at inception on 1/5/2016 would have grown to $195,263 which includes $502 cash and excludes $1,889 spent on fees and slippage. |
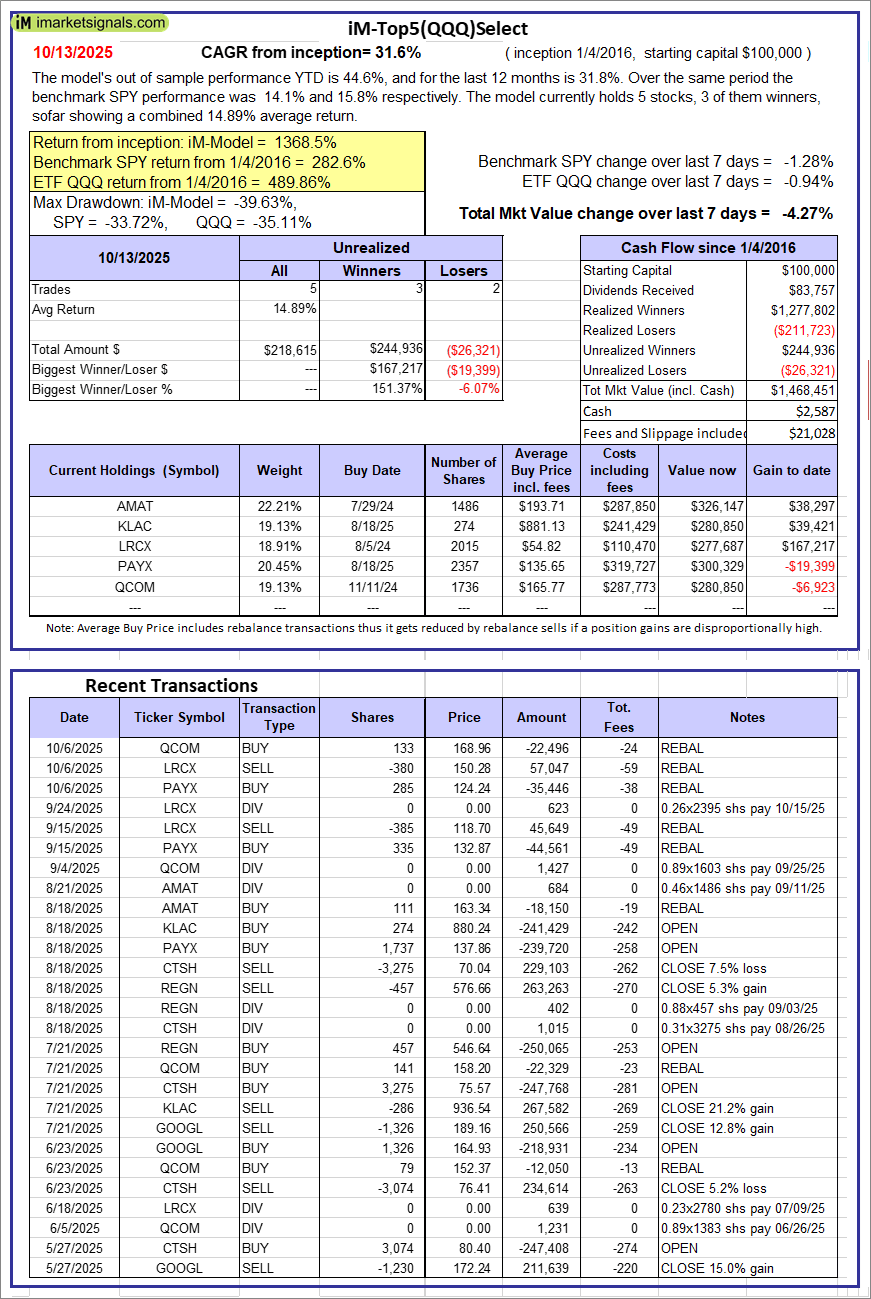 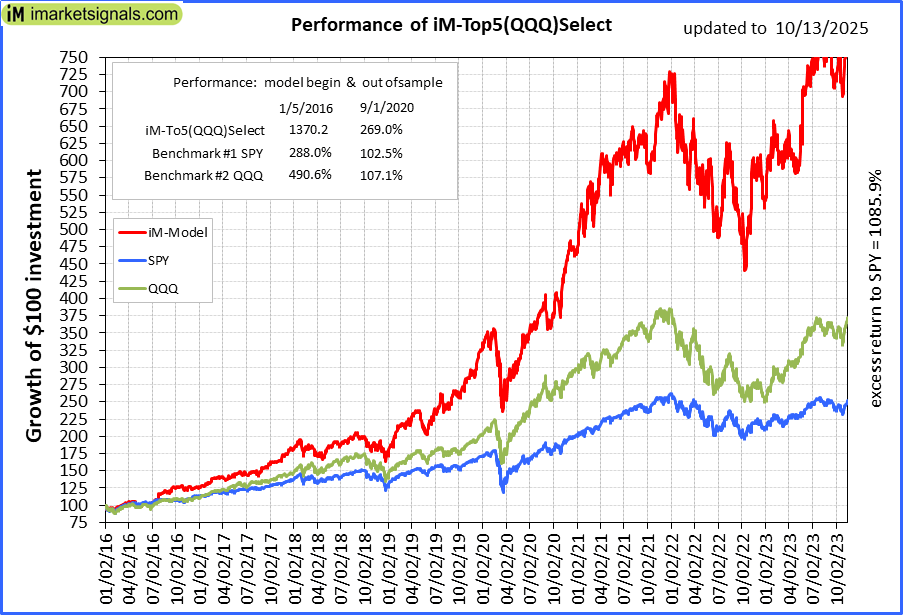 |
iM-Top5(QQQ)Select: Since inception, on 1/5/2016, the model gained 1368.45% while the benchmark SPY gained 282.60% over the same period. Over the previous week the market value of iM-Top5(QQQ)Select gained -4.27% at a time when SPY gained -1.28%. A starting capital of $100,000 at inception on 1/5/2016 would have grown to $1,468,451 which includes $2,587 cash and excludes $21,028 spent on fees and slippage. |
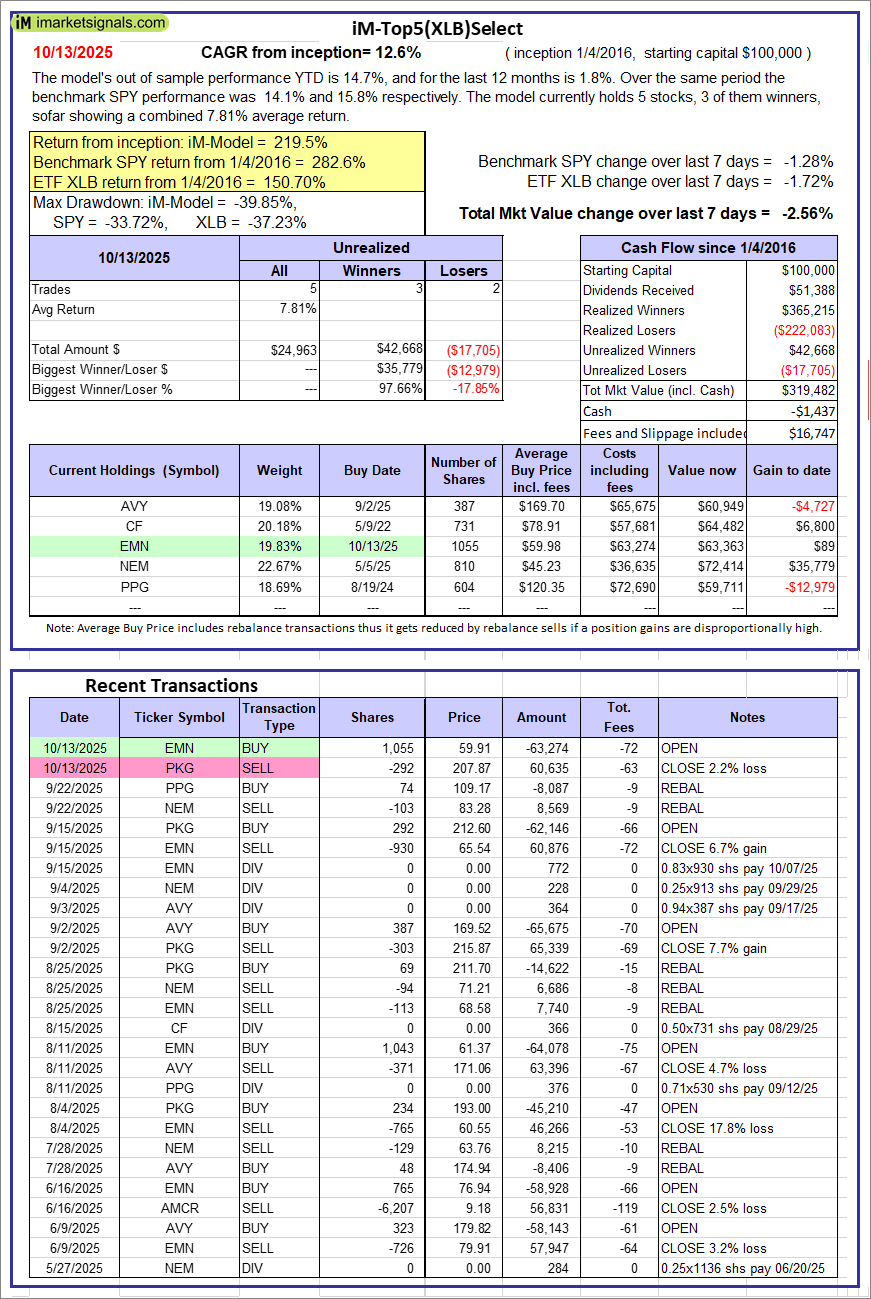 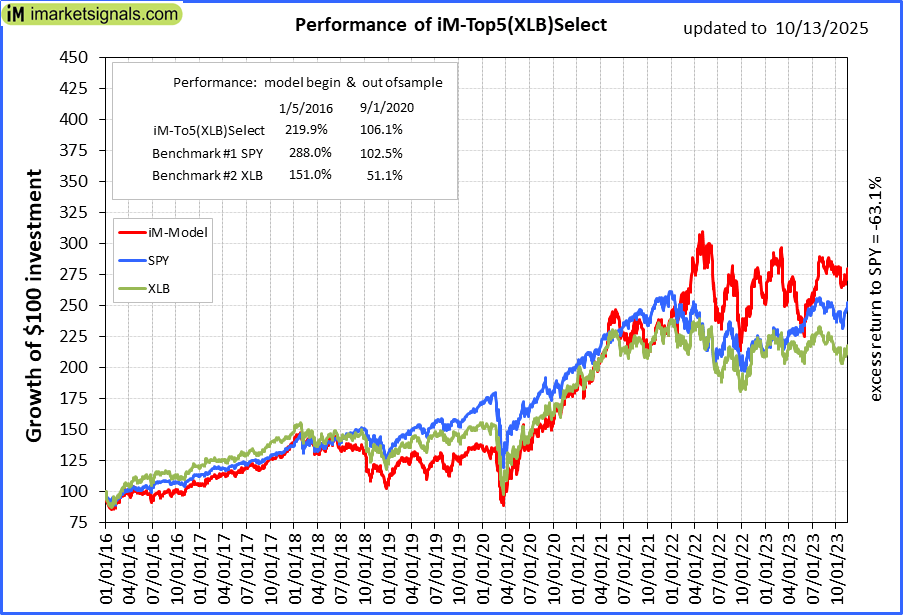 |
iM-Top5(XLB)Select: Since inception, on 1/5/2016, the model gained 219.48% while the benchmark SPY gained 282.60% over the same period. Over the previous week the market value of iM-Top5(XLB)Select gained -2.56% at a time when SPY gained -1.28%. A starting capital of $100,000 at inception on 1/5/2016 would have grown to $319,482 which includes -$1,437 cash and excludes $16,747 spent on fees and slippage. |
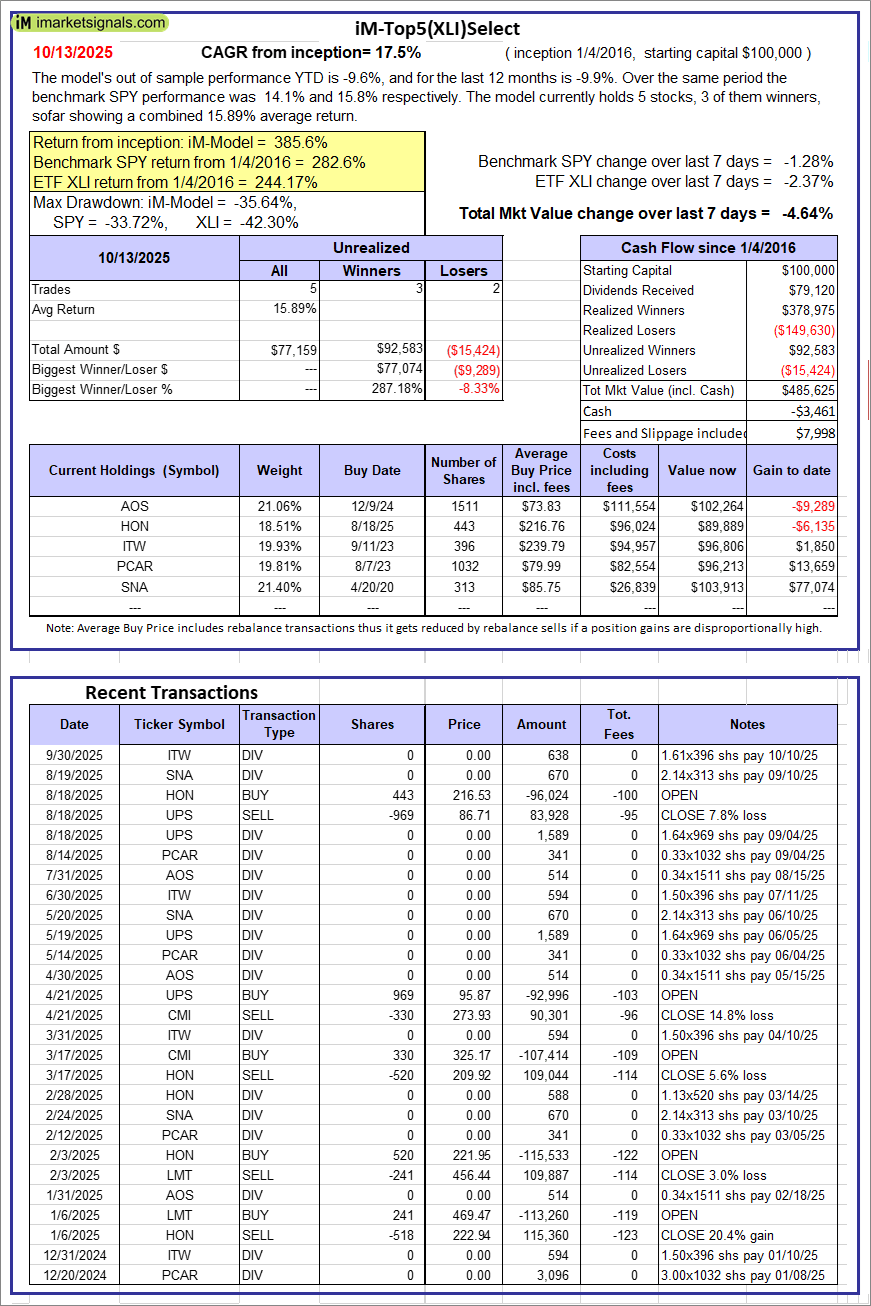 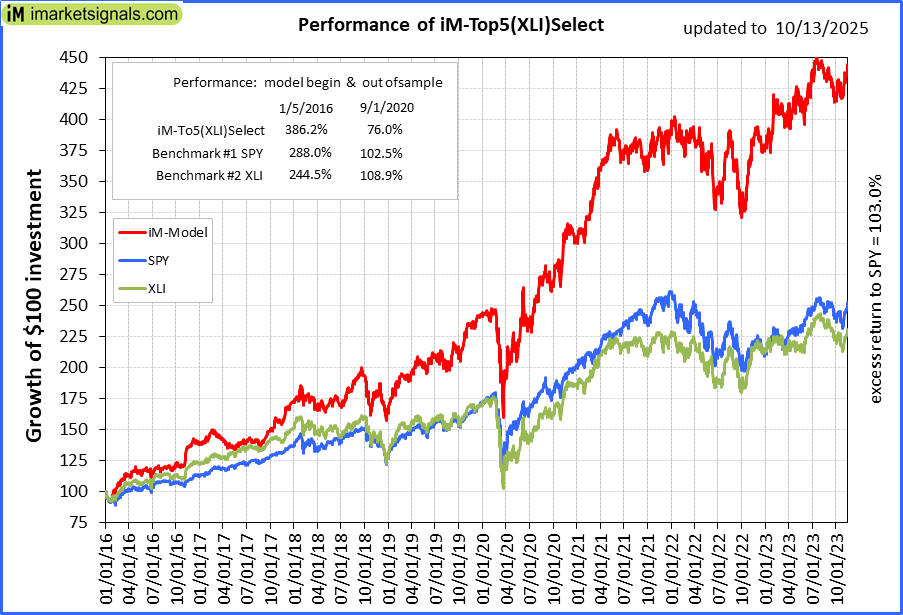 |
iM-Top5(XLI)Select: Since inception, on 1/5/2016, the model gained 385.62% while the benchmark SPY gained 282.60% over the same period. Over the previous week the market value of iM-Top5(XLI)Select gained -4.64% at a time when SPY gained -1.28%. A starting capital of $100,000 at inception on 1/5/2016 would have grown to $485,625 which includes -$3,461 cash and excludes $7,998 spent on fees and slippage. |
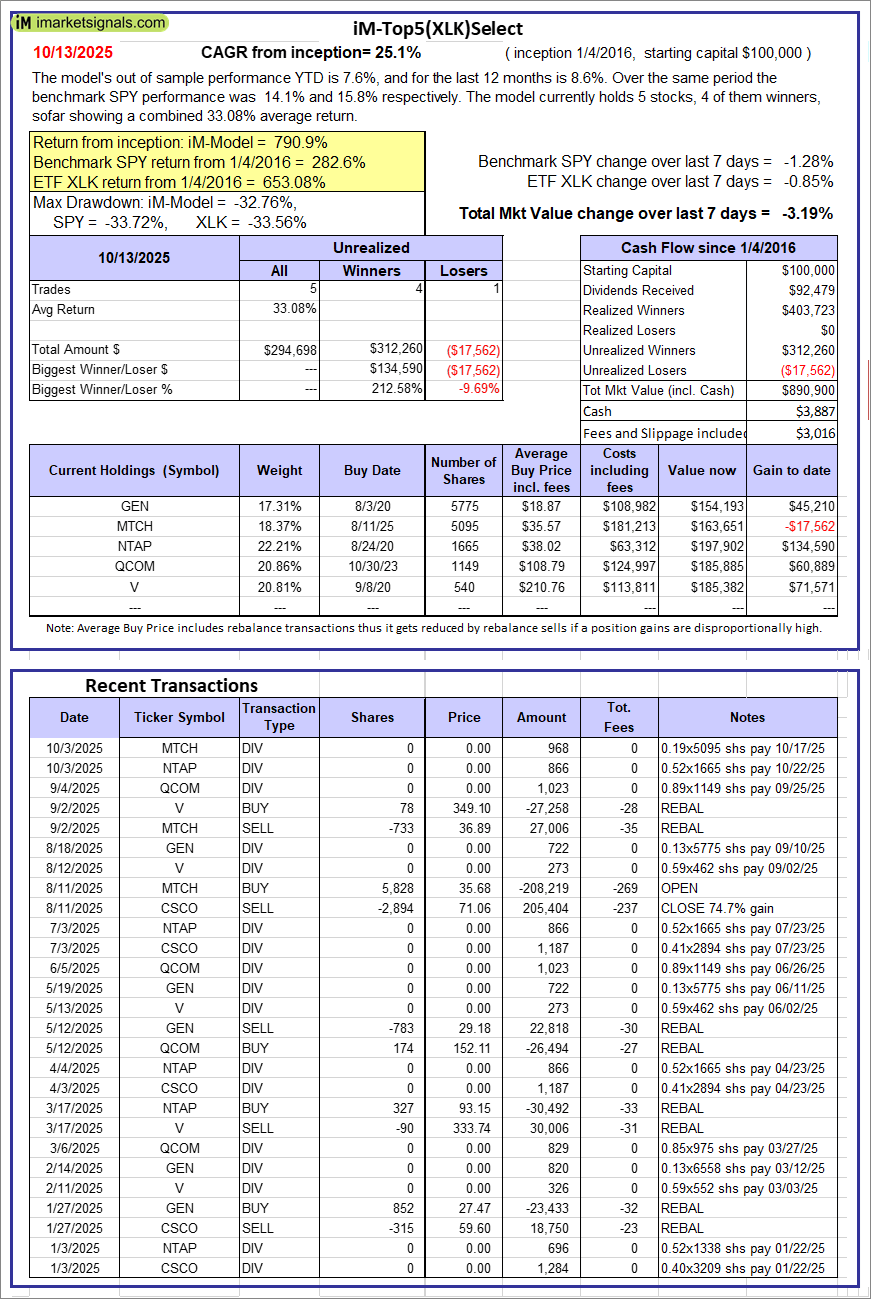 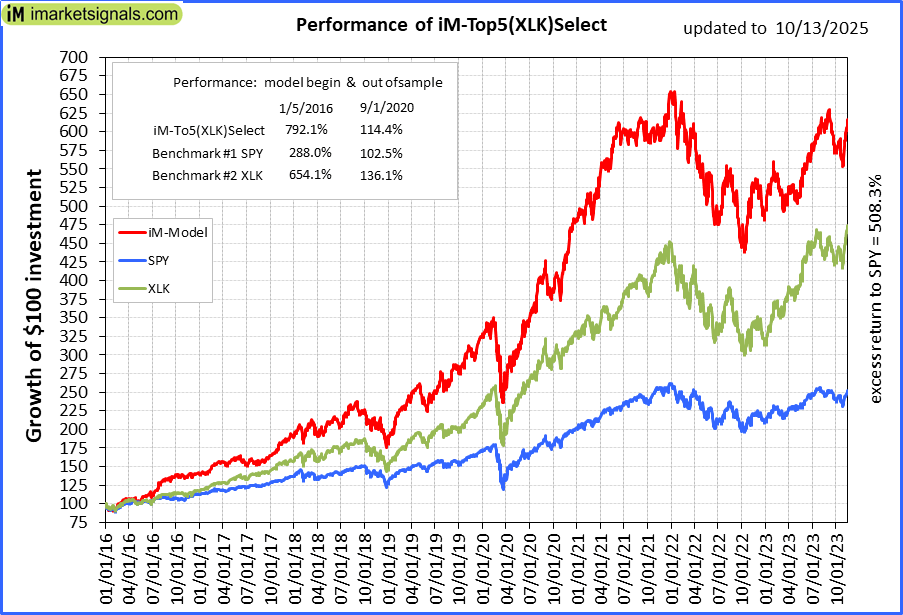 |
iM-Top5(XLK)Select: Since inception, on 1/5/2016, the model gained 790.90% while the benchmark SPY gained 282.60% over the same period. Over the previous week the market value of iM-Top5(XLK)Select gained -3.19% at a time when SPY gained -1.28%. A starting capital of $100,000 at inception on 1/5/2016 would have grown to $890,900 which includes $3,887 cash and excludes $3,016 spent on fees and slippage. |
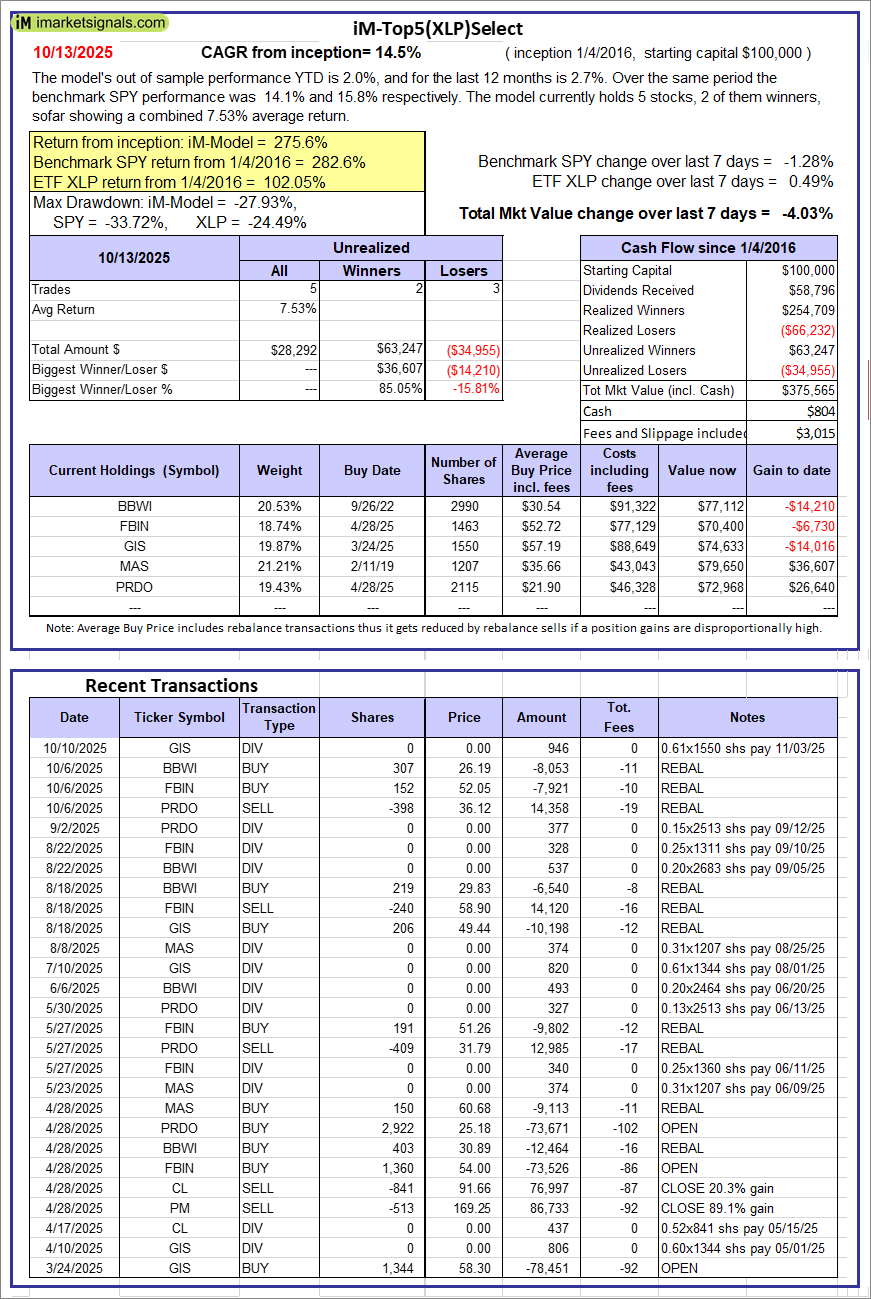 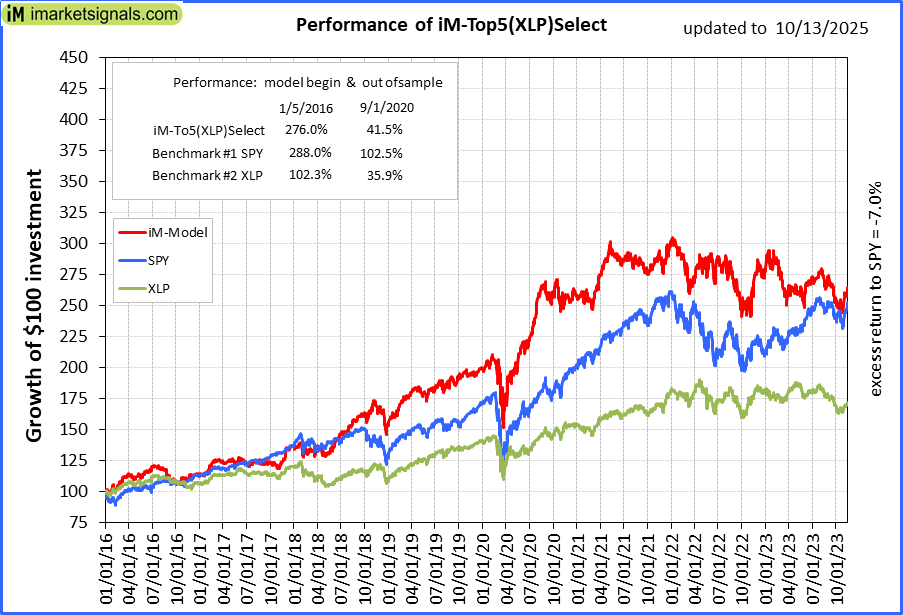 |
iM-Top5(XLP)Select: Since inception, on 1/5/2016, the model gained 275.57% while the benchmark SPY gained 282.60% over the same period. Over the previous week the market value of iM-Top5(XLP)Select gained -4.03% at a time when SPY gained -1.28%. A starting capital of $100,000 at inception on 1/5/2016 would have grown to $375,565 which includes $804 cash and excludes $3,015 spent on fees and slippage. |
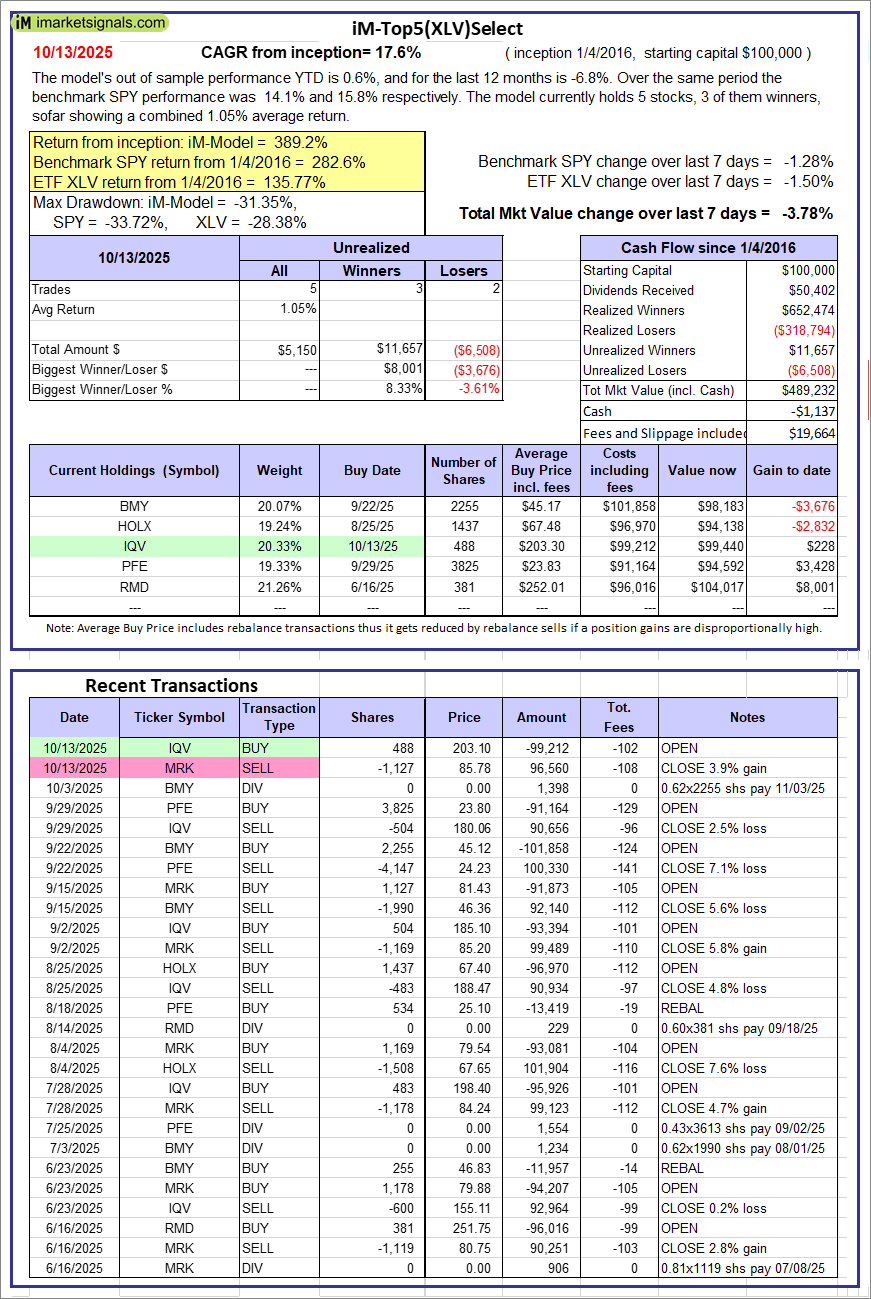 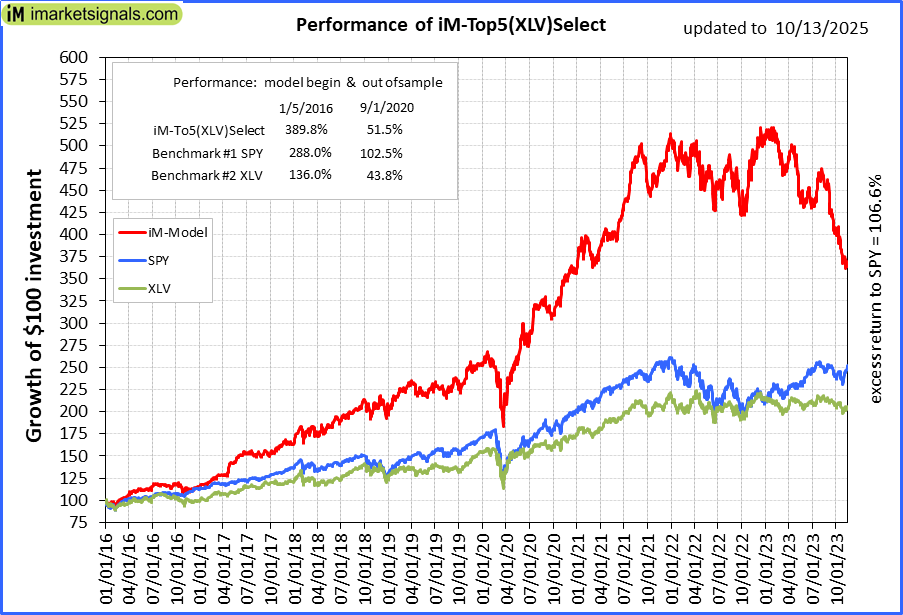 |
iM-Top5(XLV)Select: Since inception, on 1/5/2016, the model gained 389.23% while the benchmark SPY gained 282.60% over the same period. Over the previous week the market value of iM-Top5(XLV)Select gained -3.78% at a time when SPY gained -1.28%. A starting capital of $100,000 at inception on 1/5/2016 would have grown to $489,232 which includes -$1,137 cash and excludes $19,664 spent on fees and slippage. |
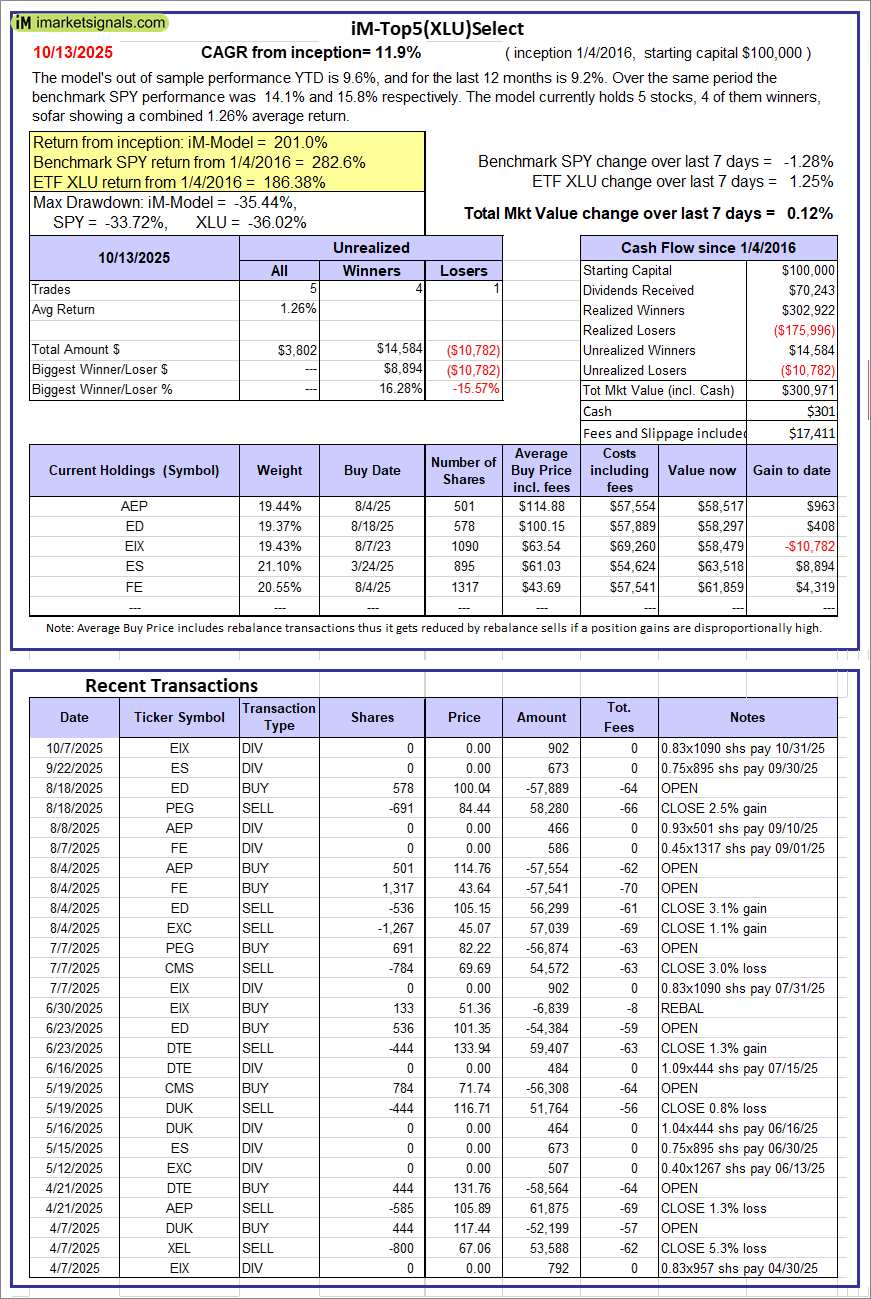 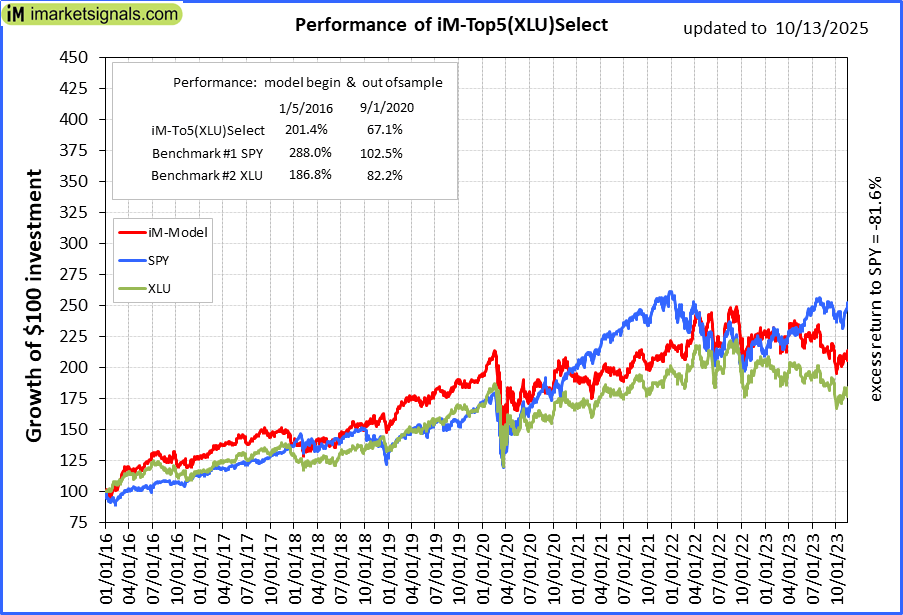 |
iM-Top5(XLU)Select: Since inception, on 1/5/2016, the model gained 200.97% while the benchmark SPY gained 282.60% over the same period. Over the previous week the market value of iM-Top5(XLU)Select gained 0.12% at a time when SPY gained -1.28%. A starting capital of $100,000 at inception on 1/5/2016 would have grown to $300,971 which includes $301 cash and excludes $17,411 spent on fees and slippage. |
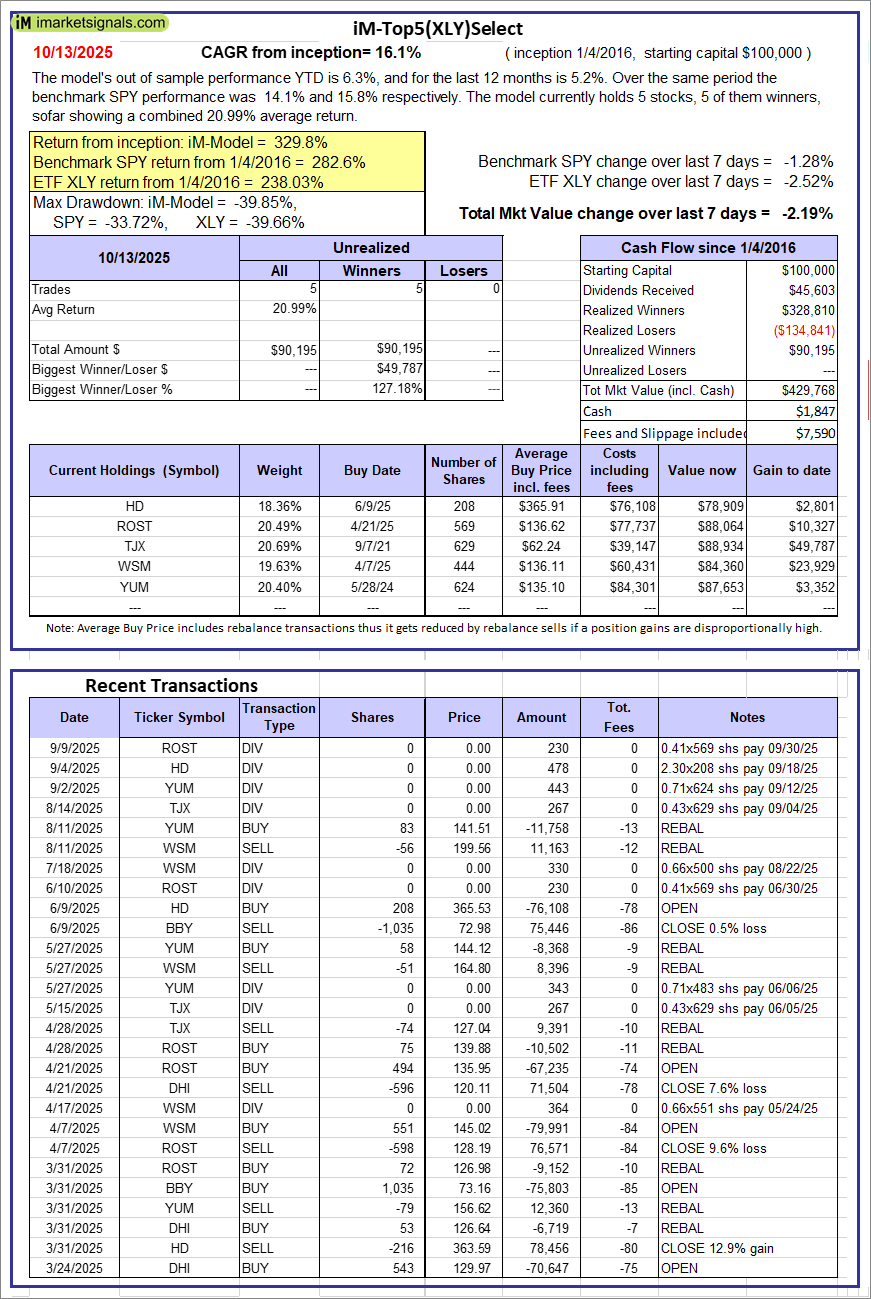 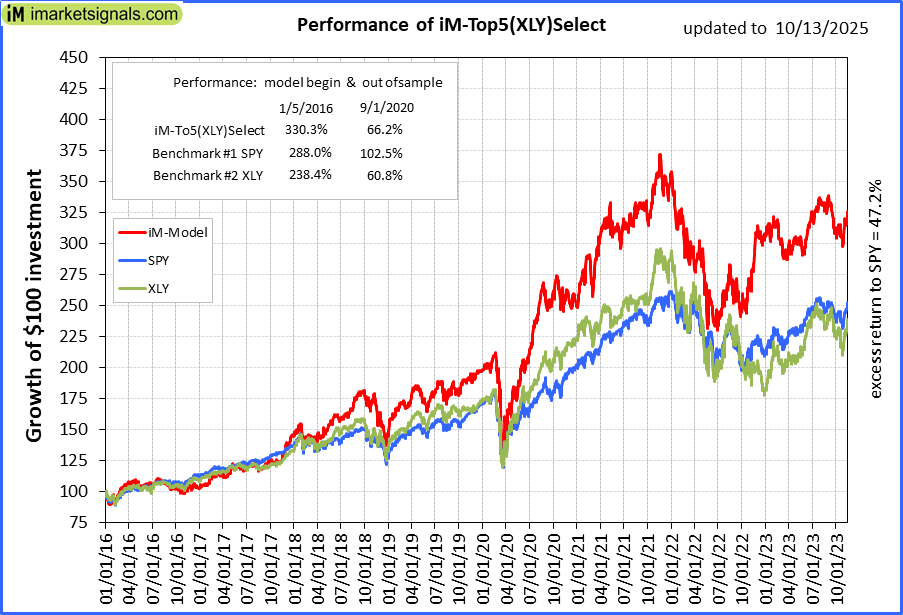 |
iM-Top5(XLY)Select: Since inception, on 1/5/2016, the model gained 329.77% while the benchmark SPY gained 282.60% over the same period. Over the previous week the market value of iM-Top5(XLY)Select gained -2.19% at a time when SPY gained -1.28%. A starting capital of $100,000 at inception on 1/5/2016 would have grown to $429,768 which includes $1,847 cash and excludes $7,590 spent on fees and slippage. |
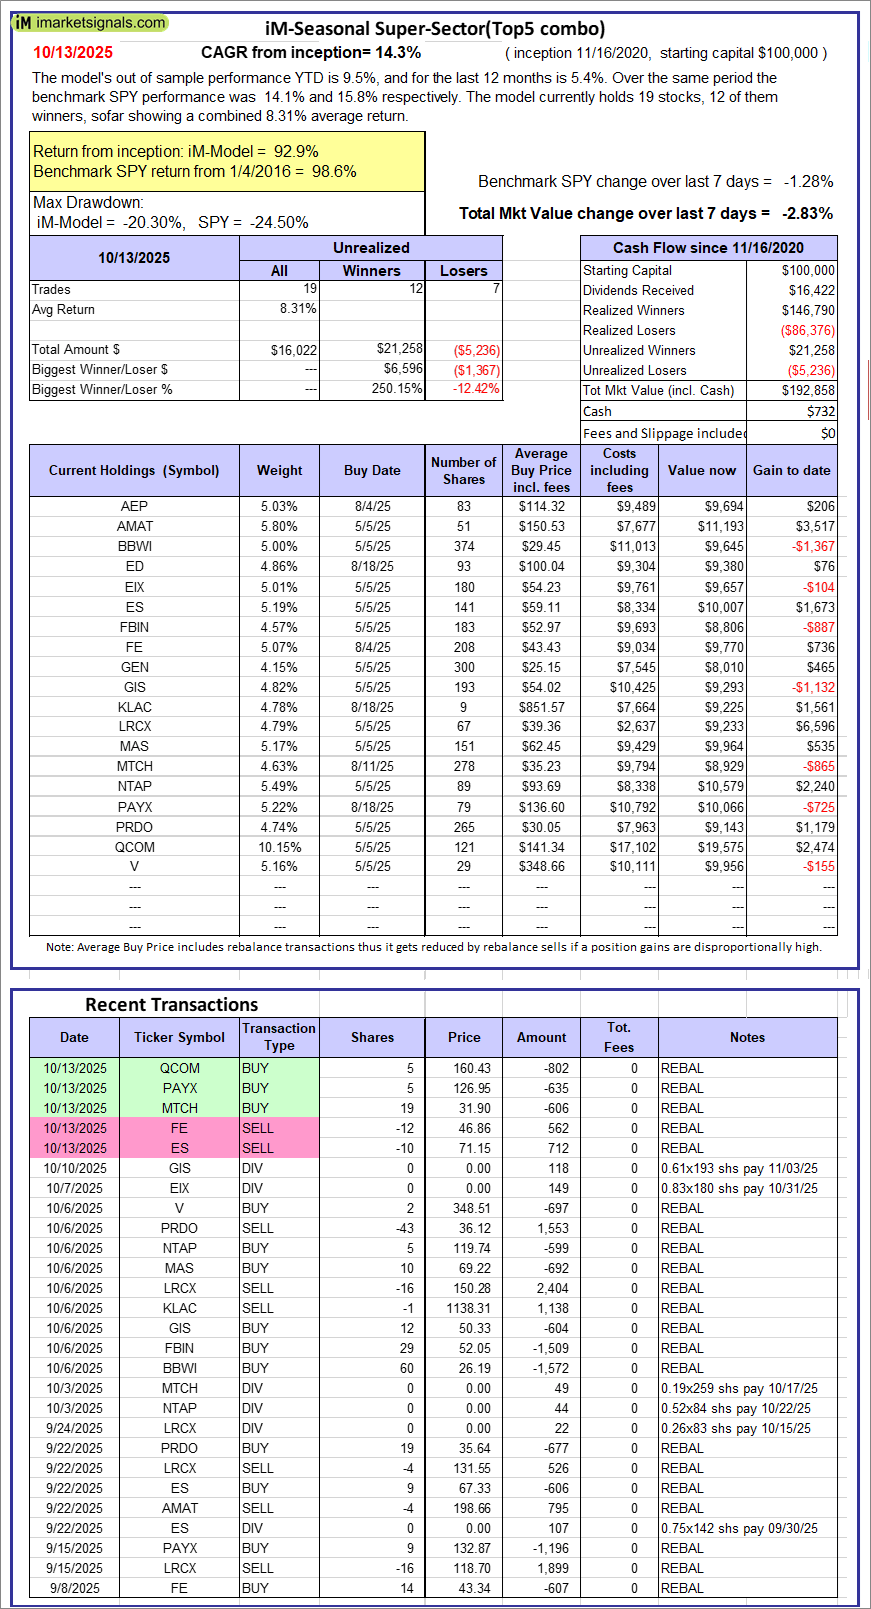 |
iM-Seasonal Super-Sectors (Top5 combo) : Since inception, on 11/17/2020, the model gained 92.86% while the benchmark SPY gained 98.61% over the same period. Over the previous week the market value of iM-Seasonal Super-Sectors (Top5 combo) gained -2.83% at a time when SPY gained -1.28%. A starting capital of $100,000 at inception on 11/17/2020 would have grown to $192,858 which includes $732 cash and excludes $00 spent on fees and slippage. |
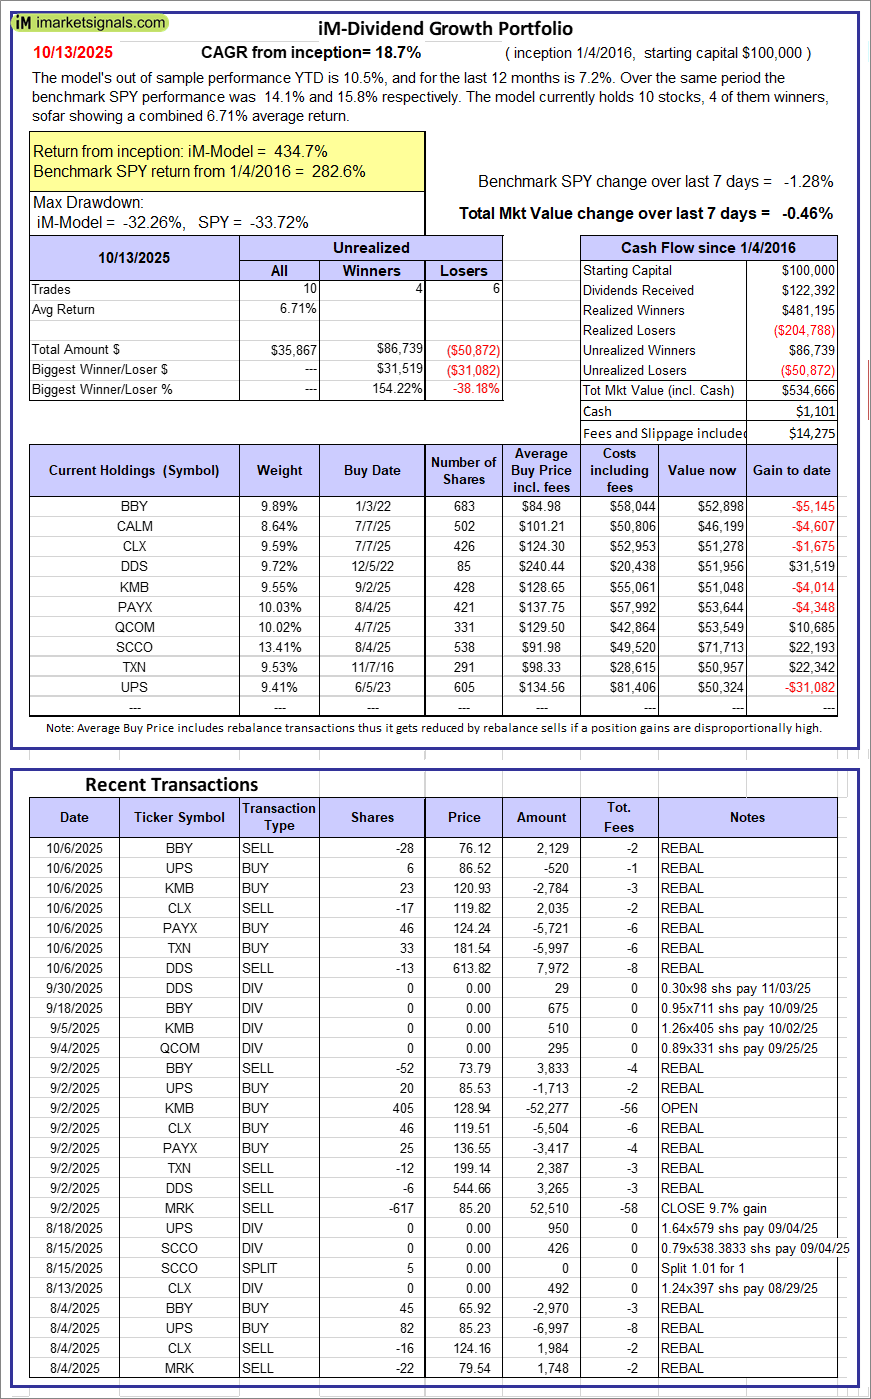 |
iM-Dividend Growth Portfolio: The model’s out of sample performance YTD is 10.5%, and for the last 12 months is 7.2%. Over the same period the benchmark SPY performance was 14.1% and 15.8% respectively. Over the previous week the market value of the iM-Dividend Growth Portfolio gained -0.46% at a time when SPY gained -1.28%. A starting capital of $100,000 at inception on 6/30/2016 would have grown to $534,666 which includes $1,101 cash and excludes $14,275 spent on fees and slippage. |
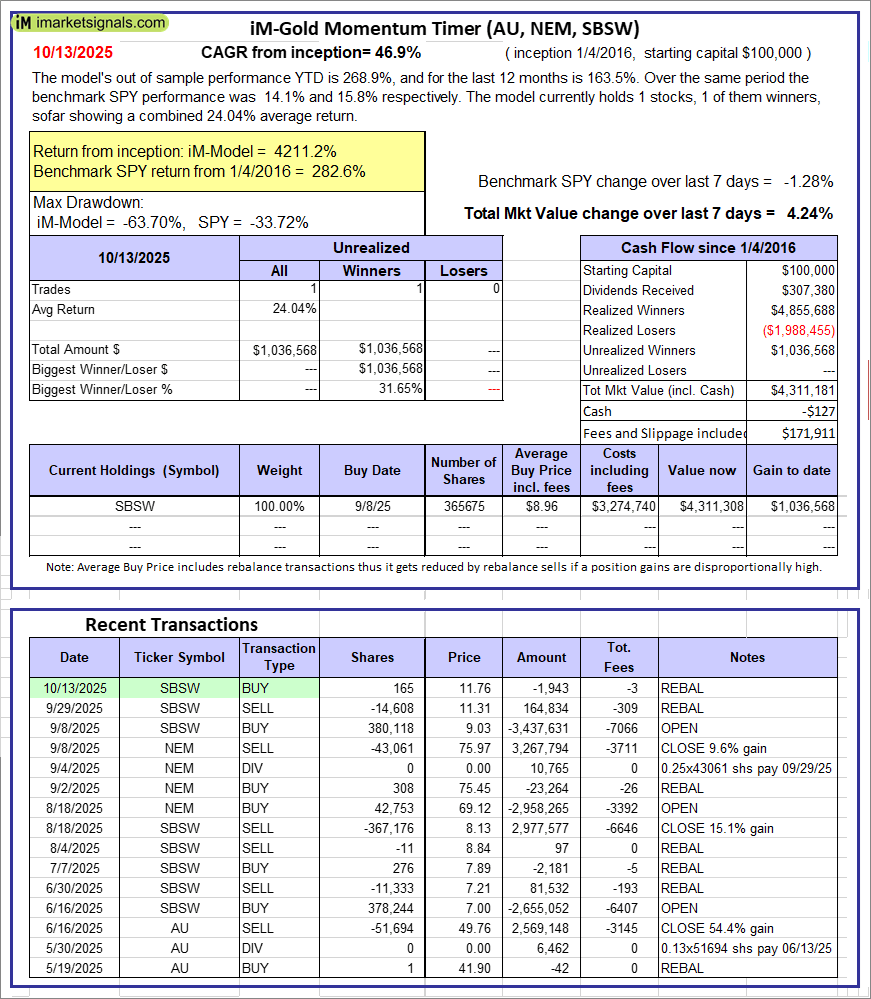 |
iM-Gold Momentum Timer (AU, NEM, SBSW): The model’s out of sample performance YTD is 268.9%, and for the last 12 months is 163.5%. Over the same period the benchmark SPY performance was 14.1% and 15.8% respectively. Over the previous week the market value of iM-Gold Momentum Timer (AU, NEM, SBSW) gained 4.24% at a time when SPY gained -1.28%. A starting capital of $100,000 at inception on 6/30/2016 would have grown to -$127 which includes $171,911 cash and excludes Gain to date spent on fees and slippage. |
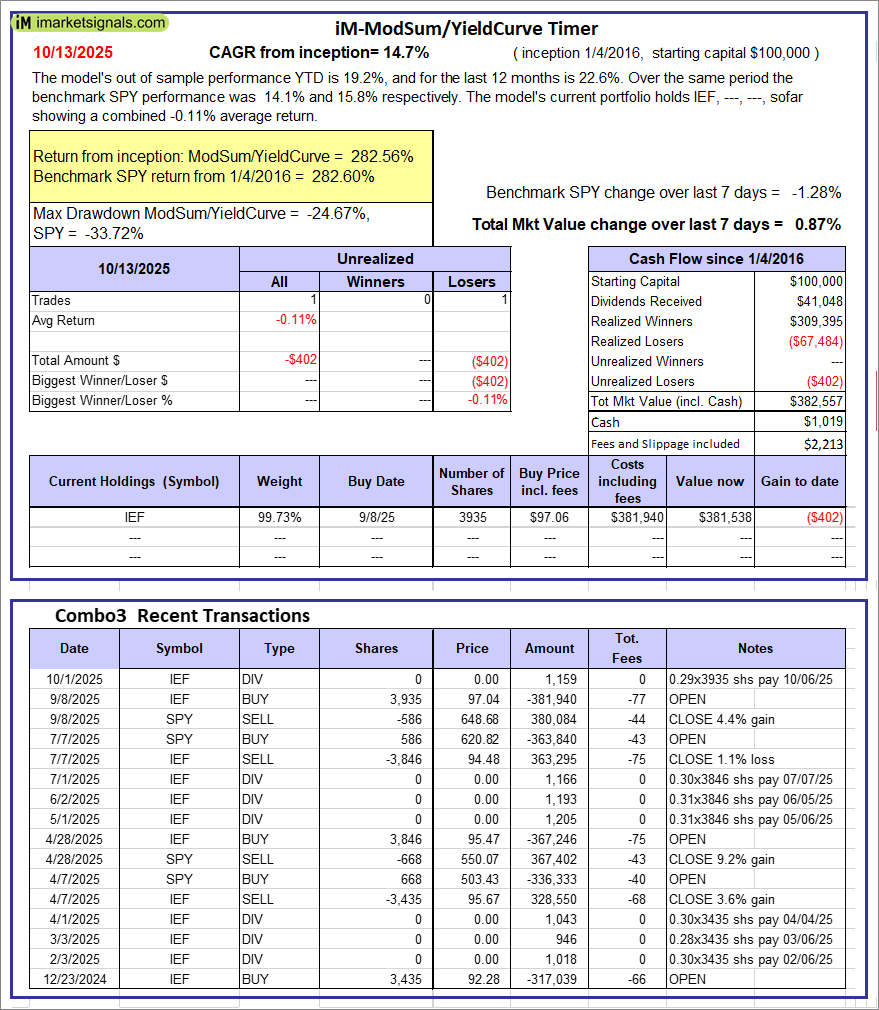 |
iM-ModSum/YieldCurve Timer: The model’s out of sample performance YTD is 19.2%, and for the last 12 months is 22.6%. Over the same period the benchmark SPY performance was 14.1% and 15.8% respectively. Over the previous week the market value of iM-PortSum/YieldCurve Timer gained 0.87% at a time when SPY gained -1.28%. A starting capital of $100,000 at inception on 1/1/2016 would have grown to $382,557 which includes $1,019 cash and excludes $2,213 spent on fees and slippage. |
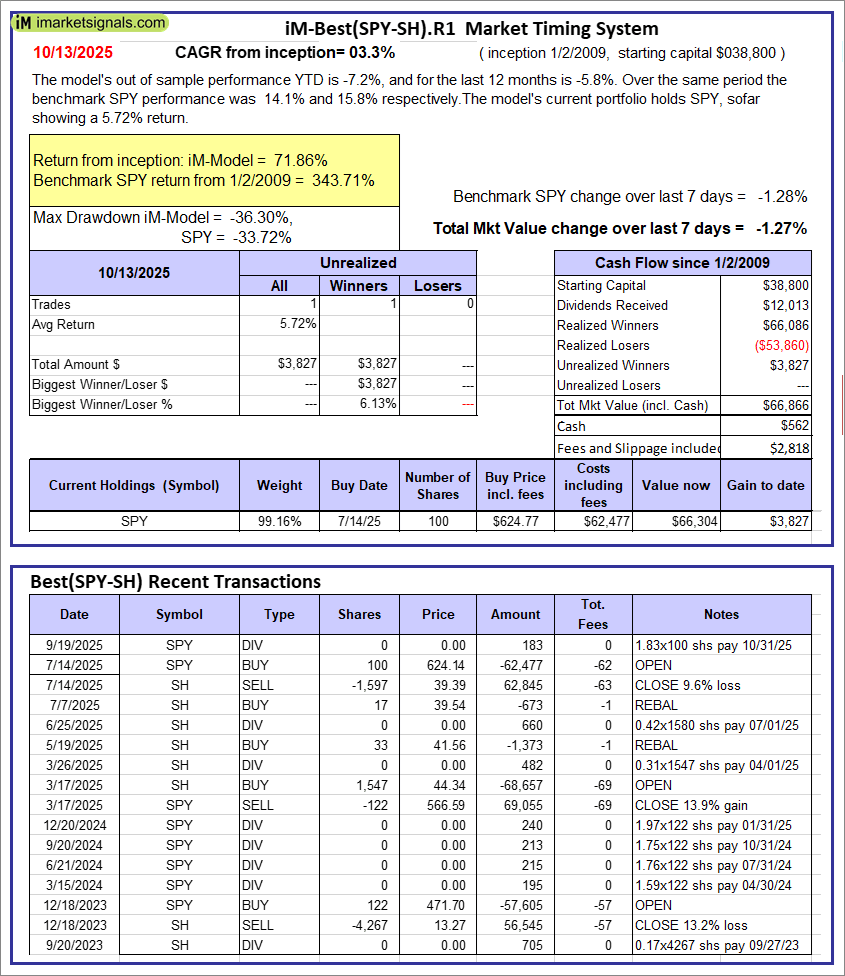 |
iM-Best(SPY-SH).R1: The model’s out of sample performance YTD is -7.2%, and for the last 12 months is -5.8%. Over the same period the benchmark SPY performance was 14.1% and 15.8% respectively. Over the previous week the market value of Best(SPY-SH) gained -1.27% at a time when SPY gained -1.28%. A starting capital of $100,000 at inception on 1/2/2009 would have grown to $66,866 which includes $562 cash and excludes $2,818 spent on fees and slippage. |
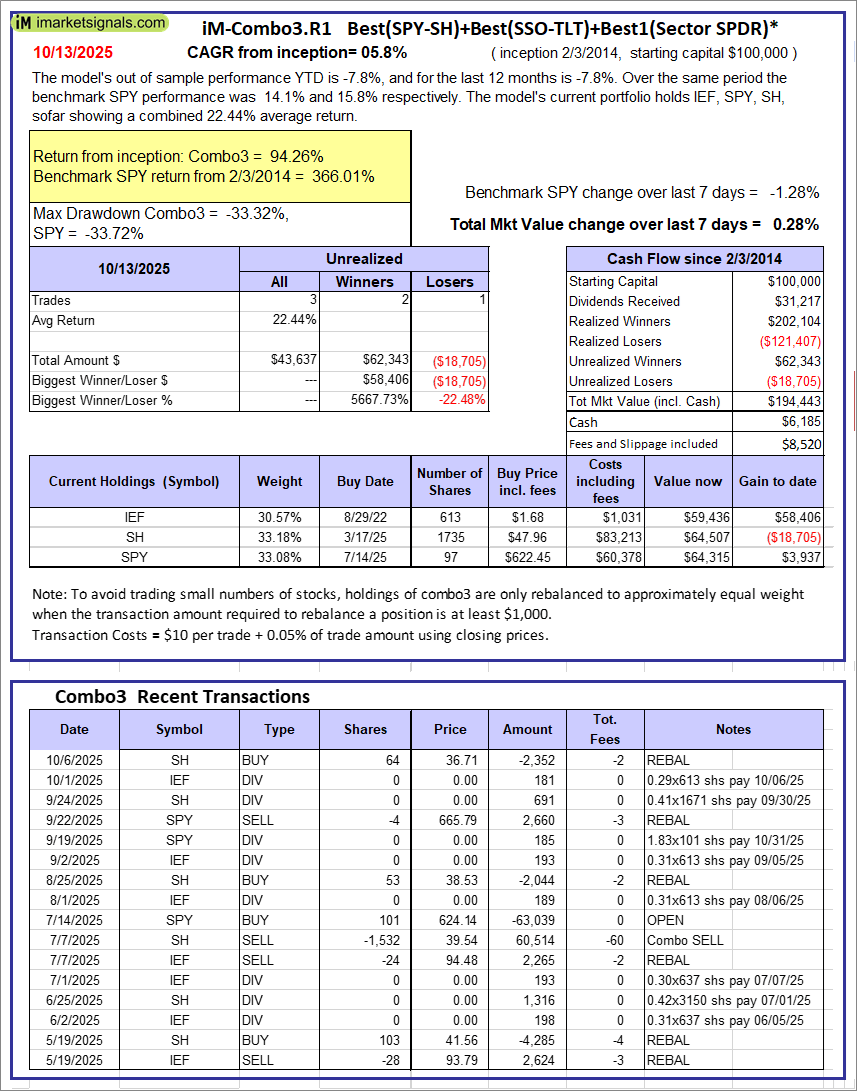 |
iM-Combo3.R1: The model’s out of sample performance YTD is -7.8%, and for the last 12 months is -7.8%. Over the same period the benchmark SPY performance was 14.1% and 15.8% respectively. Over the previous week the market value of iM-Combo3.R1 gained 0.28% at a time when SPY gained -1.28%. A starting capital of $100,000 at inception on 2/3/2014 would have grown to $194,443 which includes $6,185 cash and excludes $8,520 spent on fees and slippage. |
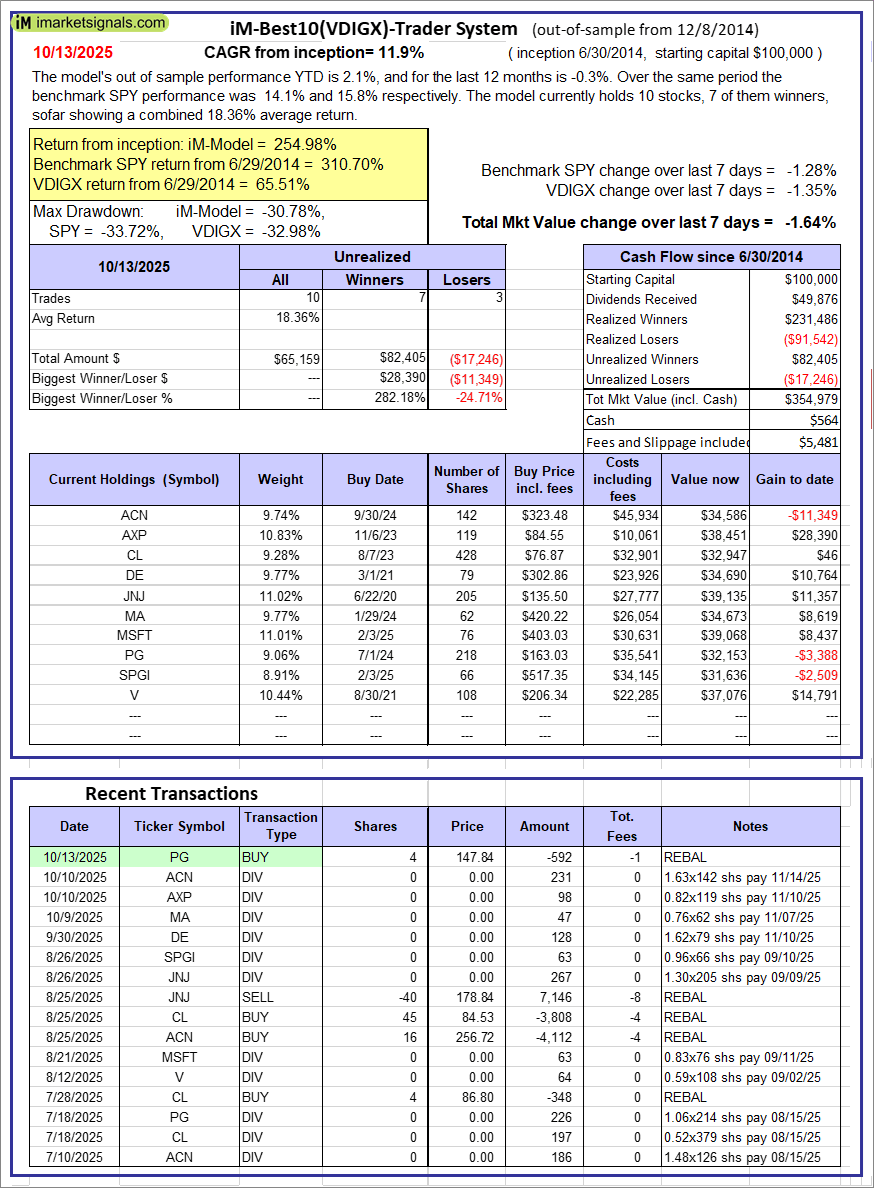 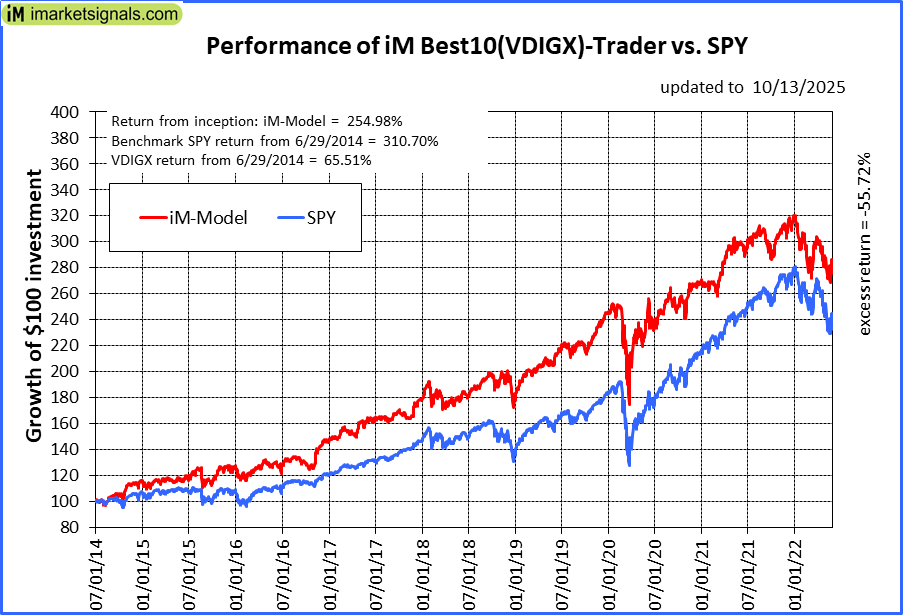 |
iM-Best10(VDIGX)-Trader: The model’s out of sample performance YTD is 2.1%, and for the last 12 months is -0.3%. Over the same period the benchmark SPY performance was 14.1% and 15.8% respectively. Since inception, on 7/1/2014, the model gained 254.98% while the benchmark SPY gained 310.70% and VDIGX gained 65.51% over the same period. Over the previous week the market value of iM-Best10(VDIGX) gained -1.64% at a time when SPY gained -1.28%. A starting capital of $100,000 at inception on 7/1/2014 would have grown to $354,979 which includes $564 cash and excludes $5,481 spent on fees and slippage. |
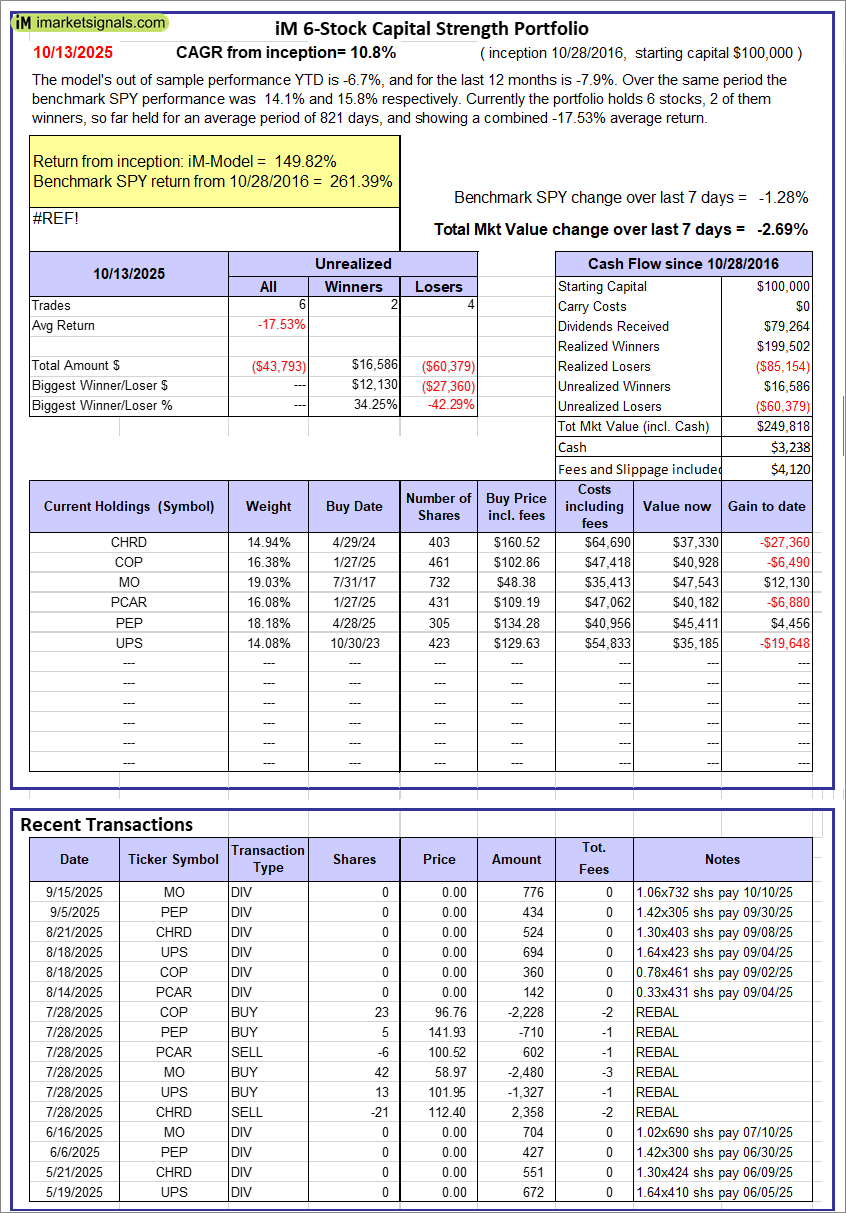 |
iM 6-Stock Capital Strength Portfolio: The model’s out of sample performance YTD is -6.7%, and for the last 12 months is -7.9%. Over the same period the benchmark SPY performance was 14.1% and 15.8% respectively. Over the previous week the market value of the iM 6-Stock Capital Strength Portfolio gained -2.69% at a time when SPY gained -1.28%. A starting capital of $100,000 at inception on 10/28/2016 would have grown to $249,818 which includes $3,238 cash and excludes $4,120 spent on fees and slippage. |
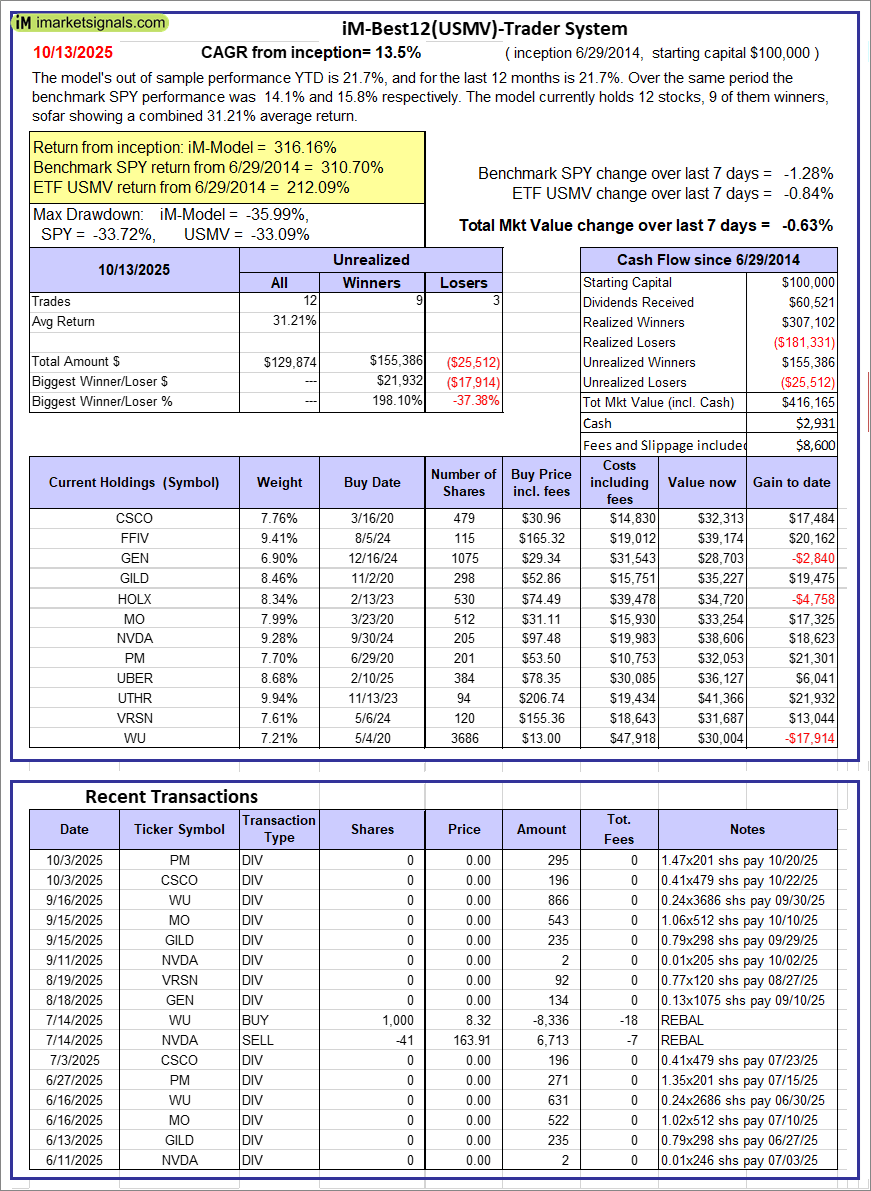 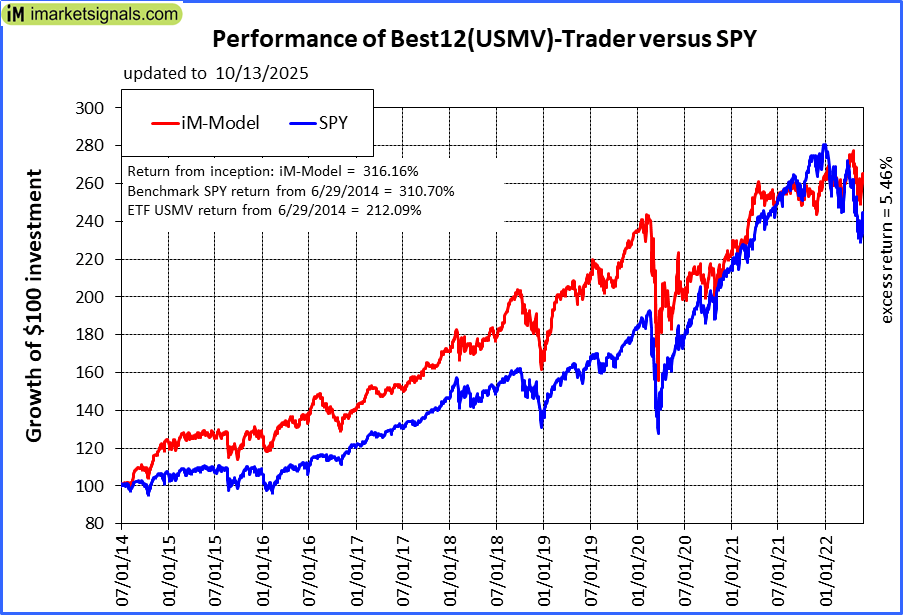 |
iM-Best12(USMV)-Trader: The model’s out of sample performance YTD is 21.7%, and for the last 12 months is 21.7%. Over the same period the benchmark SPY performance was 14.1% and 15.8% respectively. Since inception, on 6/30/2014, the model gained 316.16% while the benchmark SPY gained 310.70% and the ETF USMV gained 212.09% over the same period. Over the previous week the market value of iM-Best12(USMV)-Trader gained -0.63% at a time when SPY gained -1.28%. A starting capital of $100,000 at inception on 6/30/2014 would have grown to $416,165 which includes $2,931 cash and excludes $8,600 spent on fees and slippage. |
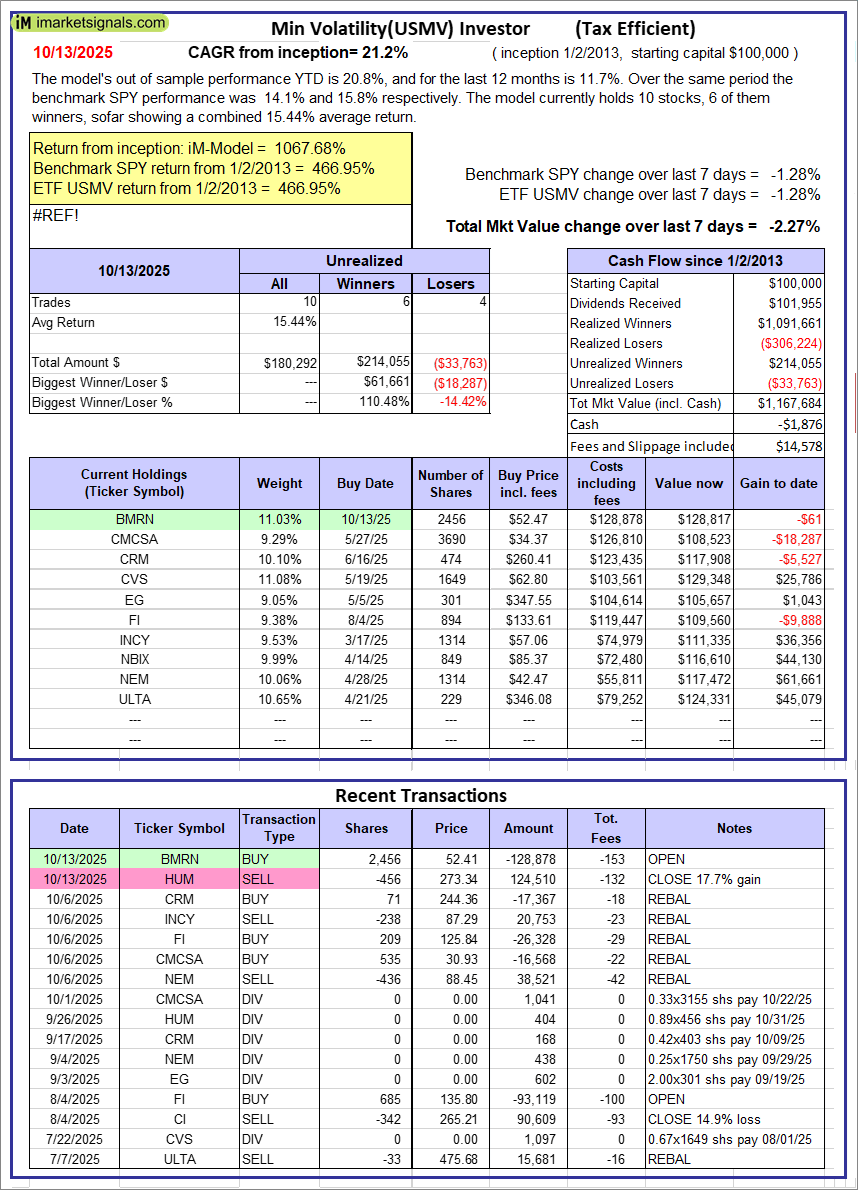 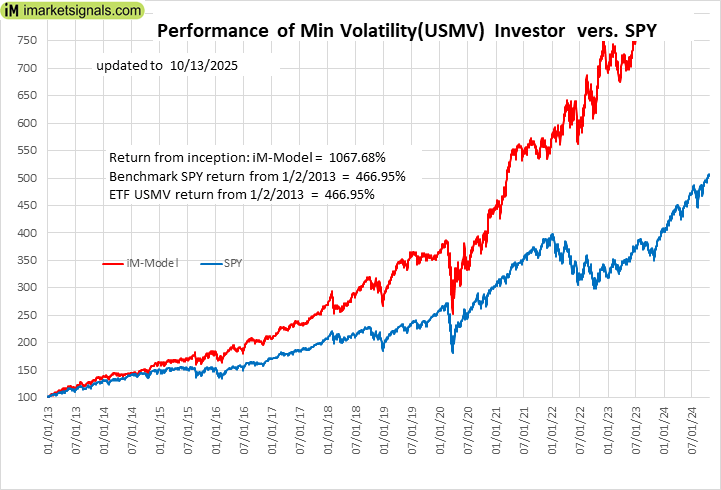 |
iM-Min Volatility(USMV) Investor (Tax Efficient): The model’s out of sample performance YTD is 20.8%, and for the last 12 months is 11.7%. Over the same period the benchmark SPY performance was 14.1% and 15.8% respectively. Since inception, on 1/3/2013, the model gained 1067.68% while the benchmark SPY gained 466.95% and the ETF USMV gained 466.95% over the same period. Over the previous week the market value of iM-Best12(USMV)Q1 gained -2.27% at a time when SPY gained -1.28%. A starting capital of $100,000 at inception on 1/3/2013 would have grown to $1,167,684 which includes -$1,876 cash and excludes $14,578 spent on fees and slippage. |
 |
iM-Bond Market Trader (High-Yield Bond or 10-yr Treasury Bond): The model’s out of sample performance YTD is 6.2%, and for the last 12 months is 4.3%. Over the same period the benchmark BND performance was 6.9% and 5.1% respectively. Over the previous week the market value of the iM-Bond Market Trader (High-Yield Bond or 10-yr Treasury Bond) gained 0.87% at a time when BND gained 0.68%. A starting capital of $10,000 at inception on 1/3/2000 would have grown to $148,938 which includes $104 cash and excludes $2,855 spent on fees and slippage. |
|
|
iM-ModSum/YieldCurve Timer: The model’s out of sample performance YTD is 19.2%, and for the last 12 months is 22.6%. Over the same period the benchmark SPY performance was 14.1% and 15.8% respectively. Over the previous week the market value of iM-PortSum/YieldCurve Timer gained 0.87% at a time when SPY gained -1.28%. A starting capital of $100,000 at inception on 1/1/2016 would have grown to $382,557 which includes $1,019 cash and excludes $2,213 spent on fees and slippage. |
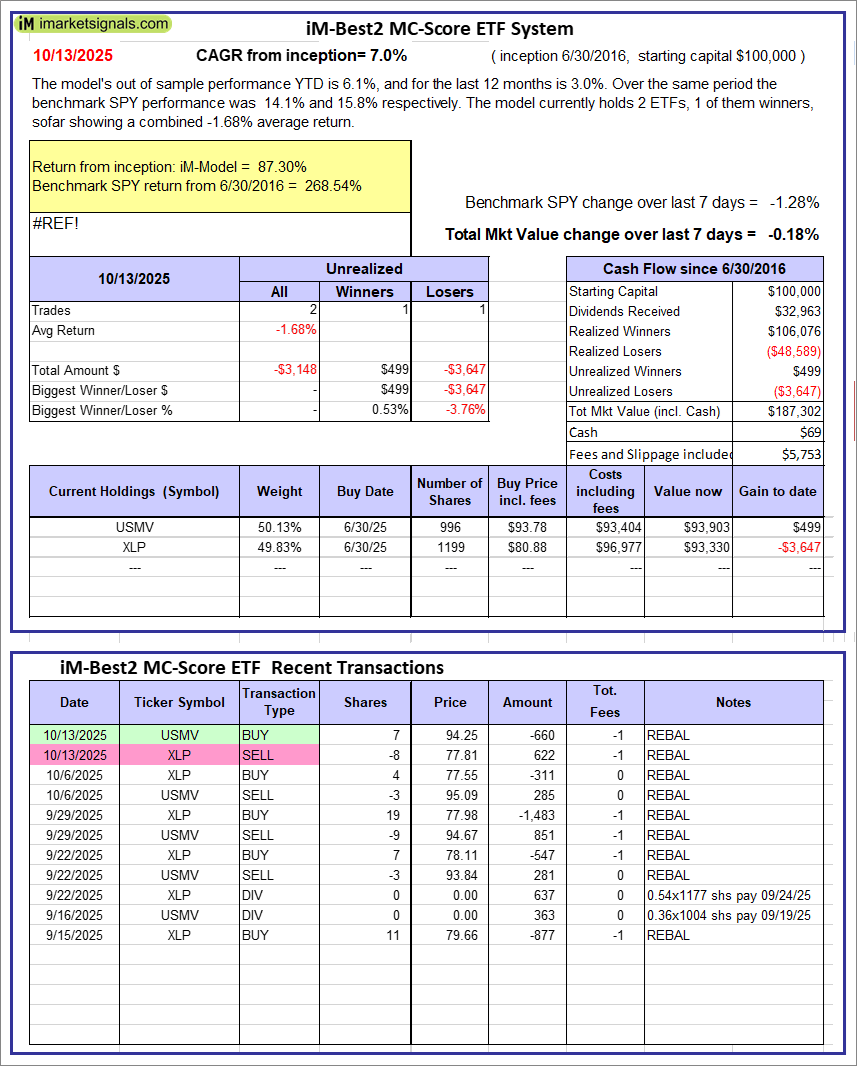 |
iM-Best2 MC-Score ETF System: The model’s out of sample performance YTD is 6.1%, and for the last 12 months is 3.0%. Over the same period the benchmark SPY performance was 14.1% and 15.8% respectively. Over the previous week the market value of the iM-Best2 MC-Score ETF System gained -0.18% at a time when SPY gained -1.28%. A starting capital of $100,000 at inception on 6/30/2016 would have grown to $187,302 which includes $69 cash and excludes $5,753 spent on fees and slippage. |
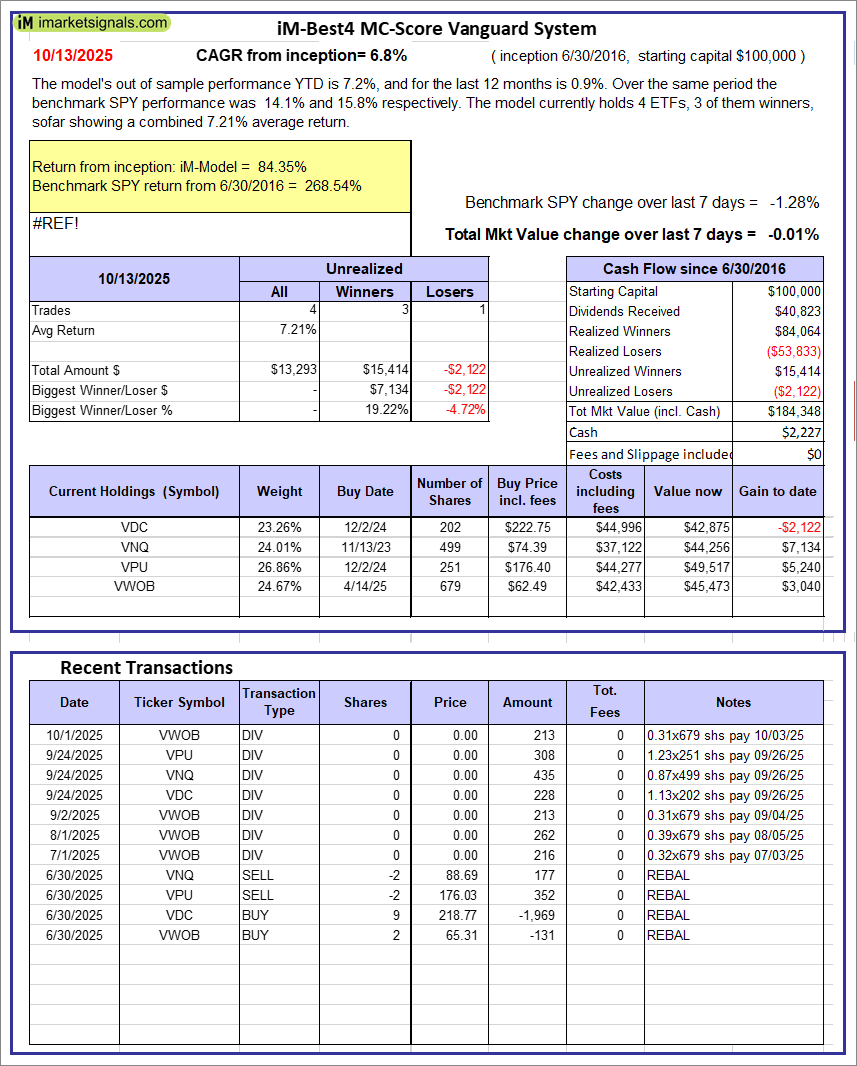 |
iM-Best4 MC-Score Vanguard System: The model’s out of sample performance YTD is 7.2%, and for the last 12 months is 0.9%. Over the same period the benchmark SPY performance was 14.1% and 15.8% respectively. Over the previous week the market value of the iM-Best4 MC-Score Vanguard System gained -0.01% at a time when SPY gained -1.28%. A starting capital of $100,000 at inception on 6/30/2016 would have grown to $184,348 which includes $2,227 cash and excludes $00 spent on fees and slippage. |
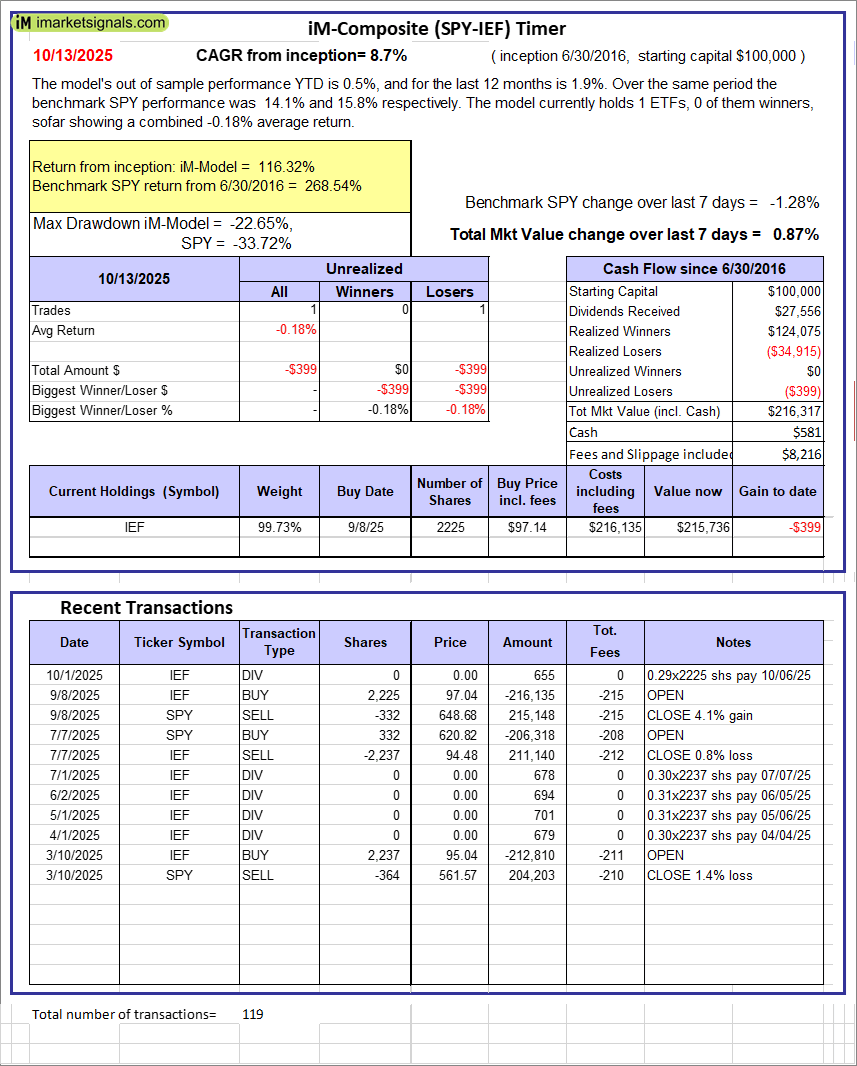 |
iM-Composite (SPY-IEF) Timer: The model’s out of sample performance YTD is 0.5%, and for the last 12 months is 1.9%. Over the same period the benchmark SPY performance was 14.1% and 15.8% respectively. Over the previous week the market value of the iM-Composite (SPY-IEF) Timer gained 0.87% at a time when SPY gained -1.28%. A starting capital of $100,000 at inception on 6/30/2016 would have grown to $216,317 which includes $581 cash and excludes $8,216 spent on fees and slippage. |
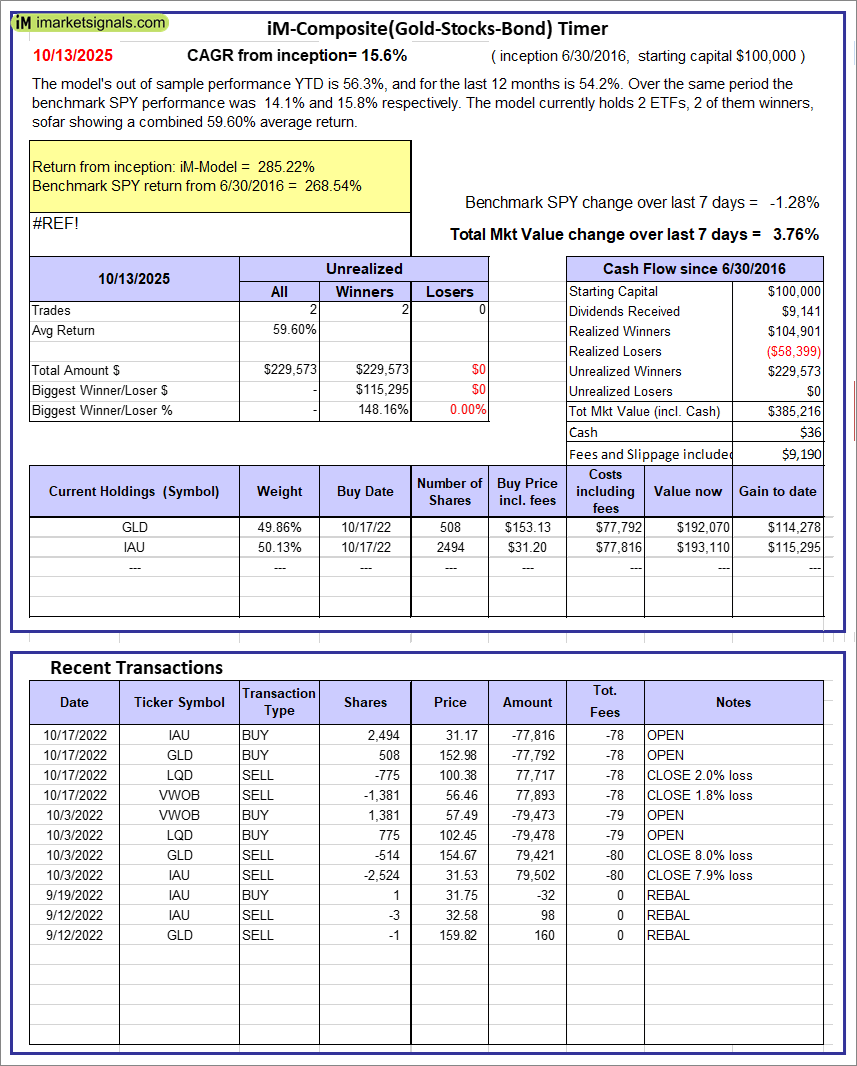 |
iM-Composite(Gold-Stocks-Bond) Timer: The model’s out of sample performance YTD is 56.3%, and for the last 12 months is 54.2%. Over the same period the benchmark SPY performance was 14.1% and 15.8% respectively. Over the previous week the market value of the iM-Composite(Gold-Stocks-Bond) Timer gained 3.76% at a time when SPY gained -1.28%. A starting capital of $100,000 at inception on 6/30/2016 would have grown to $385,216 which includes $36 cash and excludes $9,190 spent on fees and slippage. |
iM-Best Reports – 10/13/2025
Posted in pmp SPY-SH
Leave a Reply
You must be logged in to post a comment.