
  |
Out of sample performance summary of our models for the past 1, 2, 4 and 13 week periods. The active active return indicates how the models over- or underperformed the benchmark ETF SPY. Also the YTD, and the 1-, 3-, 5- and 10-year annualized returns are shown in the second table |
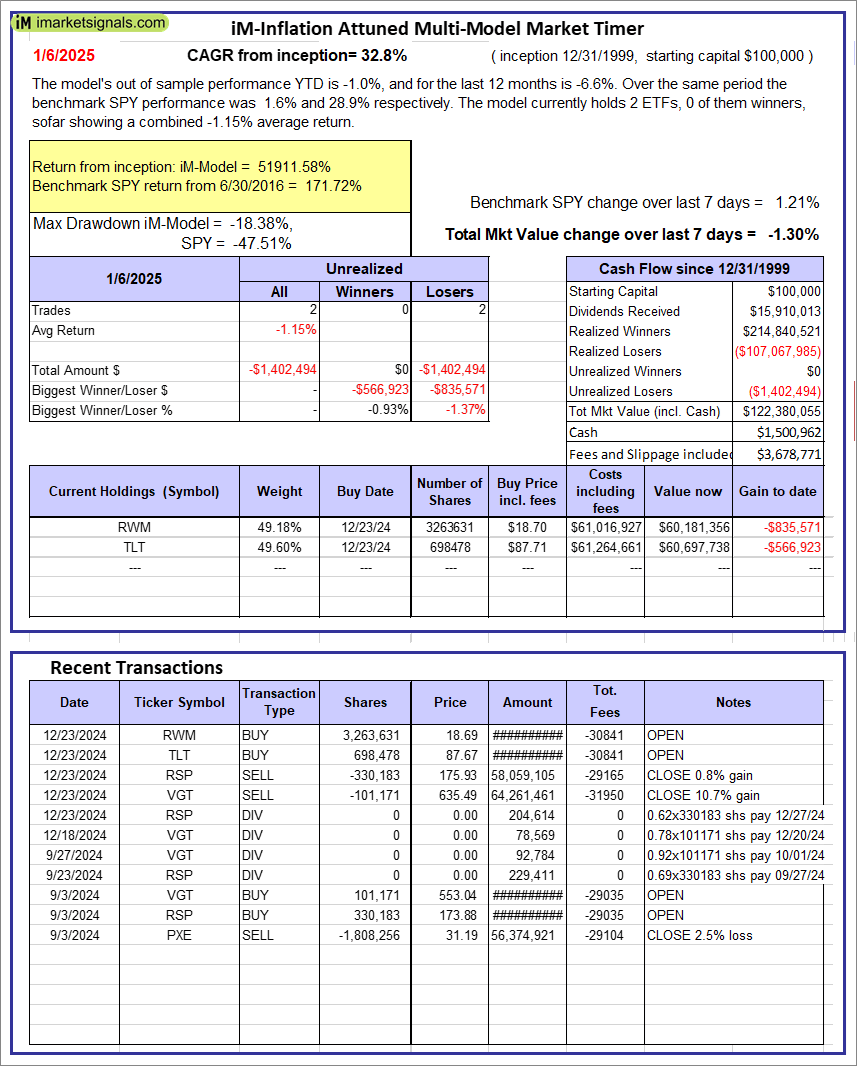 |
iM-Inflation Attuned Multi-Model Market Timer: The model’s out of sample performance YTD is -1.0%, and for the last 12 months is -6.6%. Over the same period the benchmark SPY performance was 1.6% and 28.9% respectively. Over the previous week the market value of the iM-Inflation Attuned Multi-Model Market Timer gained -1.30% at a time when SPY gained 1.21%. A starting capital of $100,000 at inception on 3/24/2017 would have grown to $122,380,055 which includes $1,500,962 cash and excludes $3,678,771 spent on fees and slippage. |
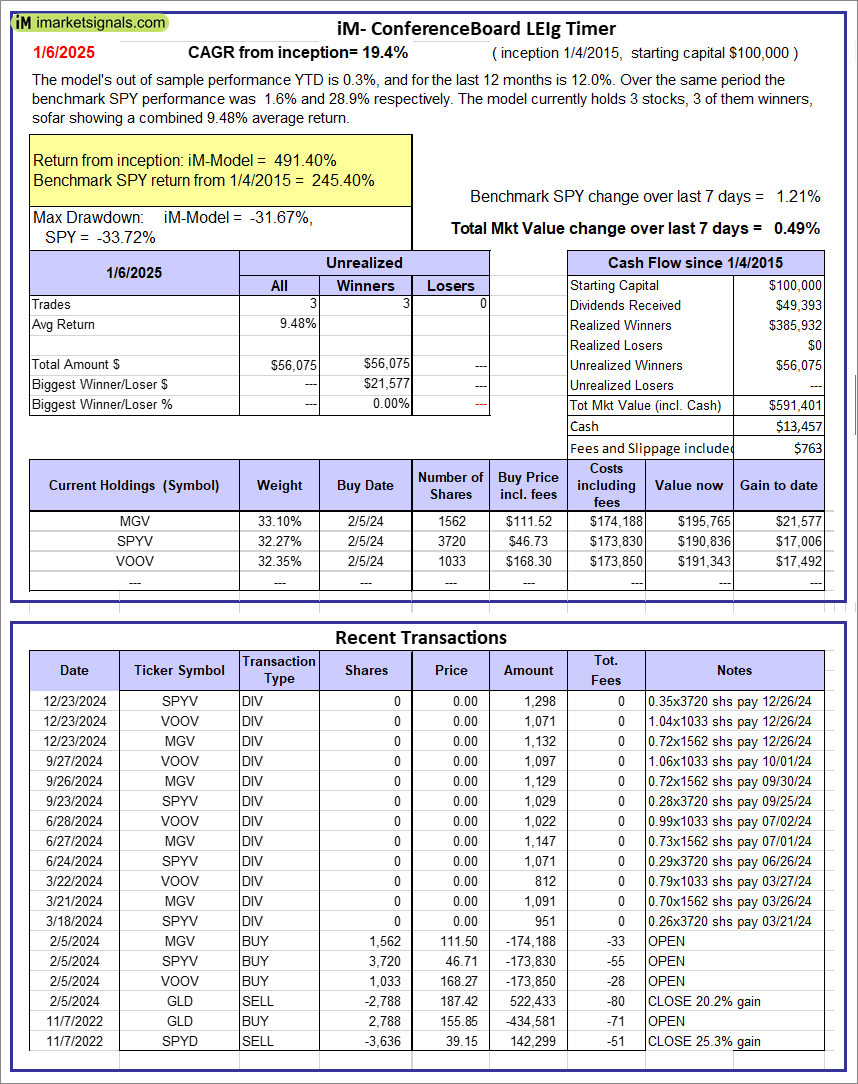 |
iM-Conference Board LEIg Timer: The model’s performance YTD is 14.3%, and for the last 12 months is 7.3%. Over the same period the benchmark SPY performance was 20.1% and 9.4% respectively. Over the previous week the market value of the iM-Conference Board LEIg Timer gained 0.49% at a time when SPY gained 1.21%. A starting capital of $100,000 at inception on 4/5/2017 would have grown to $591,401 which includes $13,457 cash and excludes $763 spent on fees and slippage. |
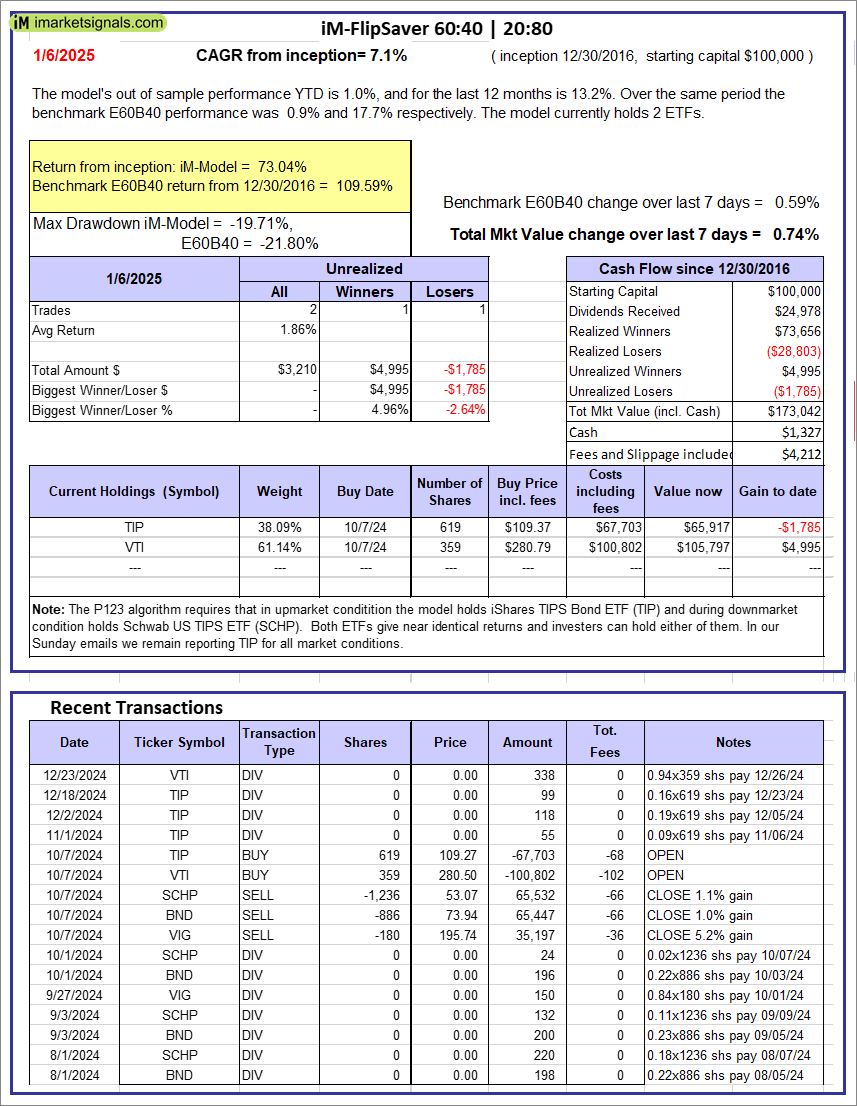 |
iM-FlipSaver 60:40 | 20:80 – 2017: The model’s out of sample performance YTD is 1.0%, and for the last 12 months is 13.2%. Over the same period the benchmark E60B40 performance was 0.9% and 17.7% respectively. Over the previous week the market value of iM-FlipSaver 80:20 | 20:80 gained 0.74% at a time when SPY gained 0.59%. A starting capital of $100,000 at inception on 7/16/2015 would have grown to $173,042 which includes $1,327 cash and excludes $4,212 spent on fees and slippage. |
 |
iM-FlipSaver 70:30 | 20:80 – 2017: The model’s out of sample performance YTD is 1.2%, and for the last 12 months is 14.9%. Over the same period the benchmark E60B40 performance was 0.9% and 17.7% respectively. Over the previous week the market value of iM-FlipSaver 70:30 | 20:80 gained 0.89% at a time when SPY gained 0.59%. A starting capital of $100,000 at inception on 7/15/2015 would have grown to $181,630 which includes $1,198 cash and excludes $4,426 spent on fees and slippage. |
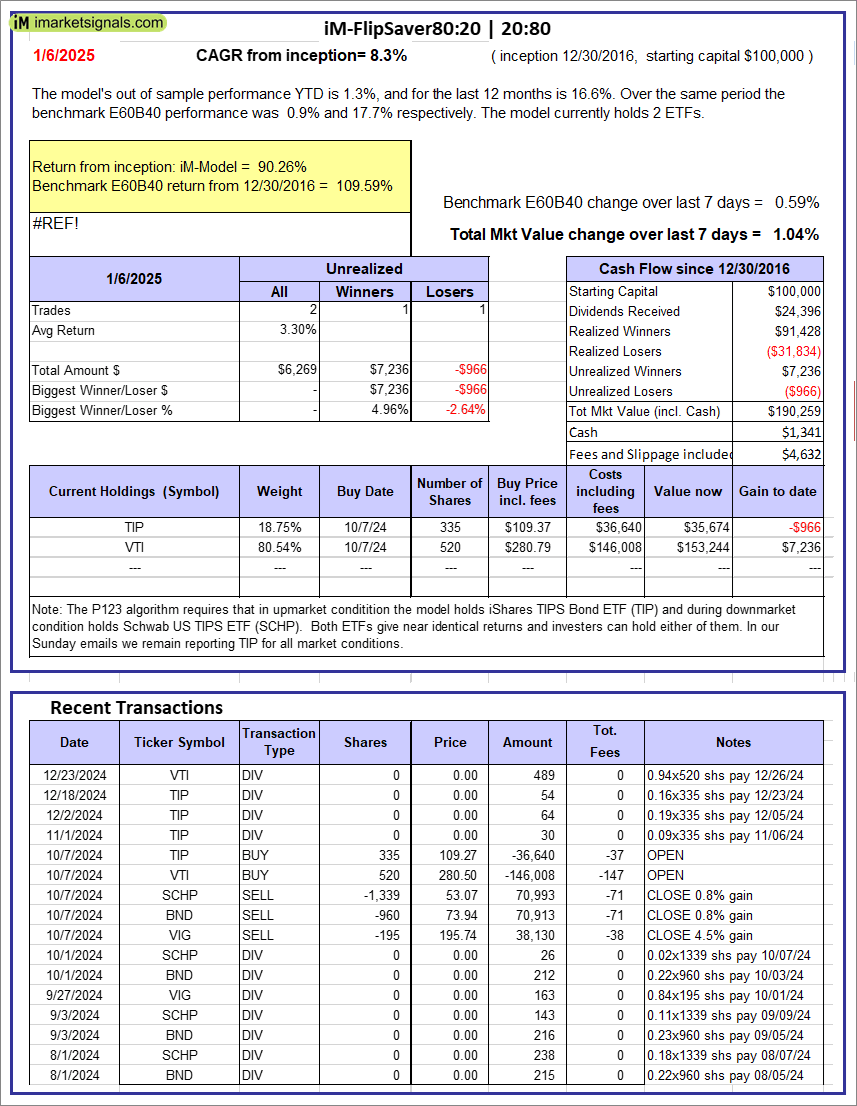 |
iM-FlipSaver 80:20 | 20:80 – 2017: The model’s out of sample performance YTD is 1.3%, and for the last 12 months is 16.6%. Over the same period the benchmark E60B40 performance was 0.9% and 17.7% respectively. Over the previous week the market value of iM-FlipSaver 80:20 | 20:80 gained 1.04% at a time when SPY gained 0.59%. A starting capital of $100,000 at inception on 1/2/2017 would have grown to $190,259 which includes $1,341 cash and excludes $4,632 spent on fees and slippage. |
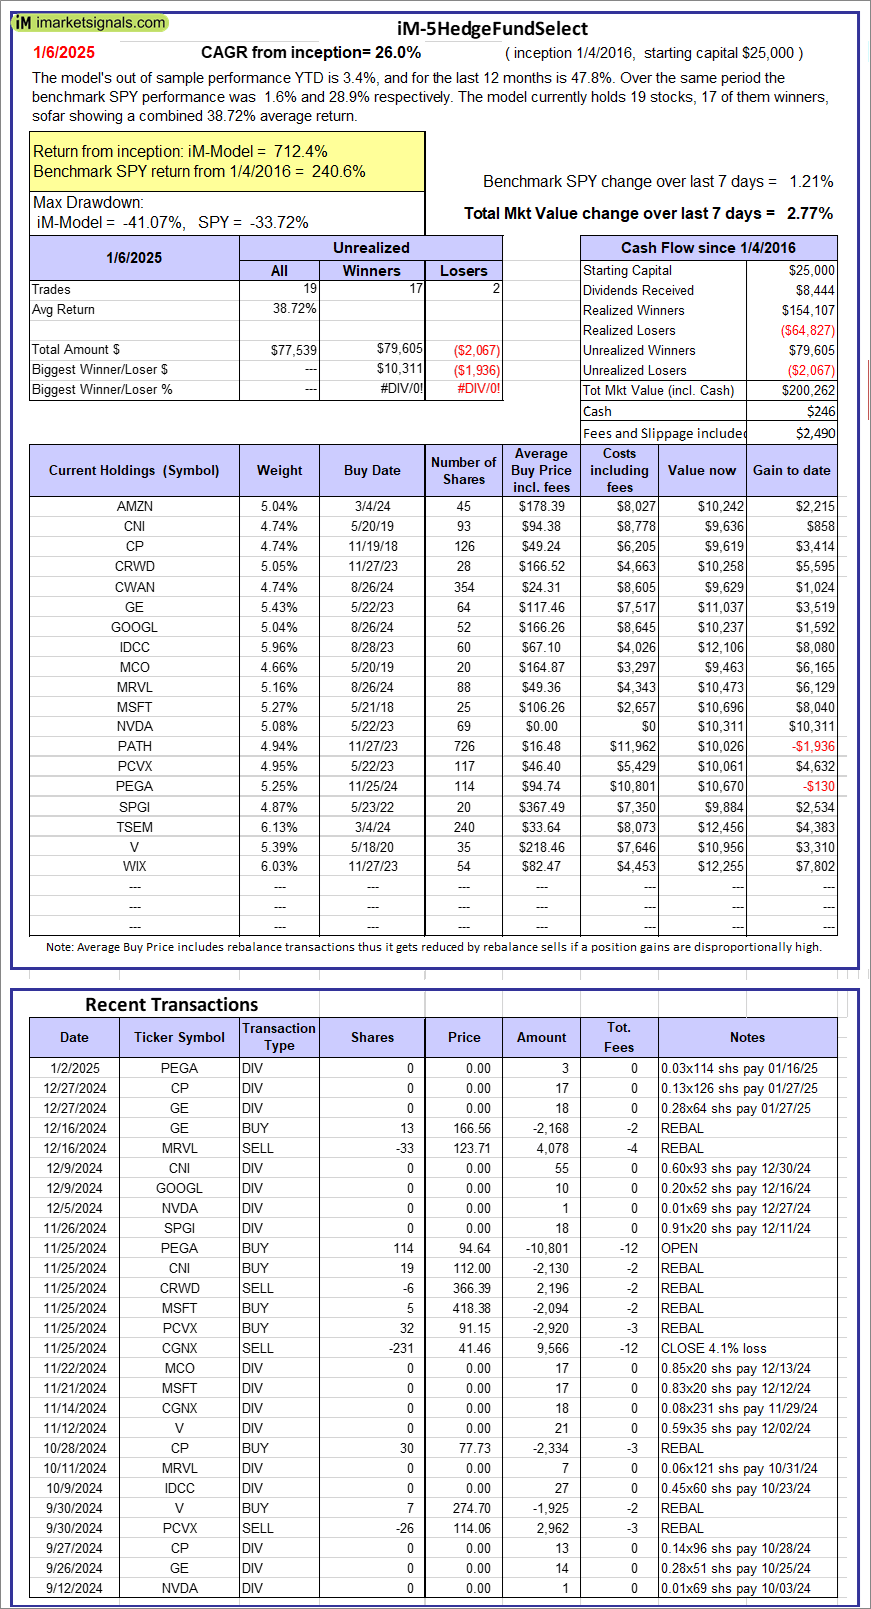  |
iM-5HedgeFundSelect: Since inception, on 1/5/2016, the model gained 712.35% while the benchmark SPY gained 240.56% over the same period. Over the previous week the market value of iM-5HedgeFundSelect gained 2.77% at a time when SPY gained 1.21%. A starting capital of $25,000 at inception on 1/5/2016 would have grown to $200,262 which includes $246 cash and excludes $2,490 spent on fees and slippage. |
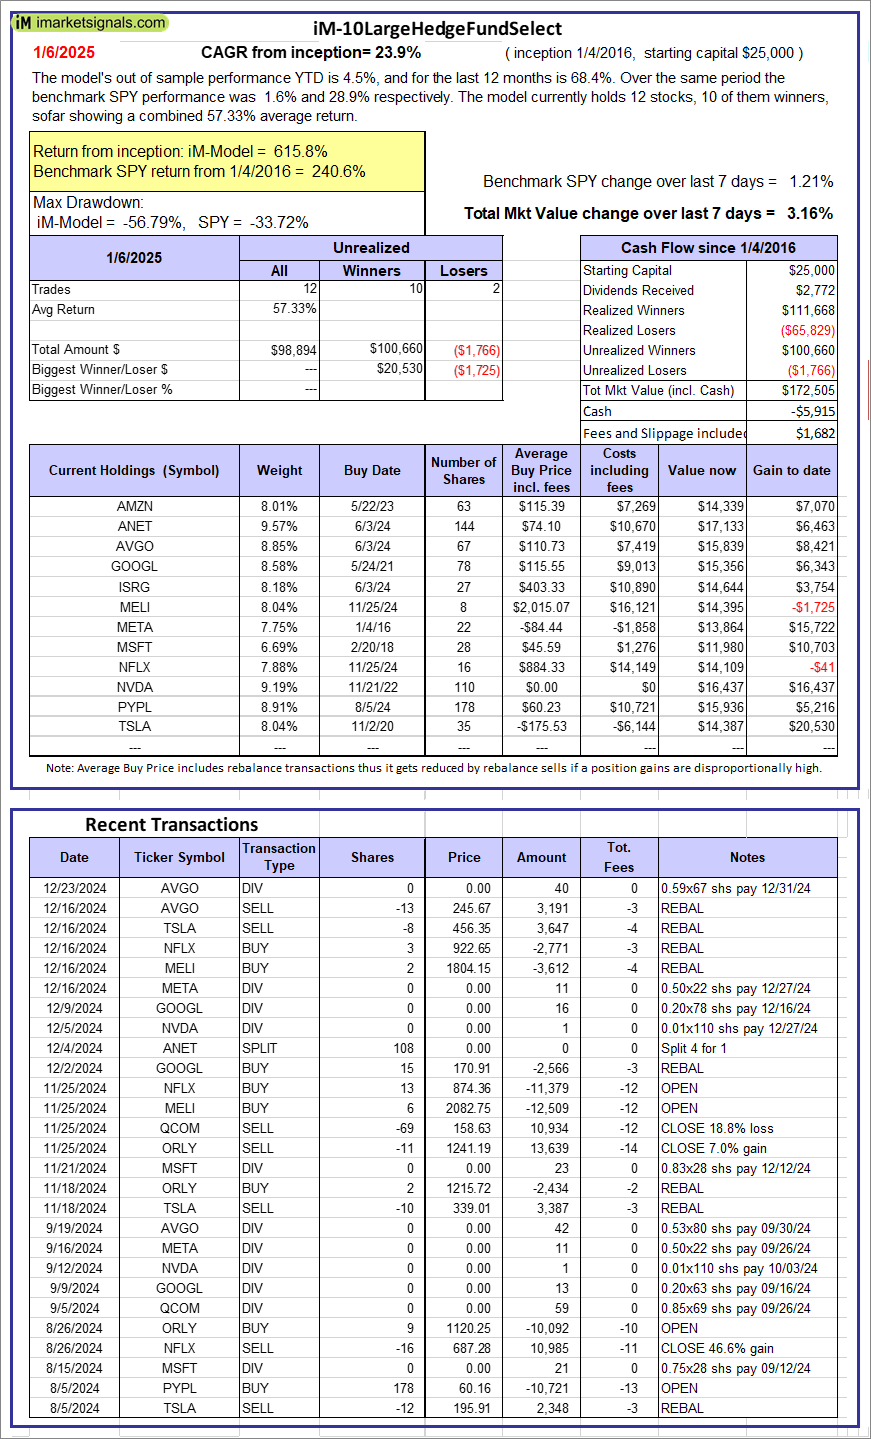  |
iM-10LargeHedgeFundSelect: Since inception, on 1/5/2016, the model gained 615.82% while the benchmark SPY gained 240.56% over the same period. Over the previous week the market value of iM-10LargeHedgeFundSelect gained 3.16% at a time when SPY gained 1.21%. A starting capital of $25,000 at inception on 1/5/2016 would have grown to $172,505 which includes -$5,915 cash and excludes $1,682 spent on fees and slippage. |
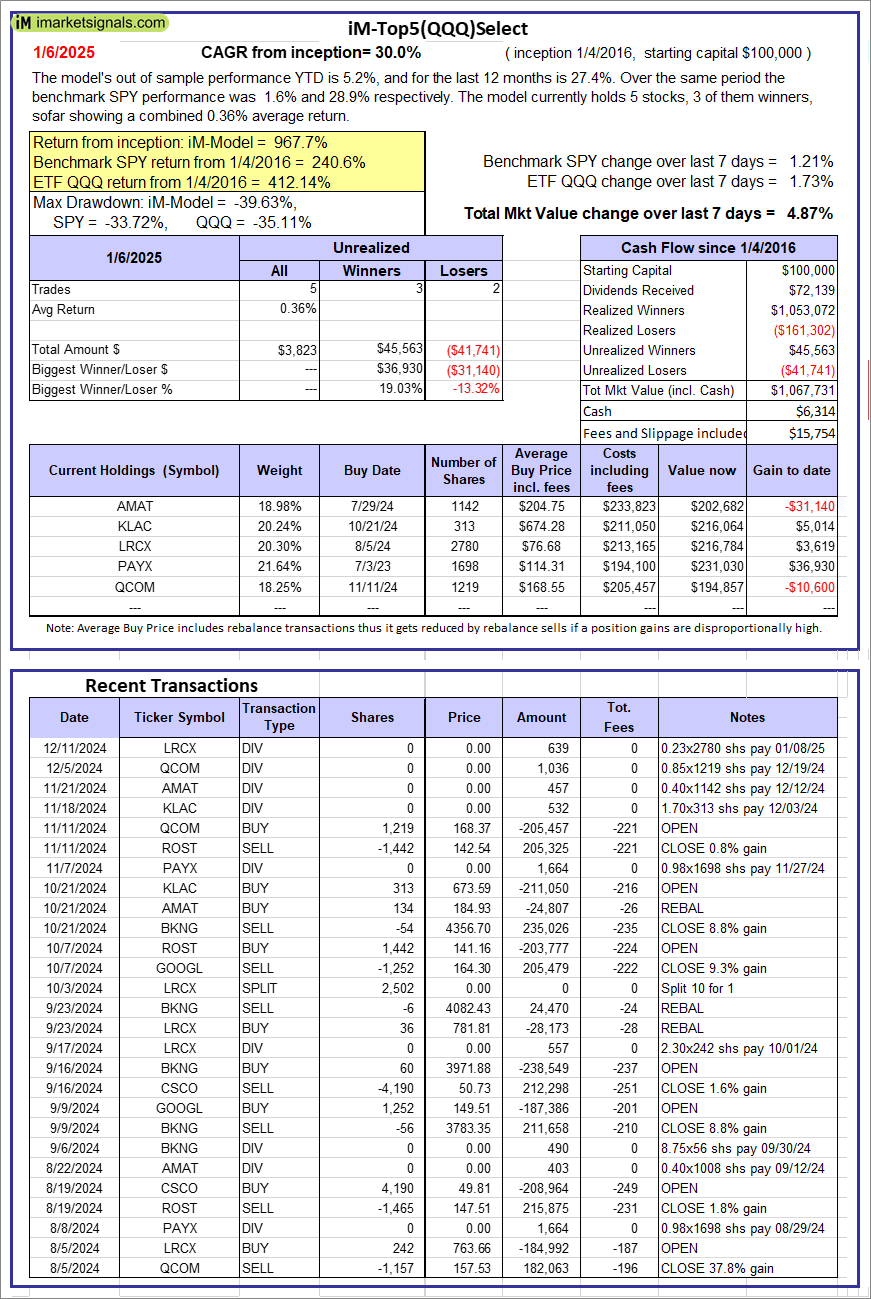  |
iM-Top5(QQQ)Select: Since inception, on 1/5/2016, the model gained 967.73% while the benchmark SPY gained 240.56% over the same period. Over the previous week the market value of iM-Top5(QQQ)Select gained 4.87% at a time when SPY gained 1.21%. A starting capital of $100,000 at inception on 1/5/2016 would have grown to $1,067,731 which includes $6,314 cash and excludes $15,754 spent on fees and slippage. |
  |
iM-Top5(XLB)Select: Since inception, on 1/5/2016, the model gained 183.60% while the benchmark SPY gained 240.56% over the same period. Over the previous week the market value of iM-Top5(XLB)Select gained 2.56% at a time when SPY gained 1.21%. A starting capital of $100,000 at inception on 1/5/2016 would have grown to $283,598 which includes $1,149 cash and excludes $14,365 spent on fees and slippage. |
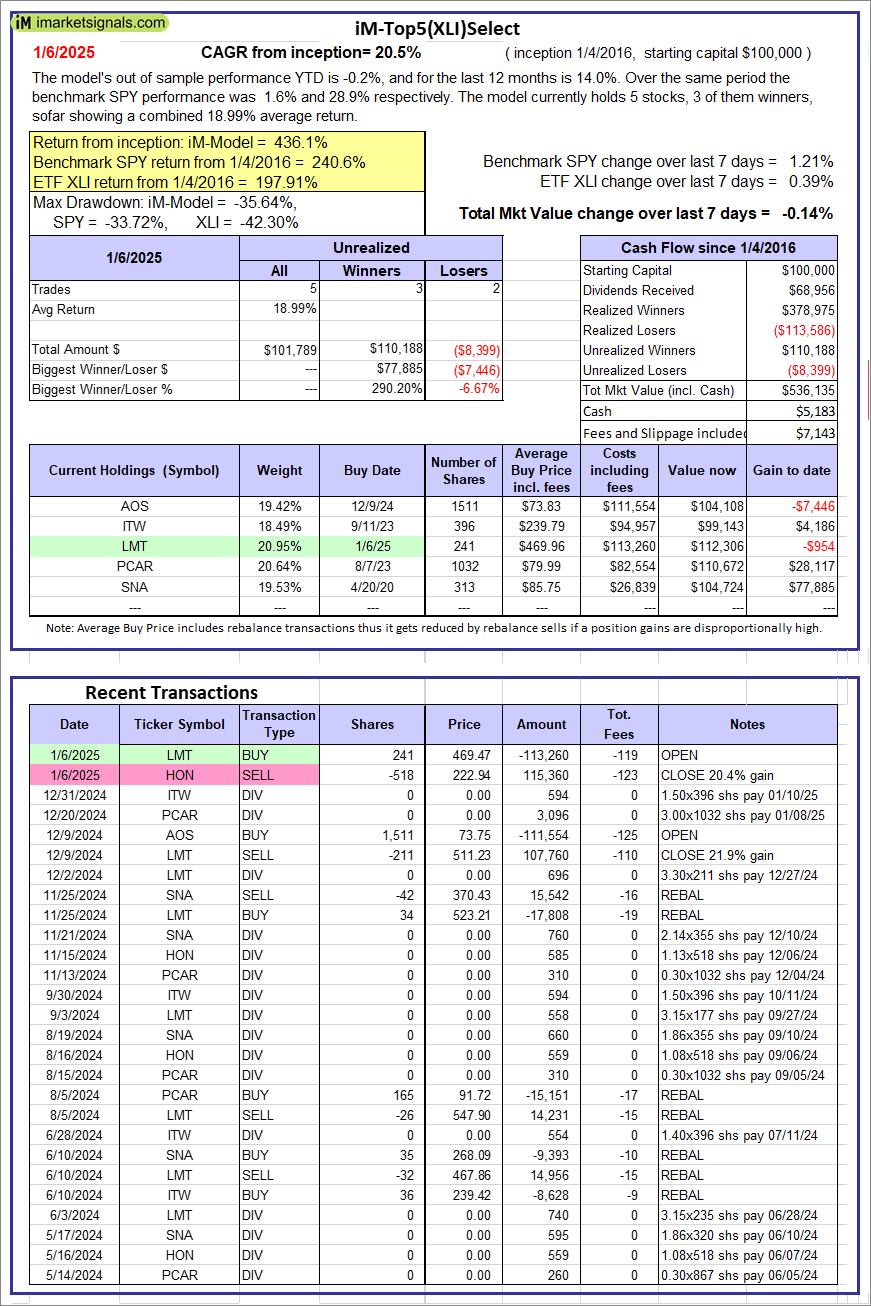  |
iM-Top5(XLI)Select: Since inception, on 1/5/2016, the model gained 436.13% while the benchmark SPY gained 240.56% over the same period. Over the previous week the market value of iM-Top5(XLI)Select gained -0.14% at a time when SPY gained 1.21%. A starting capital of $100,000 at inception on 1/5/2016 would have grown to $536,135 which includes $5,183 cash and excludes $7,143 spent on fees and slippage. |
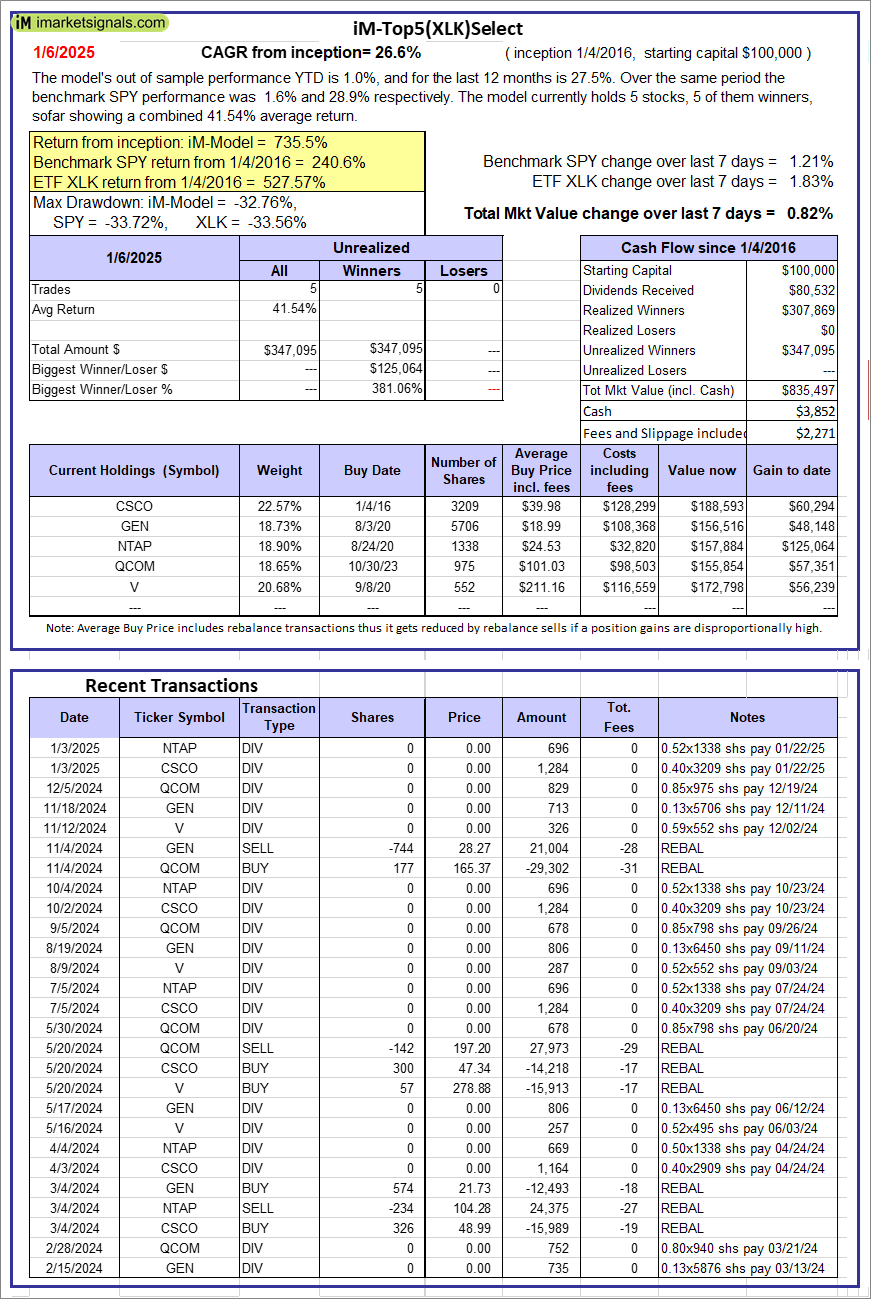  |
iM-Top5(XLK)Select: Since inception, on 1/5/2016, the model gained 735.50% while the benchmark SPY gained 240.56% over the same period. Over the previous week the market value of iM-Top5(XLK)Select gained 0.82% at a time when SPY gained 1.21%. A starting capital of $100,000 at inception on 1/5/2016 would have grown to $835,497 which includes $3,852 cash and excludes $2,271 spent on fees and slippage. |
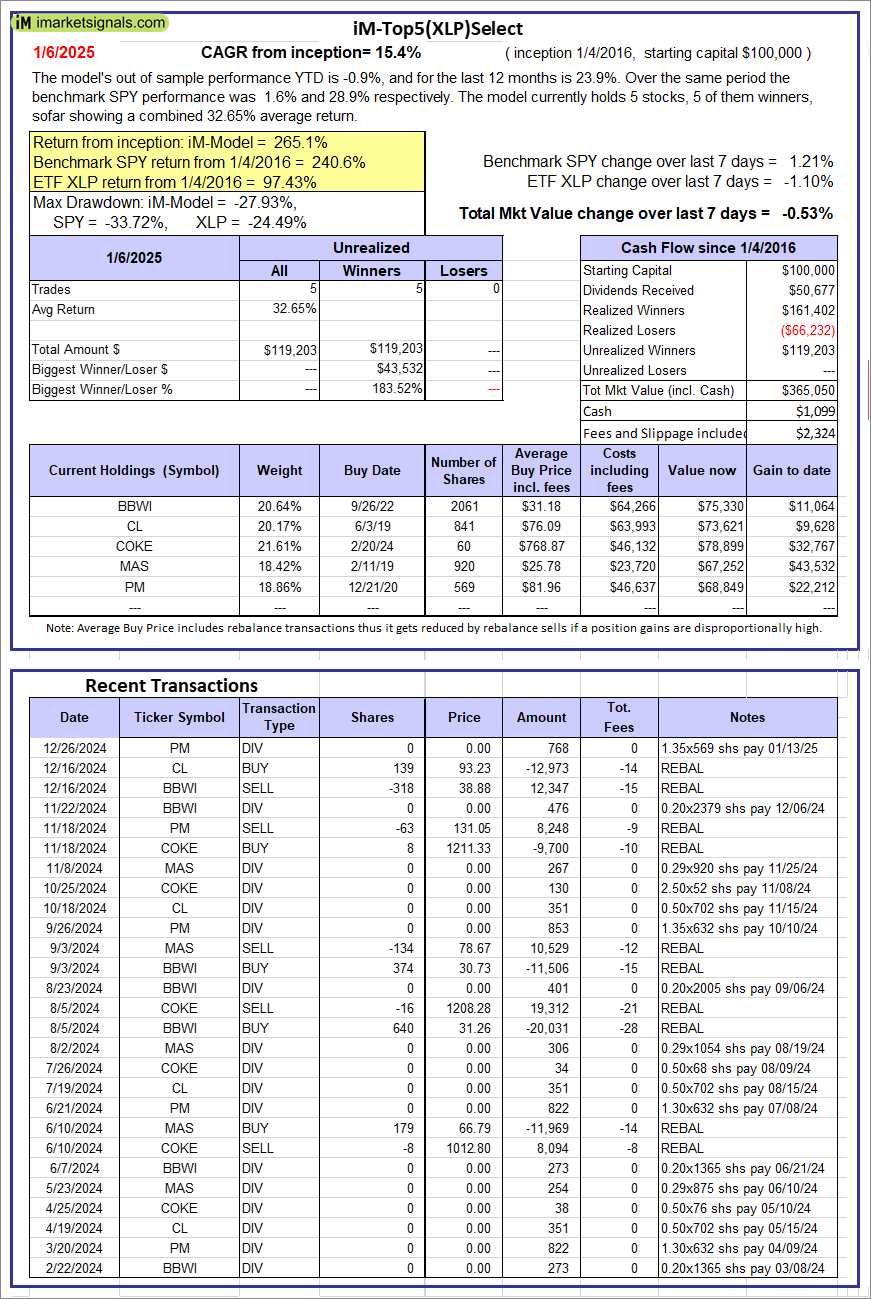  |
iM-Top5(XLP)Select: Since inception, on 1/5/2016, the model gained 265.05% while the benchmark SPY gained 240.56% over the same period. Over the previous week the market value of iM-Top5(XLP)Select gained -0.53% at a time when SPY gained 1.21%. A starting capital of $100,000 at inception on 1/5/2016 would have grown to $365,050 which includes $1,099 cash and excludes $2,324 spent on fees and slippage. |
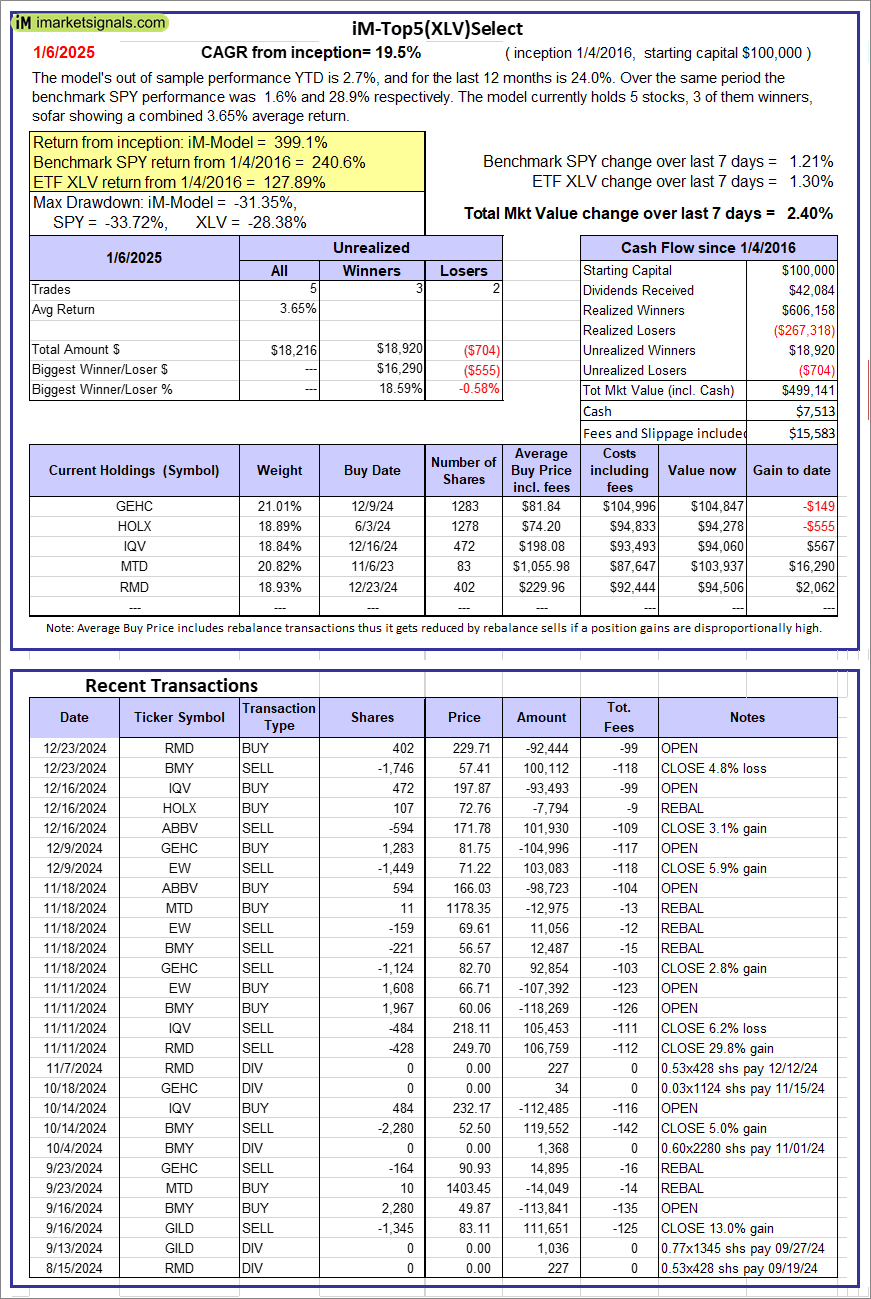  |
iM-Top5(XLV)Select: Since inception, on 1/5/2016, the model gained 399.14% while the benchmark SPY gained 240.56% over the same period. Over the previous week the market value of iM-Top5(XLV)Select gained 2.40% at a time when SPY gained 1.21%. A starting capital of $100,000 at inception on 1/5/2016 would have grown to $499,141 which includes $7,513 cash and excludes $15,583 spent on fees and slippage. |
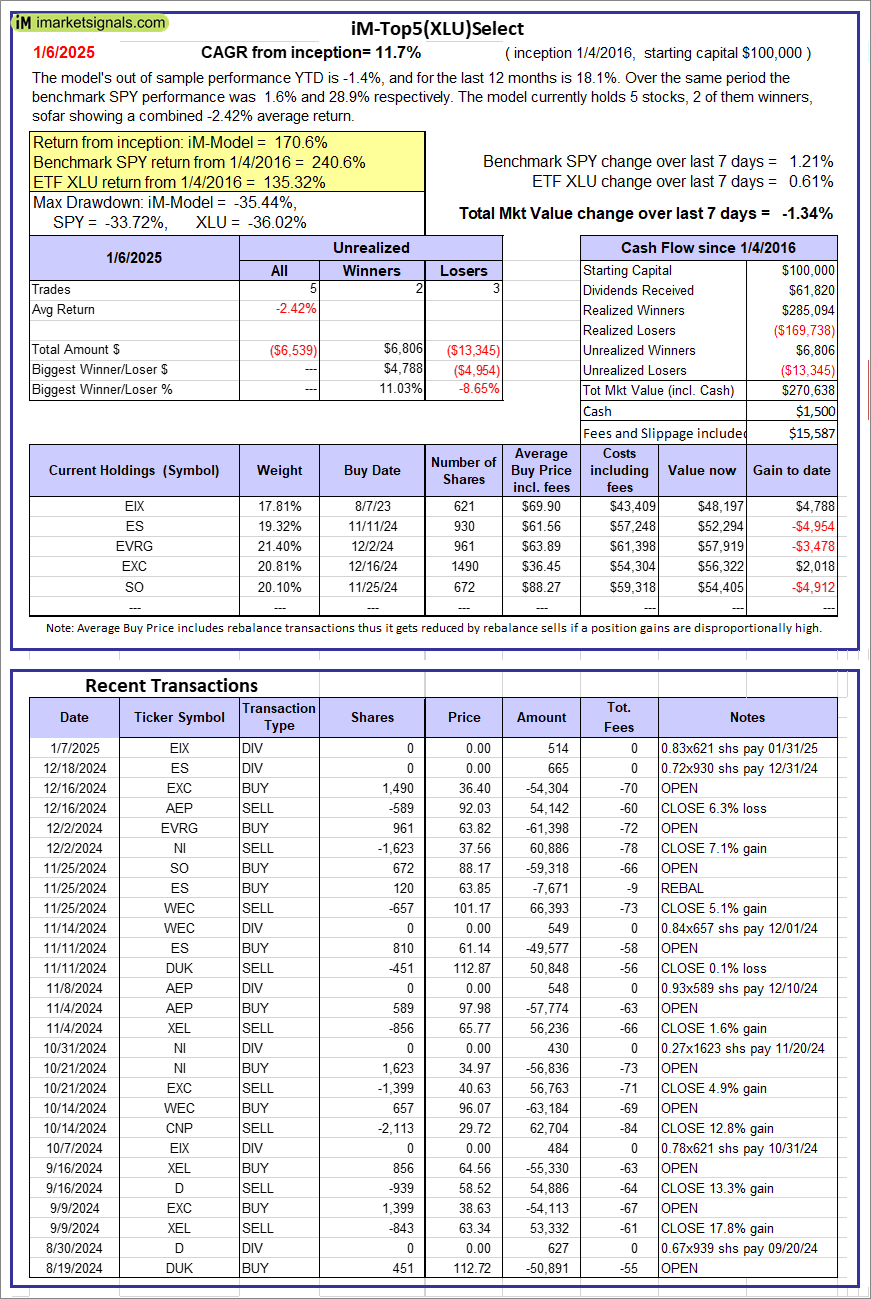  |
iM-Top5(XLU)Select: Since inception, on 1/5/2016, the model gained 170.64% while the benchmark SPY gained 240.56% over the same period. Over the previous week the market value of iM-Top5(XLU)Select gained -1.34% at a time when SPY gained 1.21%. A starting capital of $100,000 at inception on 1/5/2016 would have grown to $270,638 which includes $1,500 cash and excludes $15,587 spent on fees and slippage. |
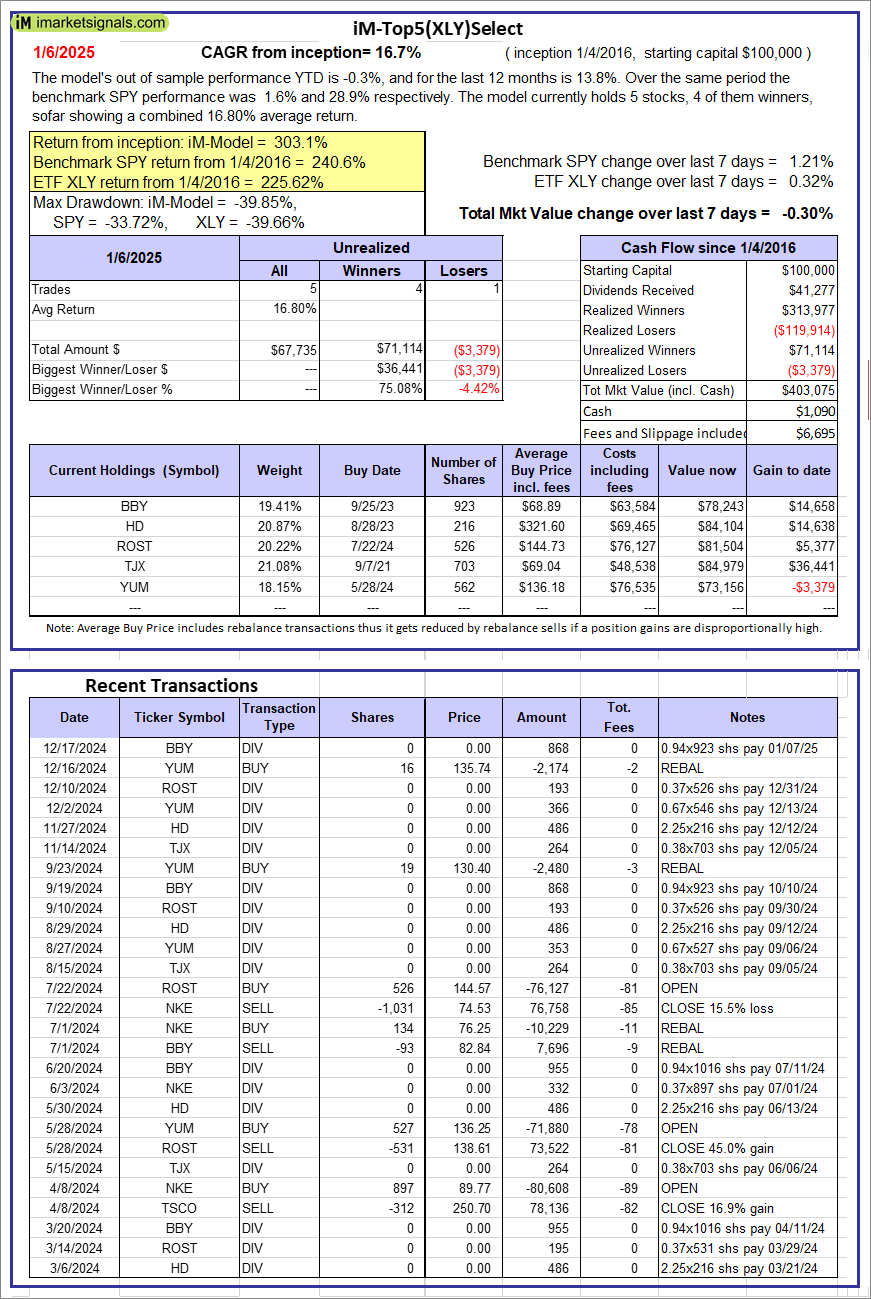  |
iM-Top5(XLY)Select: Since inception, on 1/5/2016, the model gained 303.07% while the benchmark SPY gained 240.56% over the same period. Over the previous week the market value of iM-Top5(XLY)Select gained -0.30% at a time when SPY gained 1.21%. A starting capital of $100,000 at inception on 1/5/2016 would have grown to $403,075 which includes $1,090 cash and excludes $6,695 spent on fees and slippage. |
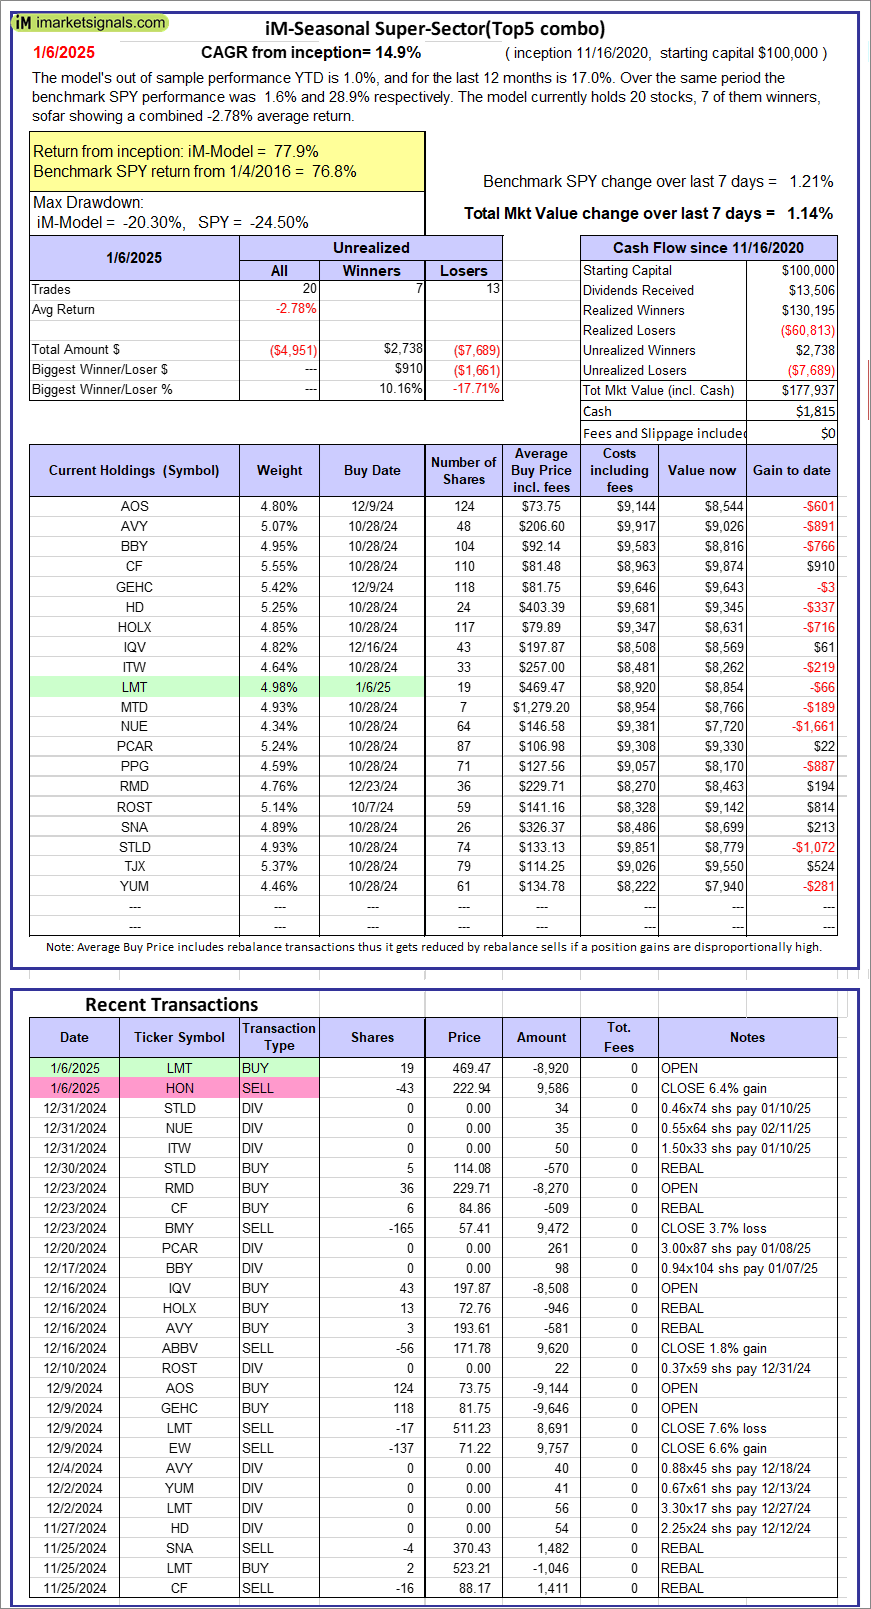 |
iM-Seasonal Super-Sectors (Top5 combo) : Since inception, on 11/17/2020, the model gained 77.94% while the benchmark SPY gained 76.79% over the same period. Over the previous week the market value of iM-Seasonal Super-Sectors (Top5 combo) gained 1.14% at a time when SPY gained 1.21%. A starting capital of $100,000 at inception on 11/17/2020 would have grown to $177,937 which includes $1,815 cash and excludes $00 spent on fees and slippage. |
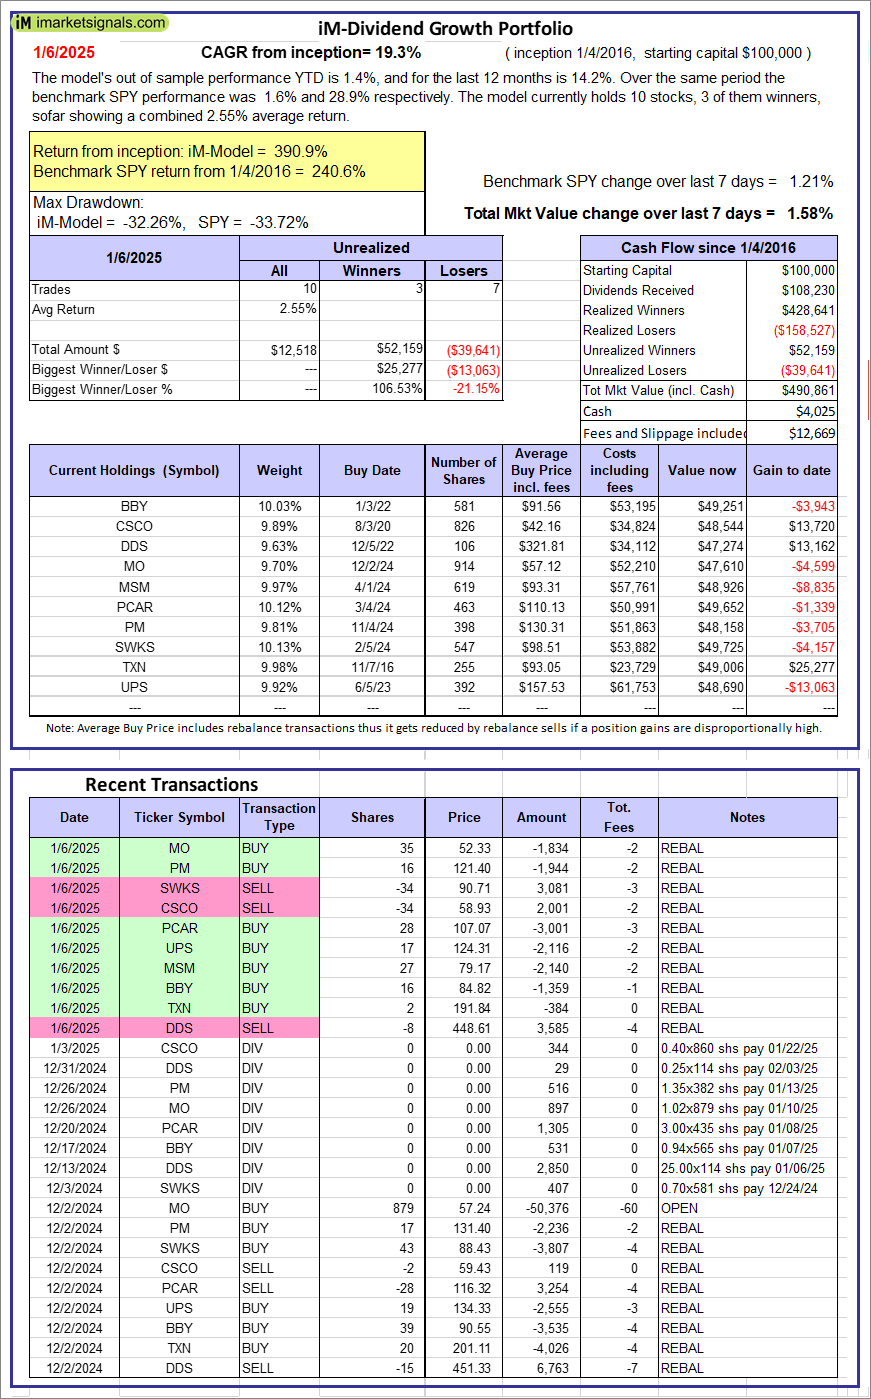 |
iM-Dividend Growth Portfolio: The model’s out of sample performance YTD is 1.4%, and for the last 12 months is 14.2%. Over the same period the benchmark SPY performance was 1.6% and 28.9% respectively. Over the previous week the market value of the iM-Dividend Growth Portfolio gained 1.58% at a time when SPY gained 1.21%. A starting capital of $100,000 at inception on 6/30/2016 would have grown to $490,861 which includes $4,025 cash and excludes $12,669 spent on fees and slippage. |
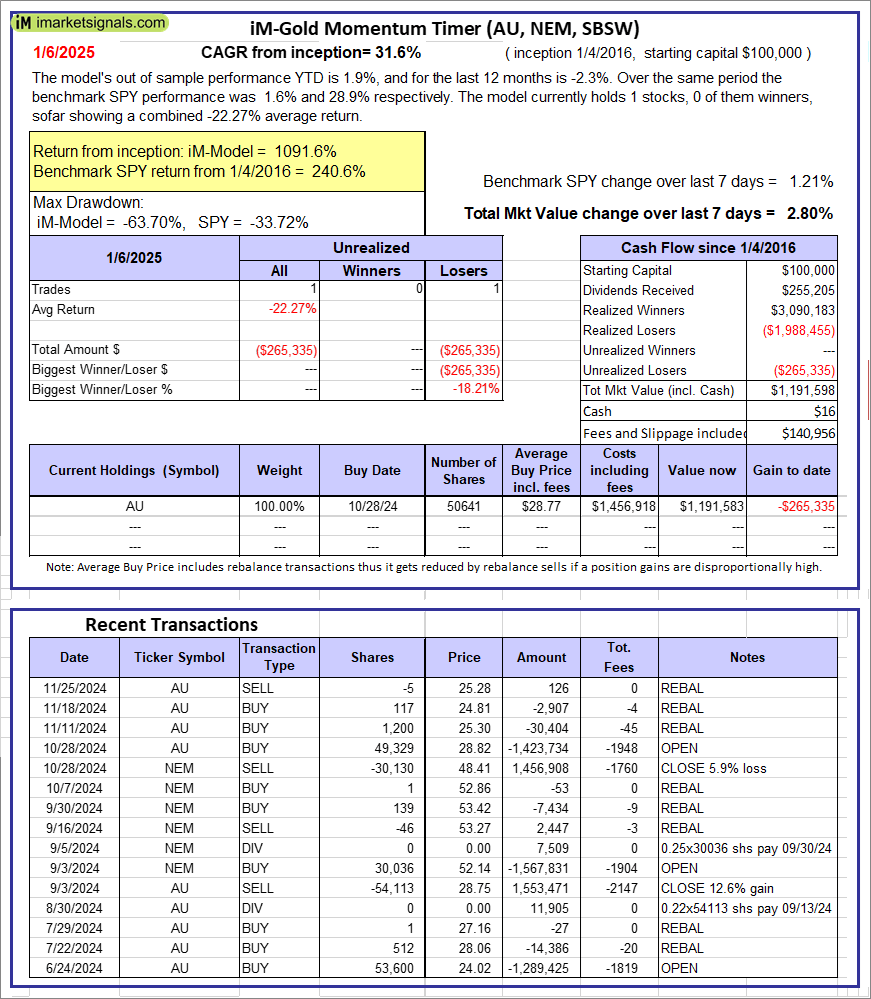 |
iM-Gold Momentum Timer (AU, NEM, SBSW): The model’s out of sample performance YTD is 1.9%, and for the last 12 months is -2.3%. Over the same period the benchmark SPY performance was 1.6% and 28.9% respectively. Over the previous week the market value of iM-Gold Momentum Timer (AU, NEM, SBSW) gained 2.80% at a time when SPY gained 1.21%. A starting capital of $100,000 at inception on 6/30/2016 would have grown to $16 which includes $140,956 cash and excludes Gain to date spent on fees and slippage. |
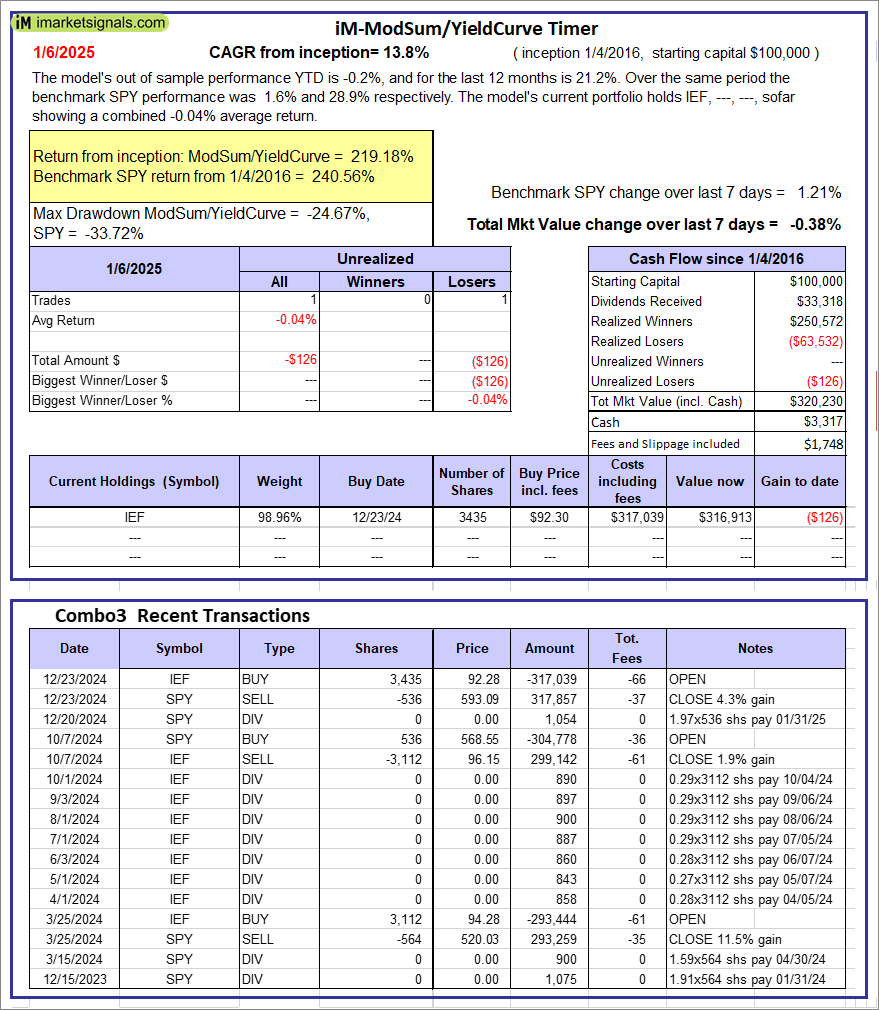 |
iM-ModSum/YieldCurve Timer: The model’s out of sample performance YTD is -0.2%, and for the last 12 months is 21.2%. Over the same period the benchmark SPY performance was 1.6% and 28.9% respectively. Over the previous week the market value of iM-PortSum/YieldCurve Timer gained -0.38% at a time when SPY gained 1.21%. A starting capital of $100,000 at inception on 1/1/2016 would have grown to $320,230 which includes $3,317 cash and excludes $1,748 spent on fees and slippage. |
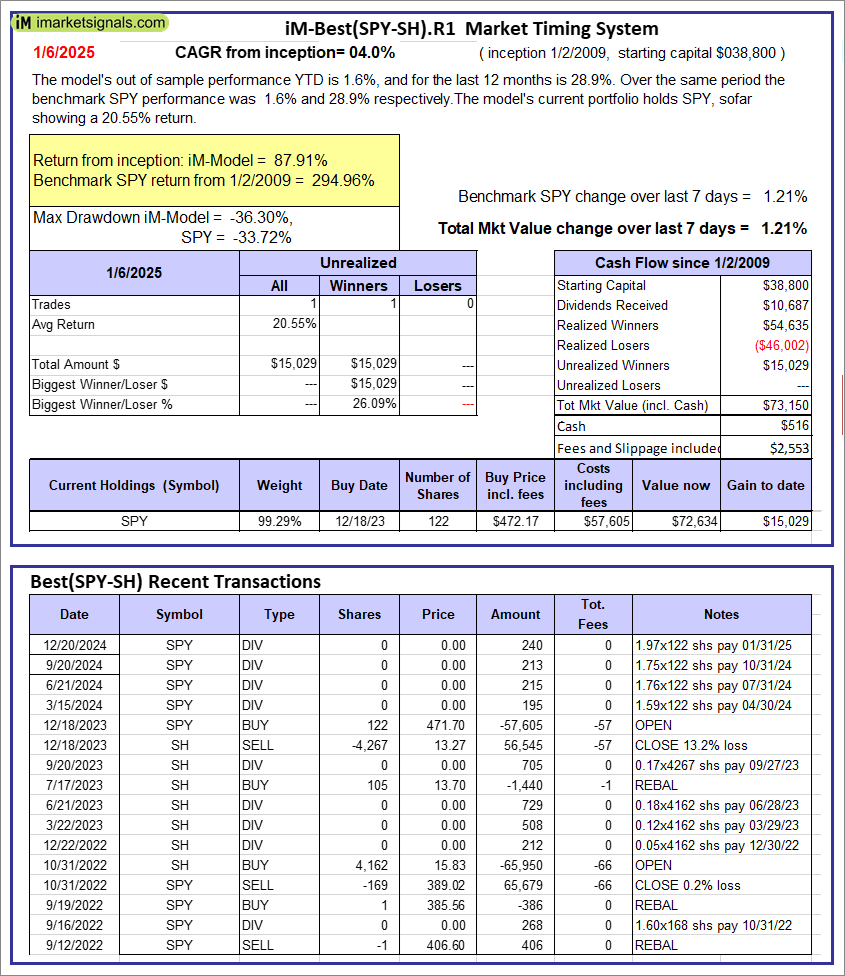 |
iM-Best(SPY-SH).R1: The model’s out of sample performance YTD is 1.6%, and for the last 12 months is 28.9%. Over the same period the benchmark SPY performance was 1.6% and 28.9% respectively. Over the previous week the market value of Best(SPY-SH) gained 1.21% at a time when SPY gained 1.21%. A starting capital of $100,000 at inception on 1/2/2009 would have grown to $73,150 which includes $516 cash and excludes $2,553 spent on fees and slippage. |
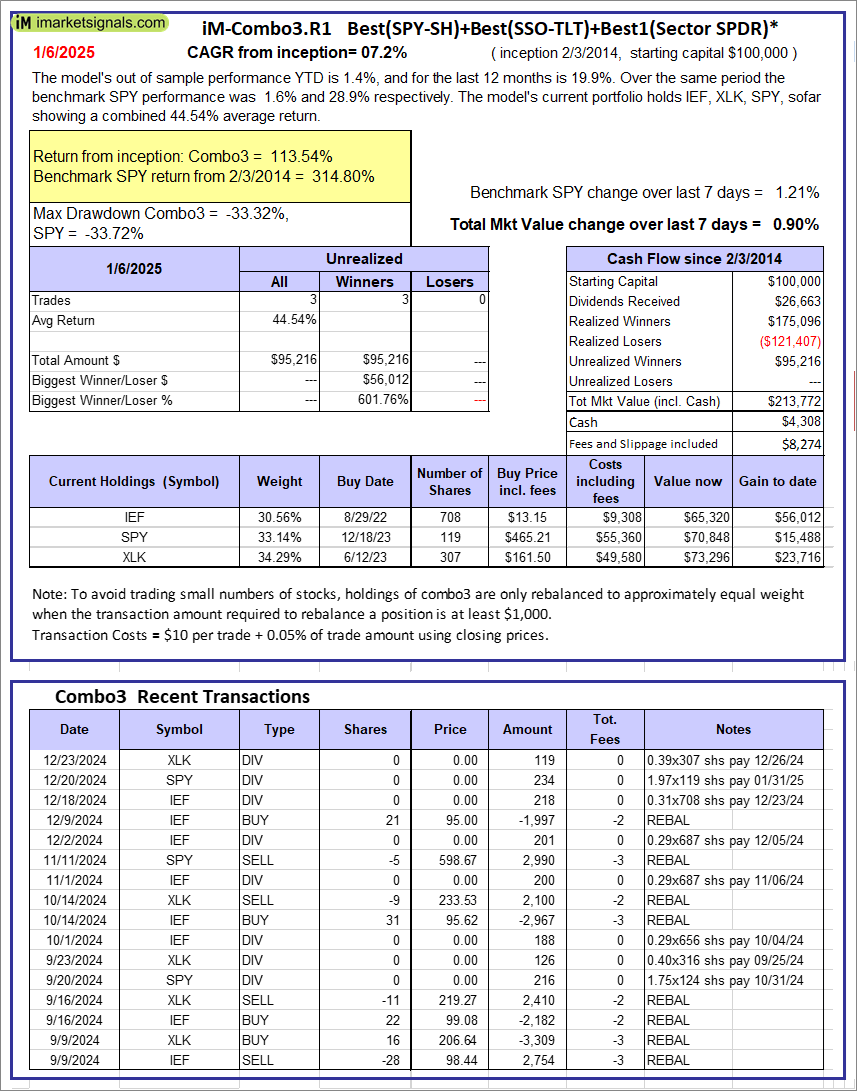 |
iM-Combo3.R1: The model’s out of sample performance YTD is 1.4%, and for the last 12 months is 19.9%. Over the same period the benchmark SPY performance was 1.6% and 28.9% respectively. Over the previous week the market value of iM-Combo3.R1 gained 0.90% at a time when SPY gained 1.21%. A starting capital of $100,000 at inception on 2/3/2014 would have grown to $213,772 which includes $4,308 cash and excludes $8,274 spent on fees and slippage. |
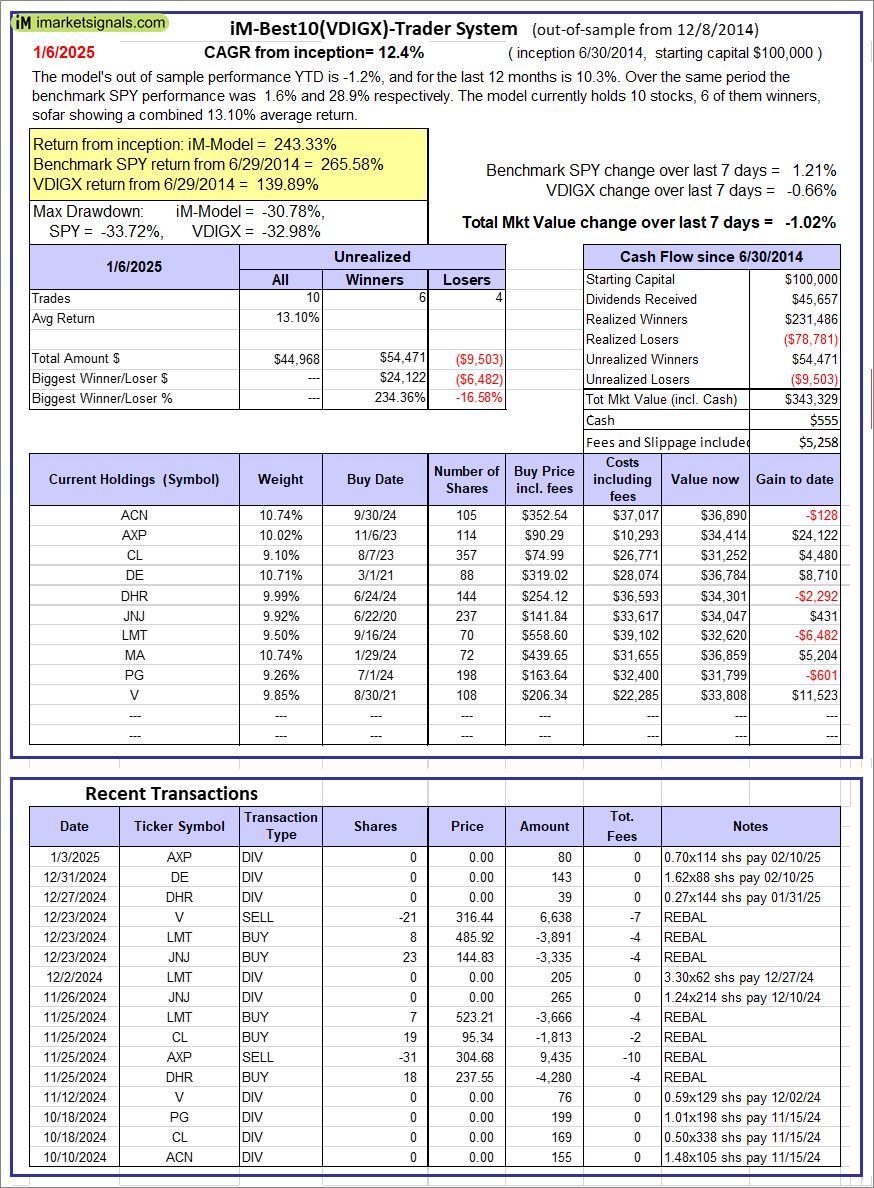  |
iM-Best10(VDIGX)-Trader: The model’s out of sample performance YTD is -1.2%, and for the last 12 months is 10.3%. Over the same period the benchmark SPY performance was 1.6% and 28.9% respectively. Since inception, on 7/1/2014, the model gained 243.33% while the benchmark SPY gained 265.58% and VDIGX gained 139.89% over the same period. Over the previous week the market value of iM-Best10(VDIGX) gained -1.02% at a time when SPY gained 1.21%. A starting capital of $100,000 at inception on 7/1/2014 would have grown to $343,329 which includes $555 cash and excludes $5,258 spent on fees and slippage. |
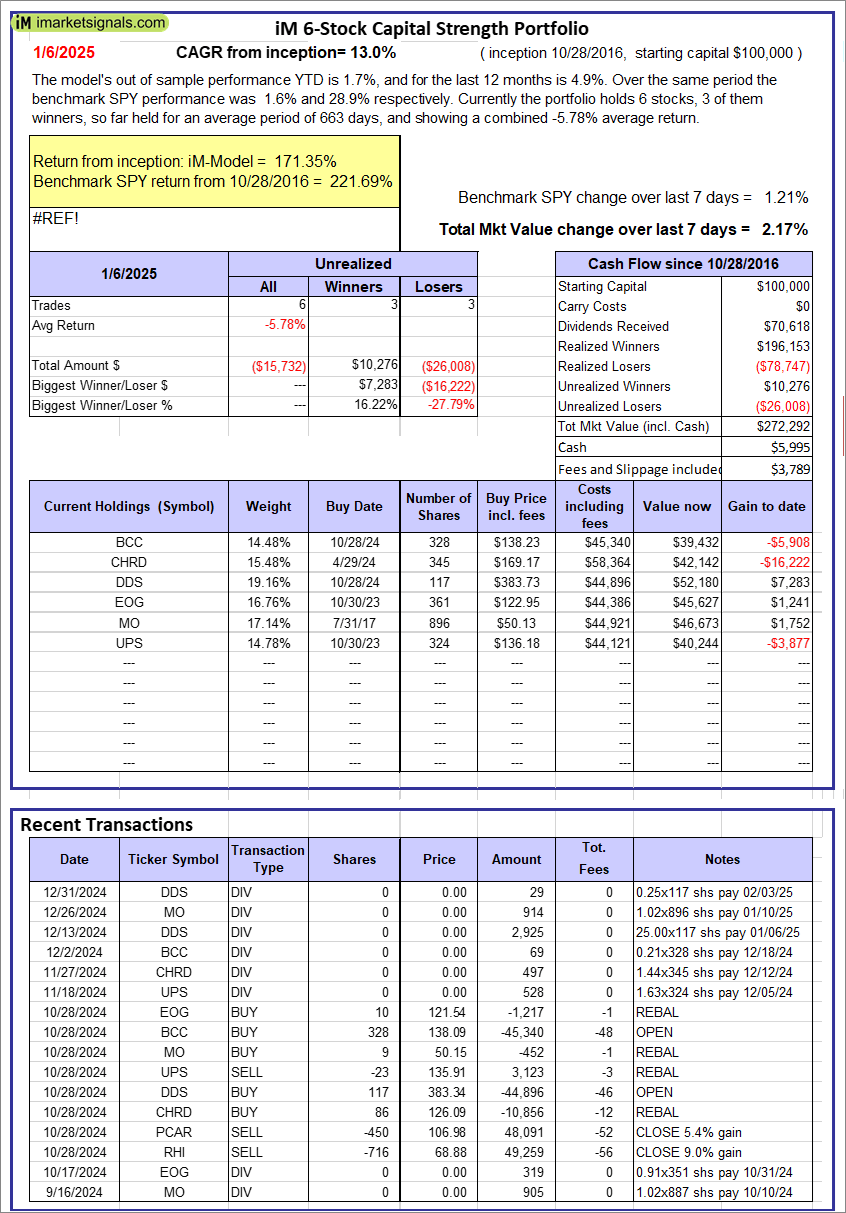 |
iM 6-Stock Capital Strength Portfolio: The model’s out of sample performance YTD is 1.7%, and for the last 12 months is 4.9%. Over the same period the benchmark SPY performance was 1.6% and 28.9% respectively. Over the previous week the market value of the iM 6-Stock Capital Strength Portfolio gained 2.17% at a time when SPY gained 1.21%. A starting capital of $100,000 at inception on 10/28/2016 would have grown to $272,292 which includes $5,995 cash and excludes $3,789 spent on fees and slippage. |
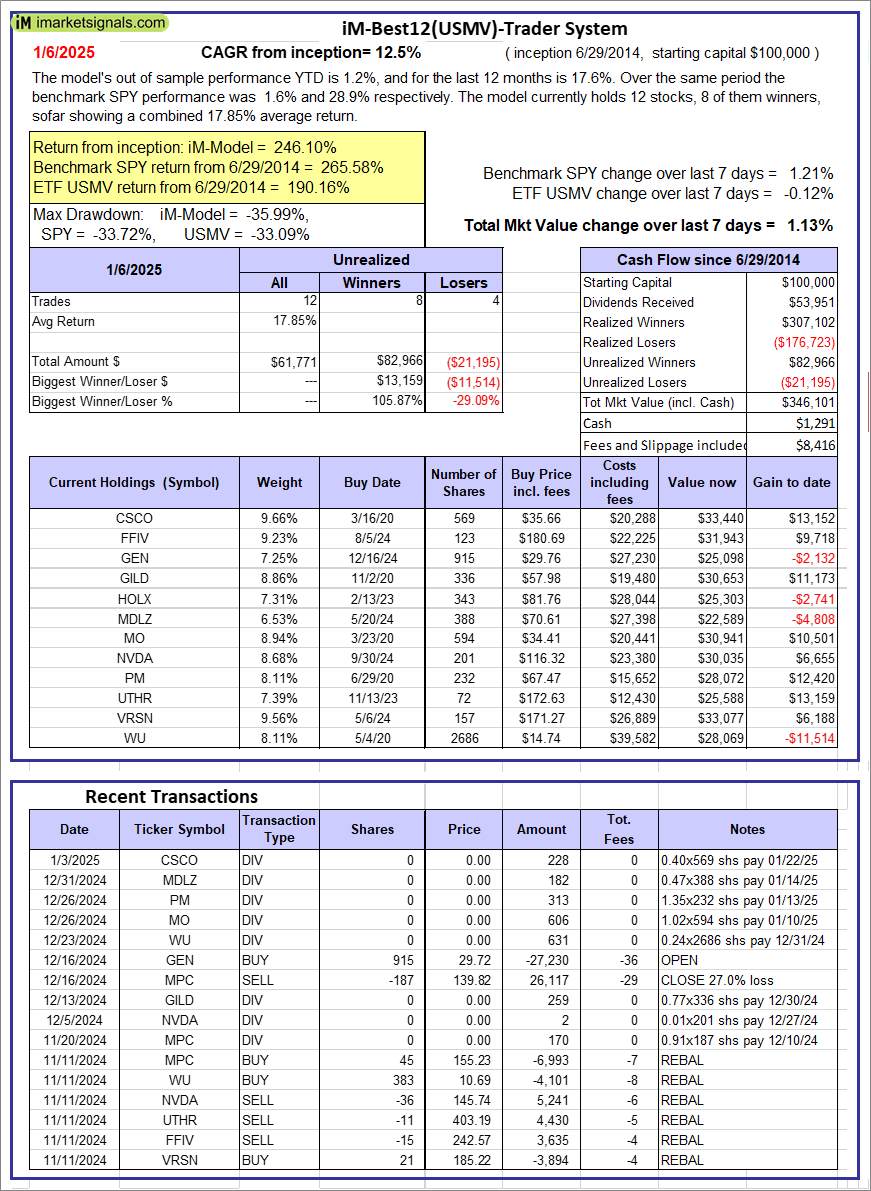  |
iM-Best12(USMV)-Trader: The model’s out of sample performance YTD is 1.2%, and for the last 12 months is 17.6%. Over the same period the benchmark SPY performance was 1.6% and 28.9% respectively. Since inception, on 6/30/2014, the model gained 246.10% while the benchmark SPY gained 265.58% and the ETF USMV gained 190.16% over the same period. Over the previous week the market value of iM-Best12(USMV)-Trader gained 1.13% at a time when SPY gained 1.21%. A starting capital of $100,000 at inception on 6/30/2014 would have grown to $346,101 which includes $1,291 cash and excludes $8,416 spent on fees and slippage. |
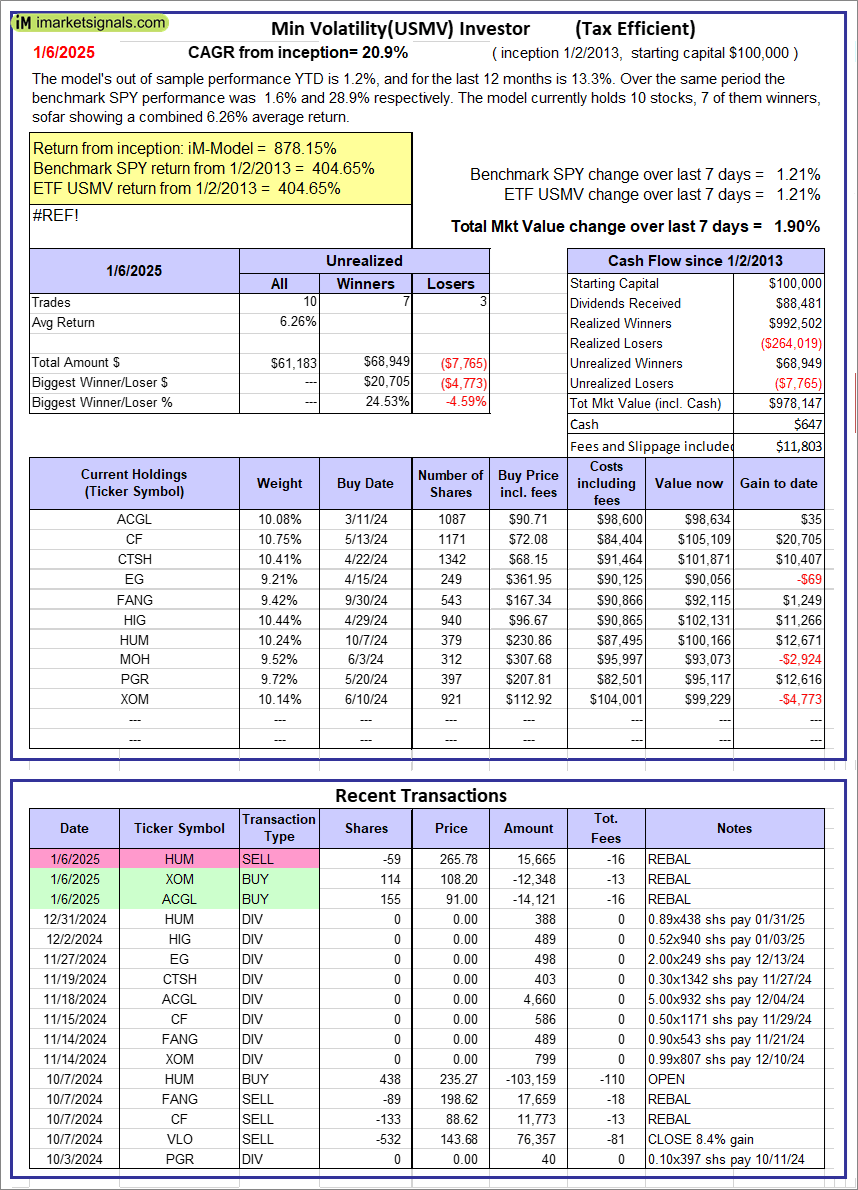  |
iM-Min Volatility(USMV) Investor (Tax Efficient): The model’s out of sample performance YTD is 1.2%, and for the last 12 months is 13.3%. Over the same period the benchmark SPY performance was 1.6% and 28.9% respectively. Since inception, on 1/3/2013, the model gained 878.15% while the benchmark SPY gained 404.65% and the ETF USMV gained 404.65% over the same period. Over the previous week the market value of iM-Best12(USMV)Q1 gained 1.90% at a time when SPY gained 1.21%. A starting capital of $100,000 at inception on 1/3/2013 would have grown to $978,147 which includes $647 cash and excludes $11,803 spent on fees and slippage. |
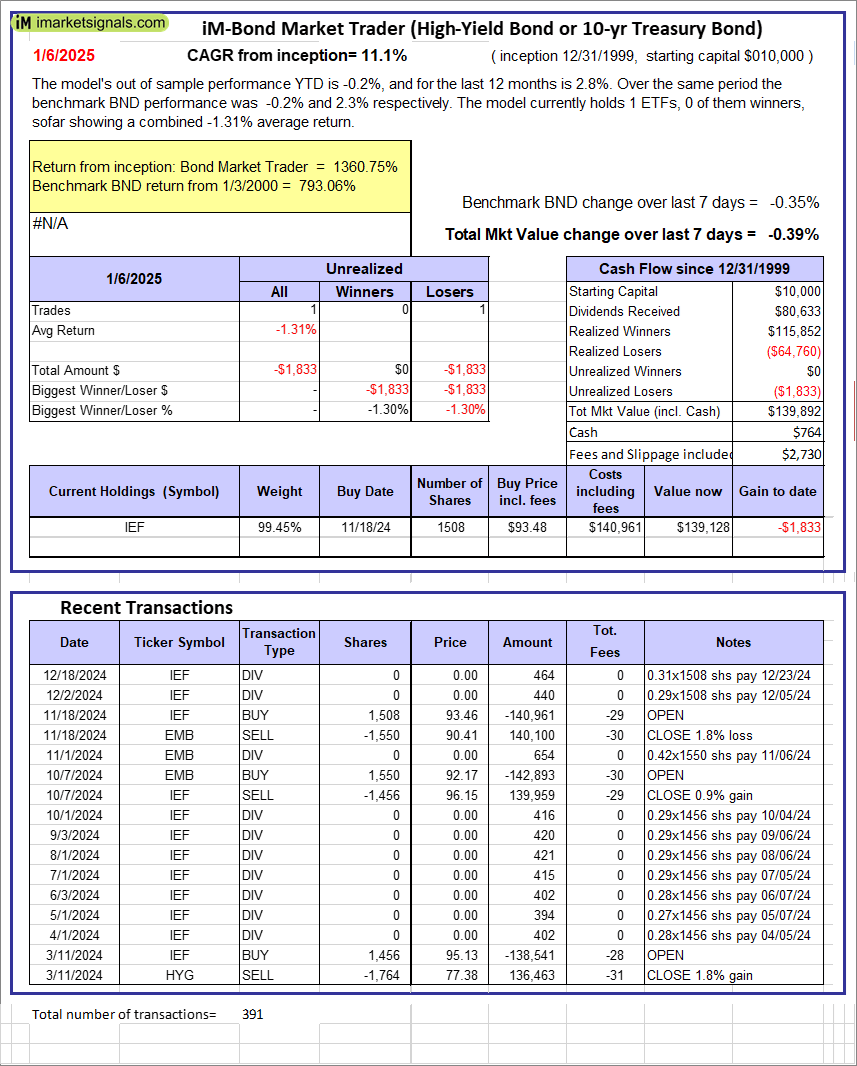 |
iM-Bond Market Trader (High-Yield Bond or 10-yr Treasury Bond): The model’s out of sample performance YTD is -0.2%, and for the last 12 months is 2.8%. Over the same period the benchmark BND performance was -0.2% and 2.3% respectively. Over the previous week the market value of the iM-Bond Market Trader (High-Yield Bond or 10-yr Treasury Bond) gained -0.39% at a time when BND gained -0.35%. A starting capital of $10,000 at inception on 1/3/2000 would have grown to $139,892 which includes $764 cash and excludes $2,730 spent on fees and slippage. |
|
|
iM-ModSum/YieldCurve Timer: The model’s out of sample performance YTD is -0.2%, and for the last 12 months is 21.2%. Over the same period the benchmark SPY performance was 1.6% and 28.9% respectively. Over the previous week the market value of iM-PortSum/YieldCurve Timer gained -0.38% at a time when SPY gained 1.21%. A starting capital of $100,000 at inception on 1/1/2016 would have grown to $320,230 which includes $3,317 cash and excludes $1,748 spent on fees and slippage. |
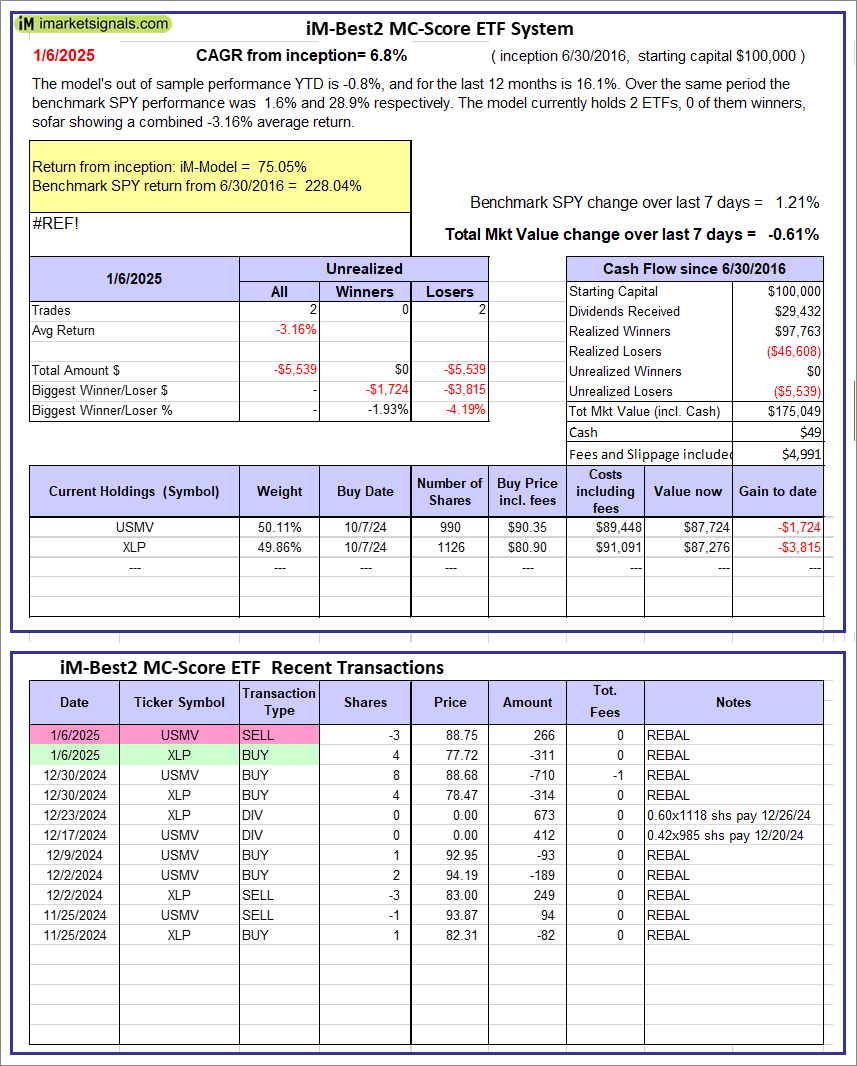 |
iM-Best2 MC-Score ETF System: The model’s out of sample performance YTD is -0.8%, and for the last 12 months is 16.1%. Over the same period the benchmark SPY performance was 1.6% and 28.9% respectively. Over the previous week the market value of the iM-Best2 MC-Score ETF System gained -0.61% at a time when SPY gained 1.21%. A starting capital of $100,000 at inception on 6/30/2016 would have grown to $175,049 which includes $49 cash and excludes $4,991 spent on fees and slippage. |
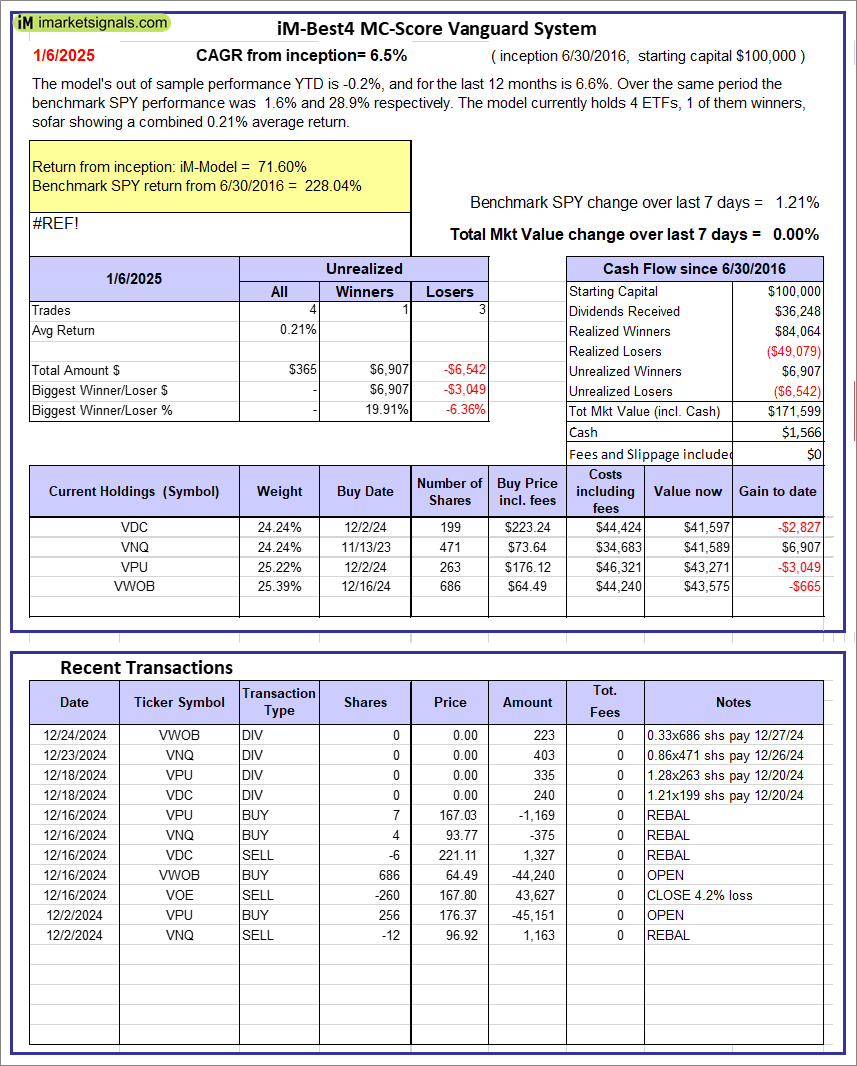 |
iM-Best4 MC-Score Vanguard System: The model’s out of sample performance YTD is -0.2%, and for the last 12 months is 6.6%. Over the same period the benchmark SPY performance was 1.6% and 28.9% respectively. Over the previous week the market value of the iM-Best4 MC-Score Vanguard System gained 0.00% at a time when SPY gained 1.21%. A starting capital of $100,000 at inception on 6/30/2016 would have grown to $171,599 which includes $1,566 cash and excludes $00 spent on fees and slippage. |
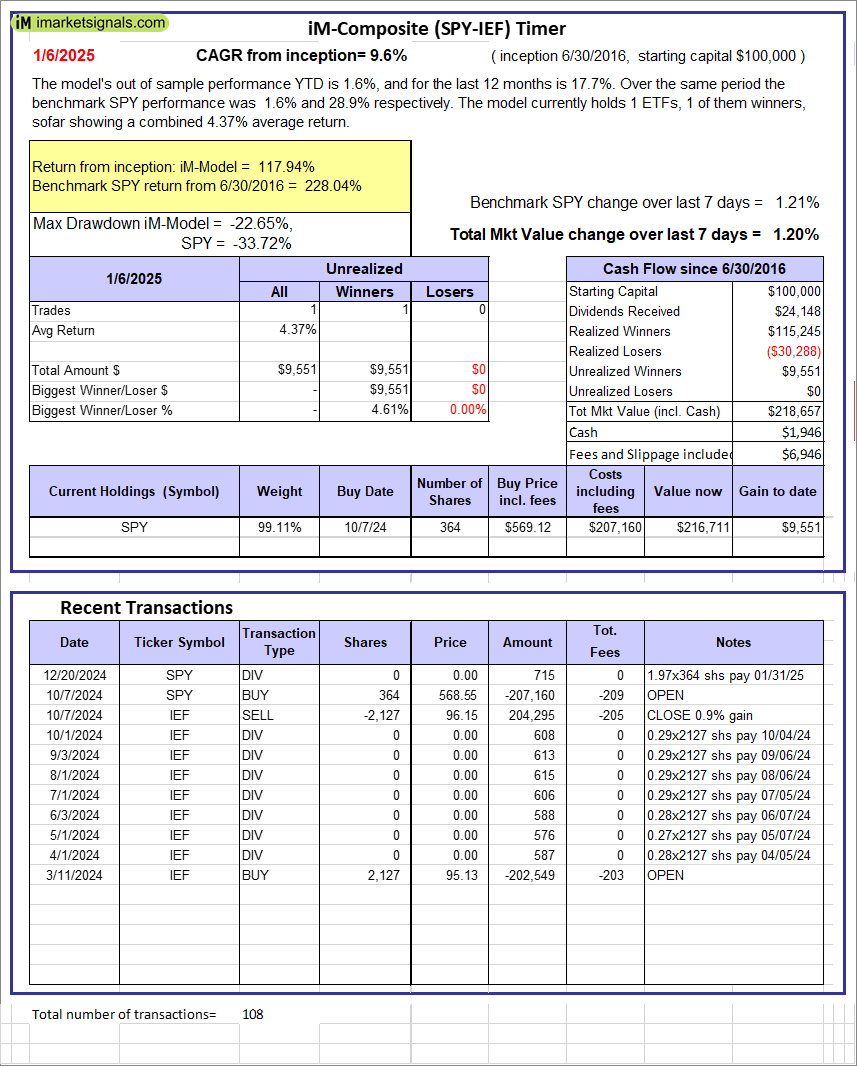 |
iM-Composite (SPY-IEF) Timer: The model’s out of sample performance YTD is 1.6%, and for the last 12 months is 17.7%. Over the same period the benchmark SPY performance was 1.6% and 28.9% respectively. Over the previous week the market value of the iM-Composite (SPY-IEF) Timer gained 1.20% at a time when SPY gained 1.21%. A starting capital of $100,000 at inception on 6/30/2016 would have grown to $218,657 which includes $1,946 cash and excludes $6,946 spent on fees and slippage. |
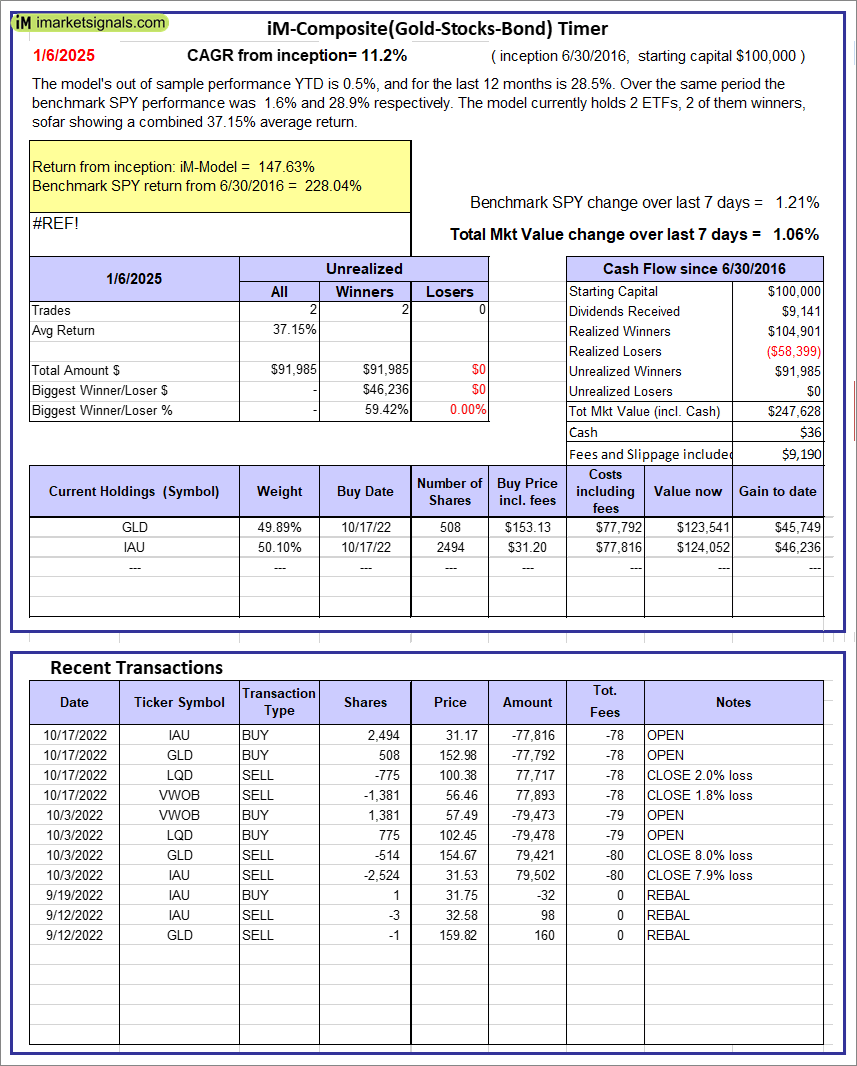 |
iM-Composite(Gold-Stocks-Bond) Timer: The model’s out of sample performance YTD is 0.5%, and for the last 12 months is 28.5%. Over the same period the benchmark SPY performance was 1.6% and 28.9% respectively. Over the previous week the market value of the iM-Composite(Gold-Stocks-Bond) Timer gained 1.06% at a time when SPY gained 1.21%. A starting capital of $100,000 at inception on 6/30/2016 would have grown to $247,628 which includes $36 cash and excludes $9,190 spent on fees and slippage. |
iM-Best Reports – 1/6/2025
Posted in pmp SPY-SH
Leave a Reply
You must be logged in to post a comment.