
  |
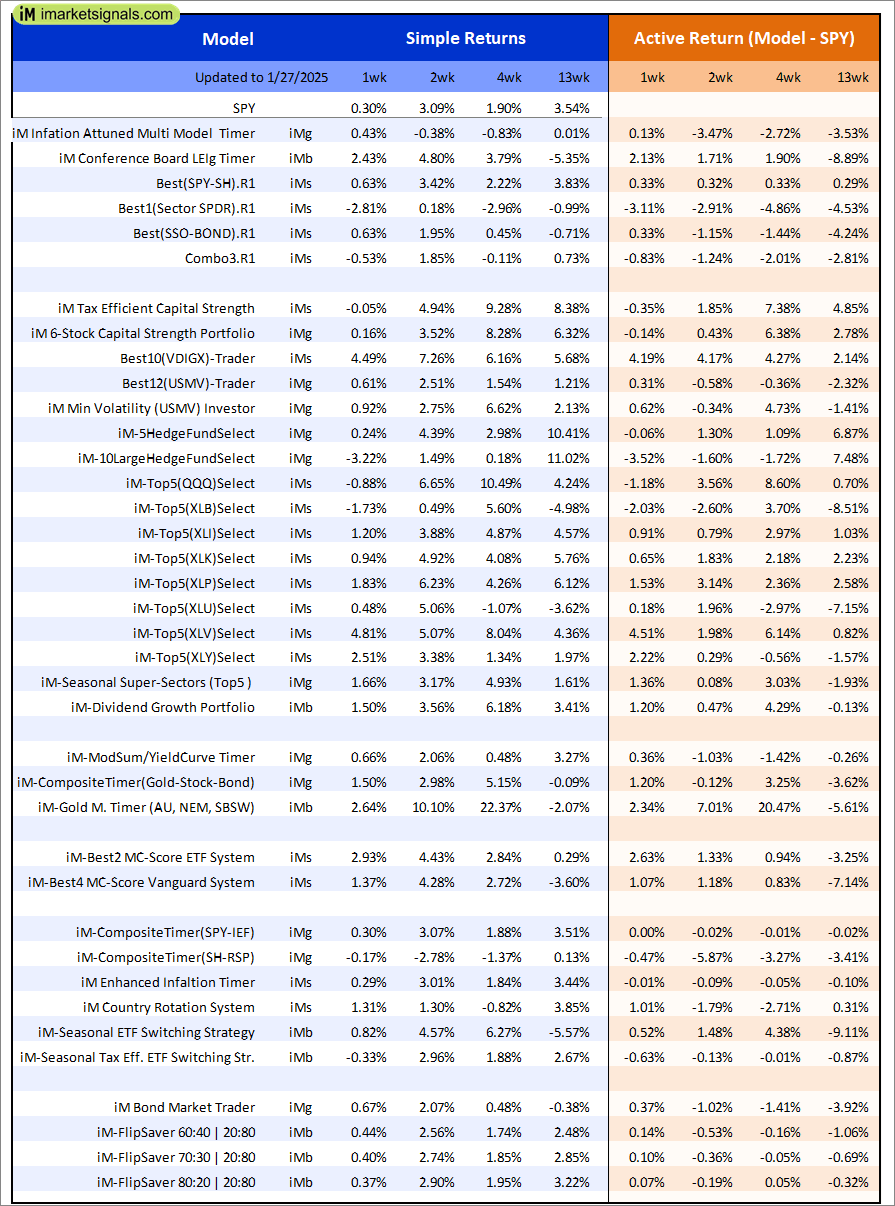
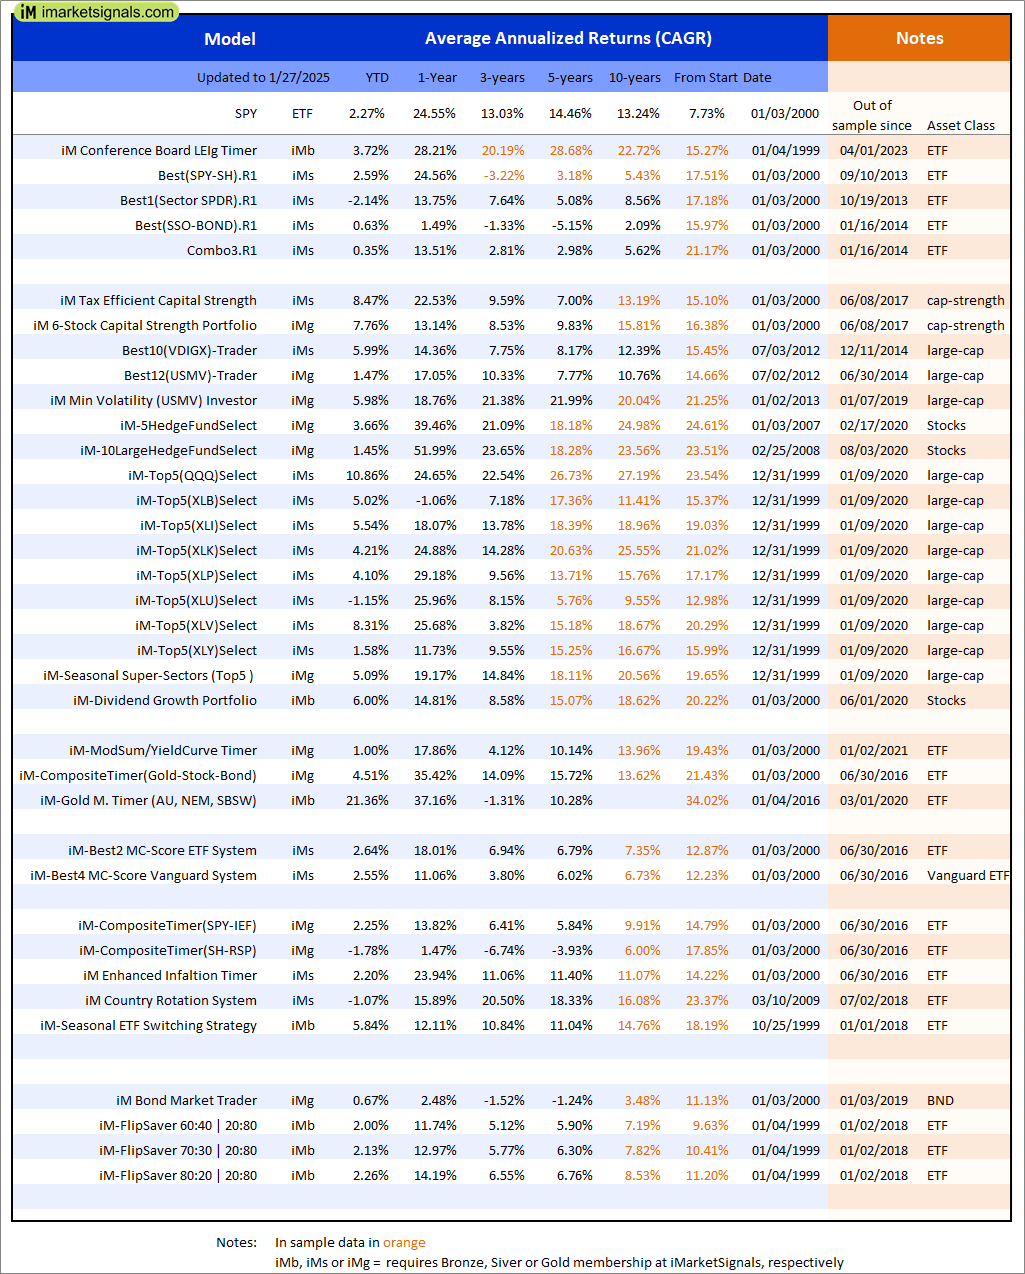
Out of sample performance summary of our models for the past 1, 2, 4 and 13 week periods. The active active return indicates how the models over- or underperformed the benchmark ETF SPY. Also the YTD, and the 1-, 3-, 5- and 10-year annualized returns are shown in the second table |
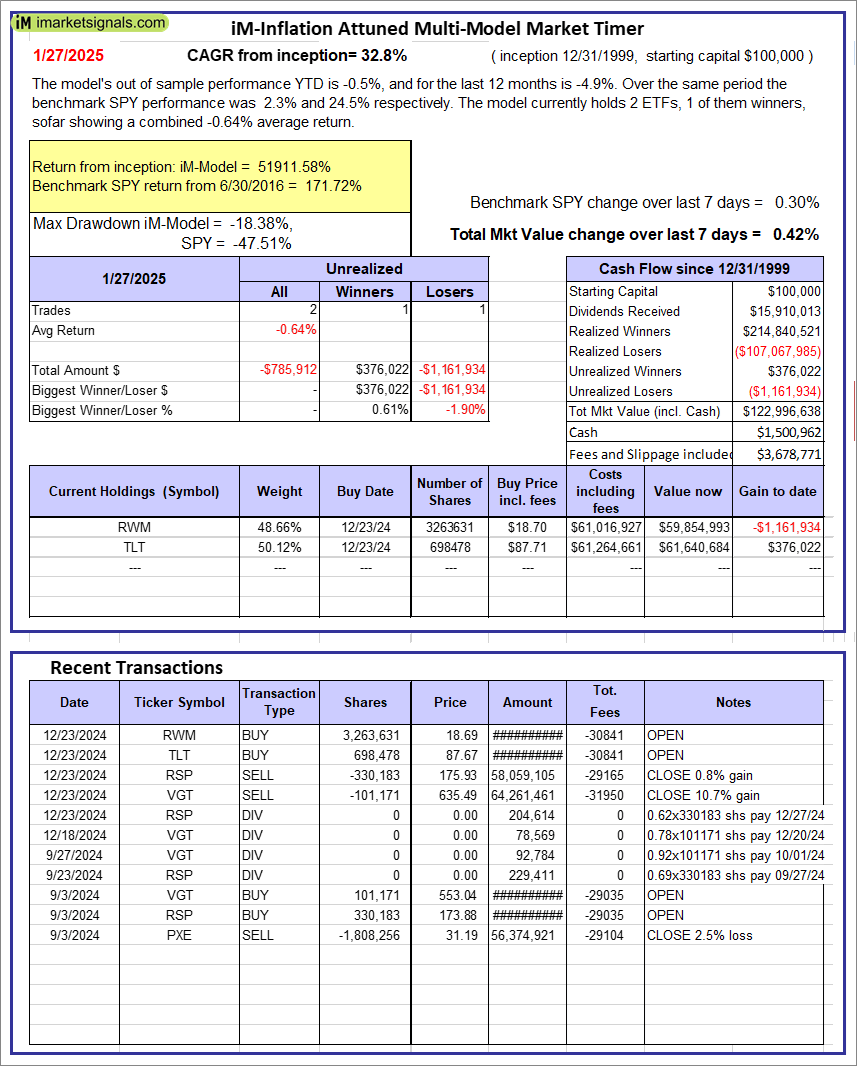 |
iM-Inflation Attuned Multi-Model Market Timer: The model’s out of sample performance YTD is -0.5%, and for the last 12 months is -4.9%. Over the same period the benchmark SPY performance was 2.3% and 24.5% respectively. Over the previous week the market value of the iM-Inflation Attuned Multi-Model Market Timer gained 0.42% at a time when SPY gained 0.30%. A starting capital of $100,000 at inception on 3/24/2017 would have grown to $122,996,638 which includes $1,500,962 cash and excludes $3,678,771 spent on fees and slippage. |
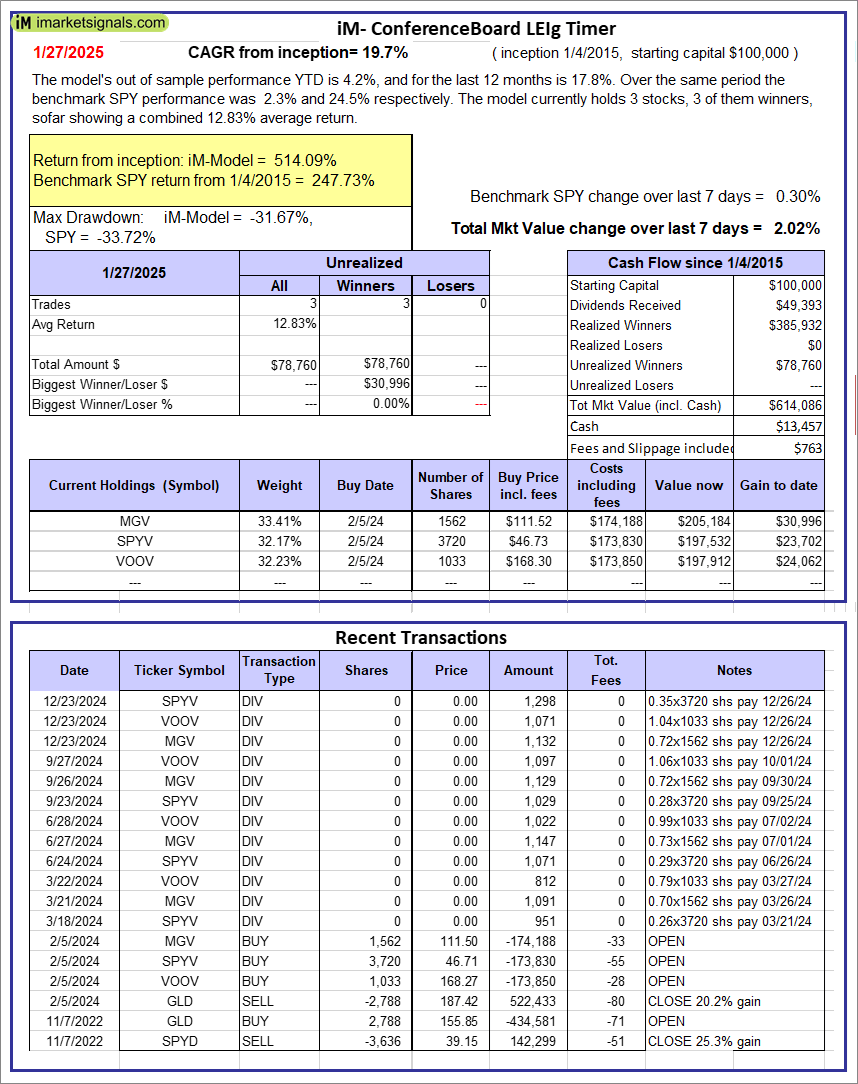 |
iM-Conference Board LEIg Timer: The model’s performance YTD is 14.3%, and for the last 12 months is 7.3%. Over the same period the benchmark SPY performance was 20.1% and 9.4% respectively. Over the previous week the market value of the iM-Conference Board LEIg Timer gained 2.02% at a time when SPY gained 0.30%. A starting capital of $100,000 at inception on 4/5/2017 would have grown to $614,086 which includes $13,457 cash and excludes $763 spent on fees and slippage. |
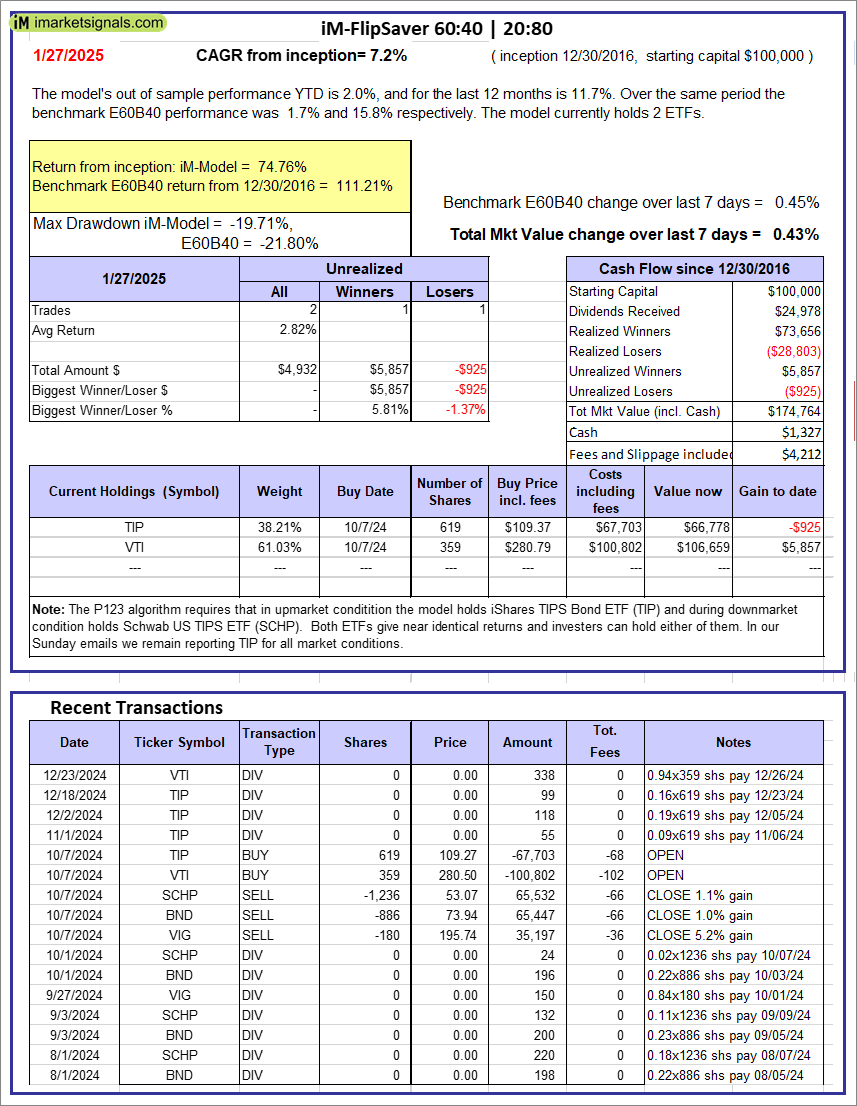 |
iM-FlipSaver 60:40 | 20:80 – 2017: The model’s out of sample performance YTD is 2.0%, and for the last 12 months is 11.7%. Over the same period the benchmark E60B40 performance was 1.7% and 15.8% respectively. Over the previous week the market value of iM-FlipSaver 80:20 | 20:80 gained 0.43% at a time when SPY gained 0.45%. A starting capital of $100,000 at inception on 7/16/2015 would have grown to $174,764 which includes $1,327 cash and excludes $4,212 spent on fees and slippage. |
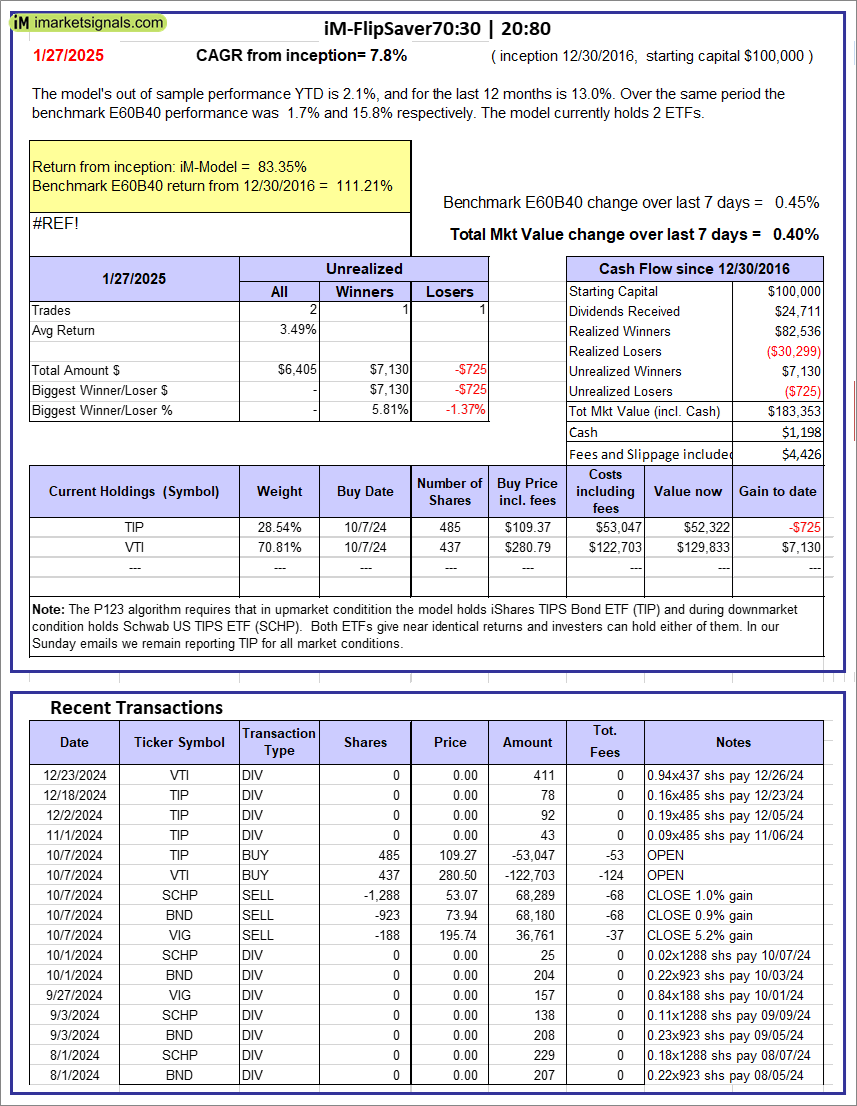 |
iM-FlipSaver 70:30 | 20:80 – 2017: The model’s out of sample performance YTD is 2.1%, and for the last 12 months is 13.0%. Over the same period the benchmark E60B40 performance was 1.7% and 15.8% respectively. Over the previous week the market value of iM-FlipSaver 70:30 | 20:80 gained 0.40% at a time when SPY gained 0.45%. A starting capital of $100,000 at inception on 7/15/2015 would have grown to $183,353 which includes $1,198 cash and excludes $4,426 spent on fees and slippage. |
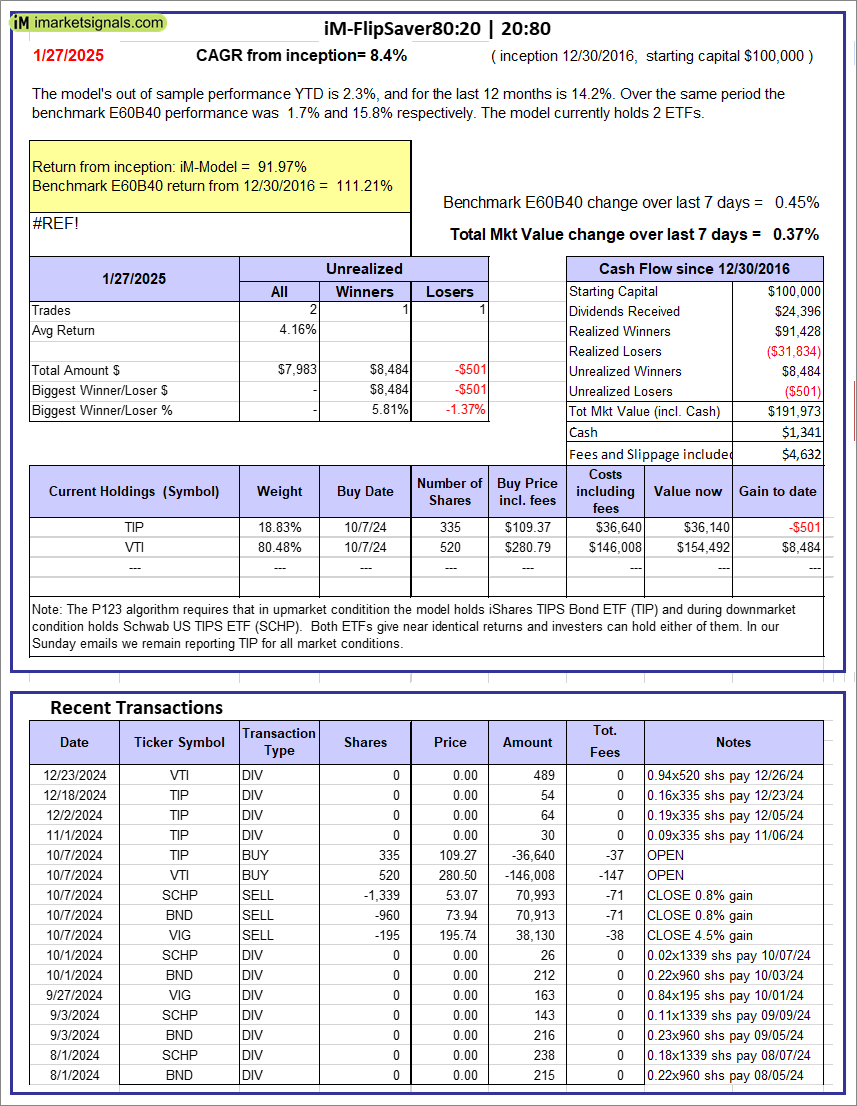 |
iM-FlipSaver 80:20 | 20:80 – 2017: The model’s out of sample performance YTD is 2.3%, and for the last 12 months is 14.2%. Over the same period the benchmark E60B40 performance was 1.7% and 15.8% respectively. Over the previous week the market value of iM-FlipSaver 80:20 | 20:80 gained 0.37% at a time when SPY gained 0.45%. A starting capital of $100,000 at inception on 1/2/2017 would have grown to $191,973 which includes $1,341 cash and excludes $4,632 spent on fees and slippage. |
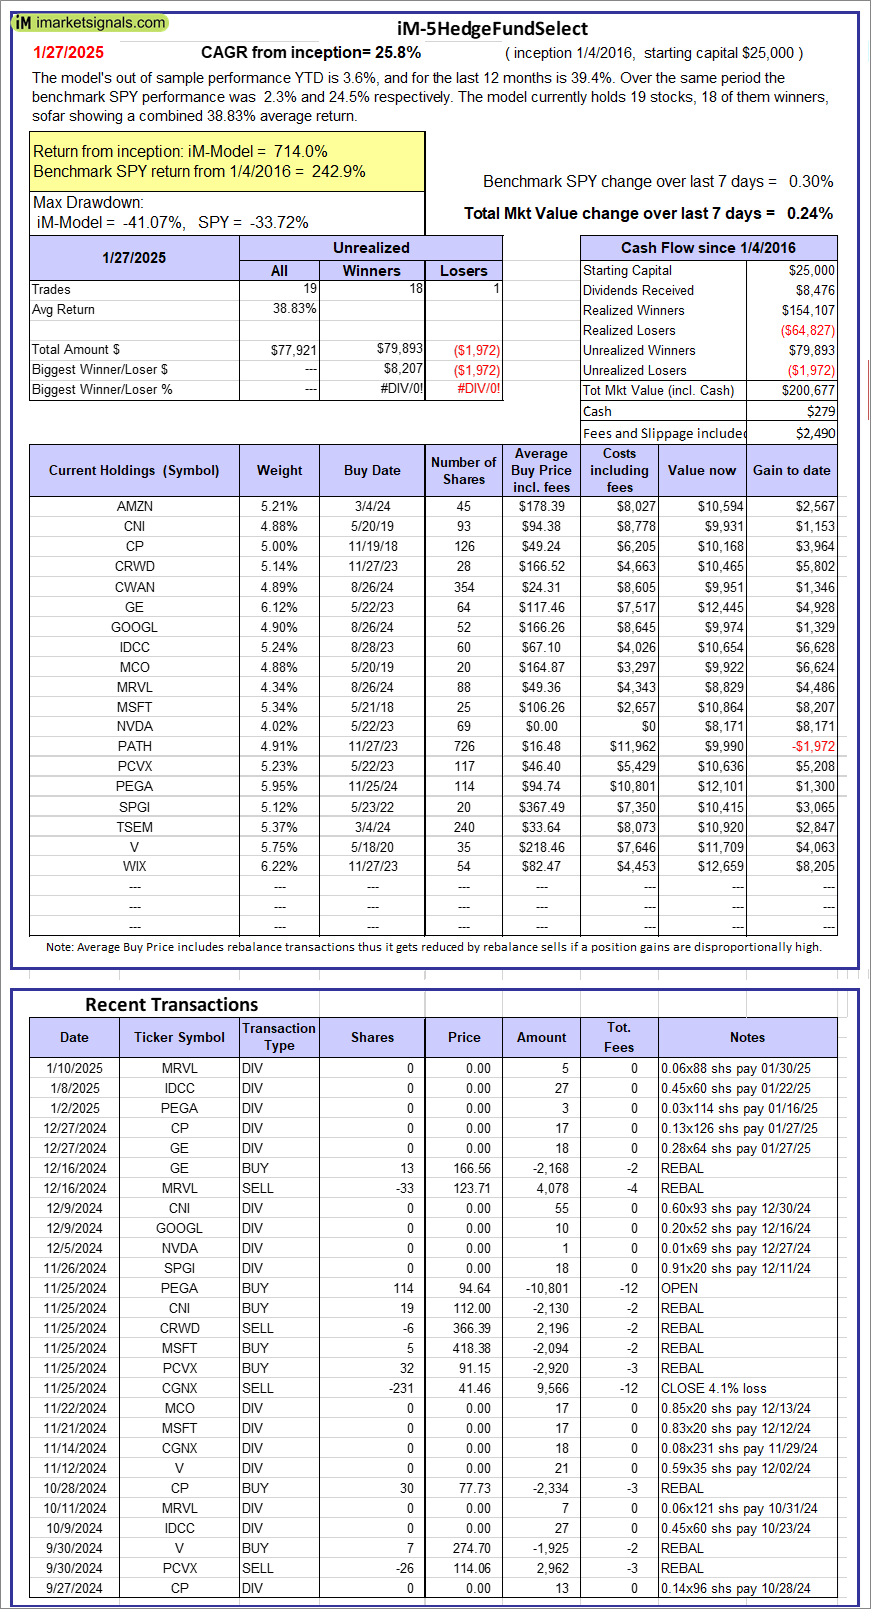 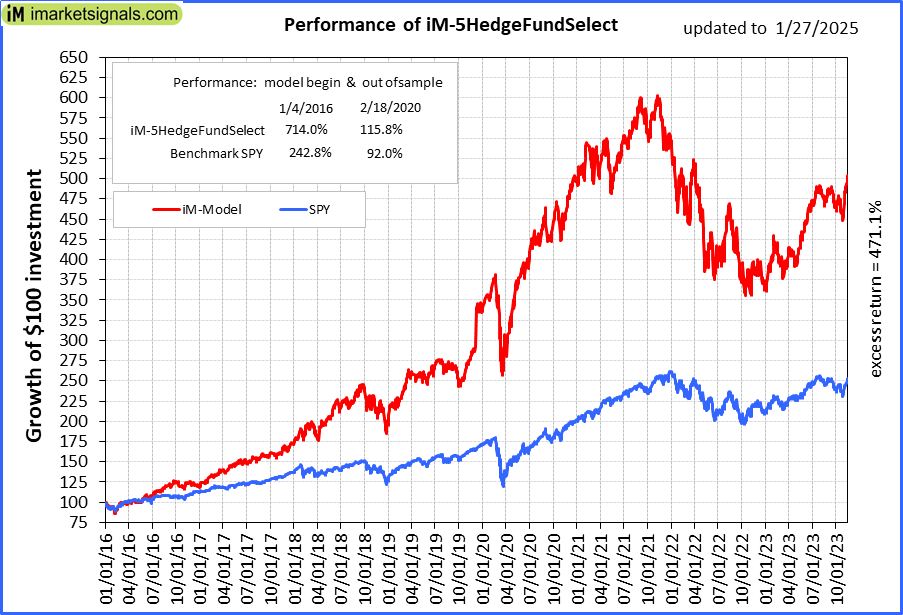 |
iM-5HedgeFundSelect: Since inception, on 1/5/2016, the model gained 714.00% while the benchmark SPY gained 242.86% over the same period. Over the previous week the market value of iM-5HedgeFundSelect gained 0.24% at a time when SPY gained 0.30%. A starting capital of $25,000 at inception on 1/5/2016 would have grown to $200,677 which includes $279 cash and excludes $2,490 spent on fees and slippage. |
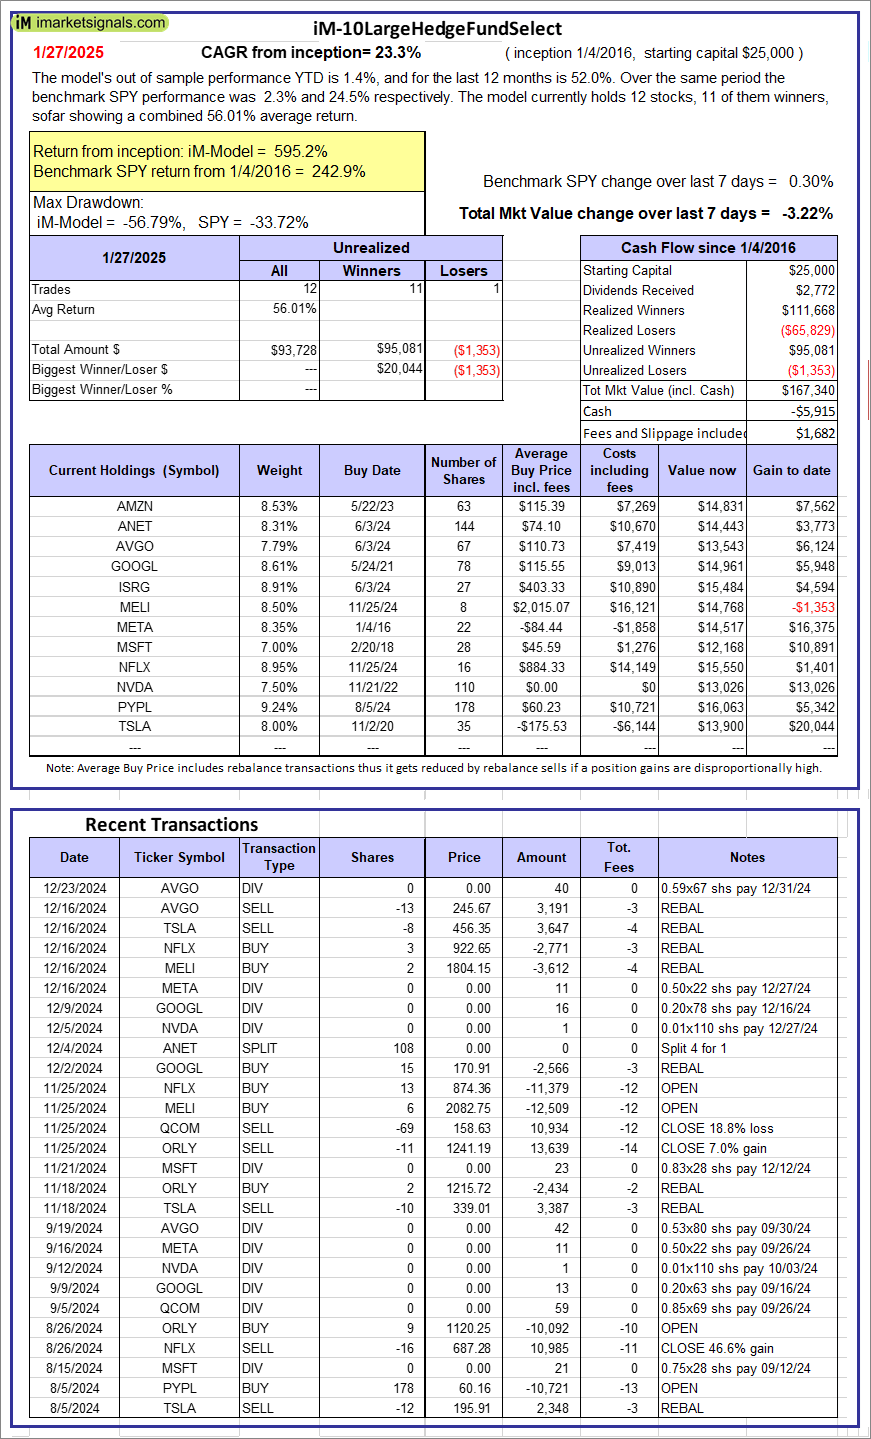 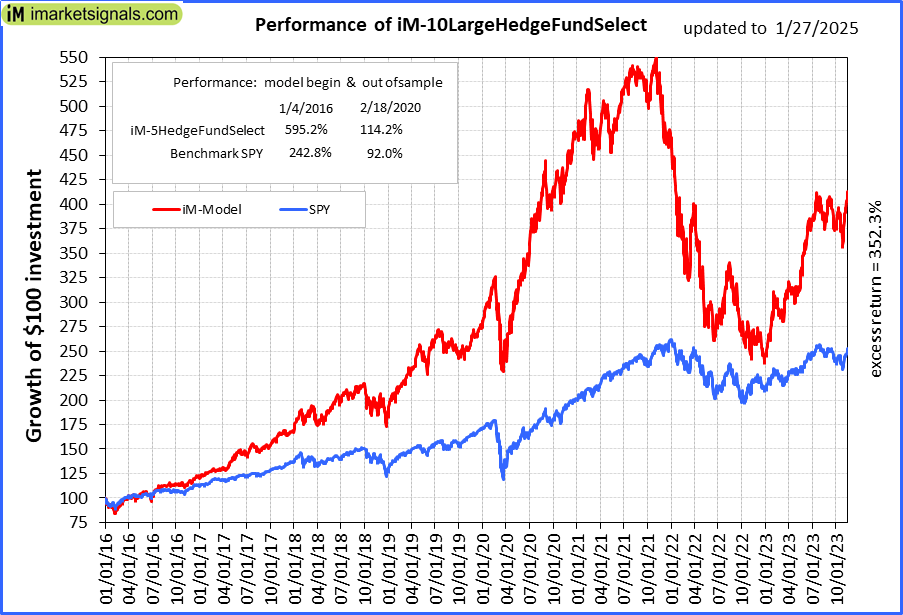 |
iM-10LargeHedgeFundSelect: Since inception, on 1/5/2016, the model gained 595.15% while the benchmark SPY gained 242.86% over the same period. Over the previous week the market value of iM-10LargeHedgeFundSelect gained -3.22% at a time when SPY gained 0.30%. A starting capital of $25,000 at inception on 1/5/2016 would have grown to $167,340 which includes -$5,915 cash and excludes $1,682 spent on fees and slippage. |
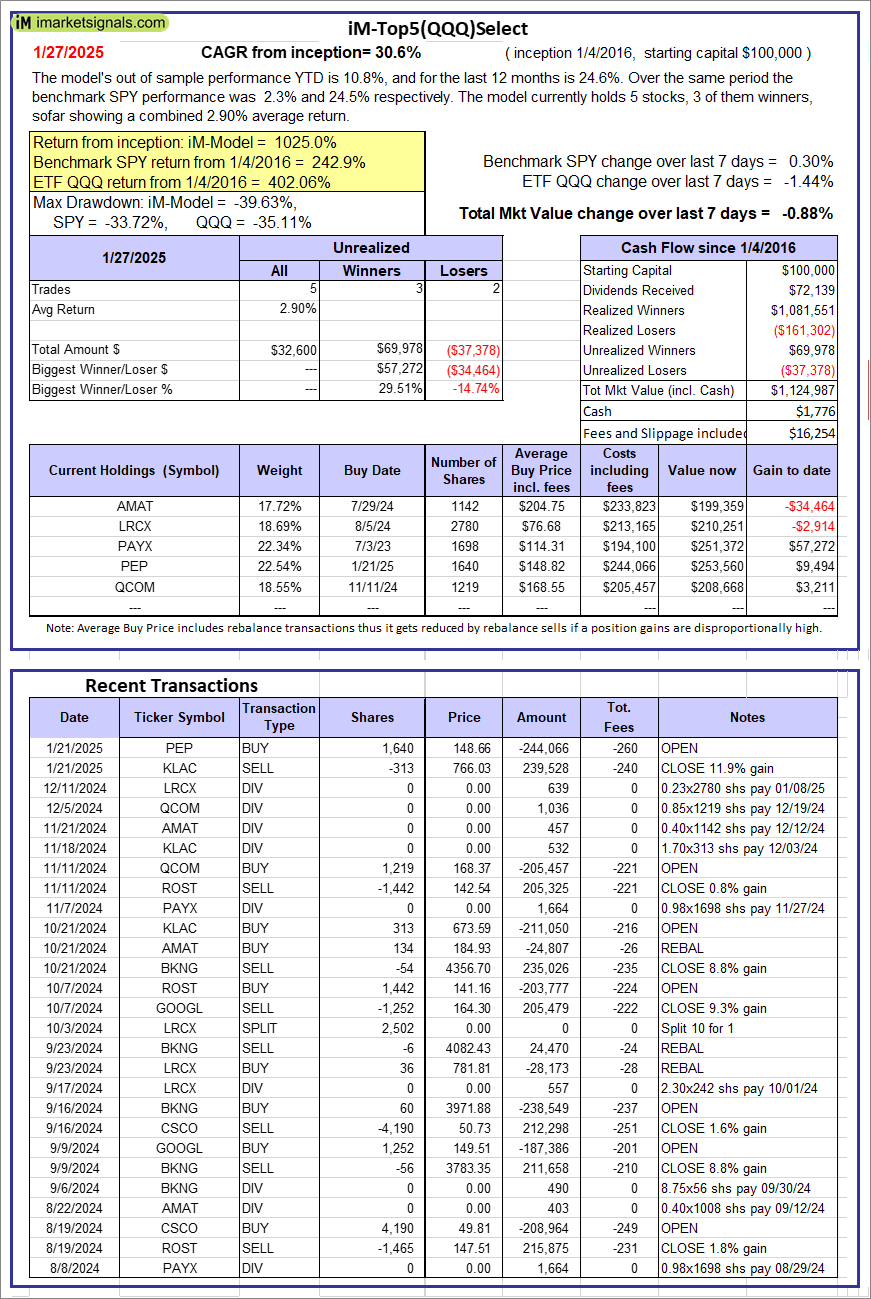 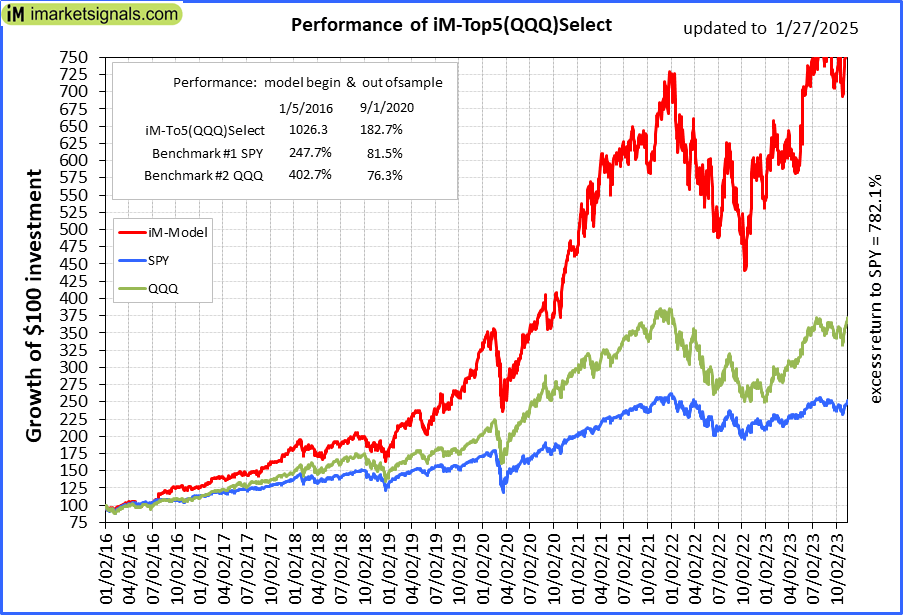 |
iM-Top5(QQQ)Select: Since inception, on 1/5/2016, the model gained 1024.99% while the benchmark SPY gained 242.86% over the same period. Over the previous week the market value of iM-Top5(QQQ)Select gained -0.88% at a time when SPY gained 0.30%. A starting capital of $100,000 at inception on 1/5/2016 would have grown to $1,124,987 which includes $1,776 cash and excludes $16,254 spent on fees and slippage. |
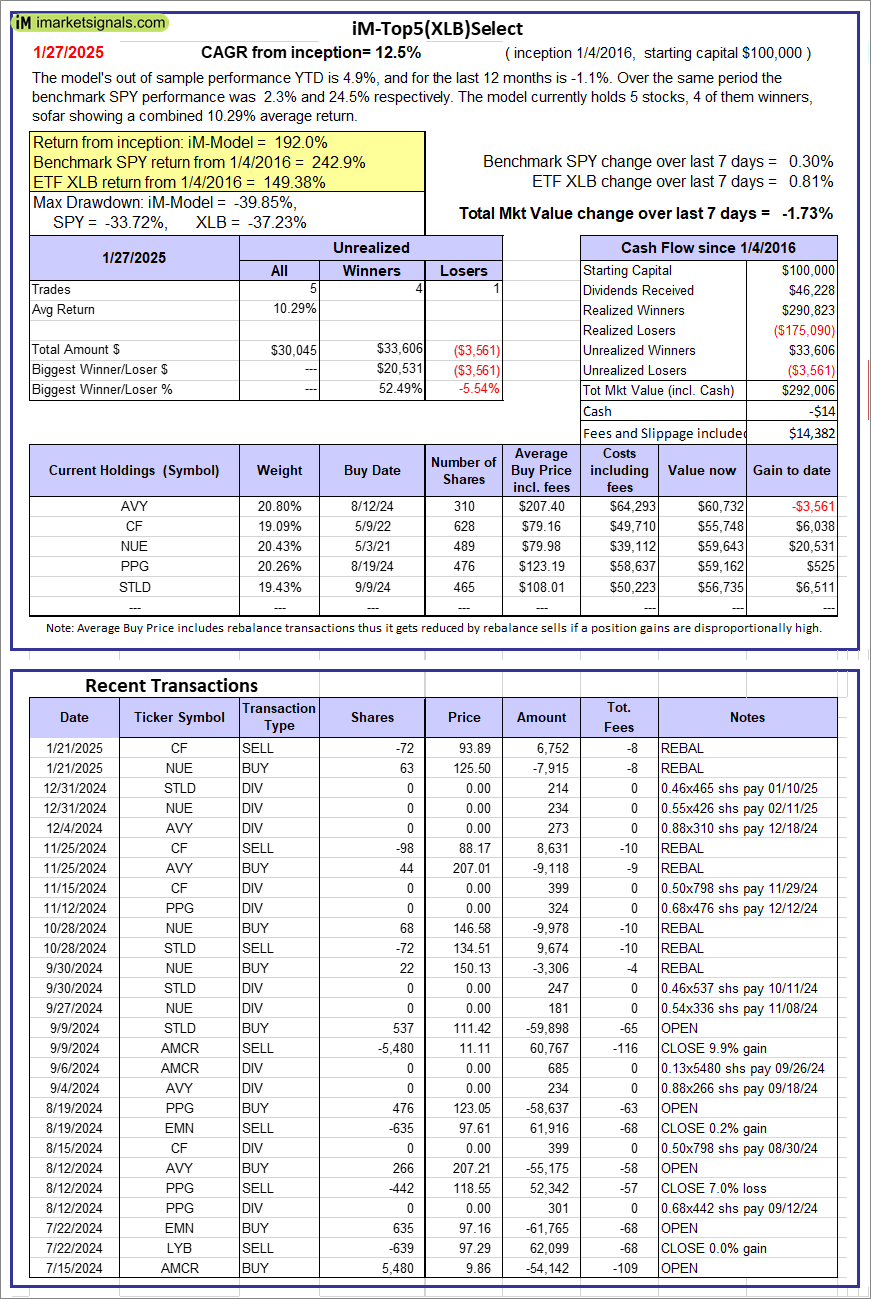 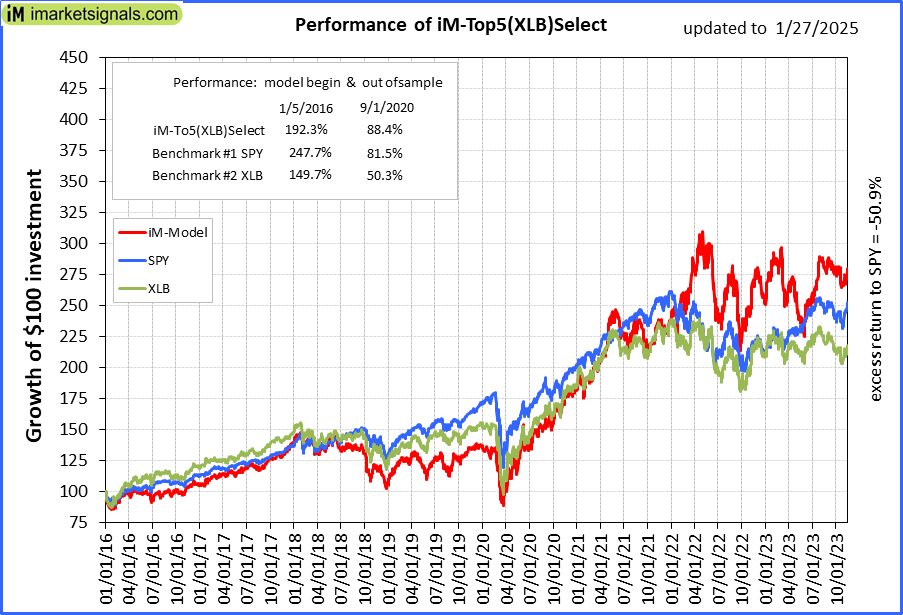 |
iM-Top5(XLB)Select: Since inception, on 1/5/2016, the model gained 192.01% while the benchmark SPY gained 242.86% over the same period. Over the previous week the market value of iM-Top5(XLB)Select gained -1.73% at a time when SPY gained 0.30%. A starting capital of $100,000 at inception on 1/5/2016 would have grown to $292,006 which includes -$14 cash and excludes $14,382 spent on fees and slippage. |
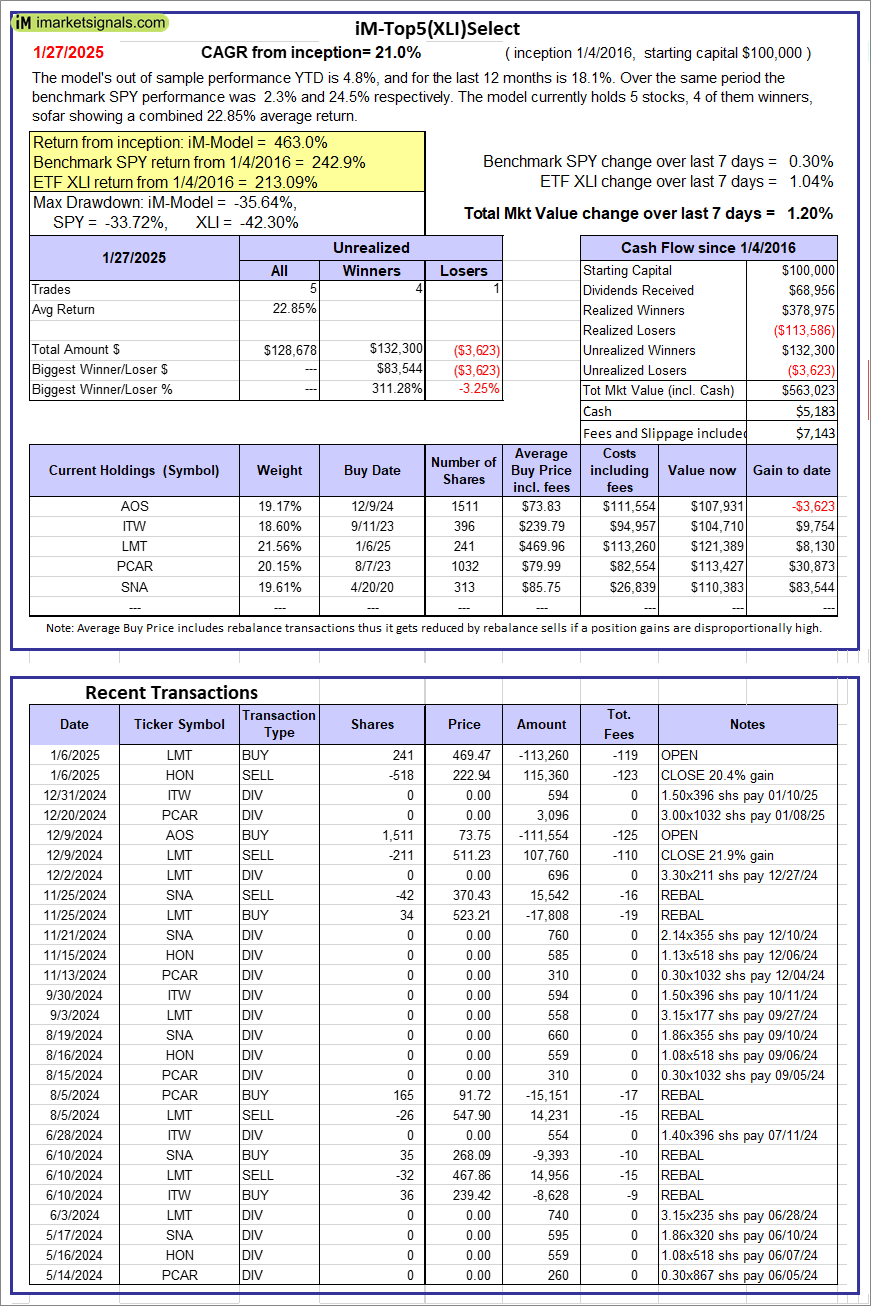 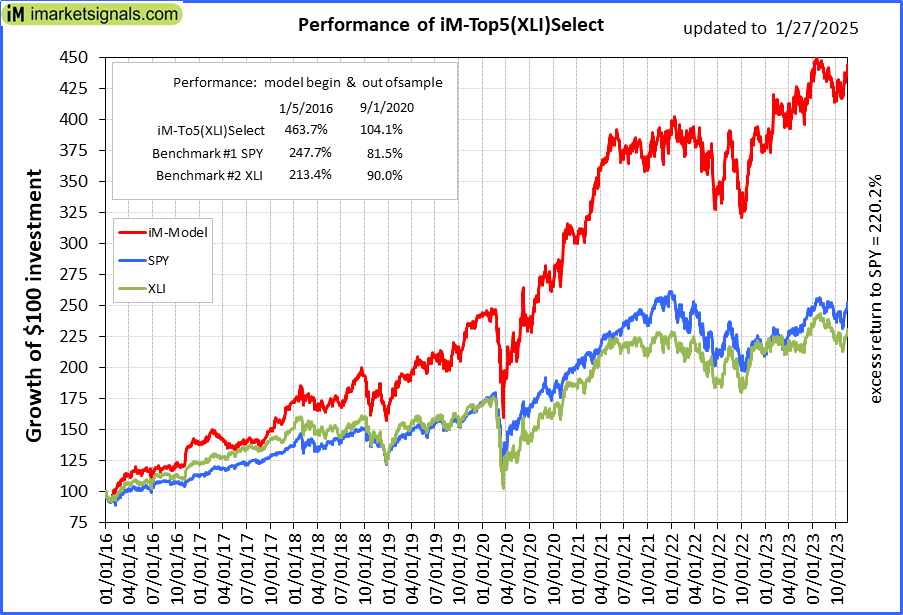 |
iM-Top5(XLI)Select: Since inception, on 1/5/2016, the model gained 463.02% while the benchmark SPY gained 242.86% over the same period. Over the previous week the market value of iM-Top5(XLI)Select gained 1.20% at a time when SPY gained 0.30%. A starting capital of $100,000 at inception on 1/5/2016 would have grown to $563,023 which includes $5,183 cash and excludes $7,143 spent on fees and slippage. |
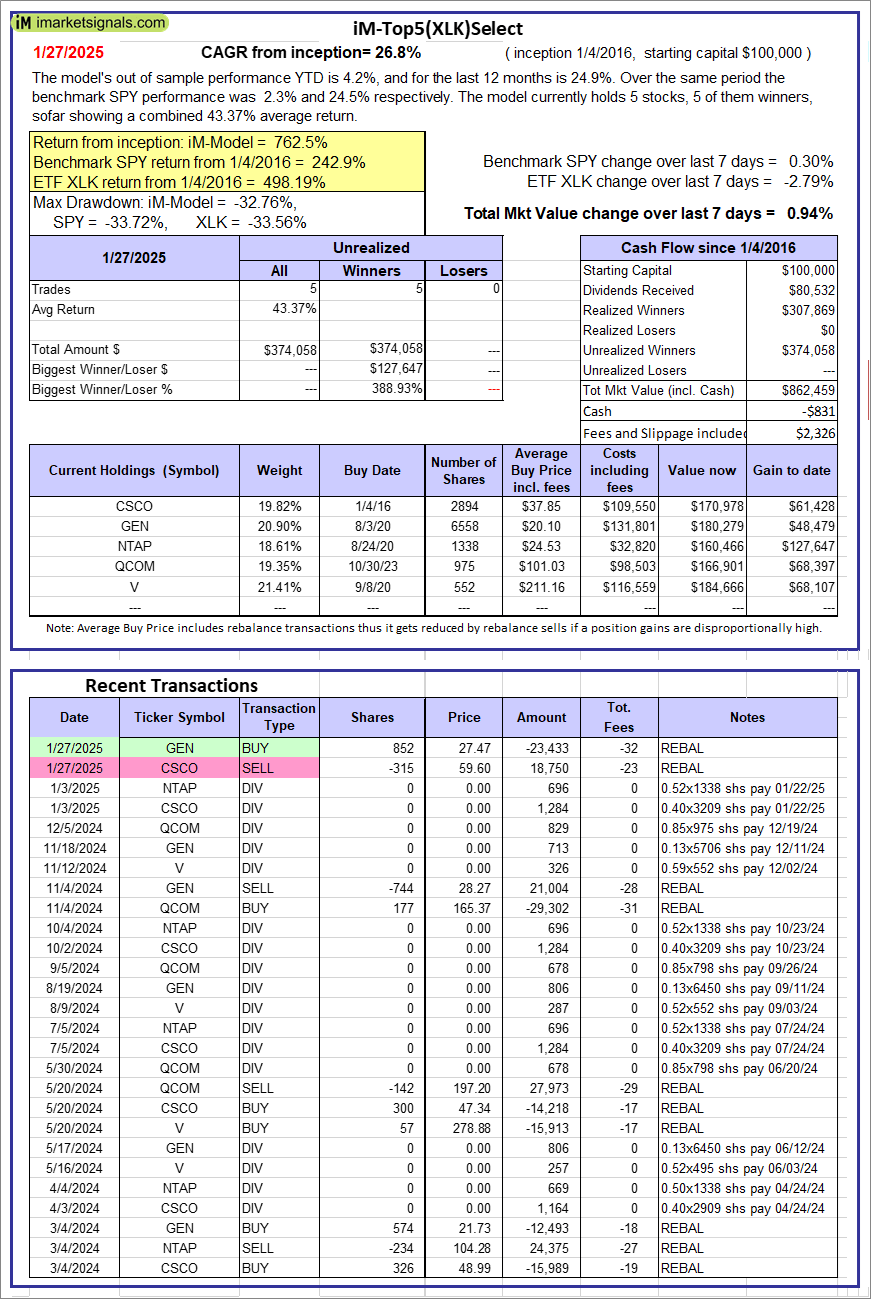 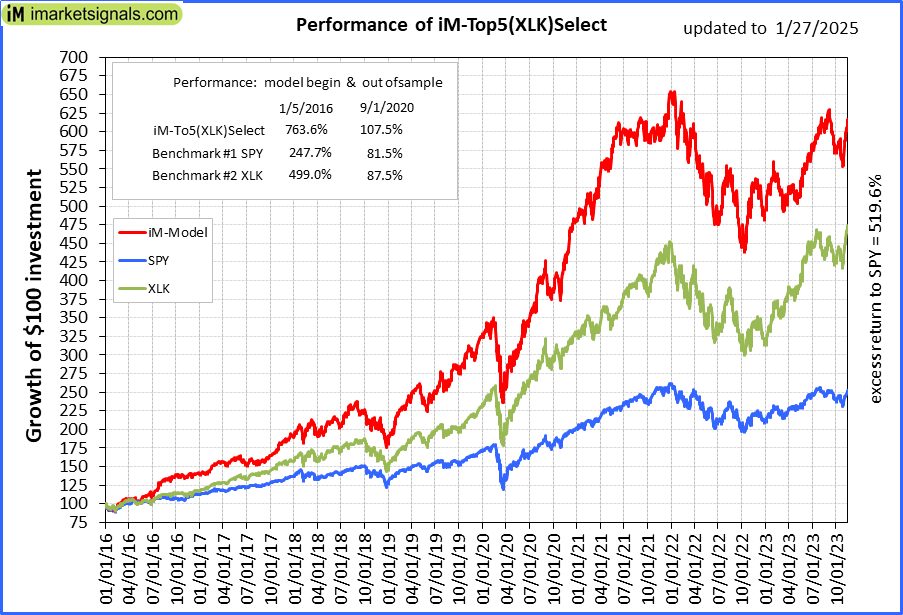 |
iM-Top5(XLK)Select: Since inception, on 1/5/2016, the model gained 762.46% while the benchmark SPY gained 242.86% over the same period. Over the previous week the market value of iM-Top5(XLK)Select gained 0.94% at a time when SPY gained 0.30%. A starting capital of $100,000 at inception on 1/5/2016 would have grown to $862,459 which includes -$831 cash and excludes $2,326 spent on fees and slippage. |
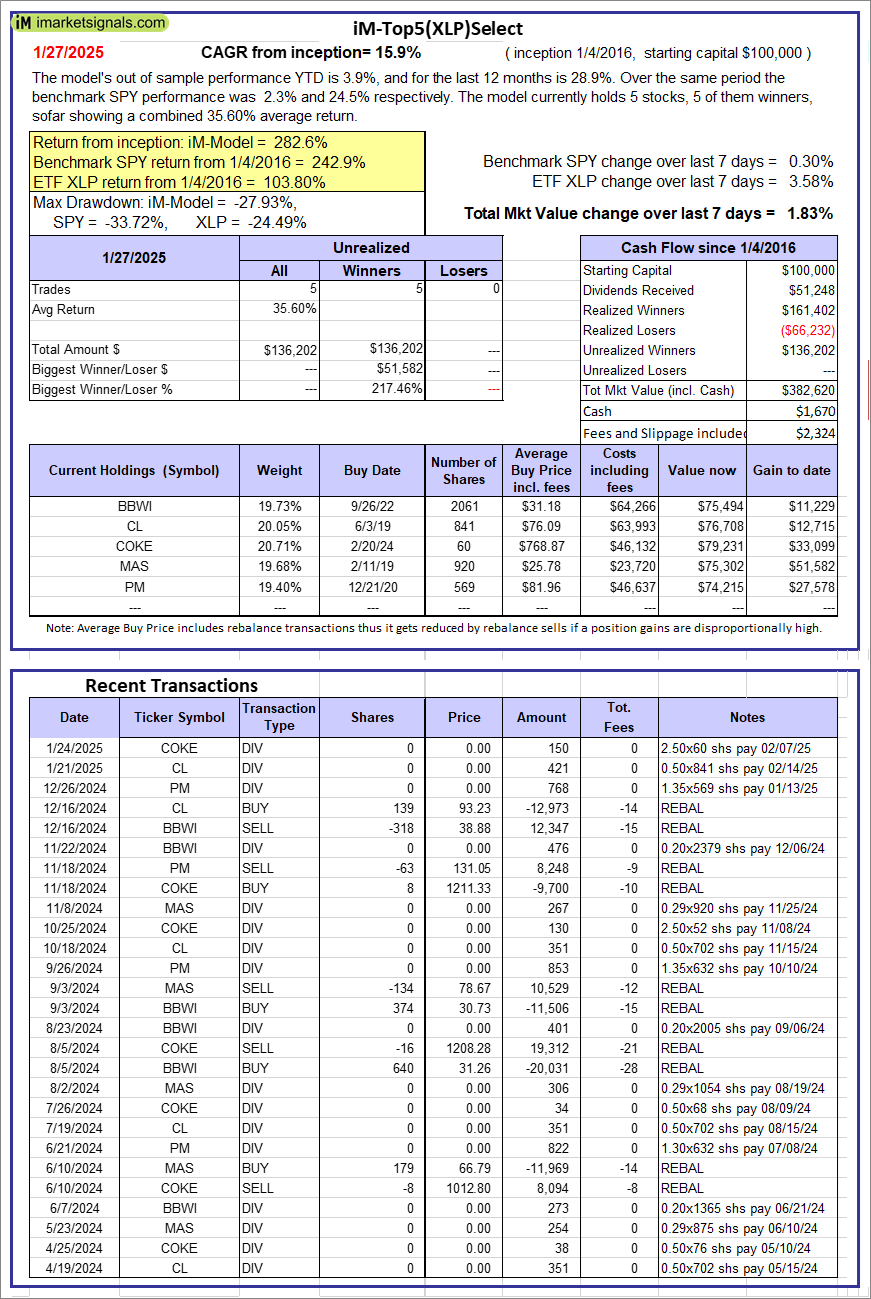 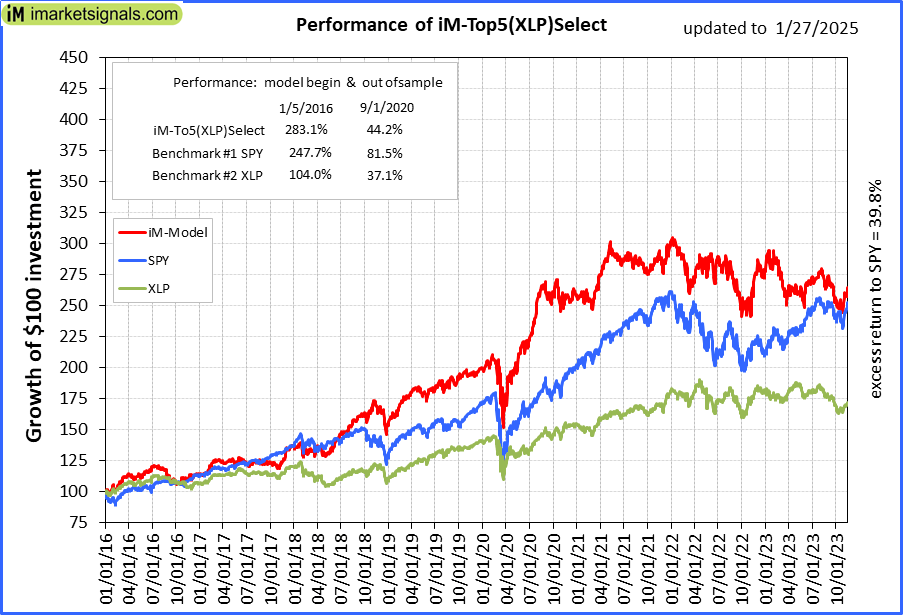 |
iM-Top5(XLP)Select: Since inception, on 1/5/2016, the model gained 282.62% while the benchmark SPY gained 242.86% over the same period. Over the previous week the market value of iM-Top5(XLP)Select gained 1.83% at a time when SPY gained 0.30%. A starting capital of $100,000 at inception on 1/5/2016 would have grown to $382,620 which includes $1,670 cash and excludes $2,324 spent on fees and slippage. |
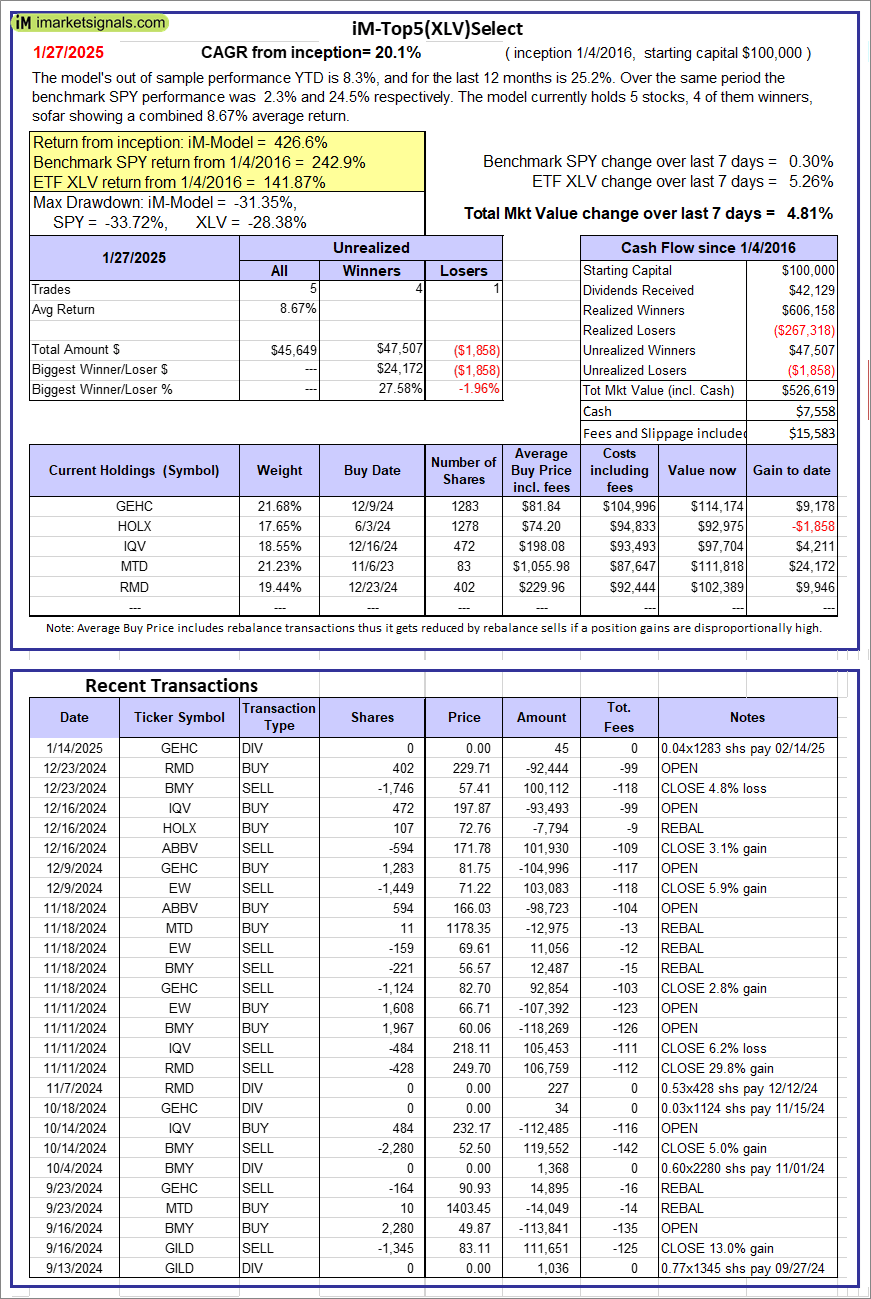 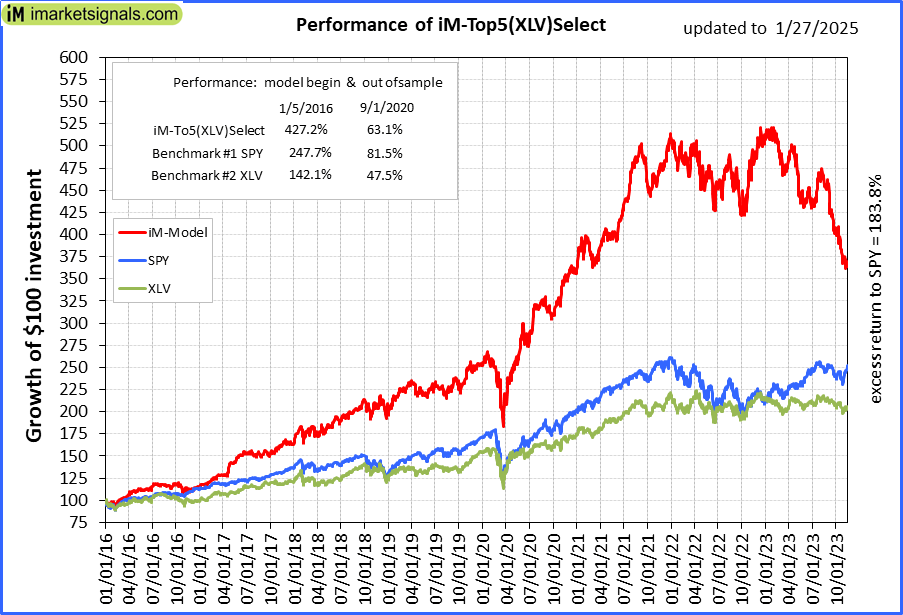 |
iM-Top5(XLV)Select: Since inception, on 1/5/2016, the model gained 426.62% while the benchmark SPY gained 242.86% over the same period. Over the previous week the market value of iM-Top5(XLV)Select gained 4.81% at a time when SPY gained 0.30%. A starting capital of $100,000 at inception on 1/5/2016 would have grown to $526,619 which includes $7,558 cash and excludes $15,583 spent on fees and slippage. |
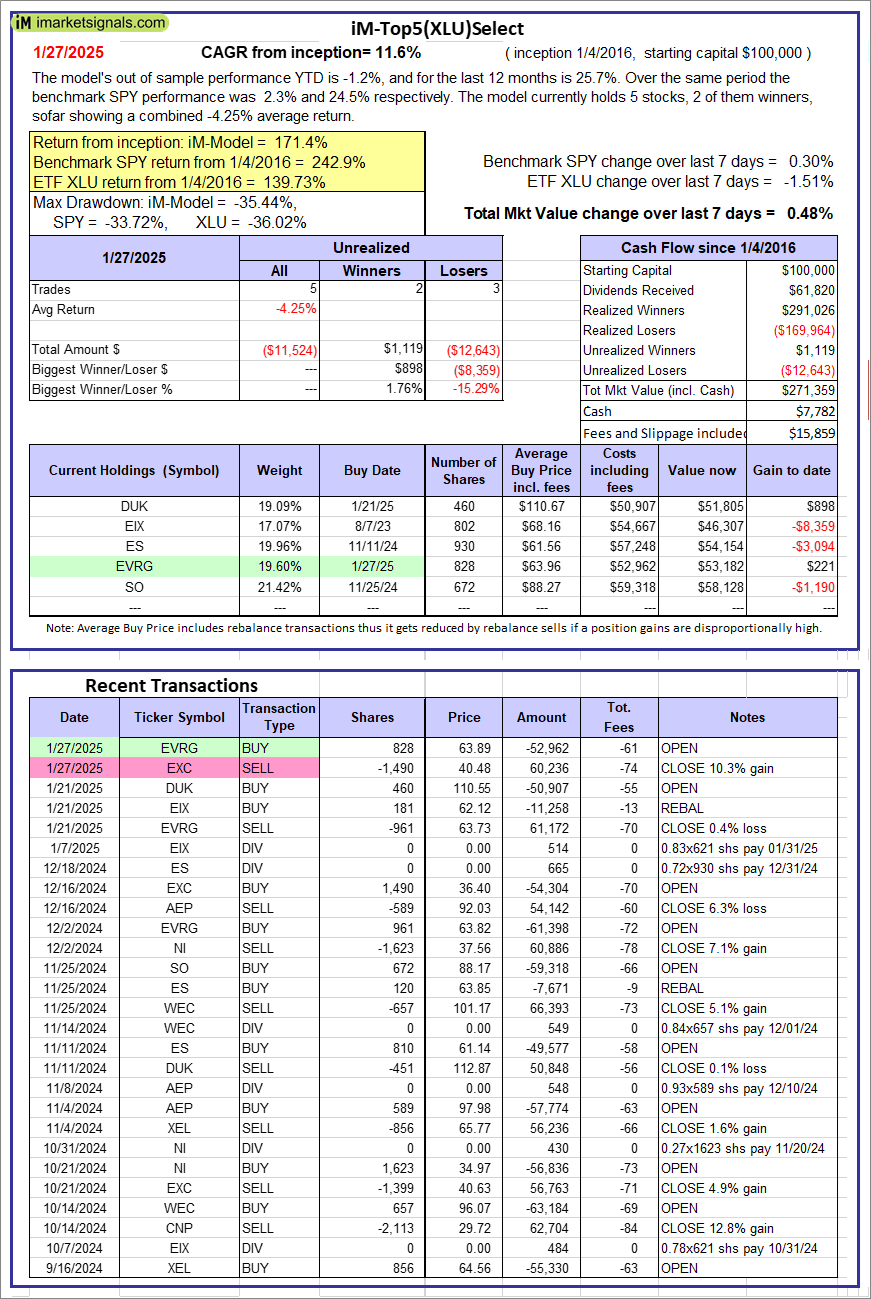 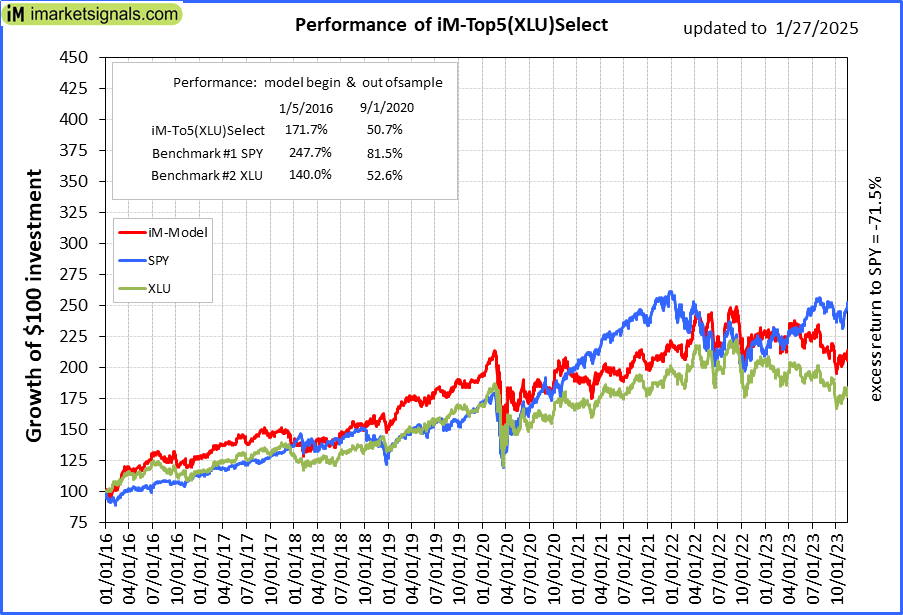 |
iM-Top5(XLU)Select: Since inception, on 1/5/2016, the model gained 171.36% while the benchmark SPY gained 242.86% over the same period. Over the previous week the market value of iM-Top5(XLU)Select gained 0.48% at a time when SPY gained 0.30%. A starting capital of $100,000 at inception on 1/5/2016 would have grown to $271,359 which includes $7,782 cash and excludes $15,859 spent on fees and slippage. |
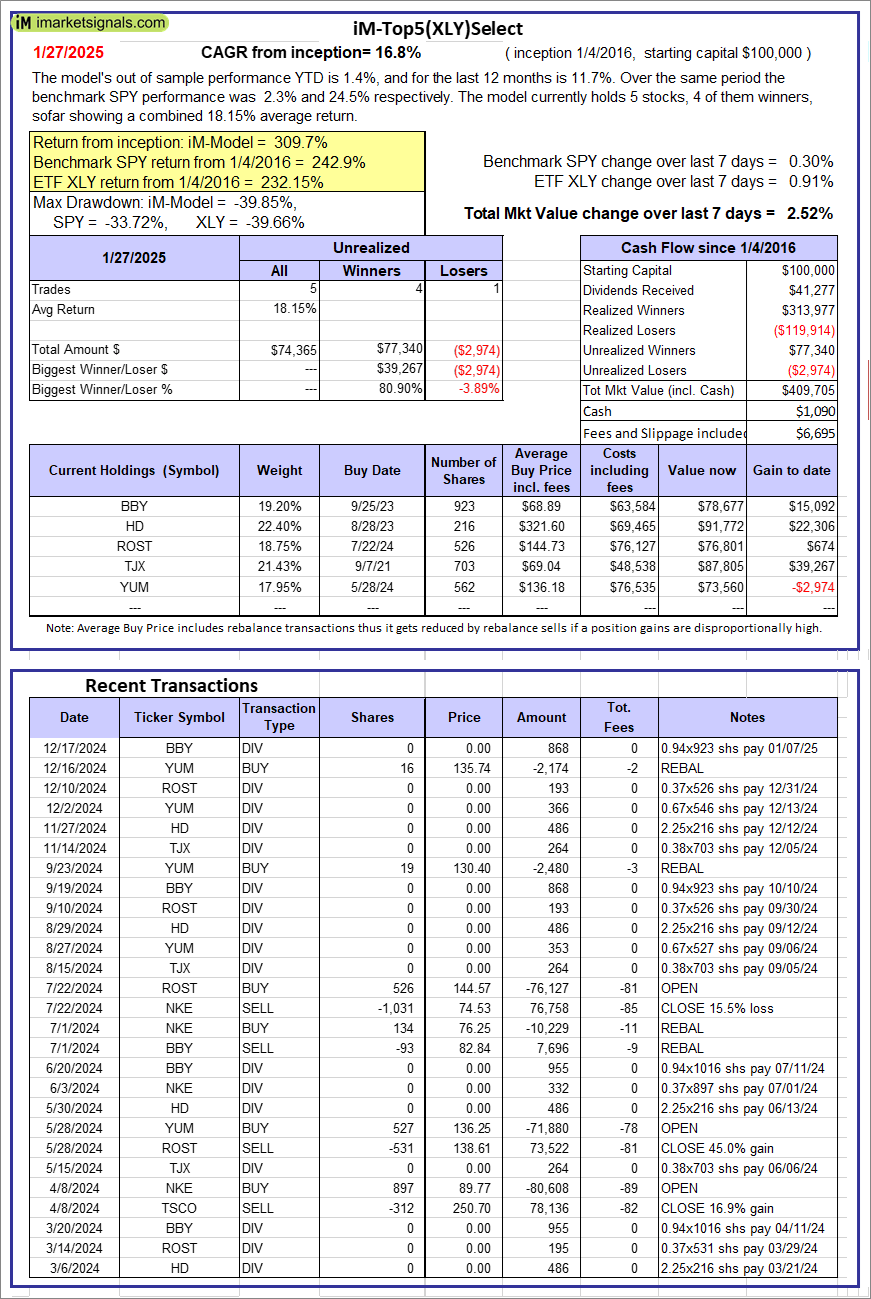 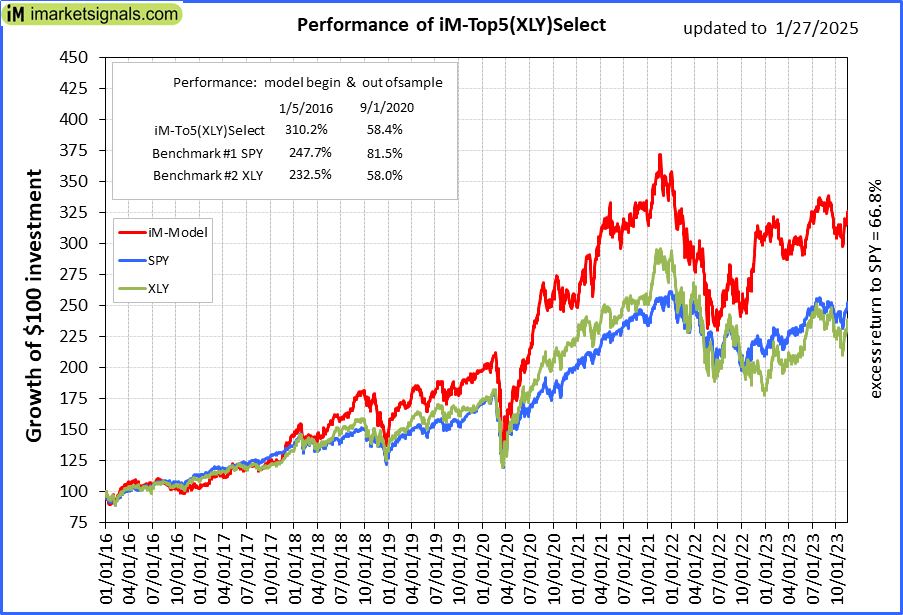 |
iM-Top5(XLY)Select: Since inception, on 1/5/2016, the model gained 309.70% while the benchmark SPY gained 242.86% over the same period. Over the previous week the market value of iM-Top5(XLY)Select gained 2.52% at a time when SPY gained 0.30%. A starting capital of $100,000 at inception on 1/5/2016 would have grown to $409,705 which includes $1,090 cash and excludes $6,695 spent on fees and slippage. |
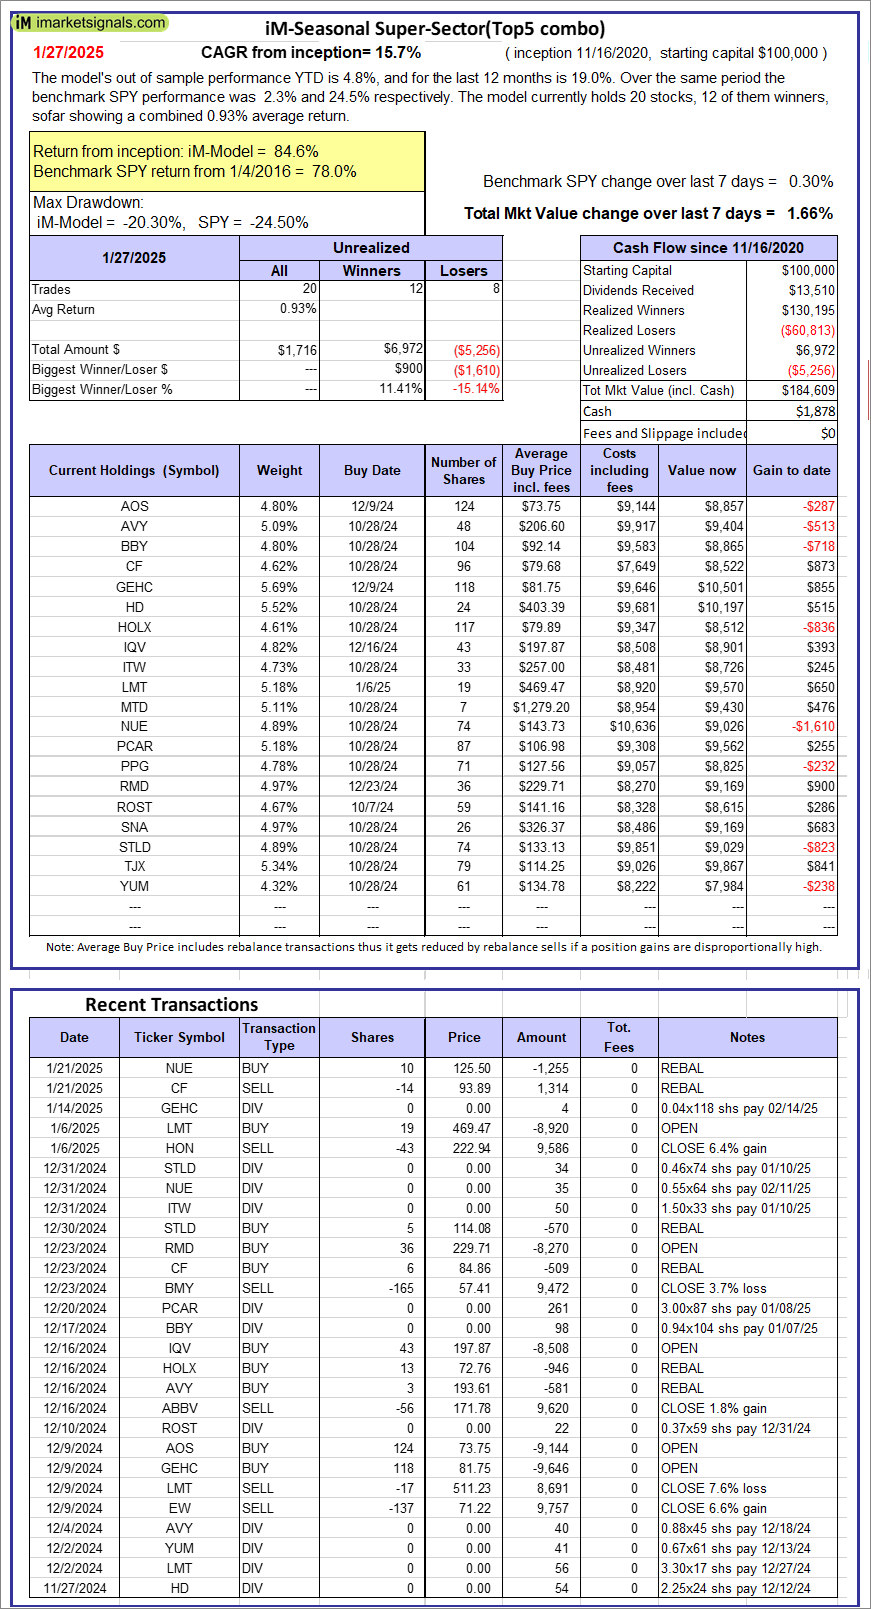 |
iM-Seasonal Super-Sectors (Top5 combo) : Since inception, on 11/17/2020, the model gained 84.61% while the benchmark SPY gained 77.98% over the same period. Over the previous week the market value of iM-Seasonal Super-Sectors (Top5 combo) gained 1.66% at a time when SPY gained 0.30%. A starting capital of $100,000 at inception on 11/17/2020 would have grown to $184,609 which includes $1,878 cash and excludes $00 spent on fees and slippage. |
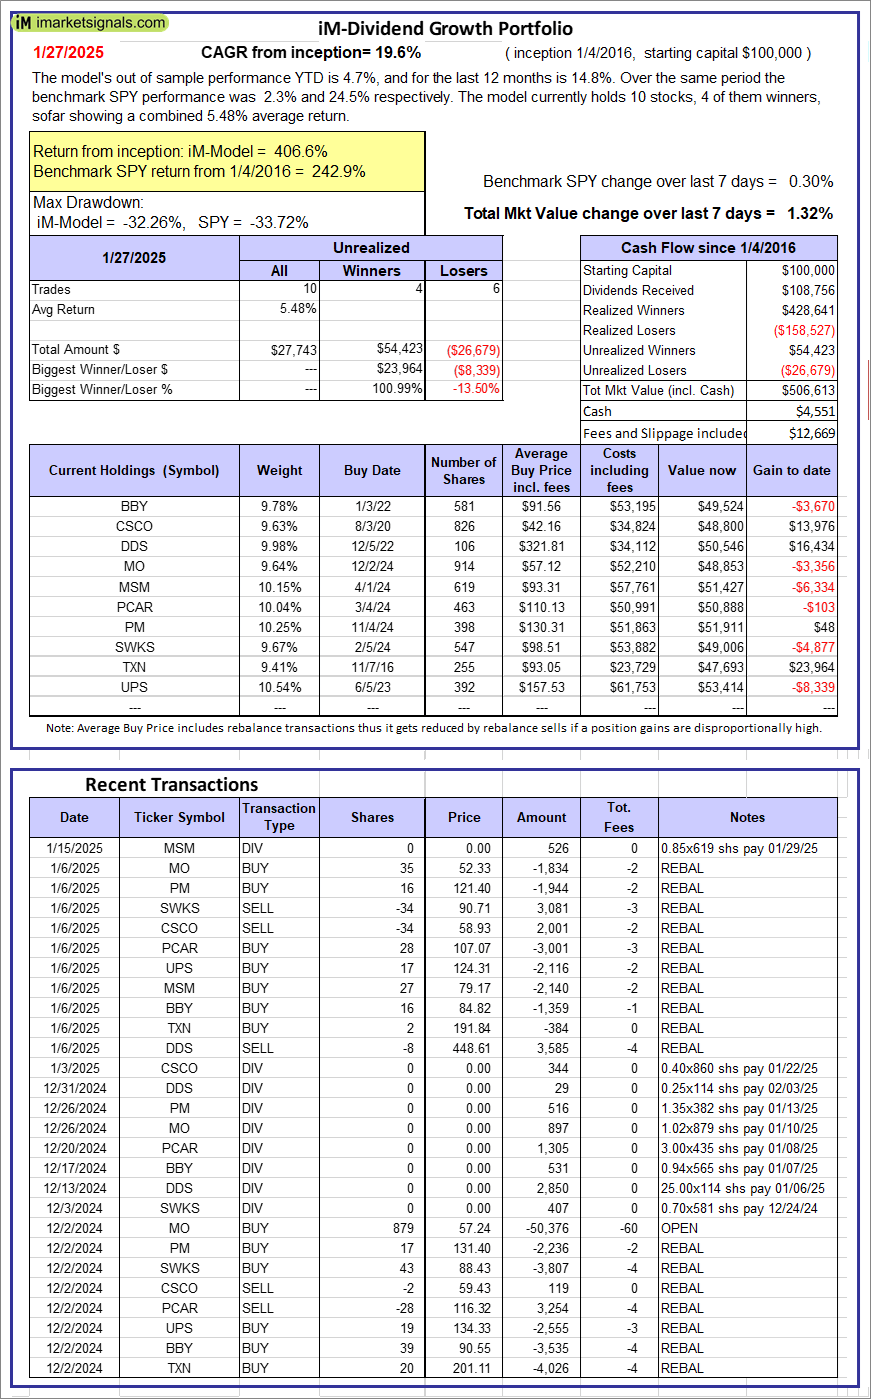 |
iM-Dividend Growth Portfolio: The model’s out of sample performance YTD is 4.7%, and for the last 12 months is 14.8%. Over the same period the benchmark SPY performance was 2.3% and 24.5% respectively. Over the previous week the market value of the iM-Dividend Growth Portfolio gained 1.32% at a time when SPY gained 0.30%. A starting capital of $100,000 at inception on 6/30/2016 would have grown to $506,613 which includes $4,551 cash and excludes $12,669 spent on fees and slippage. |
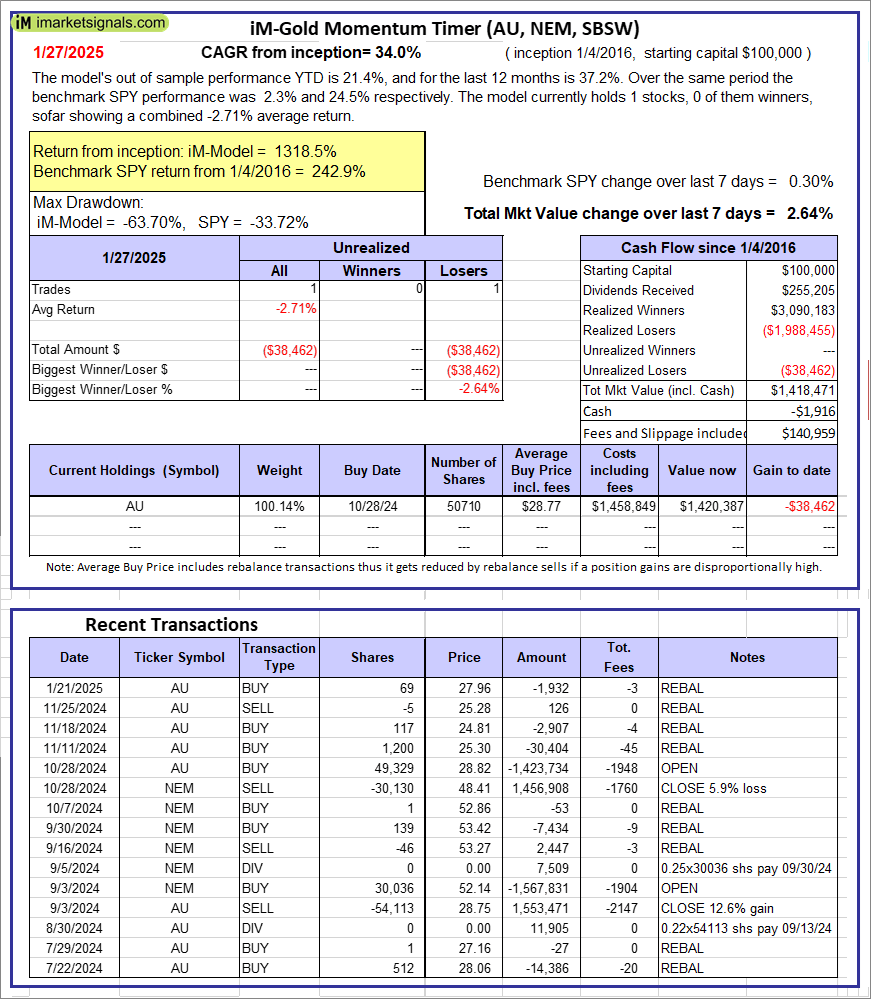 |
iM-Gold Momentum Timer (AU, NEM, SBSW): The model’s out of sample performance YTD is 21.4%, and for the last 12 months is 37.2%. Over the same period the benchmark SPY performance was 2.3% and 24.5% respectively. Over the previous week the market value of iM-Gold Momentum Timer (AU, NEM, SBSW) gained 2.64% at a time when SPY gained 0.30%. A starting capital of $100,000 at inception on 6/30/2016 would have grown to -$1,916 which includes $140,959 cash and excludes Gain to date spent on fees and slippage. |
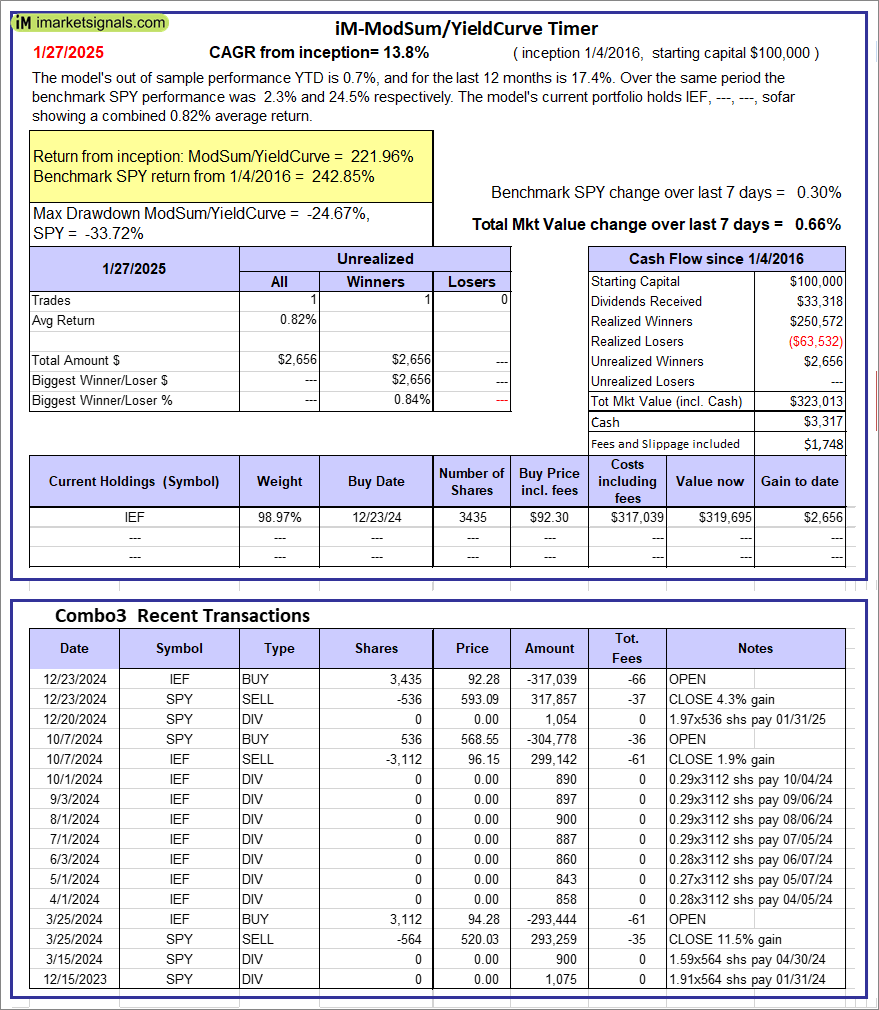 |
iM-ModSum/YieldCurve Timer: The model’s out of sample performance YTD is 0.7%, and for the last 12 months is 17.4%. Over the same period the benchmark SPY performance was 2.3% and 24.5% respectively. Over the previous week the market value of iM-PortSum/YieldCurve Timer gained 0.66% at a time when SPY gained 0.30%. A starting capital of $100,000 at inception on 1/1/2016 would have grown to $323,013 which includes $3,317 cash and excludes $1,748 spent on fees and slippage. |
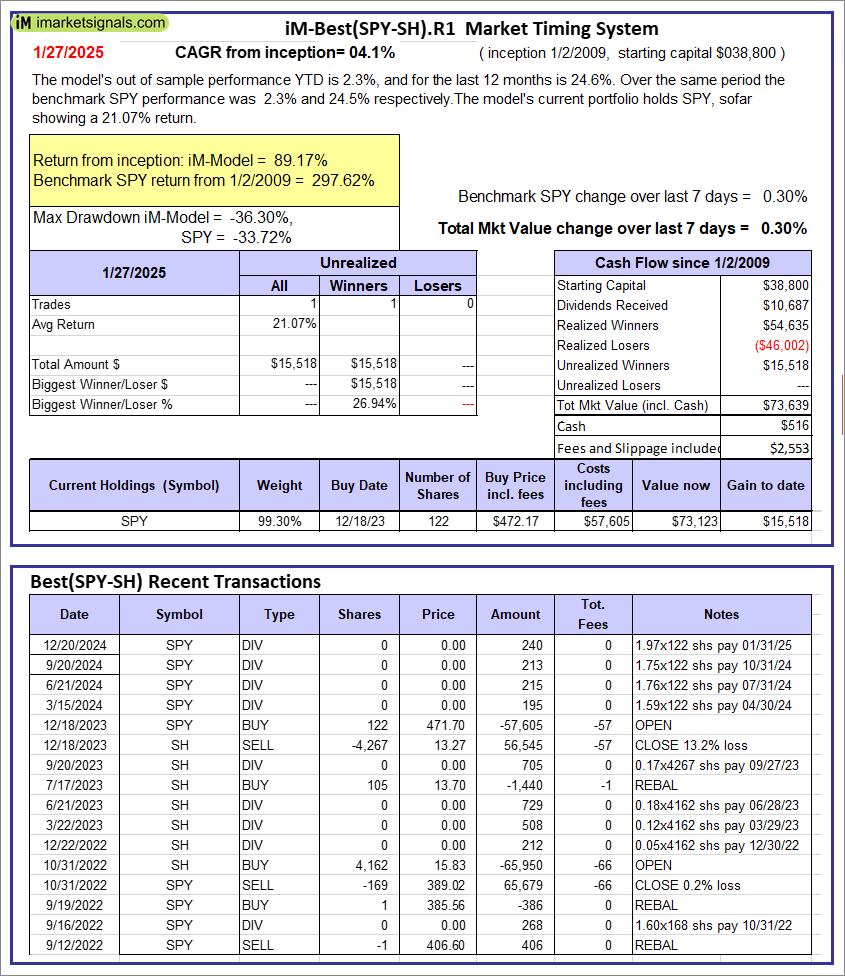 |
iM-Best(SPY-SH).R1: The model’s out of sample performance YTD is 2.3%, and for the last 12 months is 24.6%. Over the same period the benchmark SPY performance was 2.3% and 24.5% respectively. Over the previous week the market value of Best(SPY-SH) gained 0.30% at a time when SPY gained 0.30%. A starting capital of $100,000 at inception on 1/2/2009 would have grown to $73,639 which includes $516 cash and excludes $2,553 spent on fees and slippage. |
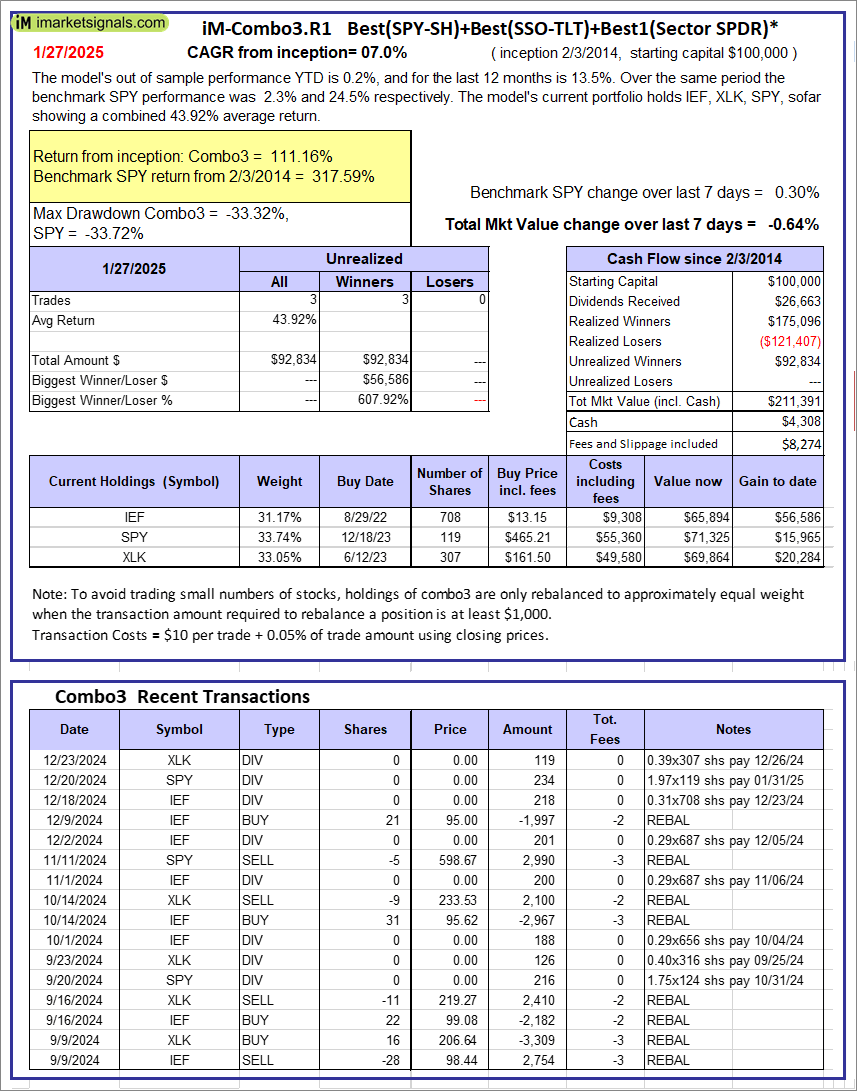 |
iM-Combo3.R1: The model’s out of sample performance YTD is 0.2%, and for the last 12 months is 13.5%. Over the same period the benchmark SPY performance was 2.3% and 24.5% respectively. Over the previous week the market value of iM-Combo3.R1 gained -0.64% at a time when SPY gained 0.30%. A starting capital of $100,000 at inception on 2/3/2014 would have grown to $211,391 which includes $4,308 cash and excludes $8,274 spent on fees and slippage. |
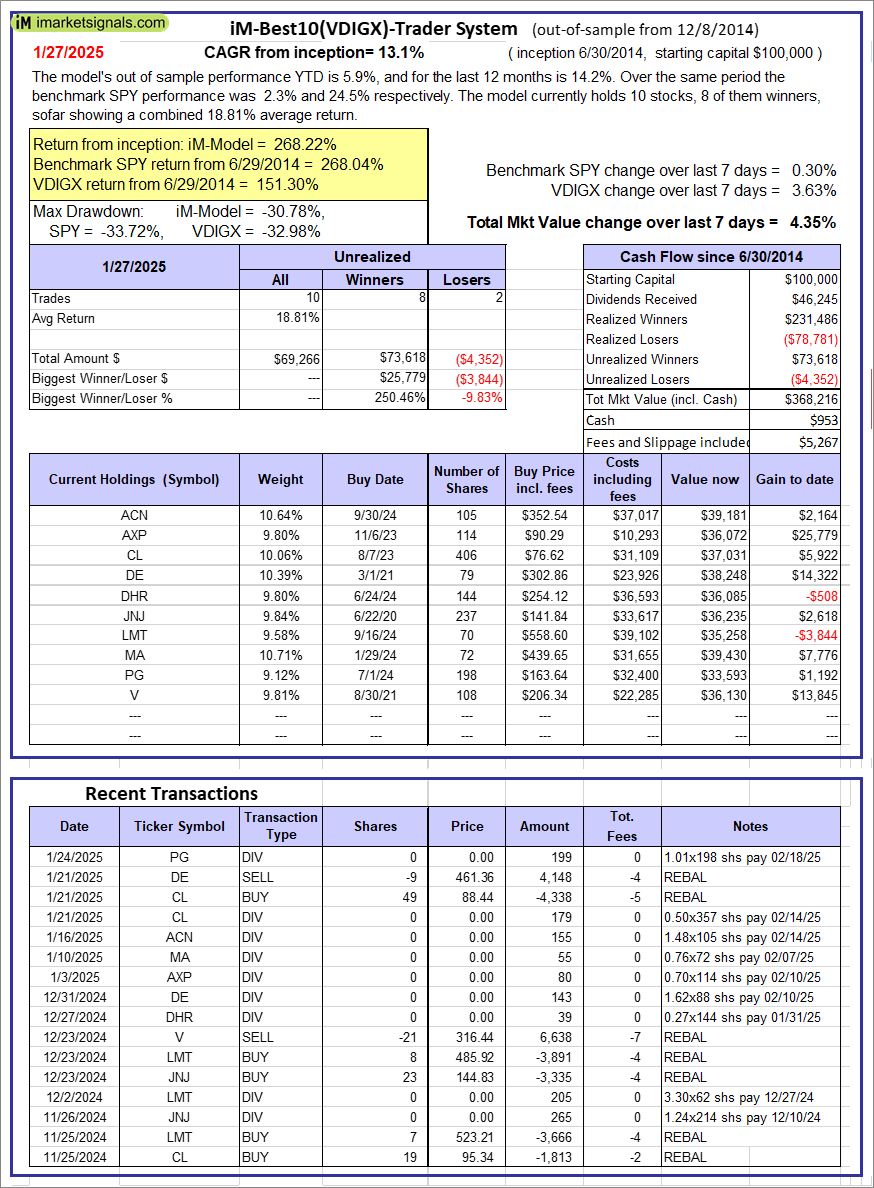 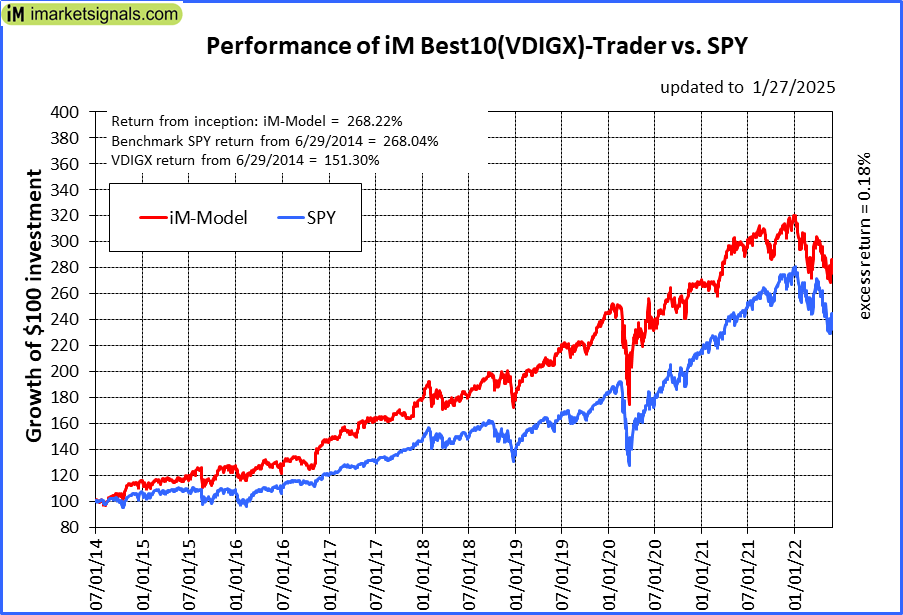 |
iM-Best10(VDIGX)-Trader: The model’s out of sample performance YTD is 5.9%, and for the last 12 months is 14.2%. Over the same period the benchmark SPY performance was 2.3% and 24.5% respectively. Since inception, on 7/1/2014, the model gained 268.22% while the benchmark SPY gained 268.04% and VDIGX gained 151.30% over the same period. Over the previous week the market value of iM-Best10(VDIGX) gained 4.35% at a time when SPY gained 0.30%. A starting capital of $100,000 at inception on 7/1/2014 would have grown to $368,216 which includes $953 cash and excludes $5,267 spent on fees and slippage. |
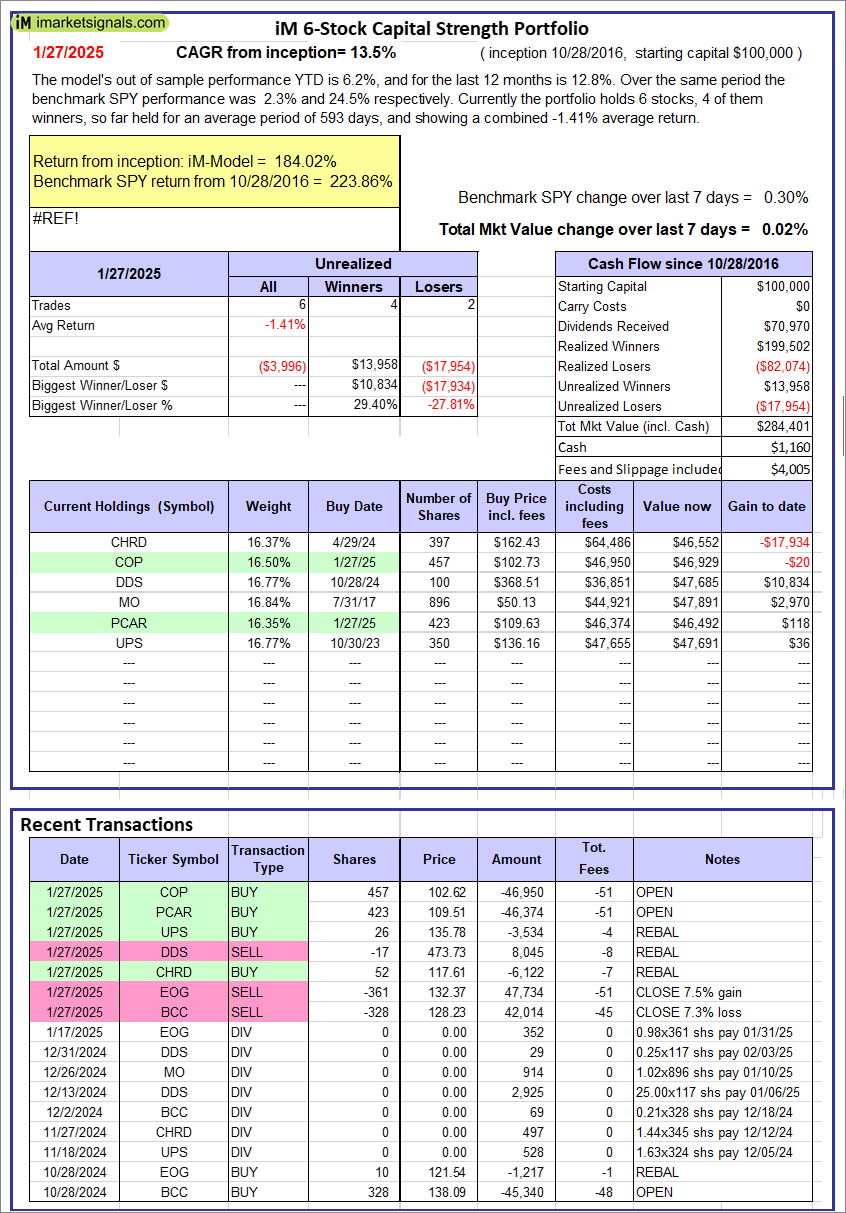 |
iM 6-Stock Capital Strength Portfolio: The model’s out of sample performance YTD is 6.2%, and for the last 12 months is 12.8%. Over the same period the benchmark SPY performance was 2.3% and 24.5% respectively. Over the previous week the market value of the iM 6-Stock Capital Strength Portfolio gained 0.02% at a time when SPY gained 0.30%. A starting capital of $100,000 at inception on 10/28/2016 would have grown to $284,401 which includes $1,160 cash and excludes $4,005 spent on fees and slippage. |
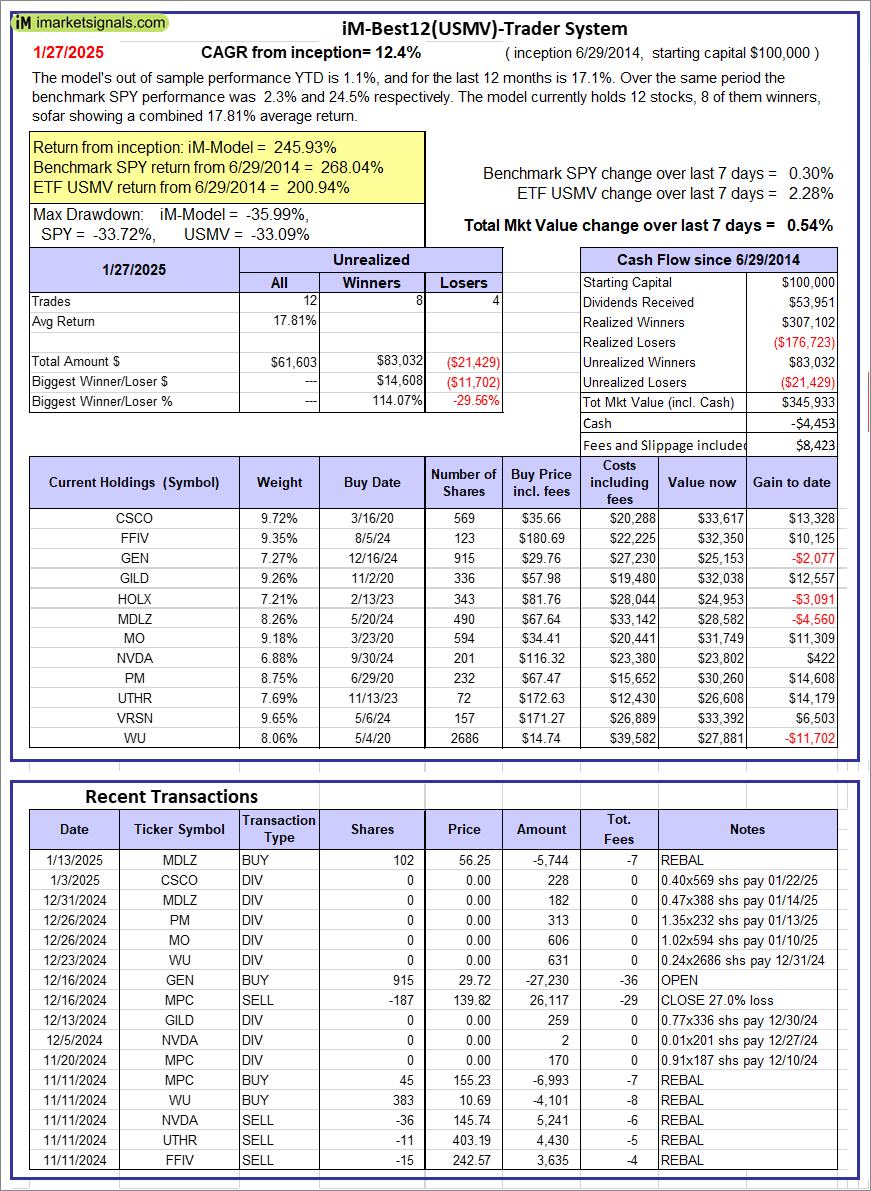 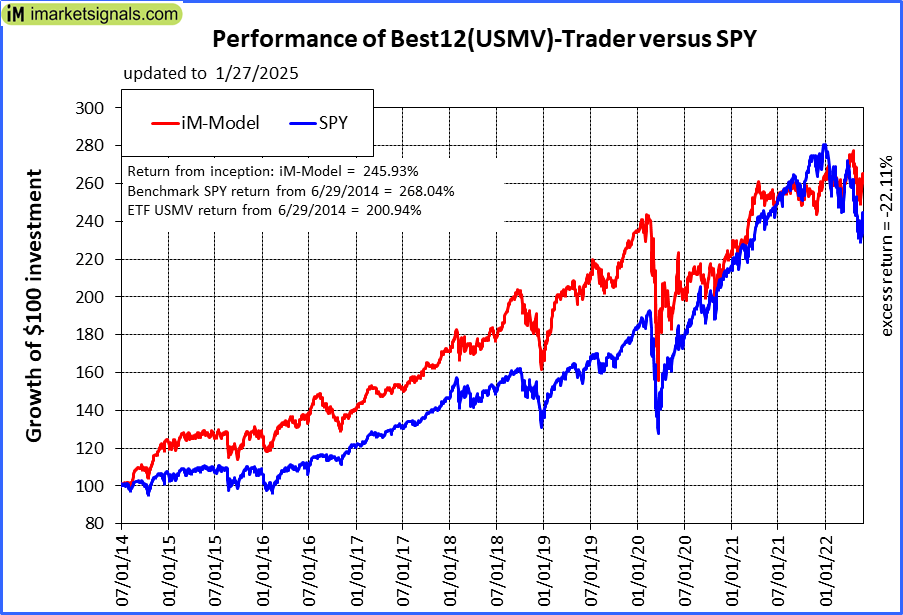 |
iM-Best12(USMV)-Trader: The model’s out of sample performance YTD is 1.1%, and for the last 12 months is 17.1%. Over the same period the benchmark SPY performance was 2.3% and 24.5% respectively. Since inception, on 6/30/2014, the model gained 245.93% while the benchmark SPY gained 268.04% and the ETF USMV gained 200.94% over the same period. Over the previous week the market value of iM-Best12(USMV)-Trader gained 0.54% at a time when SPY gained 0.30%. A starting capital of $100,000 at inception on 6/30/2014 would have grown to $345,933 which includes -$4,453 cash and excludes $8,423 spent on fees and slippage. |
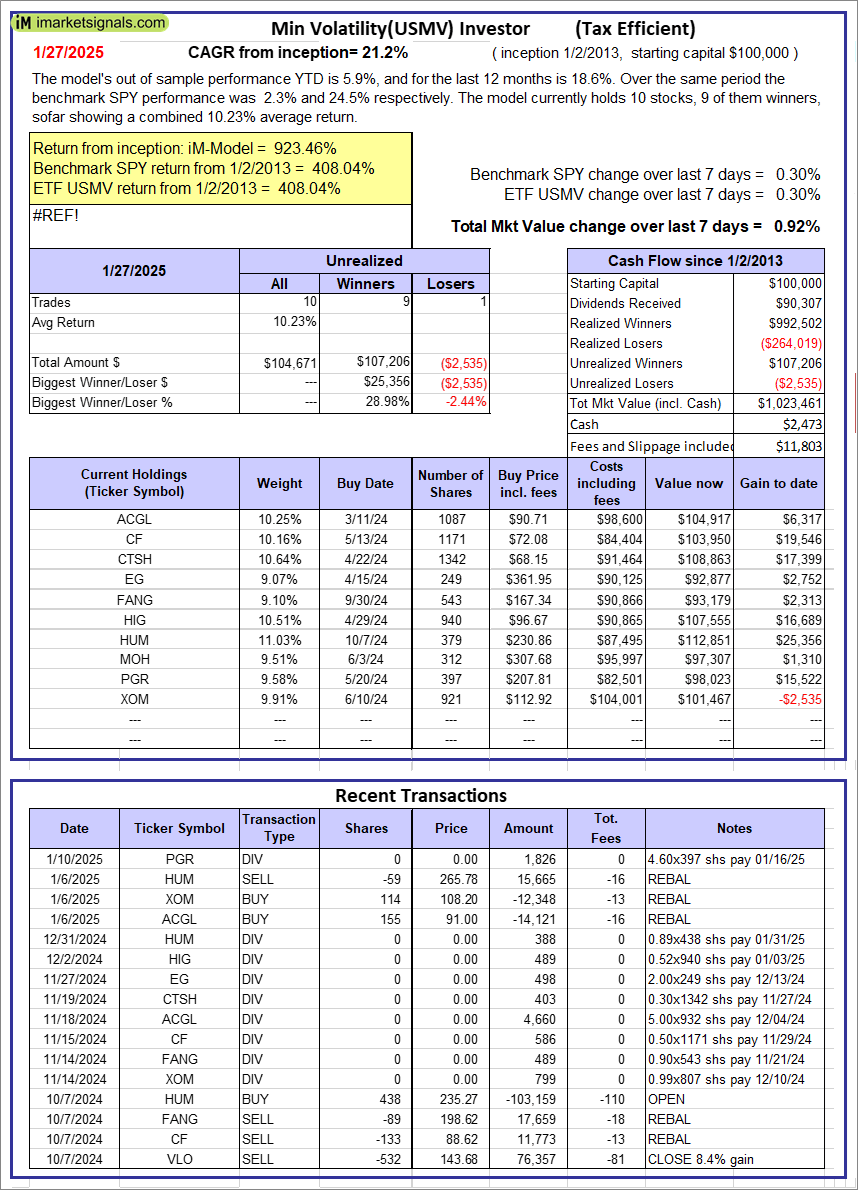 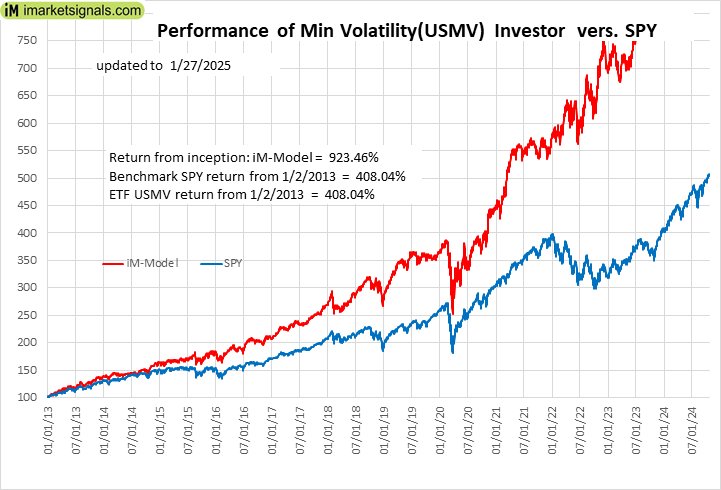 |
iM-Min Volatility(USMV) Investor (Tax Efficient): The model’s out of sample performance YTD is 5.9%, and for the last 12 months is 18.6%. Over the same period the benchmark SPY performance was 2.3% and 24.5% respectively. Since inception, on 1/3/2013, the model gained 923.46% while the benchmark SPY gained 408.04% and the ETF USMV gained 408.04% over the same period. Over the previous week the market value of iM-Best12(USMV)Q1 gained 0.92% at a time when SPY gained 0.30%. A starting capital of $100,000 at inception on 1/3/2013 would have grown to $1,023,461 which includes $2,473 cash and excludes $11,803 spent on fees and slippage. |
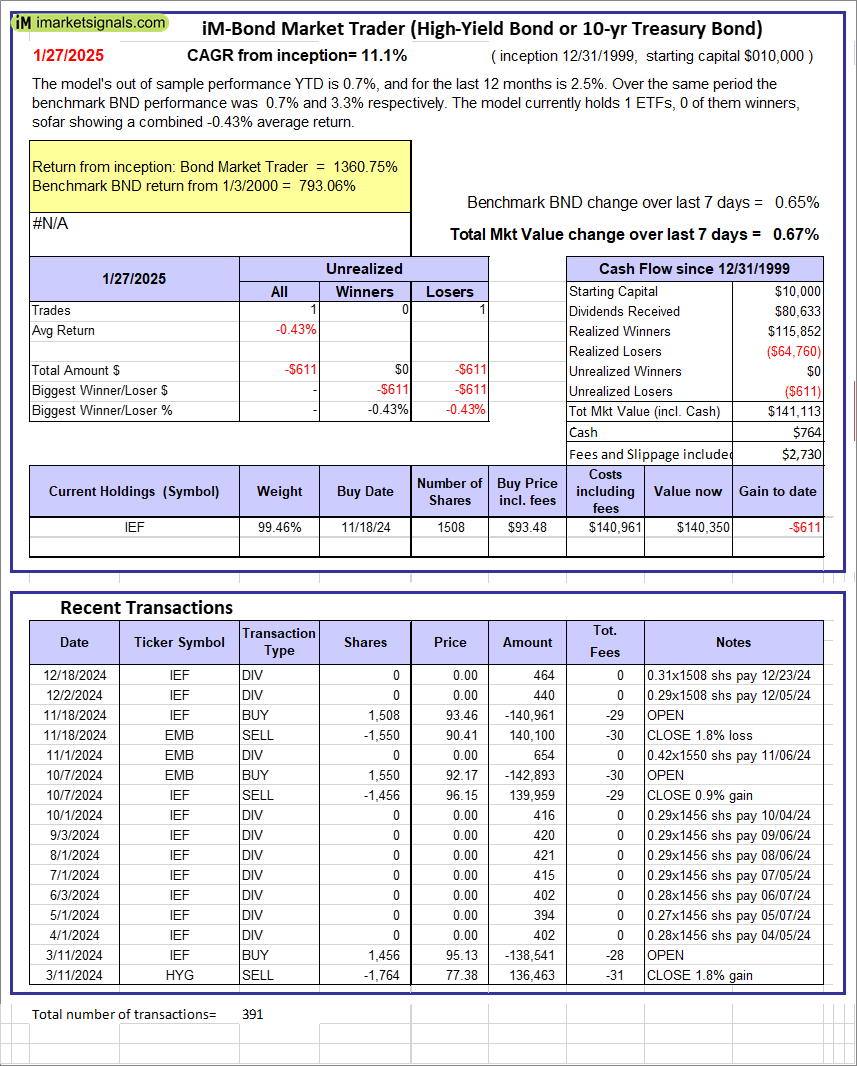 |
iM-Bond Market Trader (High-Yield Bond or 10-yr Treasury Bond): The model’s out of sample performance YTD is 0.7%, and for the last 12 months is 2.5%. Over the same period the benchmark BND performance was 0.7% and 3.3% respectively. Over the previous week the market value of the iM-Bond Market Trader (High-Yield Bond or 10-yr Treasury Bond) gained 0.67% at a time when BND gained 0.65%. A starting capital of $10,000 at inception on 1/3/2000 would have grown to $141,113 which includes $764 cash and excludes $2,730 spent on fees and slippage. |
|
|
iM-ModSum/YieldCurve Timer: The model’s out of sample performance YTD is 0.7%, and for the last 12 months is 17.4%. Over the same period the benchmark SPY performance was 2.3% and 24.5% respectively. Over the previous week the market value of iM-PortSum/YieldCurve Timer gained 0.66% at a time when SPY gained 0.30%. A starting capital of $100,000 at inception on 1/1/2016 would have grown to $323,013 which includes $3,317 cash and excludes $1,748 spent on fees and slippage. |
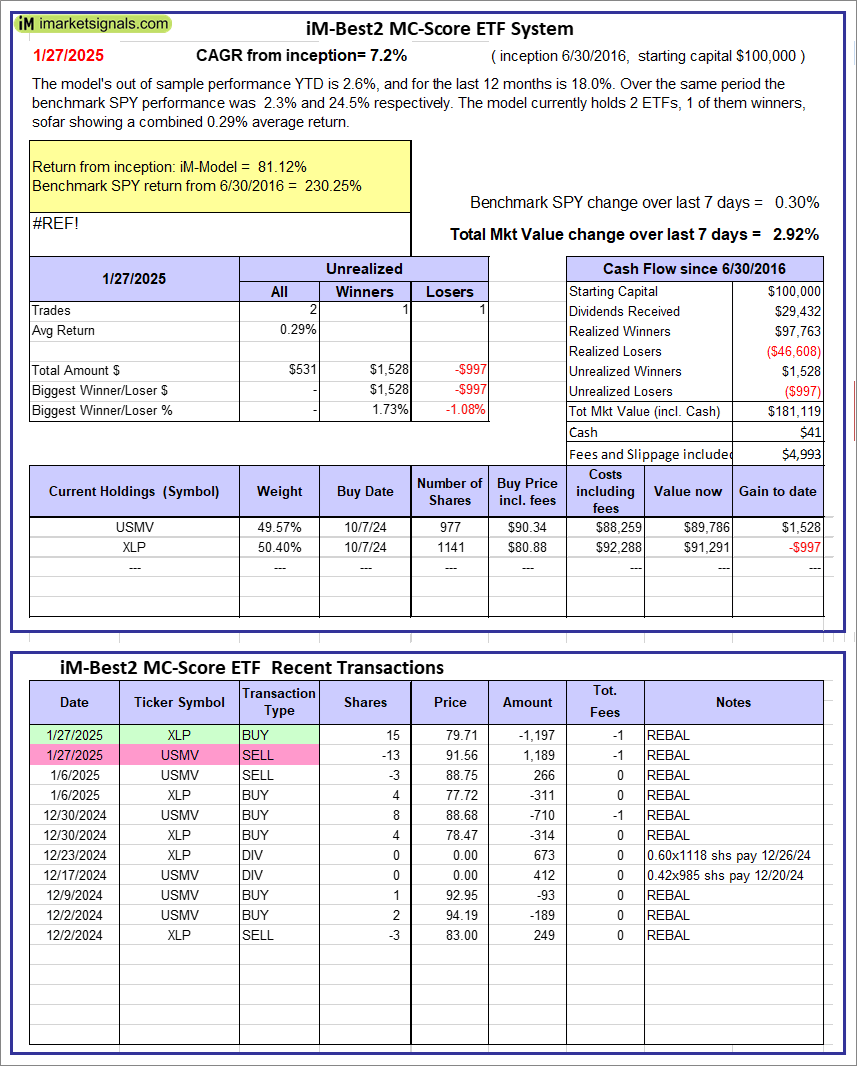 |
iM-Best2 MC-Score ETF System: The model’s out of sample performance YTD is 2.6%, and for the last 12 months is 18.0%. Over the same period the benchmark SPY performance was 2.3% and 24.5% respectively. Over the previous week the market value of the iM-Best2 MC-Score ETF System gained 2.92% at a time when SPY gained 0.30%. A starting capital of $100,000 at inception on 6/30/2016 would have grown to $181,119 which includes $41 cash and excludes $4,993 spent on fees and slippage. |
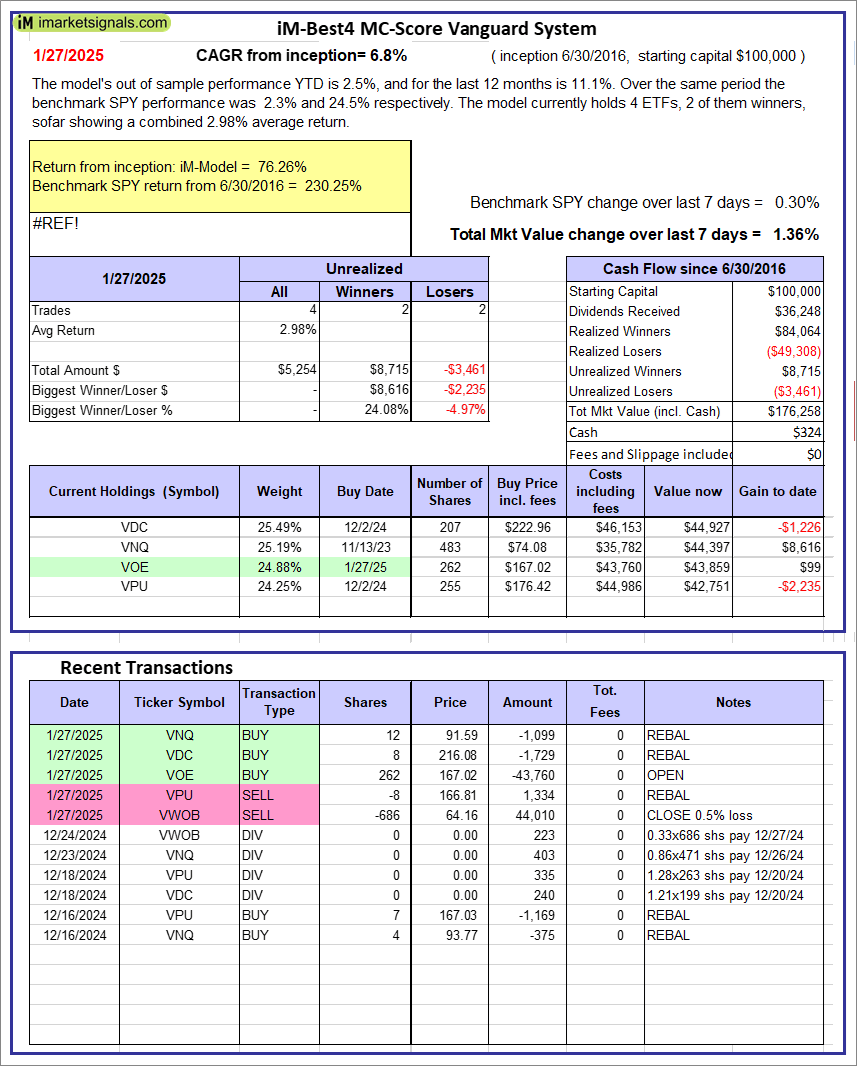 |
iM-Best4 MC-Score Vanguard System: The model’s out of sample performance YTD is 2.5%, and for the last 12 months is 11.1%. Over the same period the benchmark SPY performance was 2.3% and 24.5% respectively. Over the previous week the market value of the iM-Best4 MC-Score Vanguard System gained 1.36% at a time when SPY gained 0.30%. A starting capital of $100,000 at inception on 6/30/2016 would have grown to $176,258 which includes $324 cash and excludes $00 spent on fees and slippage. |
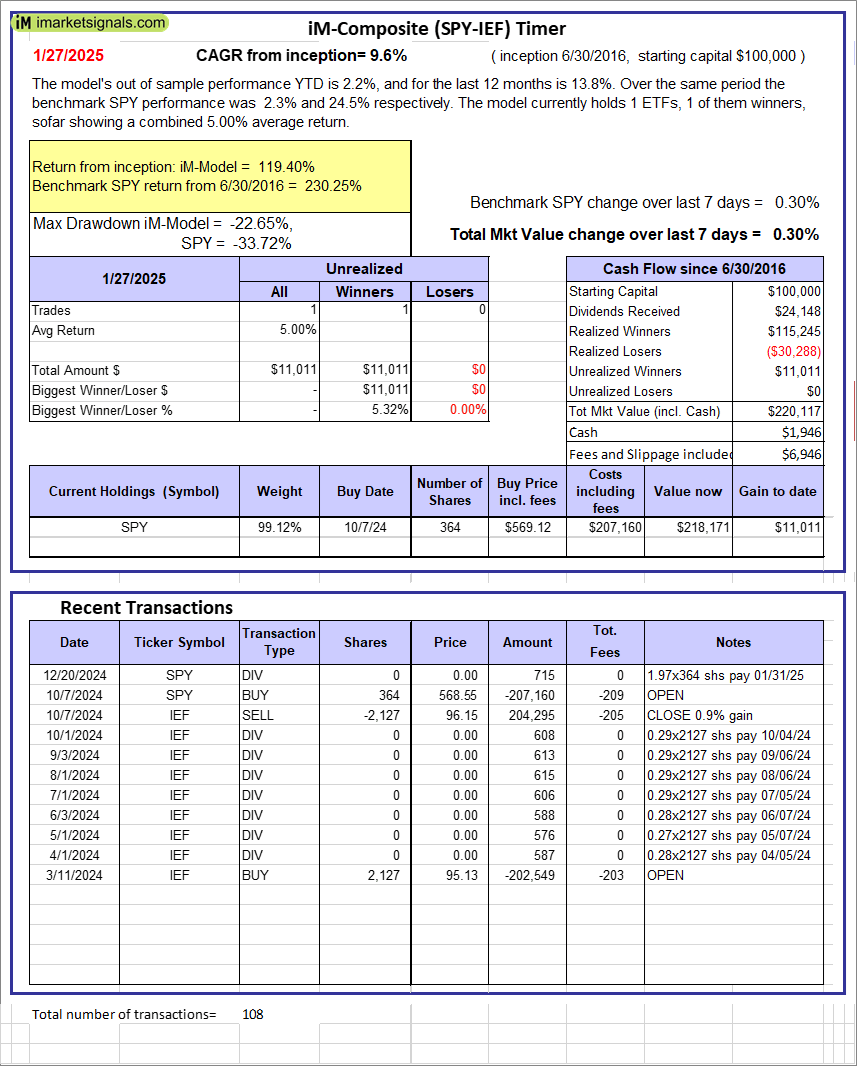 |
iM-Composite (SPY-IEF) Timer: The model’s out of sample performance YTD is 2.2%, and for the last 12 months is 13.8%. Over the same period the benchmark SPY performance was 2.3% and 24.5% respectively. Over the previous week the market value of the iM-Composite (SPY-IEF) Timer gained 0.30% at a time when SPY gained 0.30%. A starting capital of $100,000 at inception on 6/30/2016 would have grown to $220,117 which includes $1,946 cash and excludes $6,946 spent on fees and slippage. |
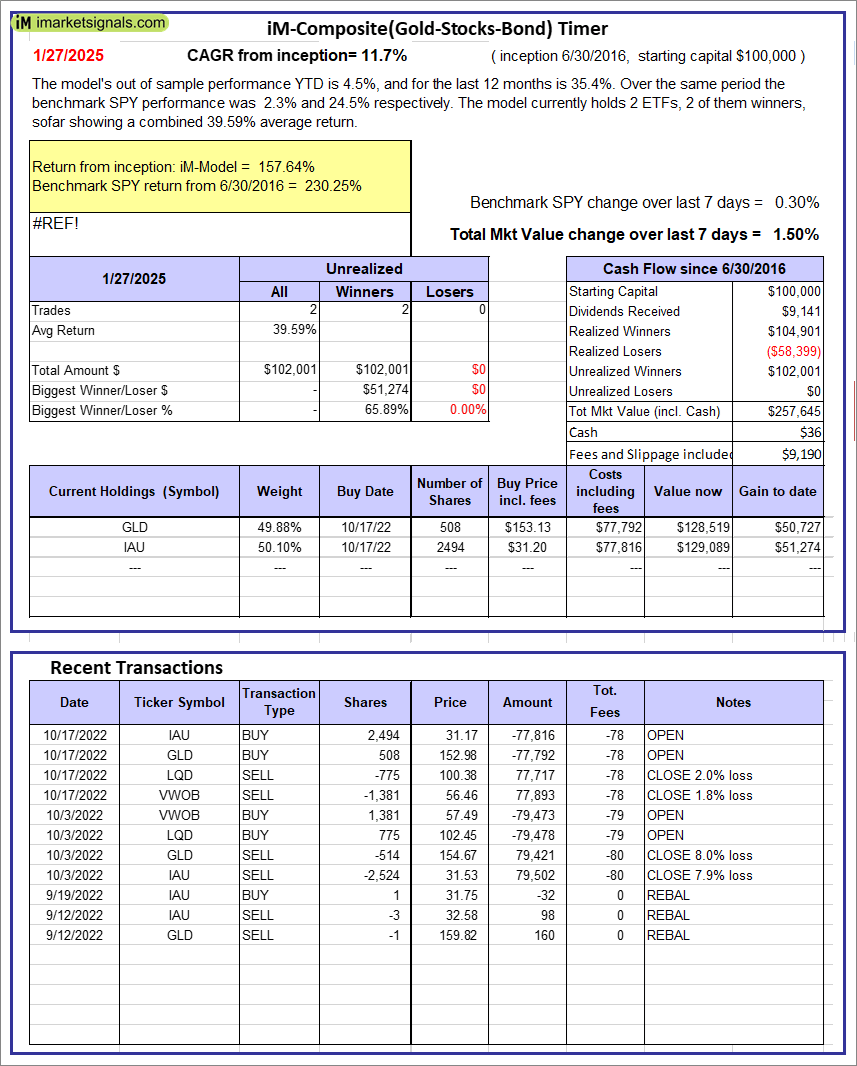 |
iM-Composite(Gold-Stocks-Bond) Timer: The model’s out of sample performance YTD is 4.5%, and for the last 12 months is 35.4%. Over the same period the benchmark SPY performance was 2.3% and 24.5% respectively. Over the previous week the market value of the iM-Composite(Gold-Stocks-Bond) Timer gained 1.50% at a time when SPY gained 0.30%. A starting capital of $100,000 at inception on 6/30/2016 would have grown to $257,645 which includes $36 cash and excludes $9,190 spent on fees and slippage. |
iM-Best Reports – 1/27/2025
Posted in pmp SPY-SH
Leave a Reply
You must be logged in to post a comment.