
  |
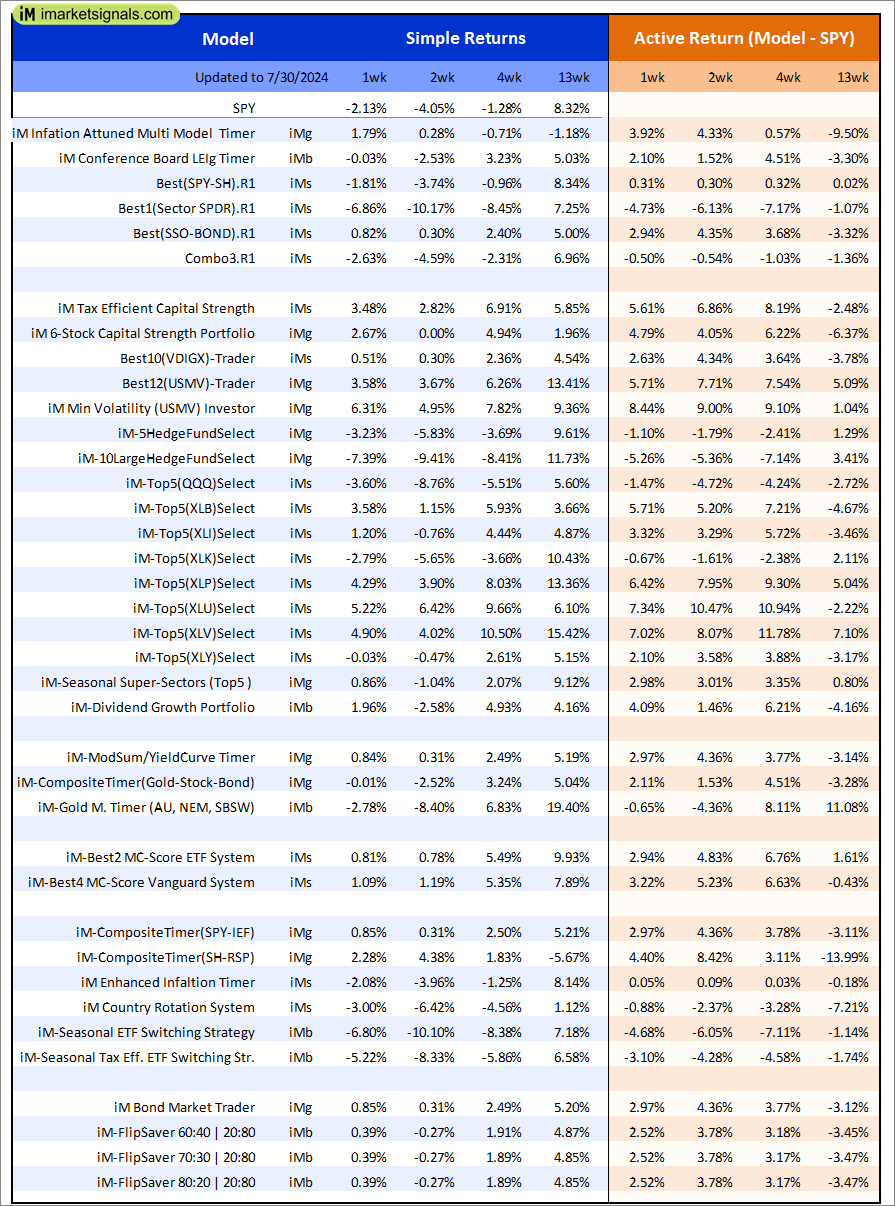
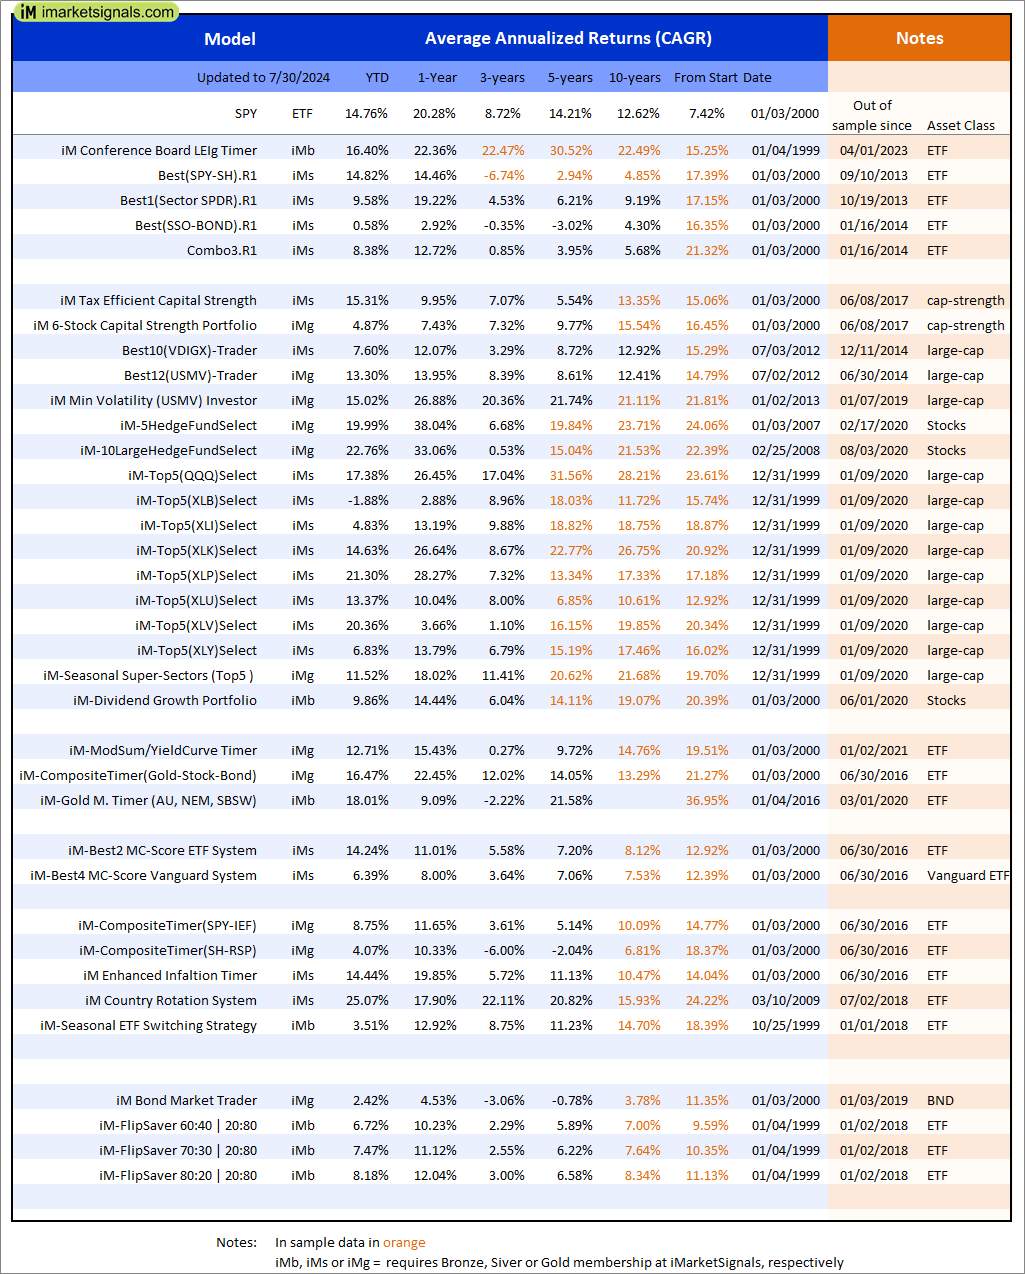
Out of sample performance summary of our models for the past 1, 2, 4 and 13 week periods. The active active return indicates how the models over- or underperformed the benchmark ETF SPY. Also the YTD, and the 1-, 3-, 5- and 10-year annualized returns are shown in the second table |
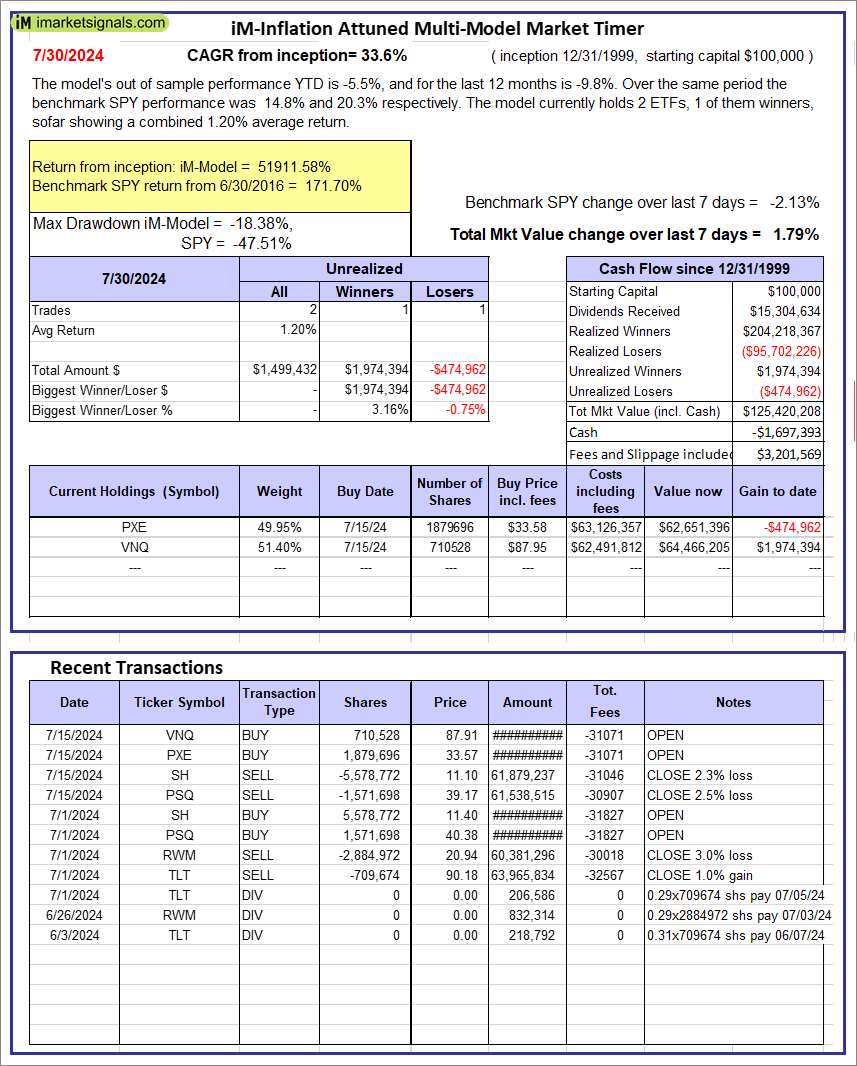 |
iM-Inflation Attuned Multi-Model Market Timer: The model’s out of sample performance YTD is -5.5%, and for the last 12 months is -9.8%. Over the same period the benchmark SPY performance was 14.8% and 20.3% respectively. Over the previous week the market value of the iM-Inflation Attuned Multi-Model Market Timer gained 1.79% at a time when SPY gained -2.13%. A starting capital of $100,000 at inception on 3/24/2017 would have grown to $125,420,208 which includes -$1,697,393 cash and excludes $3,201,569 spent on fees and slippage. |
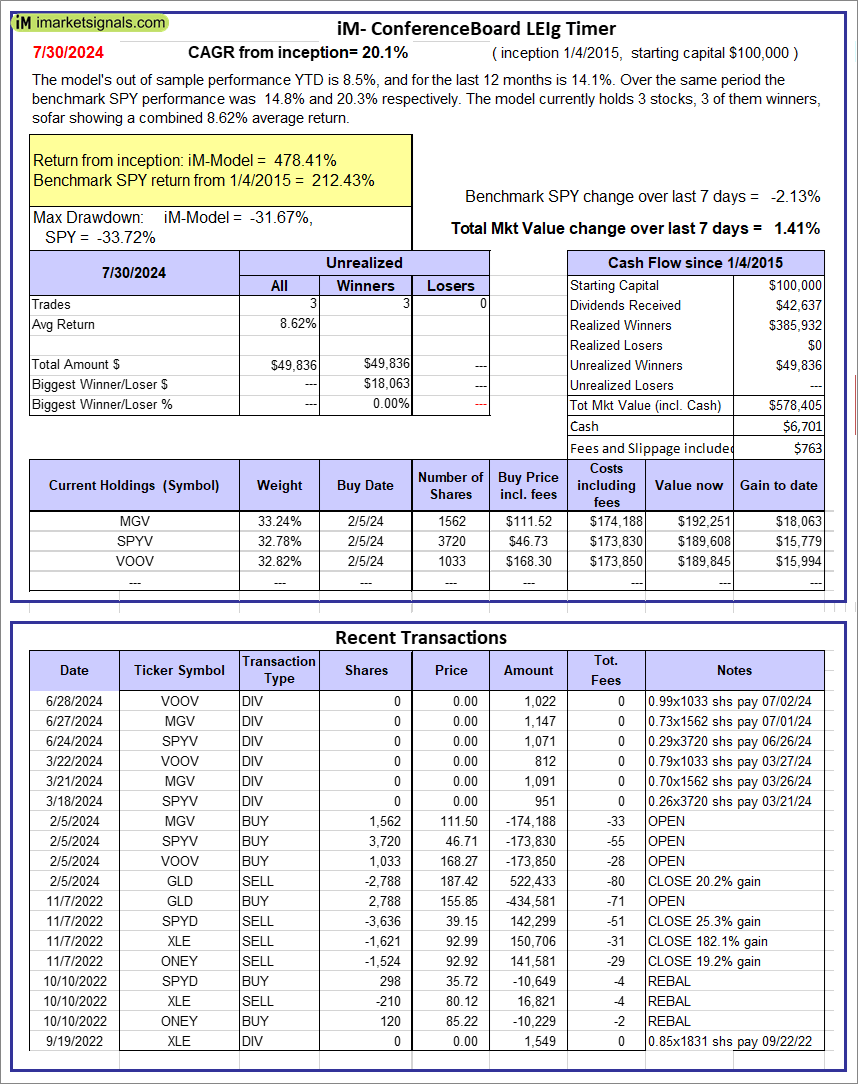 |
iM-Conference Board LEIg Timer: The model’s performance YTD is 14.3%, and for the last 12 months is 7.3%. Over the same period the benchmark SPY performance was 20.1% and 9.4% respectively. Over the previous week the market value of the iM-Conference Board LEIg Timer gained 1.41% at a time when SPY gained -2.13%. A starting capital of $100,000 at inception on 4/5/2017 would have grown to $578,405 which includes $6,701 cash and excludes $763 spent on fees and slippage. |
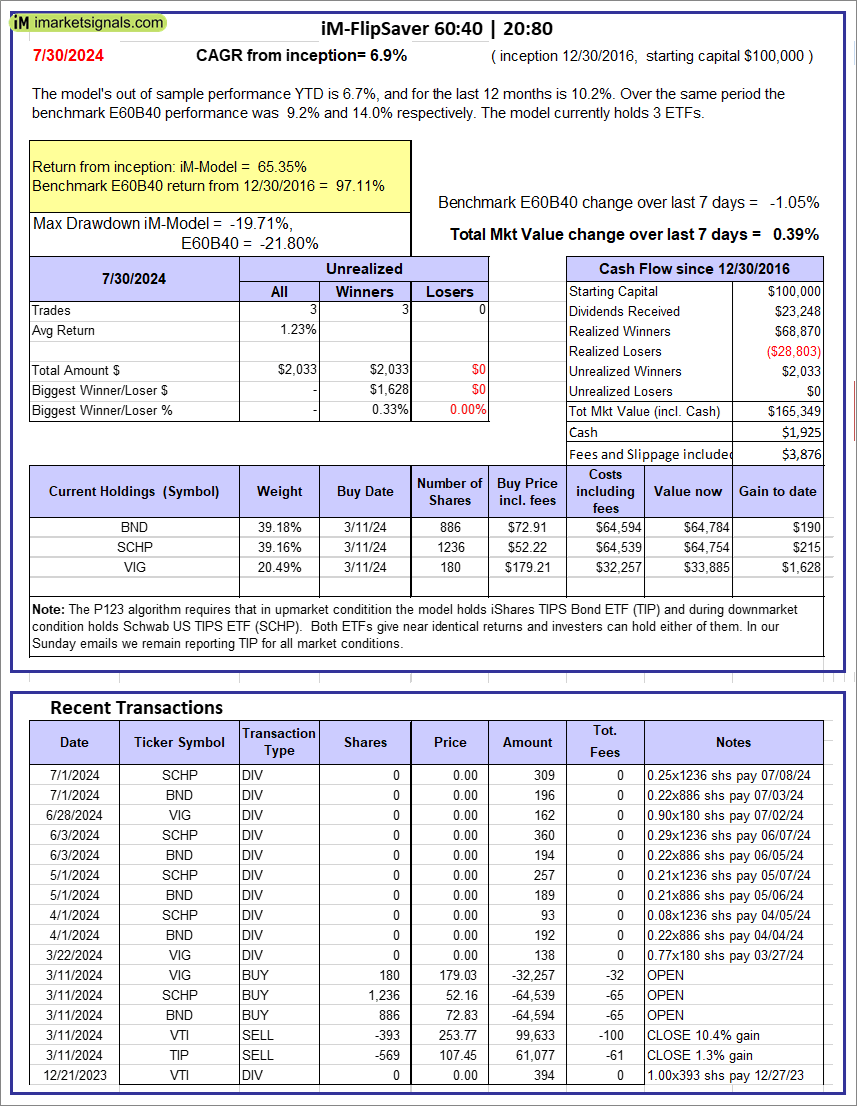 |
iM-FlipSaver 60:40 | 20:80 – 2017: The model’s out of sample performance YTD is 6.7%, and for the last 12 months is 10.2%. Over the same period the benchmark E60B40 performance was 9.2% and 14.0% respectively. Over the previous week the market value of iM-FlipSaver 80:20 | 20:80 gained 0.39% at a time when SPY gained -1.05%. A starting capital of $100,000 at inception on 7/16/2015 would have grown to $165,349 which includes $1,925 cash and excludes $3,876 spent on fees and slippage. |
 |
iM-FlipSaver 70:30 | 20:80 – 2017: The model’s out of sample performance YTD is 7.5%, and for the last 12 months is 11.1%. Over the same period the benchmark E60B40 performance was 9.2% and 14.0% respectively. Over the previous week the market value of iM-FlipSaver 70:30 | 20:80 gained 0.39% at a time when SPY gained -1.05%. A starting capital of $100,000 at inception on 7/15/2015 would have grown to $172,285 which includes $1,926 cash and excludes $4,076 spent on fees and slippage. |
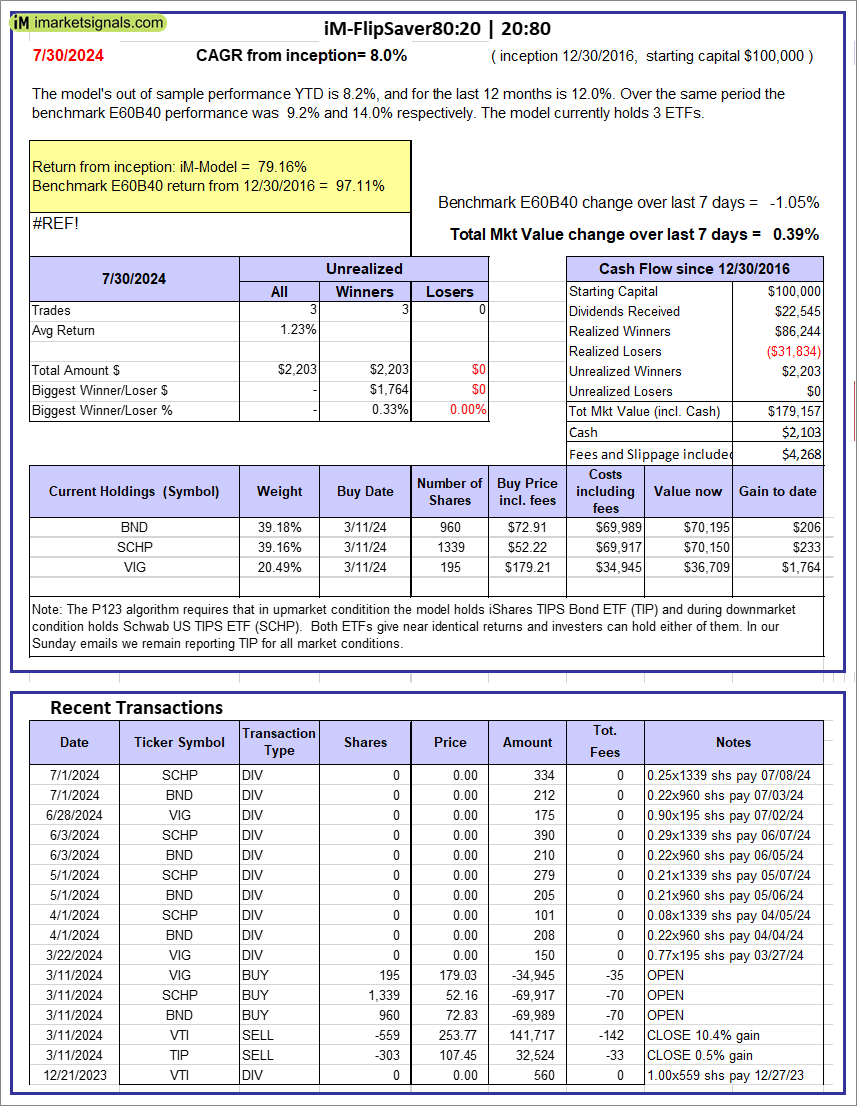 |
iM-FlipSaver 80:20 | 20:80 – 2017: The model’s out of sample performance YTD is 8.2%, and for the last 12 months is 12.0%. Over the same period the benchmark E60B40 performance was 9.2% and 14.0% respectively. Over the previous week the market value of iM-FlipSaver 80:20 | 20:80 gained 0.39% at a time when SPY gained -1.05%. A starting capital of $100,000 at inception on 1/2/2017 would have grown to $179,157 which includes $2,103 cash and excludes $4,268 spent on fees and slippage. |
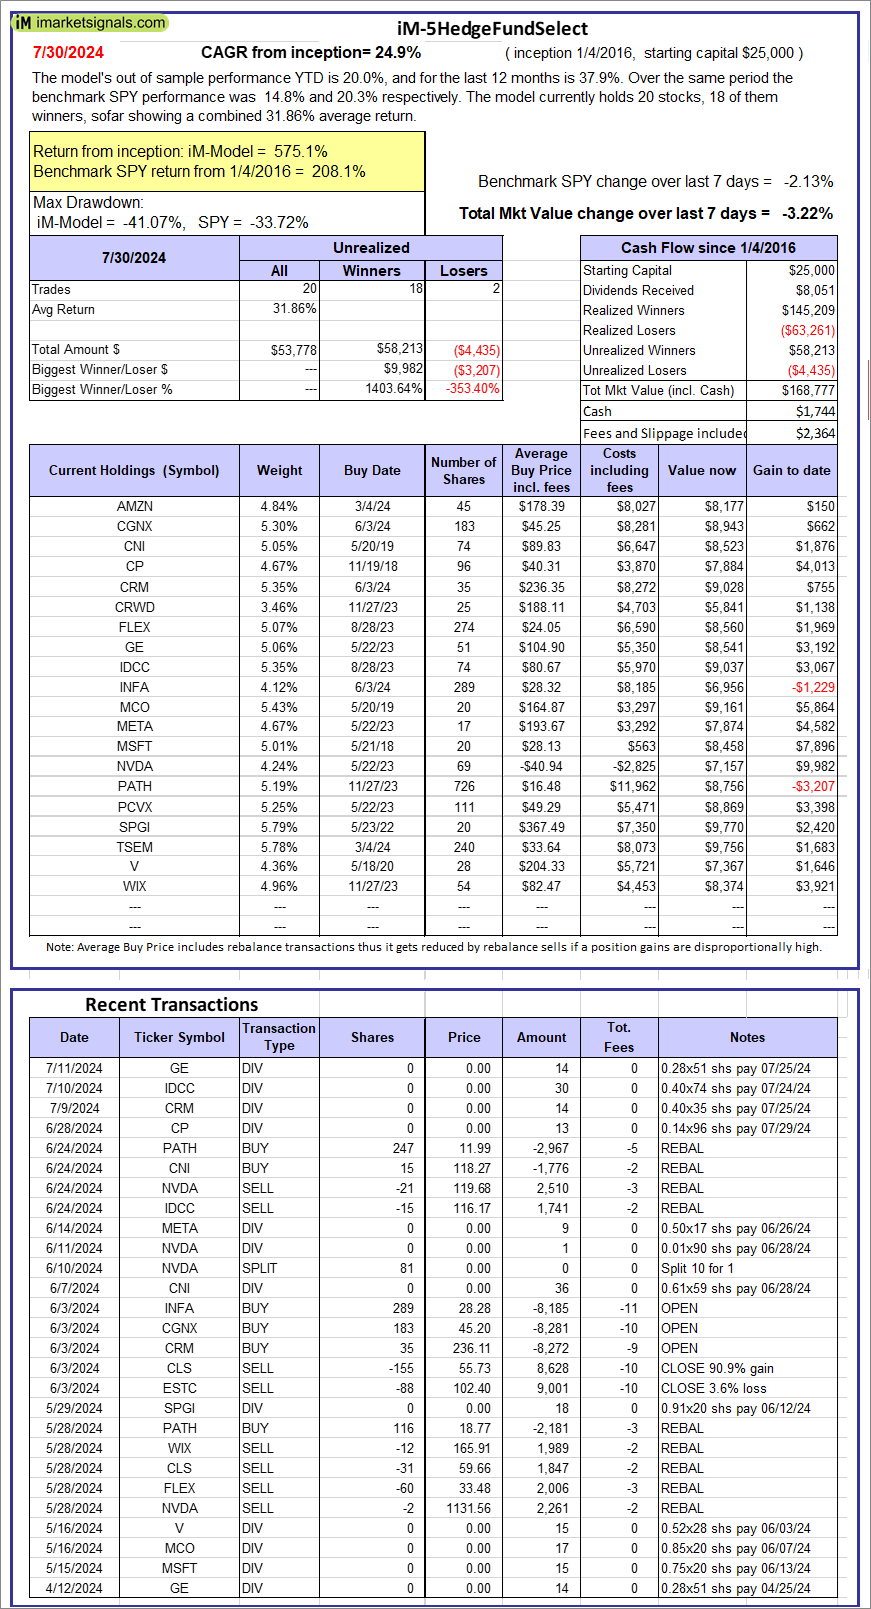 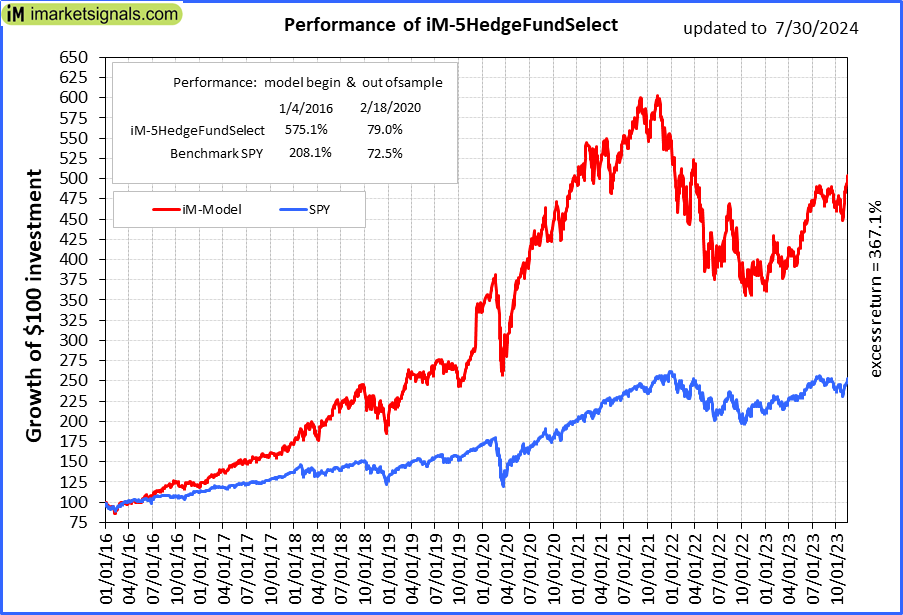 |
iM-5HedgeFundSelect: Since inception, on 1/5/2016, the model gained 575.11% while the benchmark SPY gained 208.06% over the same period. Over the previous week the market value of iM-5HedgeFundSelect gained -3.22% at a time when SPY gained -2.13%. A starting capital of $25,000 at inception on 1/5/2016 would have grown to $168,777 which includes $1,744 cash and excludes $2,364 spent on fees and slippage. |
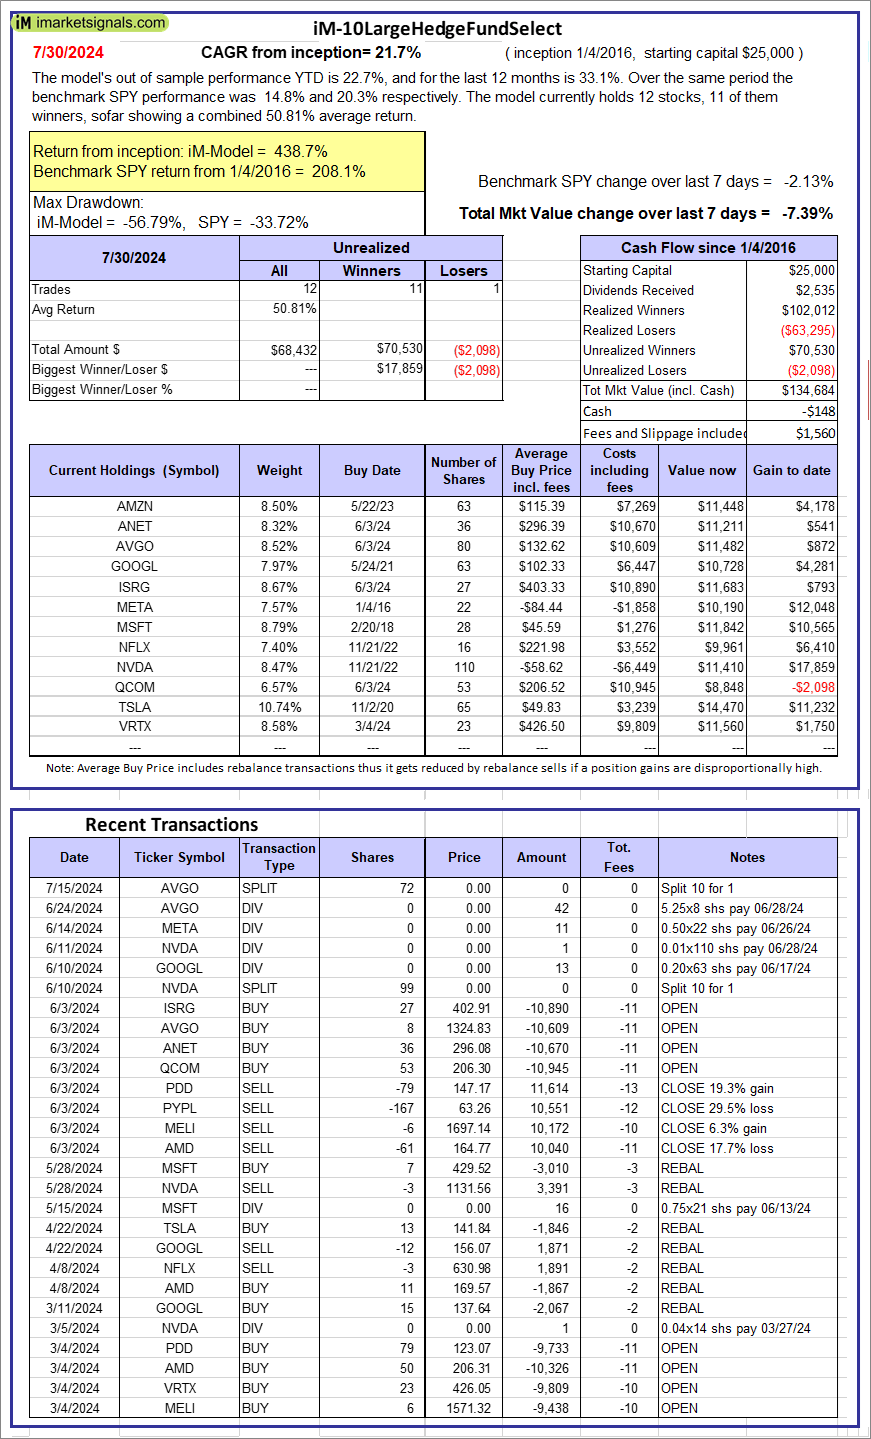 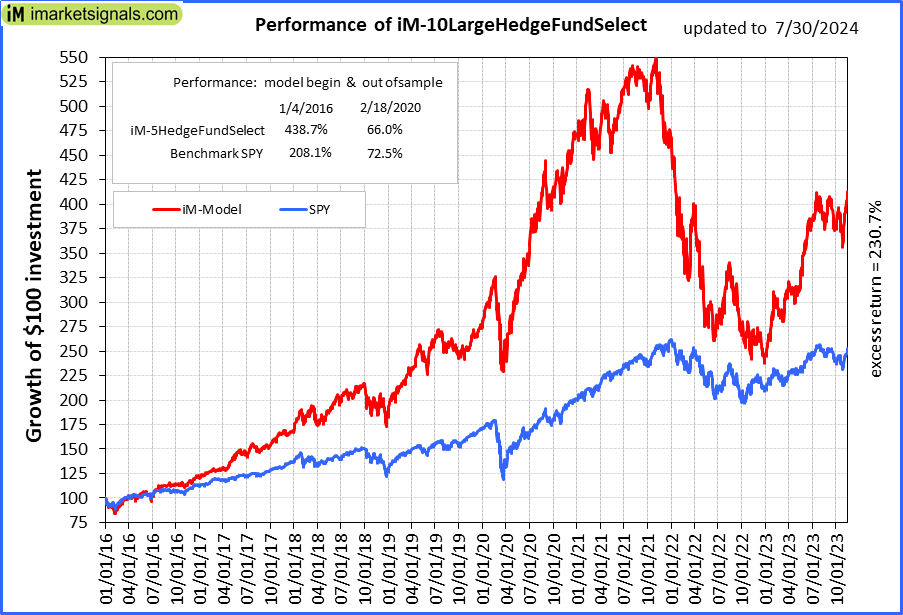 |
iM-10LargeHedgeFundSelect: Since inception, on 1/5/2016, the model gained 438.74% while the benchmark SPY gained 208.06% over the same period. Over the previous week the market value of iM-10LargeHedgeFundSelect gained -7.39% at a time when SPY gained -2.13%. A starting capital of $25,000 at inception on 1/5/2016 would have grown to $134,684 which includes -$148 cash and excludes $1,560 spent on fees and slippage. |
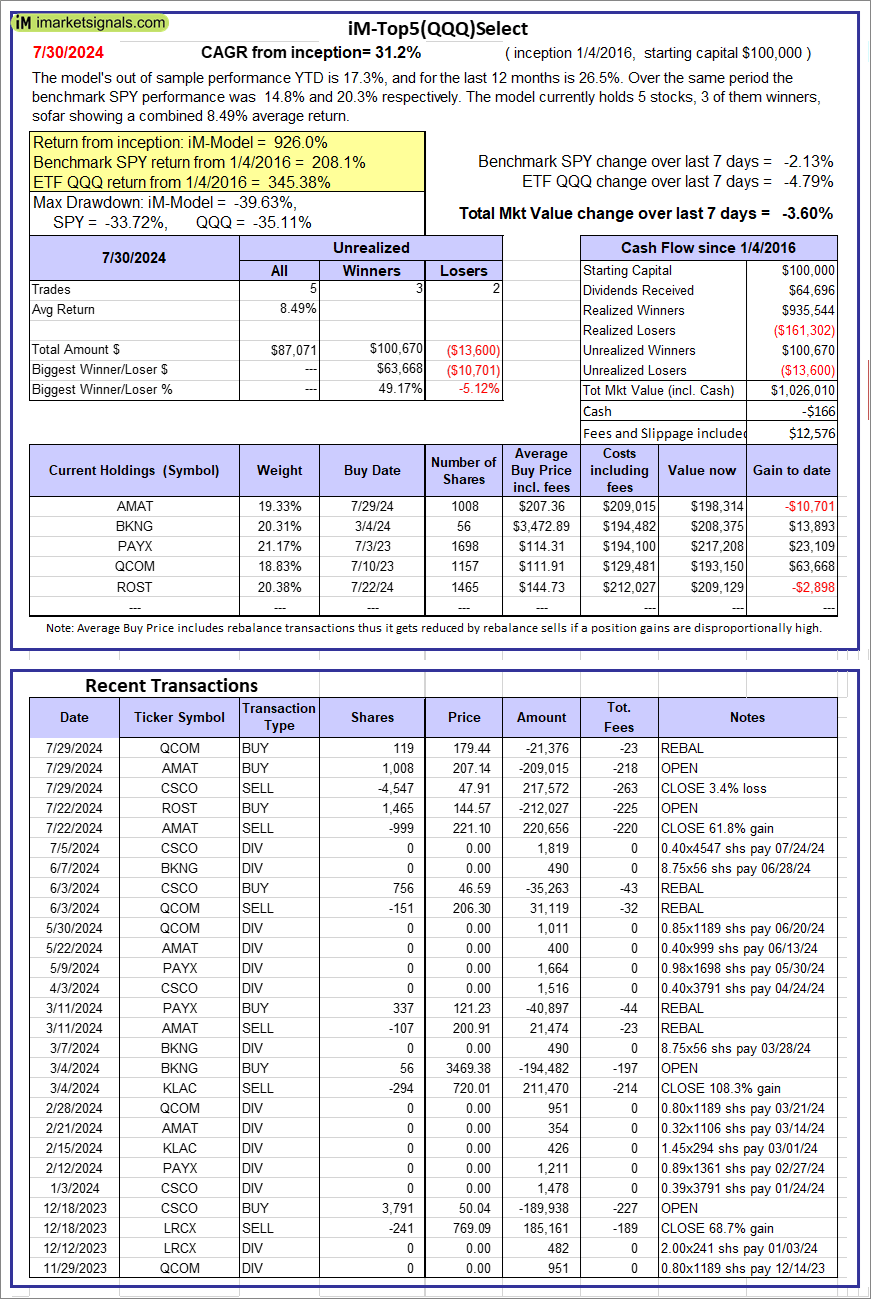 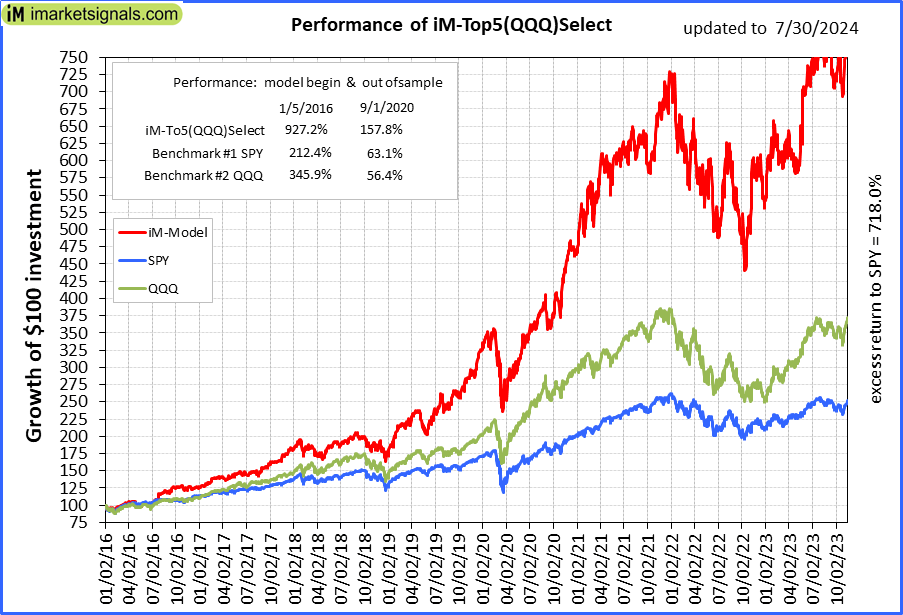 |
iM-Top5(QQQ)Select: Since inception, on 1/5/2016, the model gained 926.01% while the benchmark SPY gained 208.06% over the same period. Over the previous week the market value of iM-Top5(QQQ)Select gained -3.60% at a time when SPY gained -2.13%. A starting capital of $100,000 at inception on 1/5/2016 would have grown to $1,026,010 which includes -$166 cash and excludes $12,576 spent on fees and slippage. |
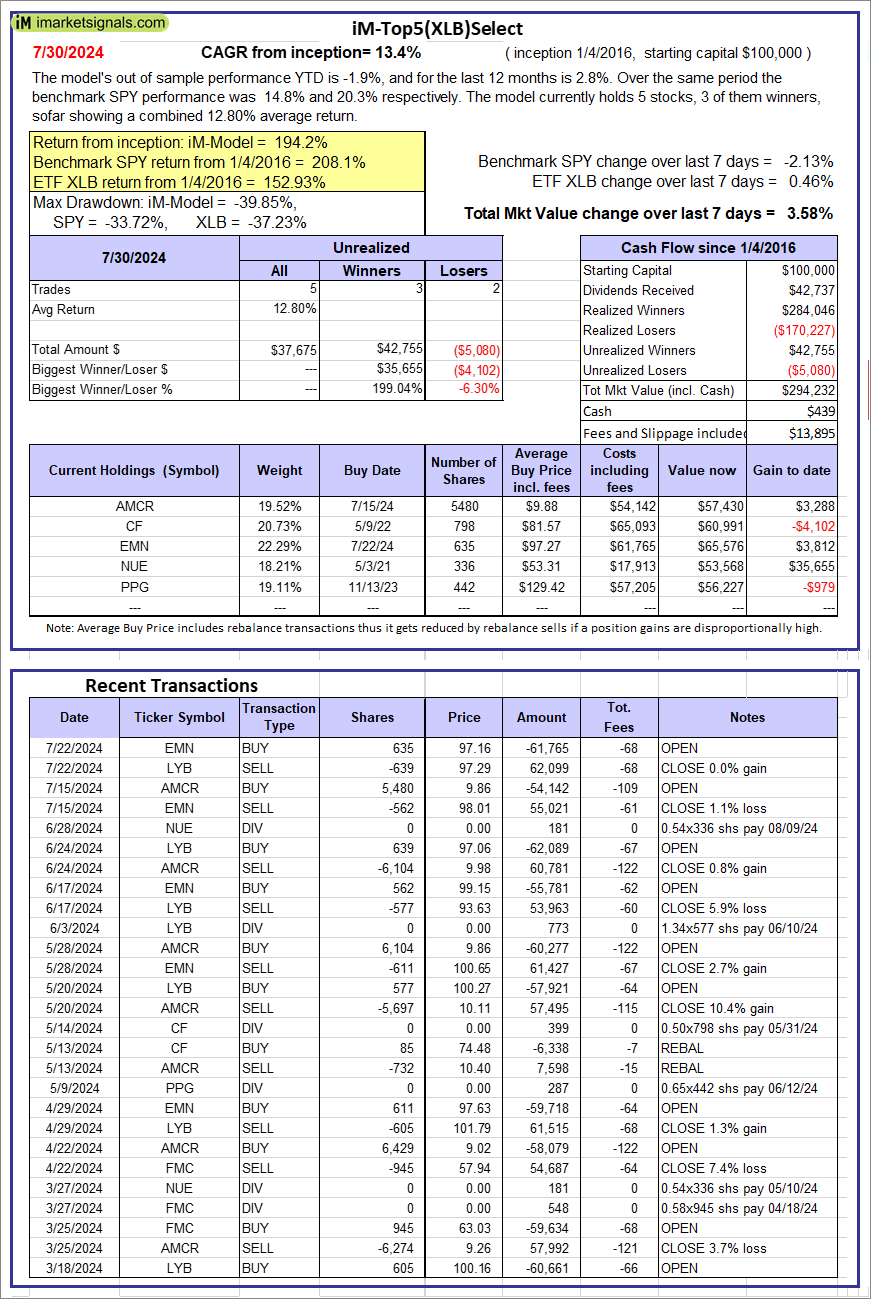 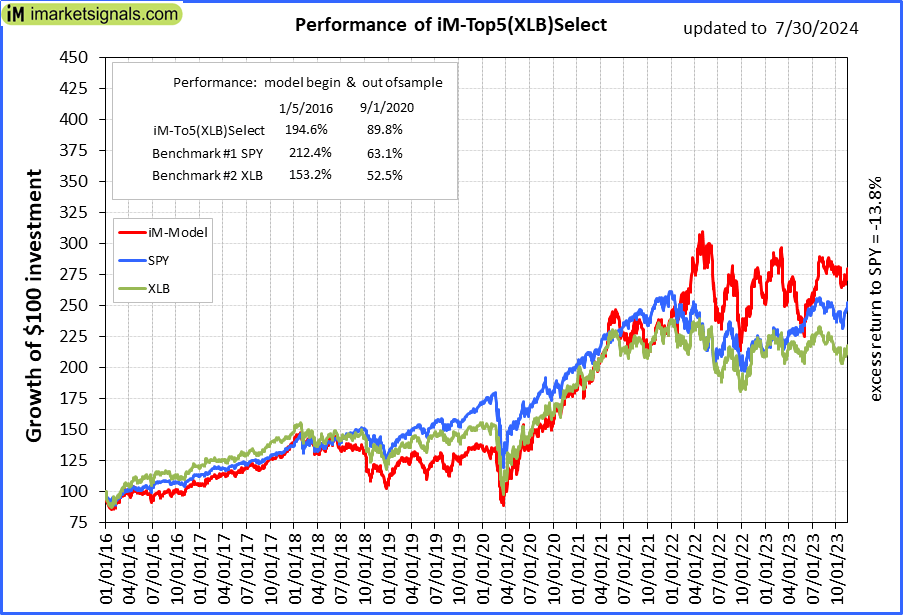 |
iM-Top5(XLB)Select: Since inception, on 1/5/2016, the model gained 194.23% while the benchmark SPY gained 208.06% over the same period. Over the previous week the market value of iM-Top5(XLB)Select gained 3.58% at a time when SPY gained -2.13%. A starting capital of $100,000 at inception on 1/5/2016 would have grown to $294,232 which includes $439 cash and excludes $13,895 spent on fees and slippage. |
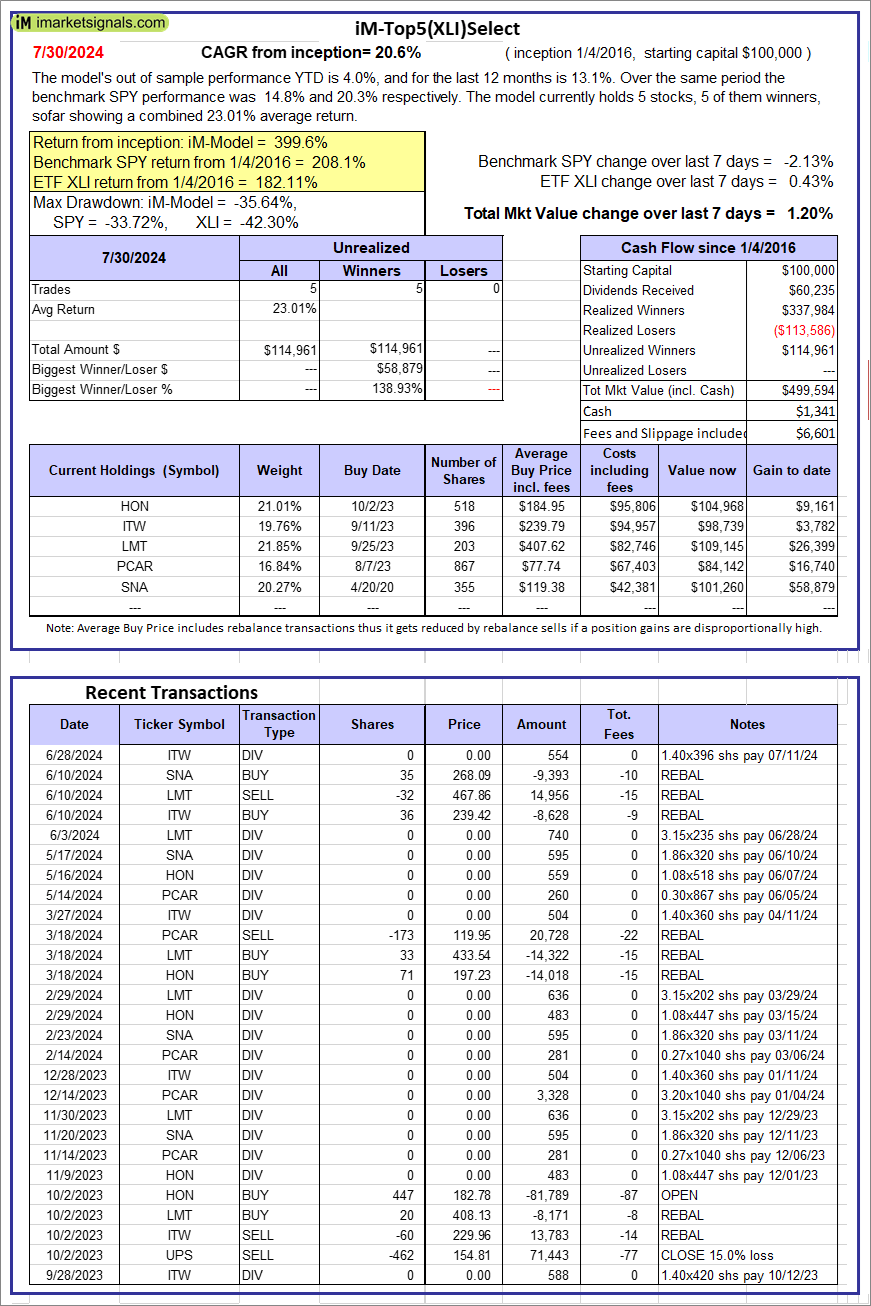 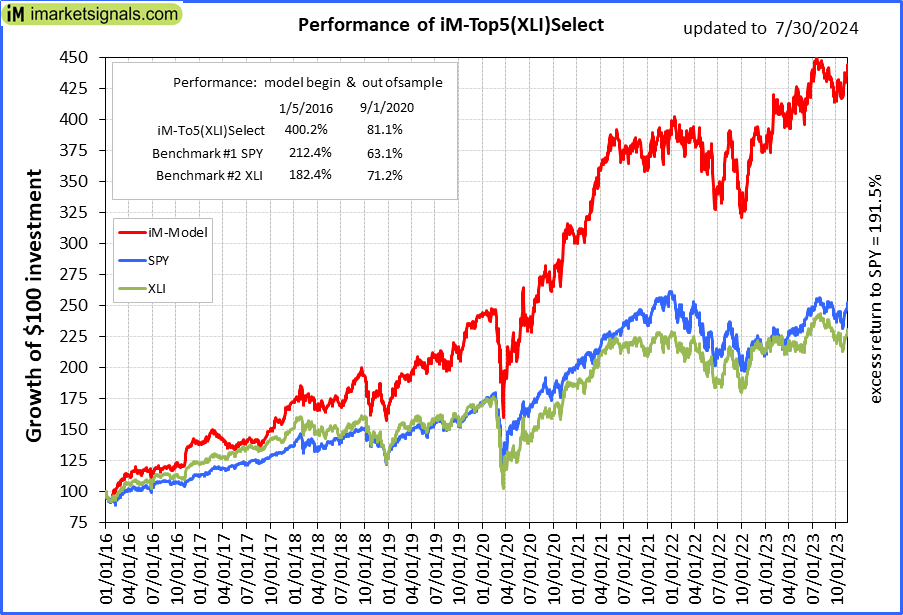 |
iM-Top5(XLI)Select: Since inception, on 1/5/2016, the model gained 399.59% while the benchmark SPY gained 208.06% over the same period. Over the previous week the market value of iM-Top5(XLI)Select gained 1.20% at a time when SPY gained -2.13%. A starting capital of $100,000 at inception on 1/5/2016 would have grown to $499,594 which includes $1,341 cash and excludes $6,601 spent on fees and slippage. |
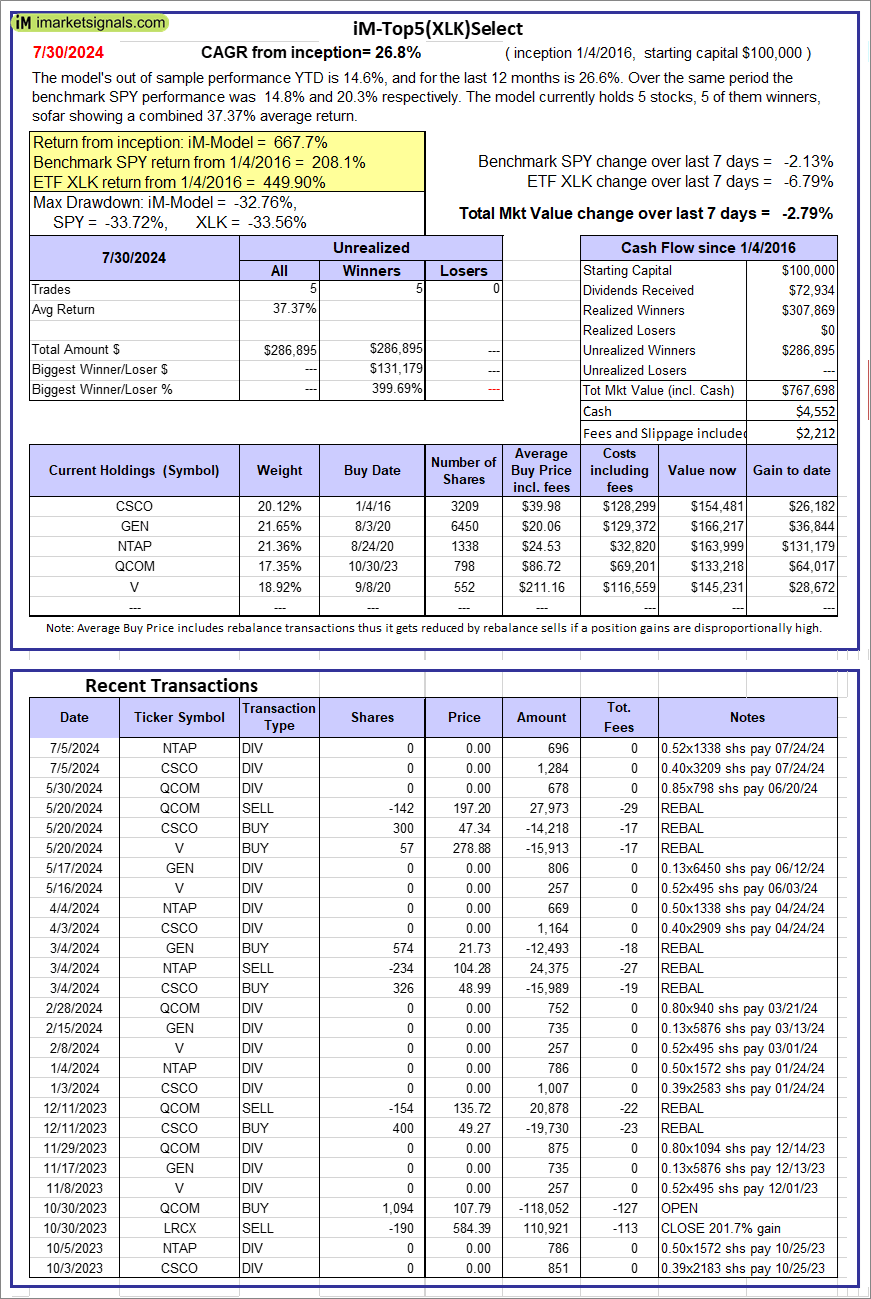 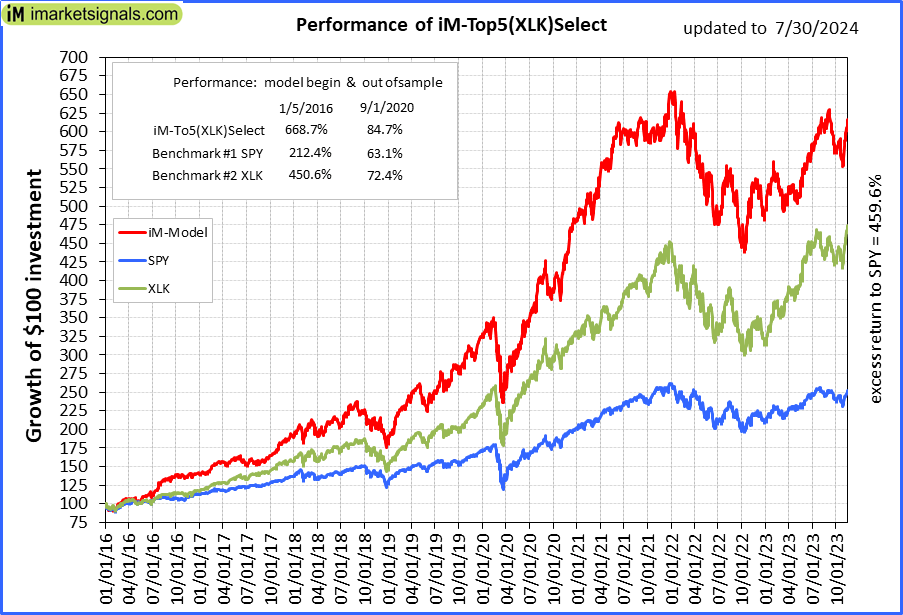 |
iM-Top5(XLK)Select: Since inception, on 1/5/2016, the model gained 667.70% while the benchmark SPY gained 208.06% over the same period. Over the previous week the market value of iM-Top5(XLK)Select gained -2.79% at a time when SPY gained -2.13%. A starting capital of $100,000 at inception on 1/5/2016 would have grown to $767,698 which includes $4,552 cash and excludes $2,212 spent on fees and slippage. |
 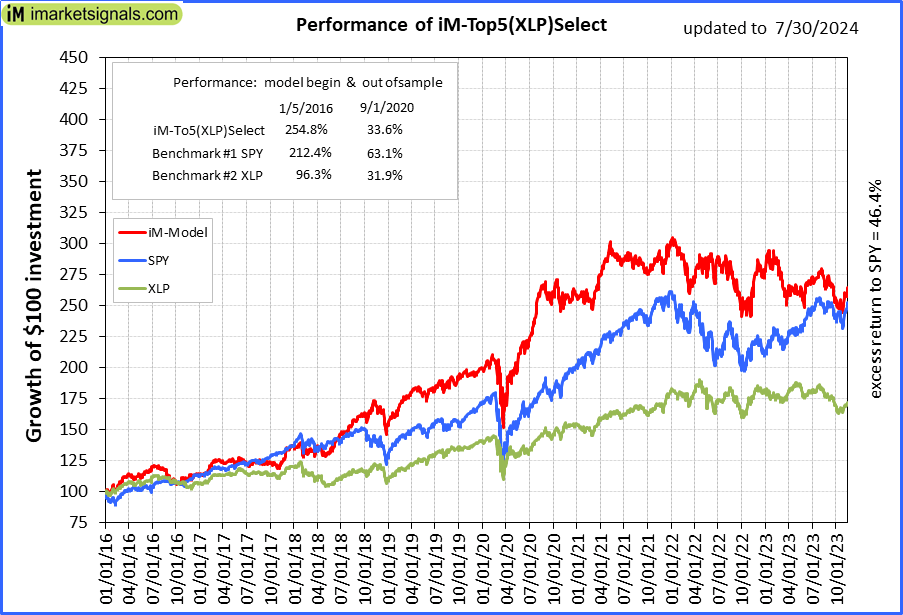 |
iM-Top5(XLP)Select: Since inception, on 1/5/2016, the model gained 254.44% while the benchmark SPY gained 208.06% over the same period. Over the previous week the market value of iM-Top5(XLP)Select gained 4.29% at a time when SPY gained -2.13%. A starting capital of $100,000 at inception on 1/5/2016 would have grown to $354,436 which includes $1,322 cash and excludes $2,200 spent on fees and slippage. |
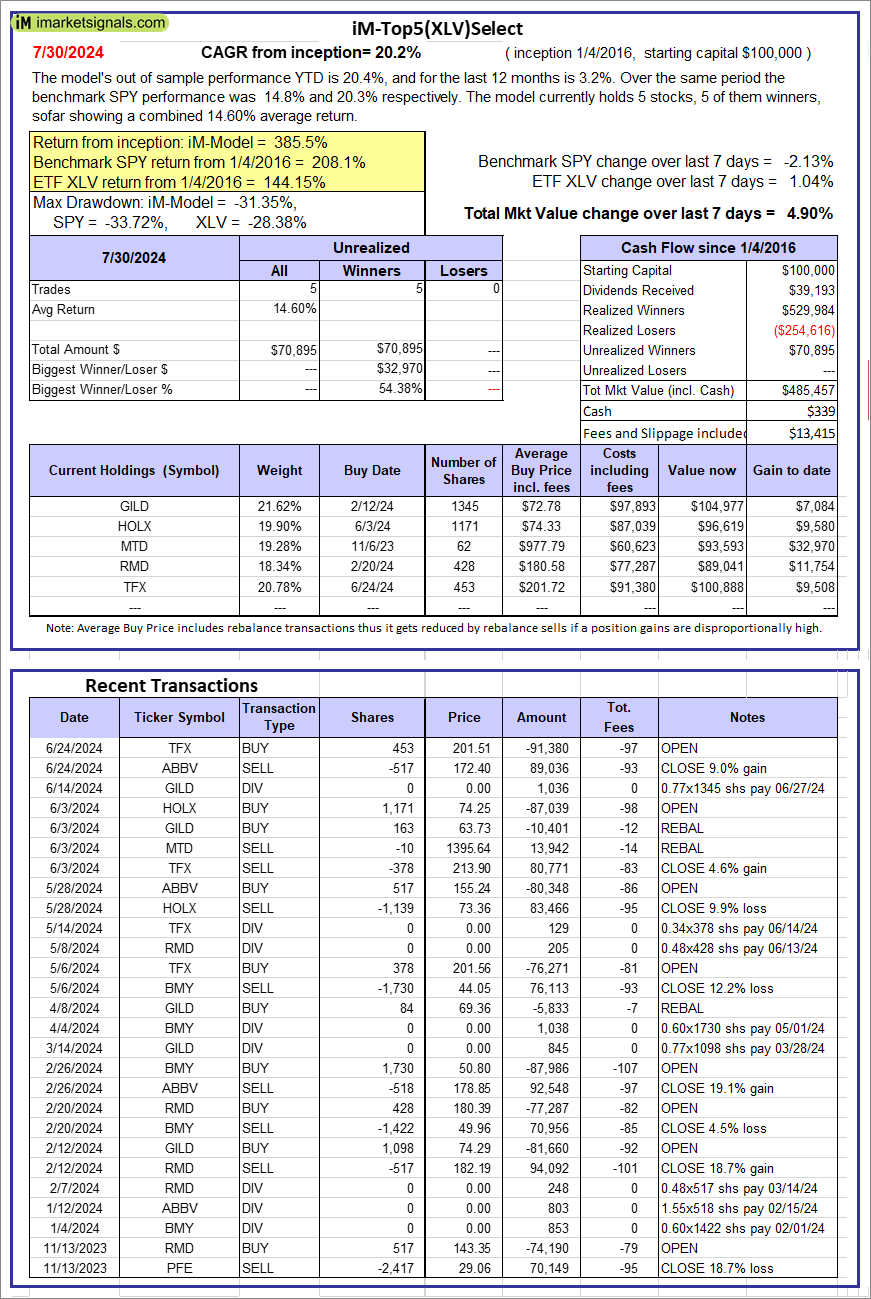 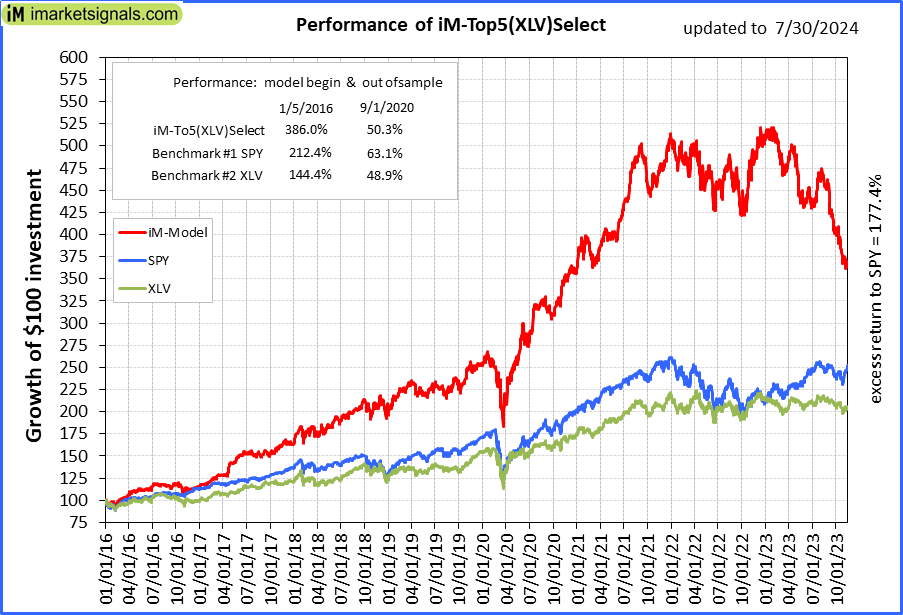 |
iM-Top5(XLV)Select: Since inception, on 1/5/2016, the model gained 385.46% while the benchmark SPY gained 208.06% over the same period. Over the previous week the market value of iM-Top5(XLV)Select gained 4.90% at a time when SPY gained -2.13%. A starting capital of $100,000 at inception on 1/5/2016 would have grown to $485,457 which includes $339 cash and excludes $13,415 spent on fees and slippage. |
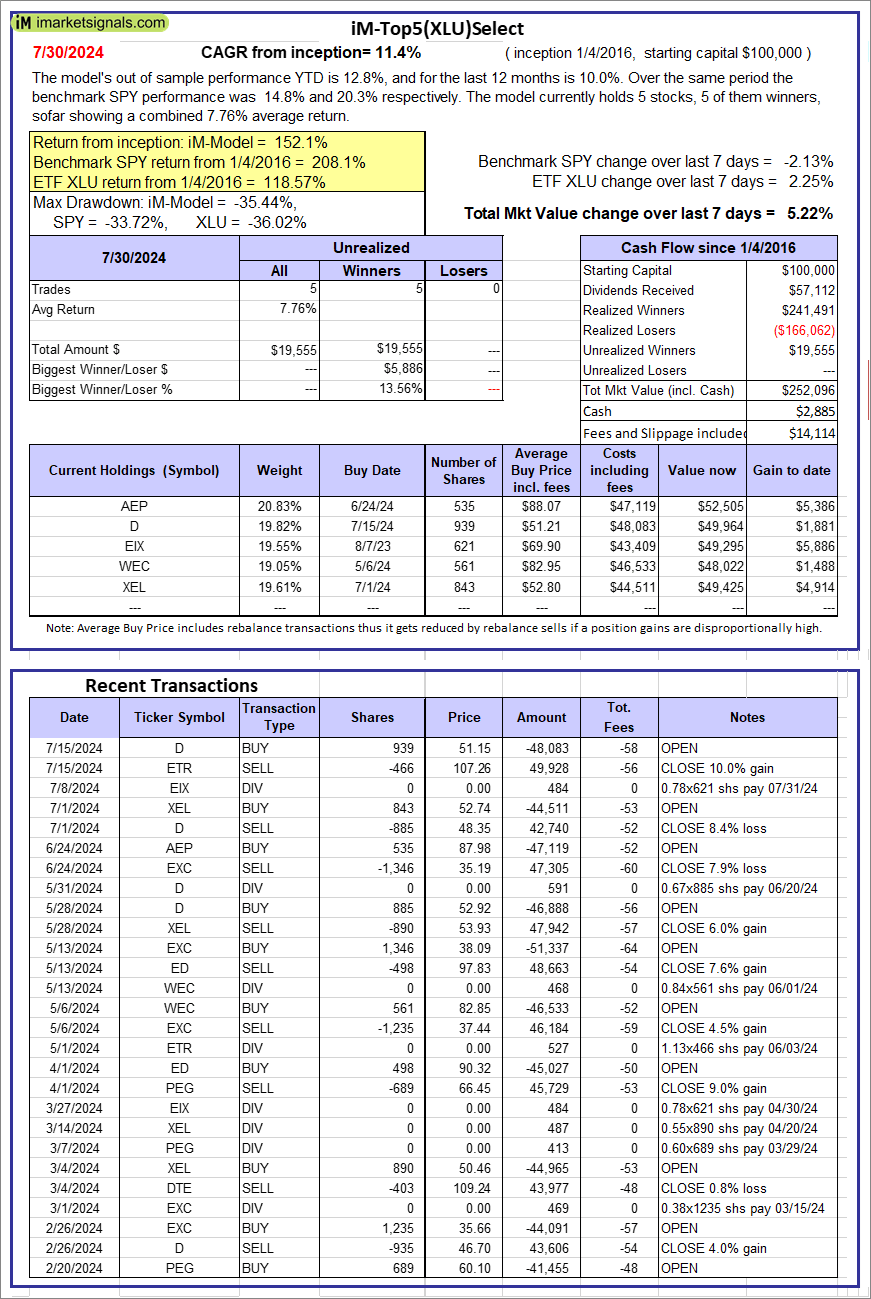 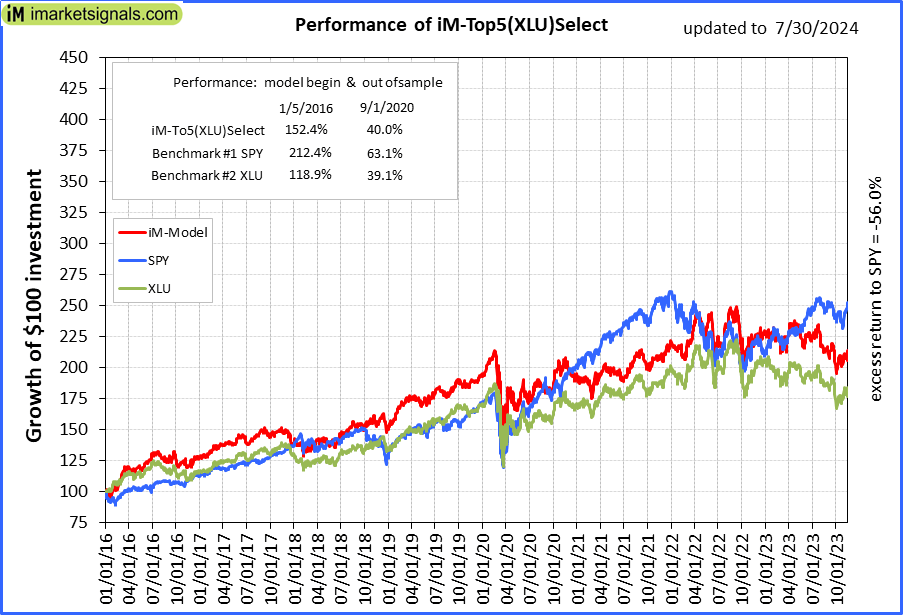 |
iM-Top5(XLU)Select: Since inception, on 1/5/2016, the model gained 152.10% while the benchmark SPY gained 208.06% over the same period. Over the previous week the market value of iM-Top5(XLU)Select gained 5.22% at a time when SPY gained -2.13%. A starting capital of $100,000 at inception on 1/5/2016 would have grown to $252,096 which includes $2,885 cash and excludes $14,114 spent on fees and slippage. |
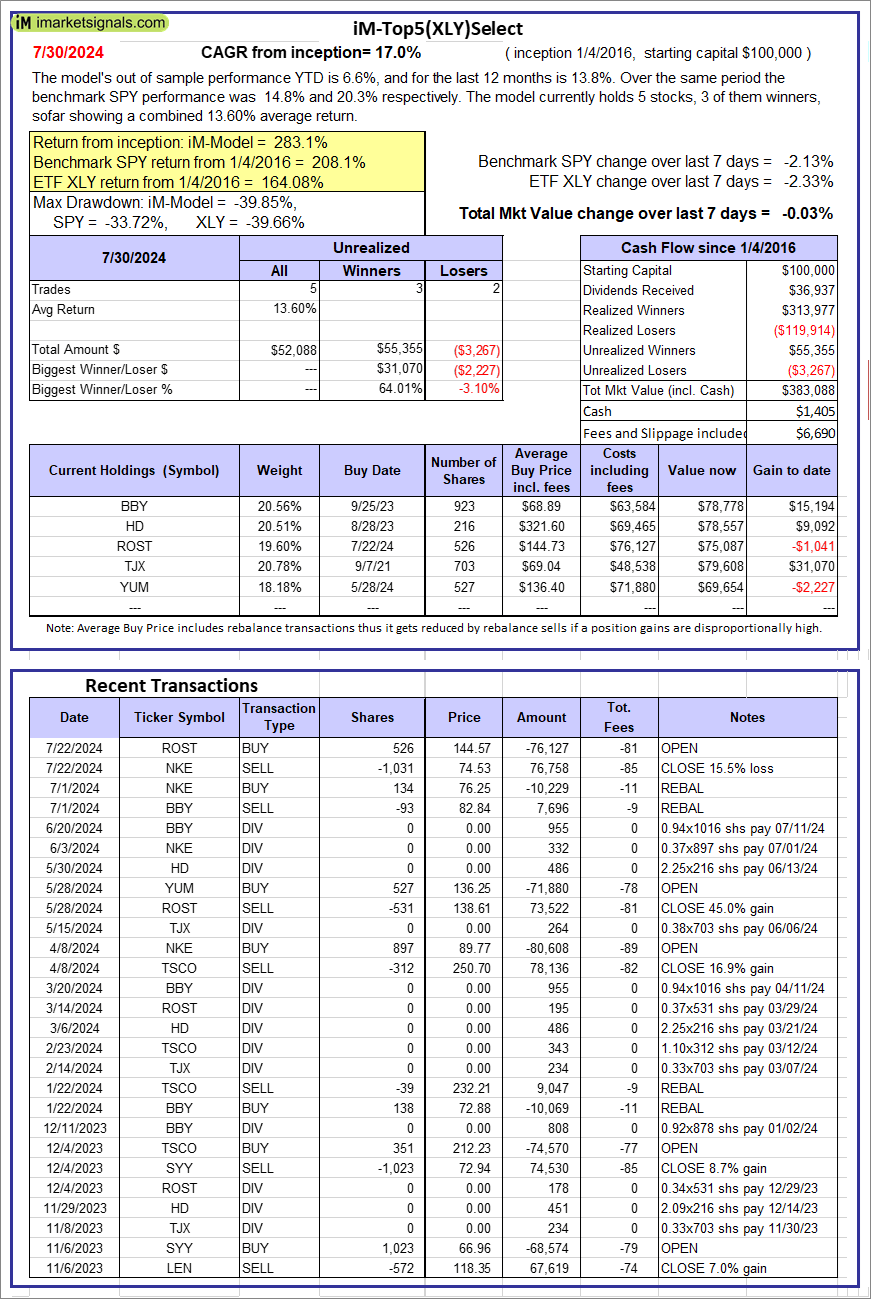 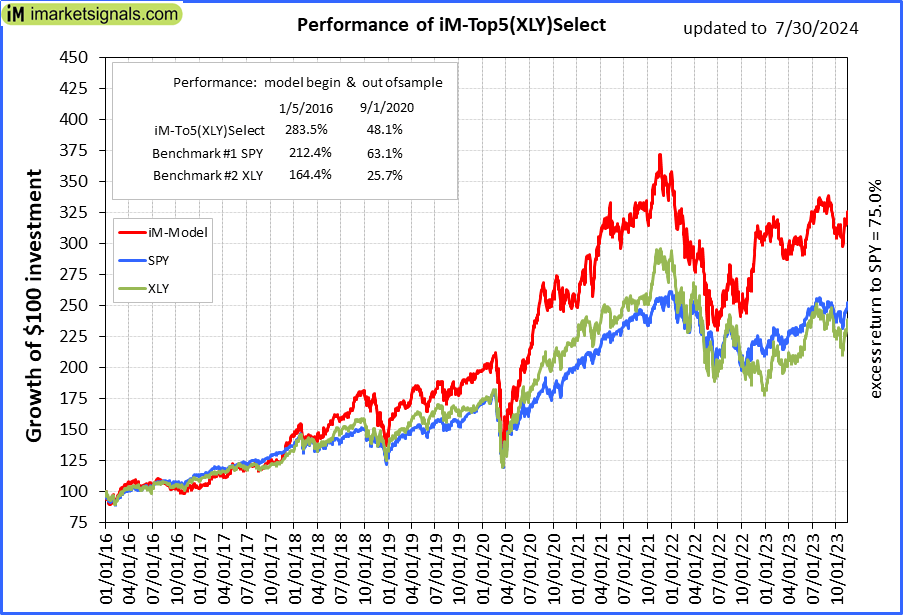 |
iM-Top5(XLY)Select: Since inception, on 1/5/2016, the model gained 283.09% while the benchmark SPY gained 208.06% over the same period. Over the previous week the market value of iM-Top5(XLY)Select gained -0.03% at a time when SPY gained -2.13%. A starting capital of $100,000 at inception on 1/5/2016 would have grown to $383,088 which includes $1,405 cash and excludes $6,690 spent on fees and slippage. |
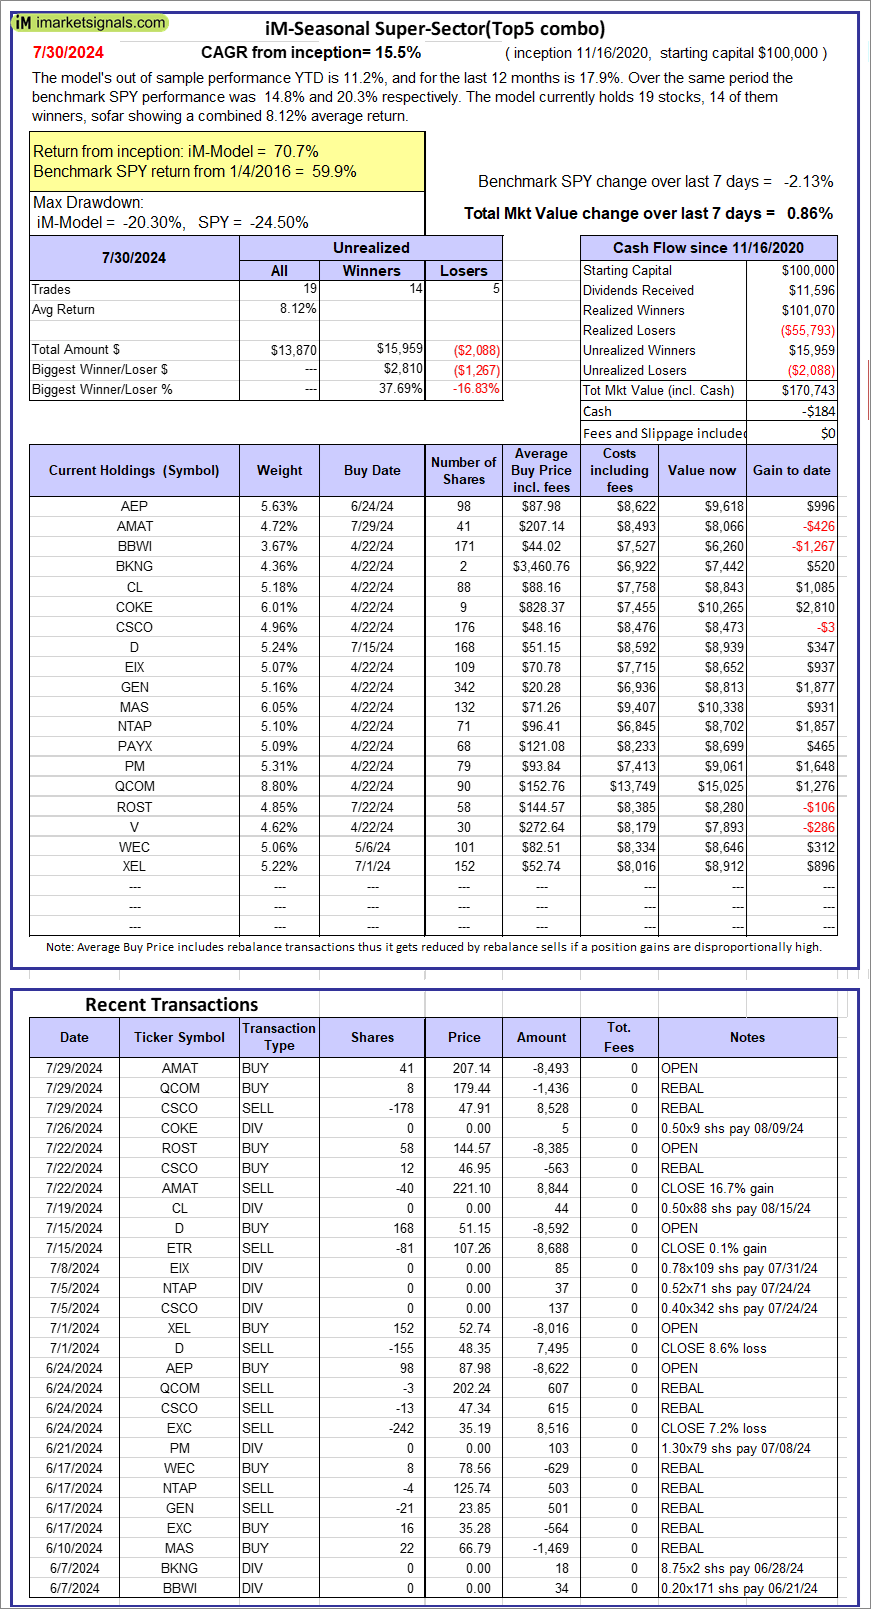 |
iM-Seasonal Super-Sectors (Top5 combo) : Since inception, on 11/17/2020, the model gained 70.74% while the benchmark SPY gained 59.91% over the same period. Over the previous week the market value of iM-Seasonal Super-Sectors (Top5 combo) gained 0.86% at a time when SPY gained -2.13%. A starting capital of $100,000 at inception on 11/17/2020 would have grown to $170,743 which includes -$184 cash and excludes $00 spent on fees and slippage. |
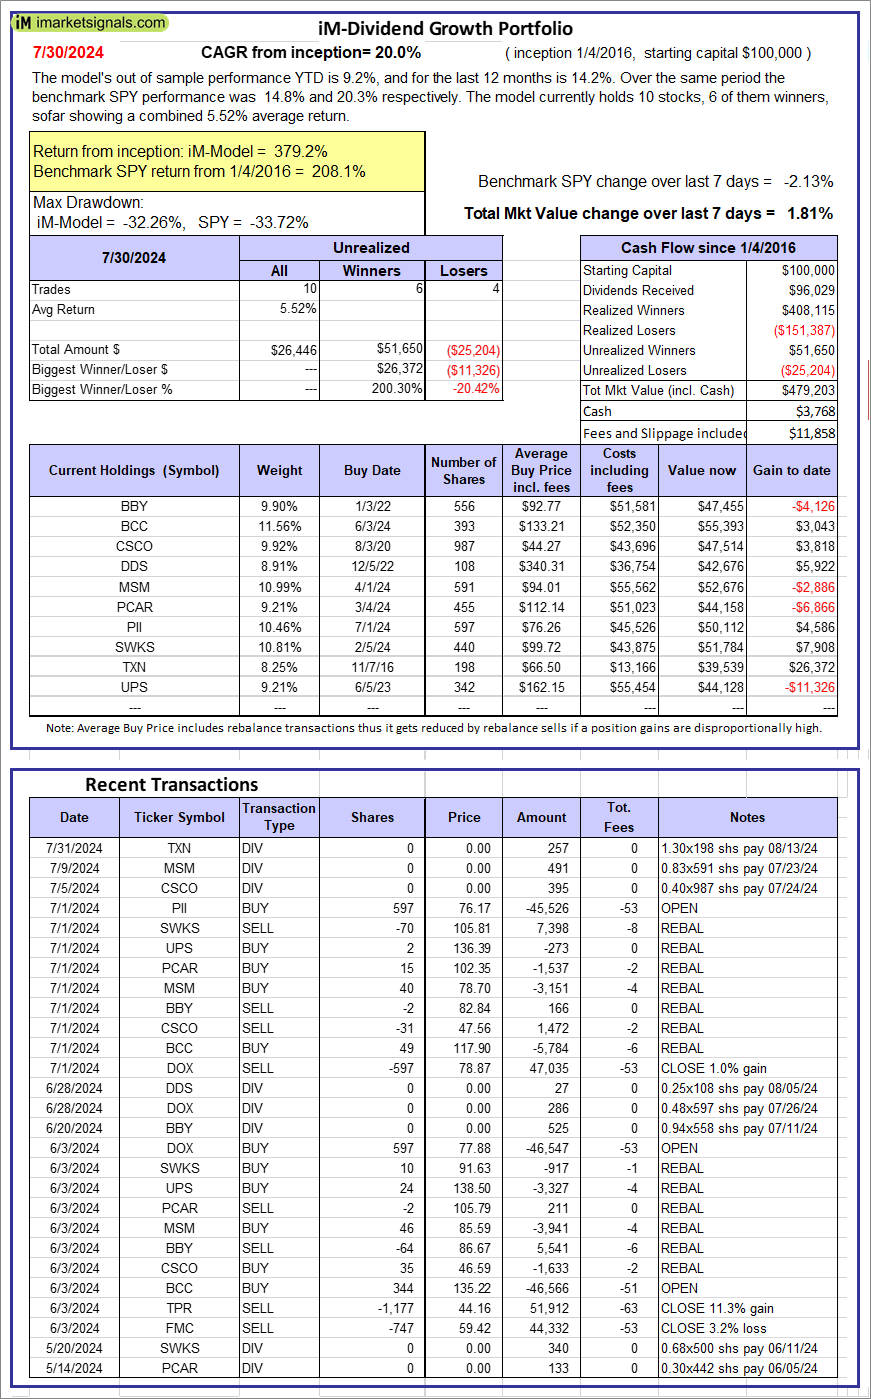 |
iM-Dividend Growth Portfolio: The model’s out of sample performance YTD is 9.2%, and for the last 12 months is 14.2%. Over the same period the benchmark SPY performance was 14.8% and 20.3% respectively. Over the previous week the market value of the iM-Dividend Growth Portfolio gained 1.81% at a time when SPY gained -2.13%. A starting capital of $100,000 at inception on 6/30/2016 would have grown to $479,203 which includes $3,768 cash and excludes $11,858 spent on fees and slippage. |
 |
iM-Gold Momentum Timer (AU, NEM, SBSW): The model’s out of sample performance YTD is 18.0%, and for the last 12 months is 9.1%. Over the same period the benchmark SPY performance was 14.8% and 20.3% respectively. Over the previous week the market value of iM-Gold Momentum Timer (AU, NEM, SBSW) gained -2.78% at a time when SPY gained -2.13%. A starting capital of $100,000 at inception on 6/30/2016 would have grown to $11 which includes $133,136 cash and excludes Gain to date spent on fees and slippage. |
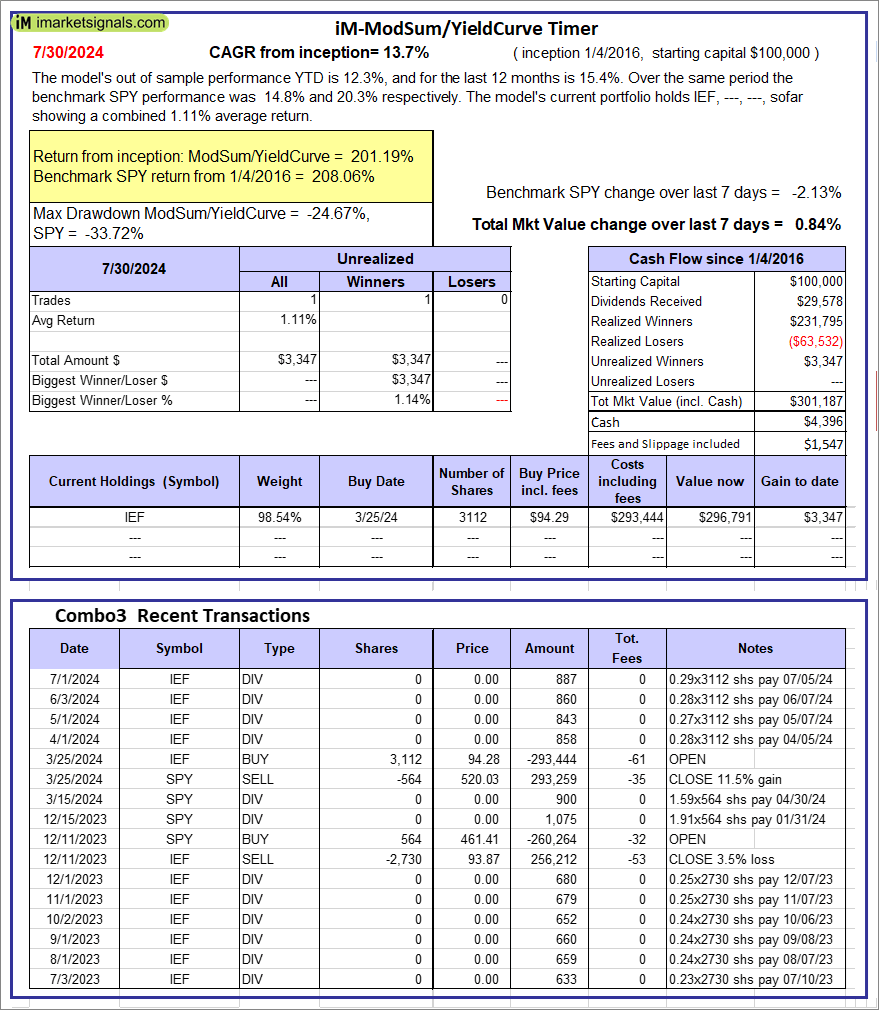 |
iM-ModSum/YieldCurve Timer: The model’s out of sample performance YTD is 12.3%, and for the last 12 months is 15.4%. Over the same period the benchmark SPY performance was 14.8% and 20.3% respectively. Over the previous week the market value of iM-PortSum/YieldCurve Timer gained 0.84% at a time when SPY gained -2.13%. A starting capital of $100,000 at inception on 1/1/2016 would have grown to $301,187 which includes $4,396 cash and excludes $1,547 spent on fees and slippage. |
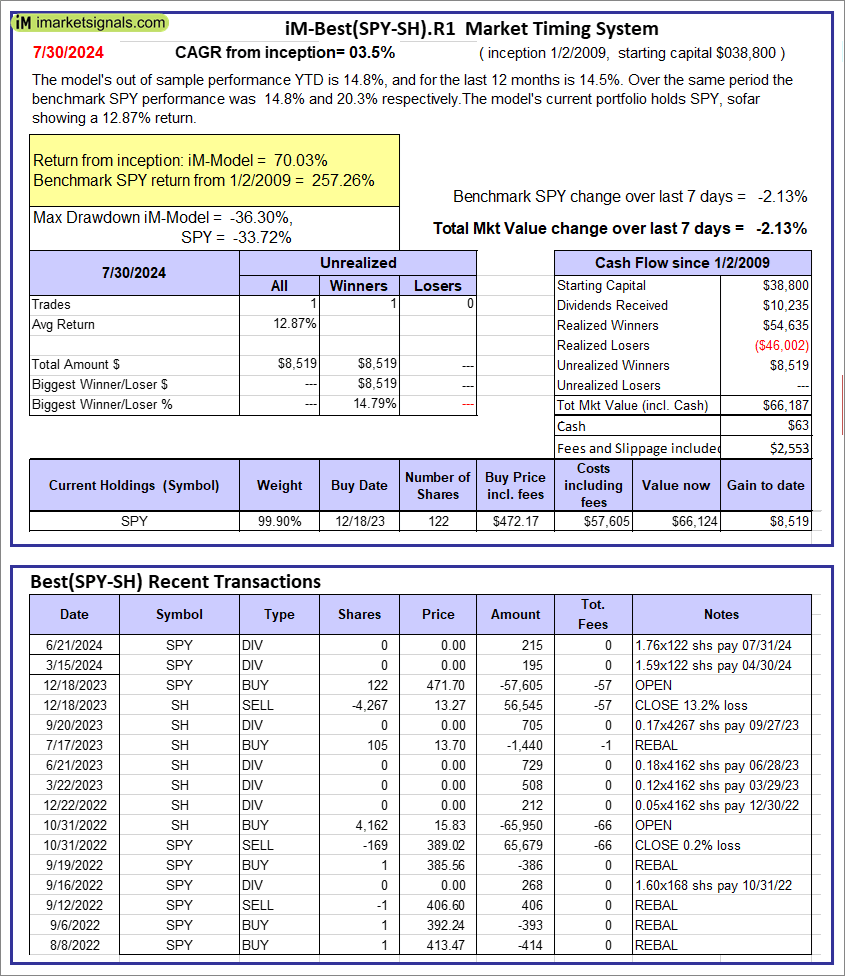 |
iM-Best(SPY-SH).R1: The model’s out of sample performance YTD is 14.8%, and for the last 12 months is 14.5%. Over the same period the benchmark SPY performance was 14.8% and 20.3% respectively. Over the previous week the market value of Best(SPY-SH) gained -2.13% at a time when SPY gained -2.13%. A starting capital of $100,000 at inception on 1/2/2009 would have grown to $66,187 which includes $63 cash and excludes $2,553 spent on fees and slippage. |
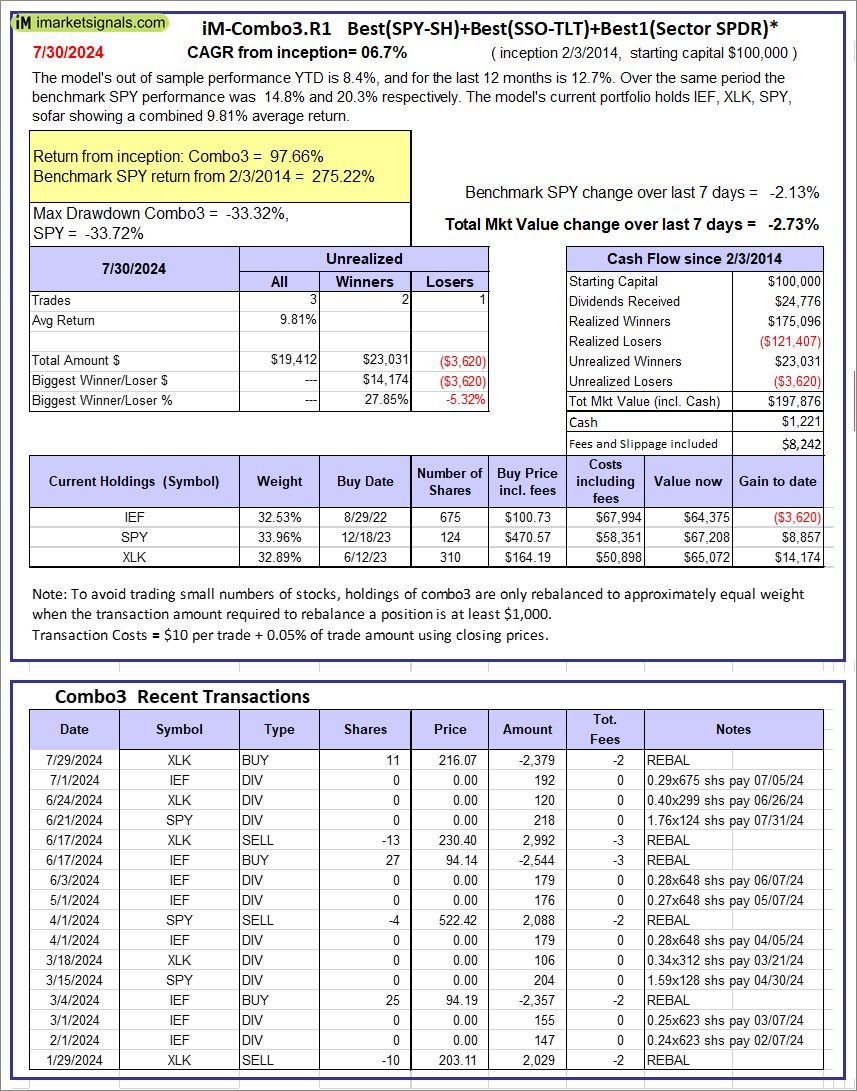 |
iM-Combo3.R1: The model’s out of sample performance YTD is 8.4%, and for the last 12 months is 12.7%. Over the same period the benchmark SPY performance was 14.8% and 20.3% respectively. Over the previous week the market value of iM-Combo3.R1 gained -2.73% at a time when SPY gained -2.13%. A starting capital of $100,000 at inception on 2/3/2014 would have grown to $197,876 which includes $1,221 cash and excludes $8,242 spent on fees and slippage. |
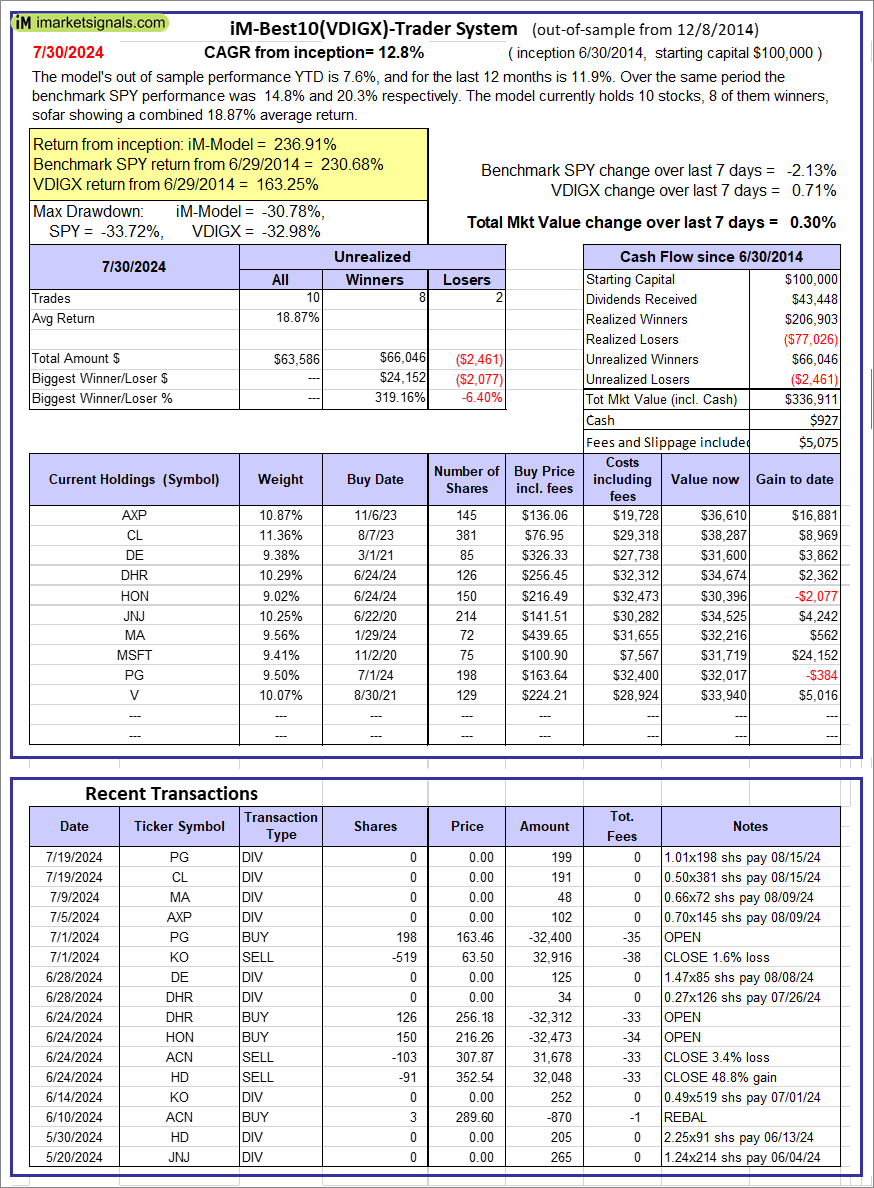 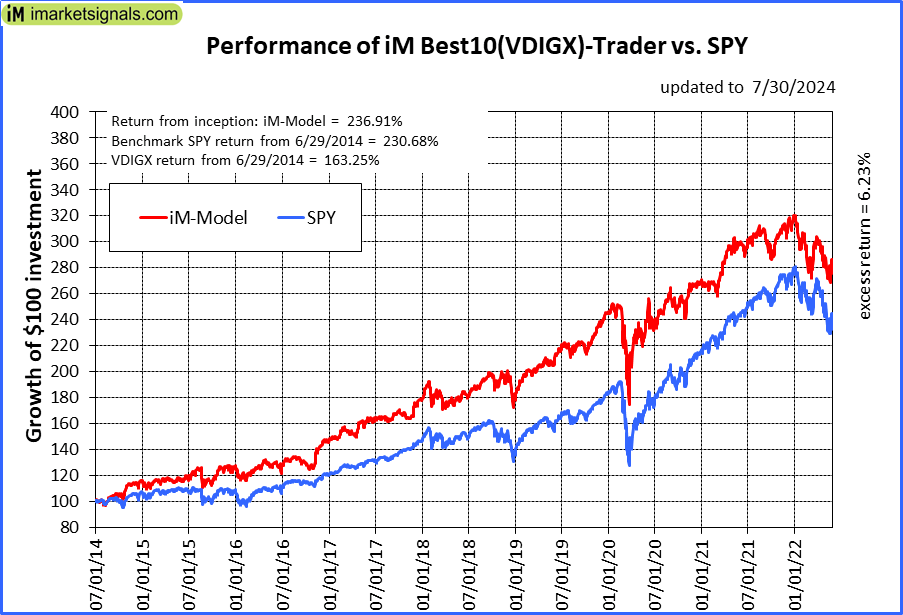 |
iM-Best10(VDIGX)-Trader: The model’s out of sample performance YTD is 7.6%, and for the last 12 months is 11.9%. Over the same period the benchmark SPY performance was 14.8% and 20.3% respectively. Since inception, on 7/1/2014, the model gained 236.91% while the benchmark SPY gained 230.68% and VDIGX gained 163.25% over the same period. Over the previous week the market value of iM-Best10(VDIGX) gained 0.30% at a time when SPY gained -2.13%. A starting capital of $100,000 at inception on 7/1/2014 would have grown to $336,911 which includes $927 cash and excludes $5,075 spent on fees and slippage. |
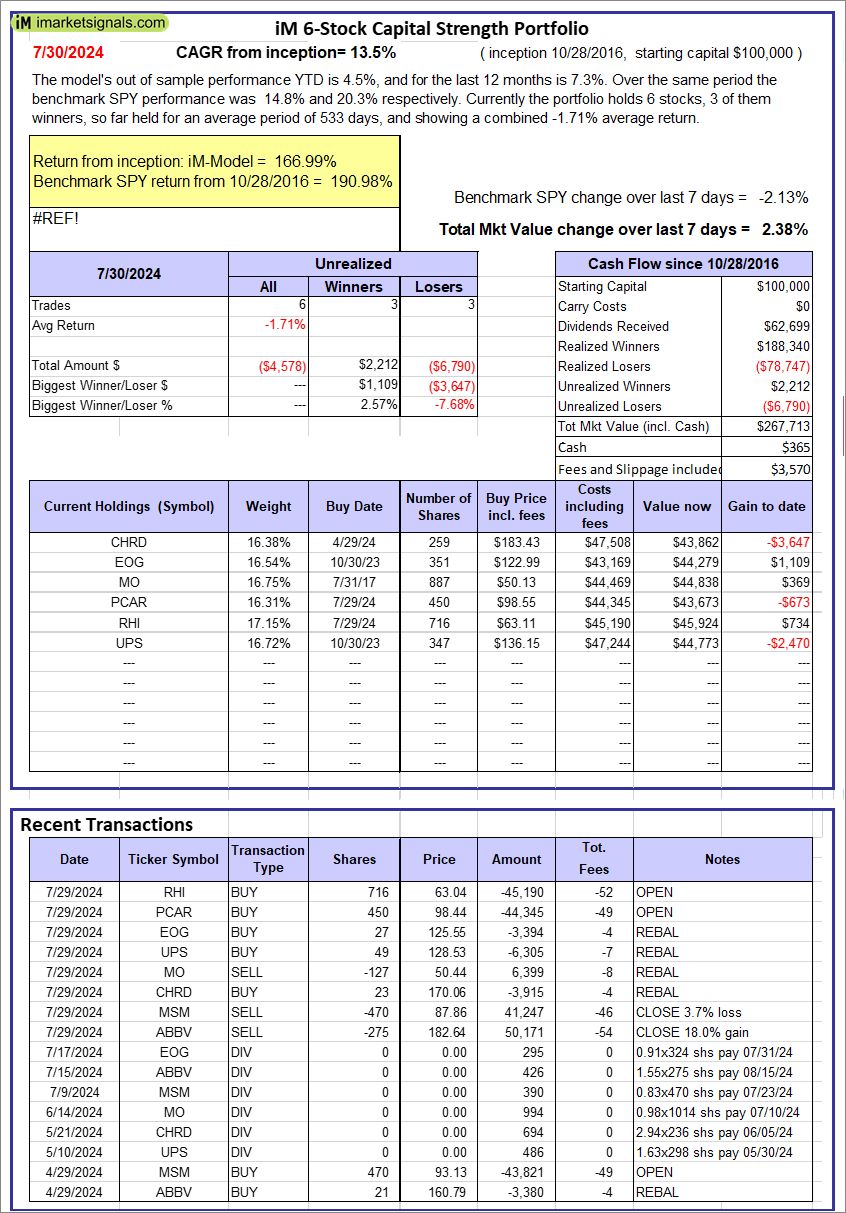 |
iM 6-Stock Capital Strength Portfolio: The model’s out of sample performance YTD is 4.5%, and for the last 12 months is 7.3%. Over the same period the benchmark SPY performance was 14.8% and 20.3% respectively. Over the previous week the market value of the iM 6-Stock Capital Strength Portfolio gained 2.38% at a time when SPY gained -2.13%. A starting capital of $100,000 at inception on 10/28/2016 would have grown to $267,713 which includes $365 cash and excludes $3,570 spent on fees and slippage. |
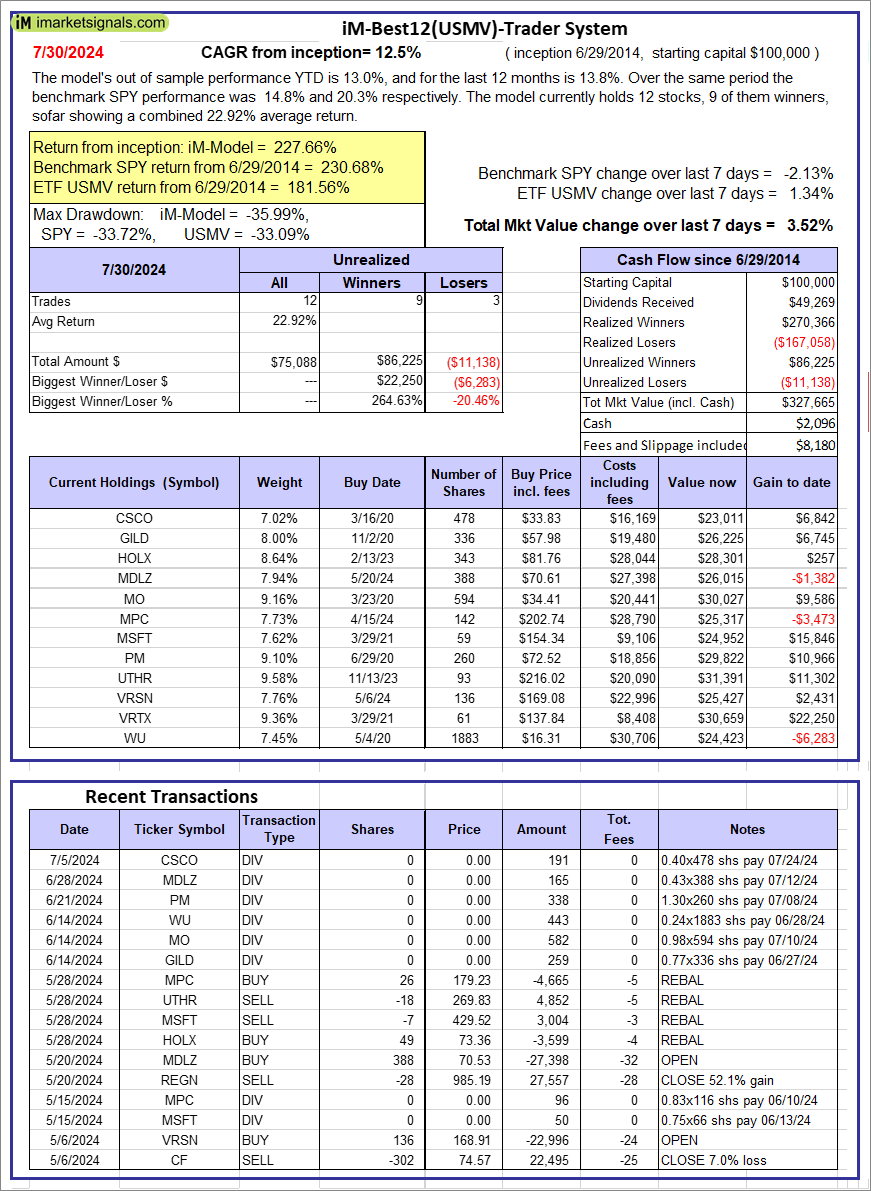 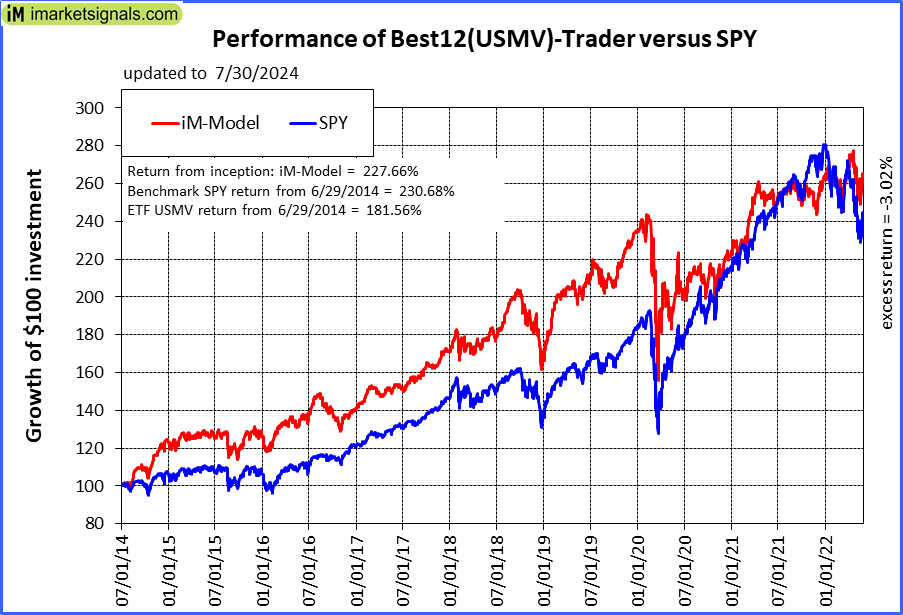 |
iM-Best12(USMV)-Trader: The model’s out of sample performance YTD is 13.0%, and for the last 12 months is 13.8%. Over the same period the benchmark SPY performance was 14.8% and 20.3% respectively. Since inception, on 6/30/2014, the model gained 227.66% while the benchmark SPY gained 230.68% and the ETF USMV gained 181.56% over the same period. Over the previous week the market value of iM-Best12(USMV)-Trader gained 3.52% at a time when SPY gained -2.13%. A starting capital of $100,000 at inception on 6/30/2014 would have grown to $327,665 which includes $2,096 cash and excludes $8,180 spent on fees and slippage. |
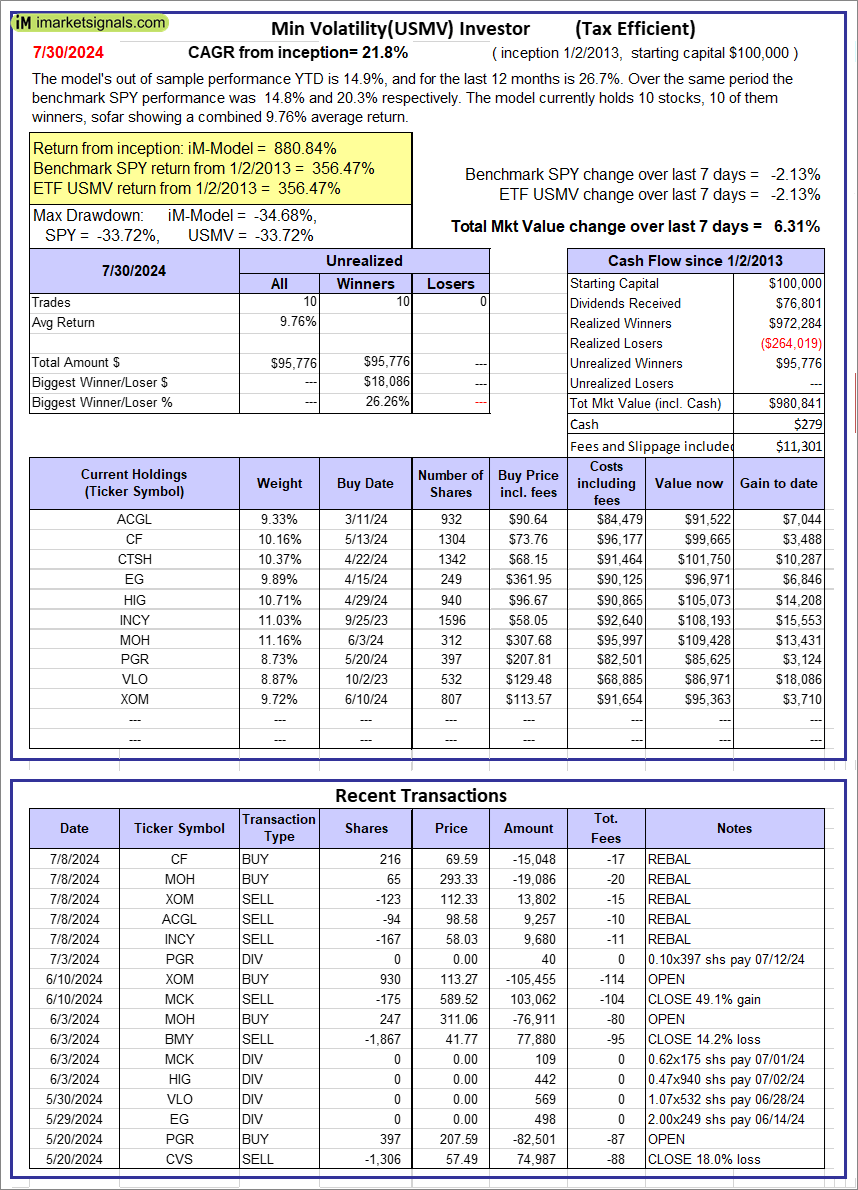 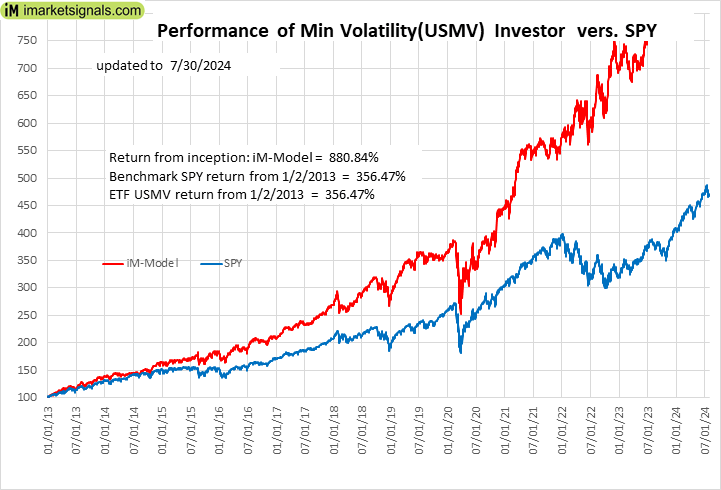 |
iM-Min Volatility(USMV) Investor (Tax Efficient): The model’s out of sample performance YTD is 14.9%, and for the last 12 months is 26.7%. Over the same period the benchmark SPY performance was 14.8% and 20.3% respectively. Since inception, on 1/3/2013, the model gained 880.84% while the benchmark SPY gained 356.47% and the ETF USMV gained 356.47% over the same period. Over the previous week the market value of iM-Best12(USMV)Q1 gained 6.31% at a time when SPY gained -2.13%. A starting capital of $100,000 at inception on 1/3/2013 would have grown to $980,841 which includes $279 cash and excludes $11,301 spent on fees and slippage. |
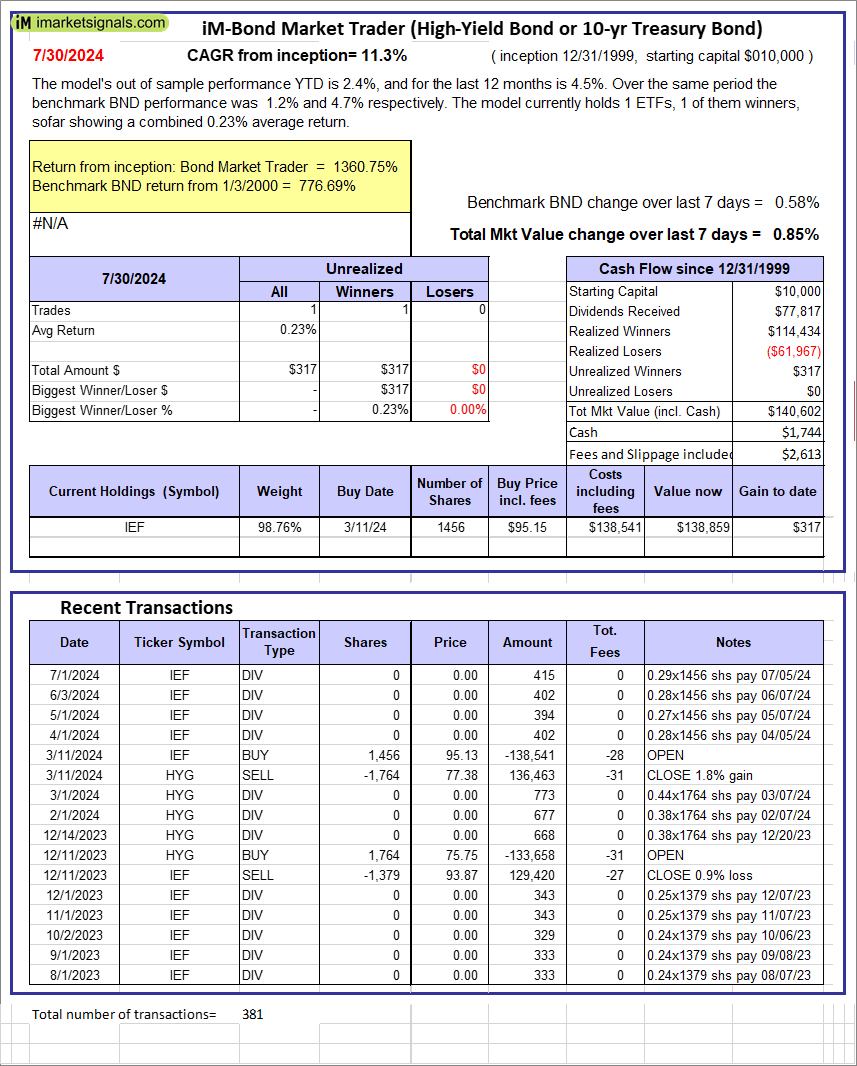 |
iM-Bond Market Trader (High-Yield Bond or 10-yr Treasury Bond): The model’s out of sample performance YTD is 2.4%, and for the last 12 months is 4.5%. Over the same period the benchmark BND performance was 1.2% and 4.7% respectively. Over the previous week the market value of the iM-Bond Market Trader (High-Yield Bond or 10-yr Treasury Bond) gained 0.85% at a time when BND gained 0.58%. A starting capital of $10,000 at inception on 1/3/2000 would have grown to $140,602 which includes $1,744 cash and excludes $2,613 spent on fees and slippage. |
|
|
iM-ModSum/YieldCurve Timer: The model’s out of sample performance YTD is 12.3%, and for the last 12 months is 15.4%. Over the same period the benchmark SPY performance was 14.8% and 20.3% respectively. Over the previous week the market value of iM-PortSum/YieldCurve Timer gained 0.84% at a time when SPY gained -2.13%. A starting capital of $100,000 at inception on 1/1/2016 would have grown to $301,187 which includes $4,396 cash and excludes $1,547 spent on fees and slippage. |
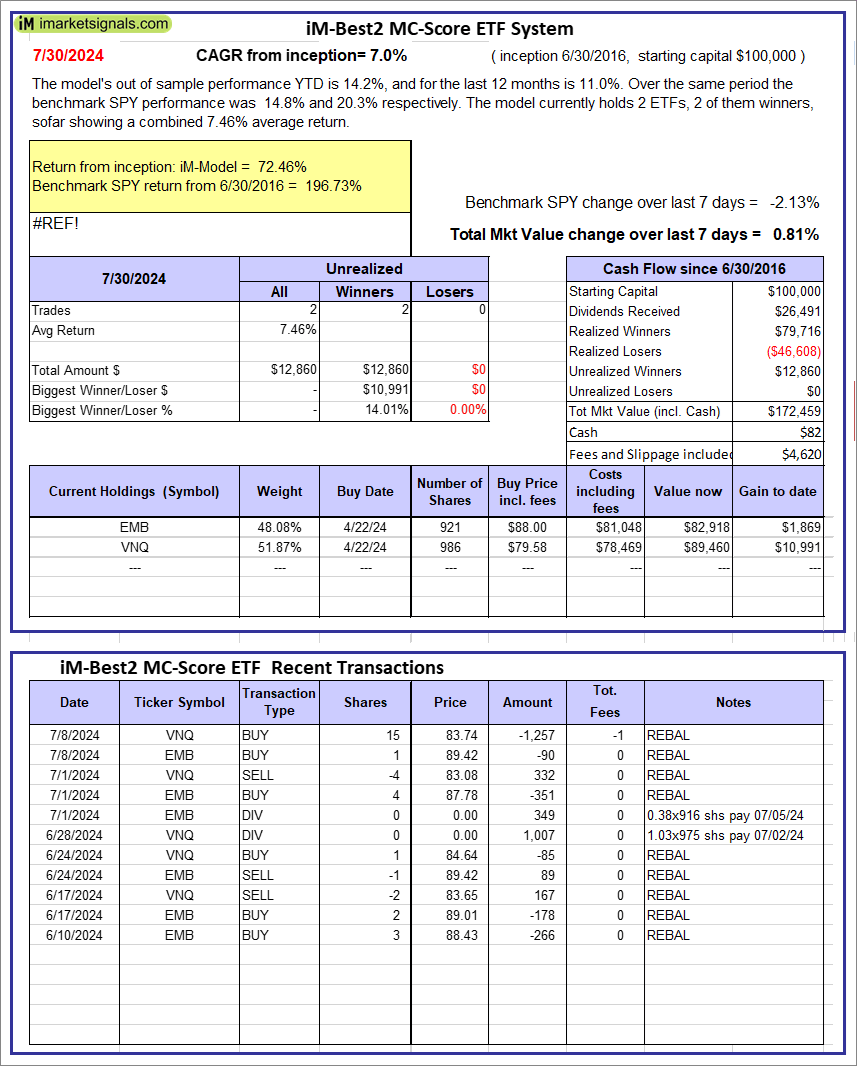 |
iM-Best2 MC-Score ETF System: The model’s out of sample performance YTD is 14.2%, and for the last 12 months is 11.0%. Over the same period the benchmark SPY performance was 14.8% and 20.3% respectively. Over the previous week the market value of the iM-Best2 MC-Score ETF System gained 0.81% at a time when SPY gained -2.13%. A starting capital of $100,000 at inception on 6/30/2016 would have grown to $172,459 which includes $82 cash and excludes $4,620 spent on fees and slippage. |
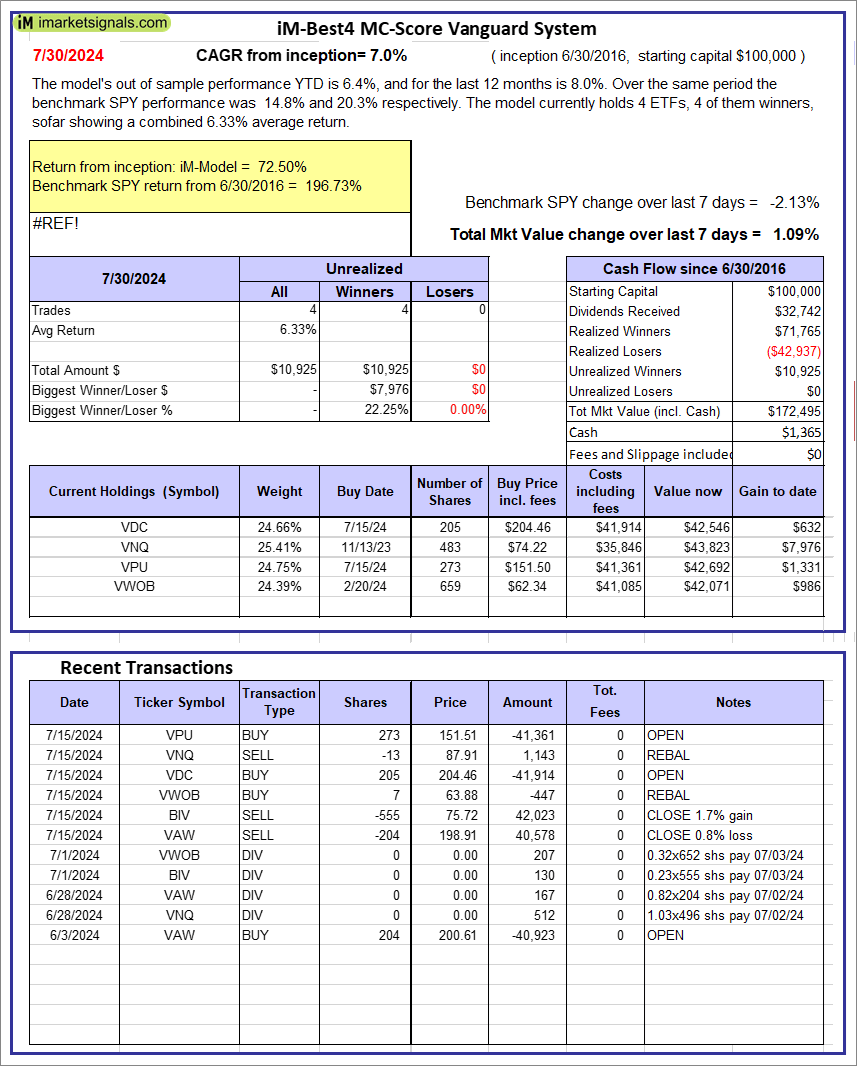 |
iM-Best4 MC-Score Vanguard System: The model’s out of sample performance YTD is 6.4%, and for the last 12 months is 8.0%. Over the same period the benchmark SPY performance was 14.8% and 20.3% respectively. Over the previous week the market value of the iM-Best4 MC-Score Vanguard System gained 1.09% at a time when SPY gained -2.13%. A starting capital of $100,000 at inception on 6/30/2016 would have grown to $172,495 which includes $1,365 cash and excludes $00 spent on fees and slippage. |
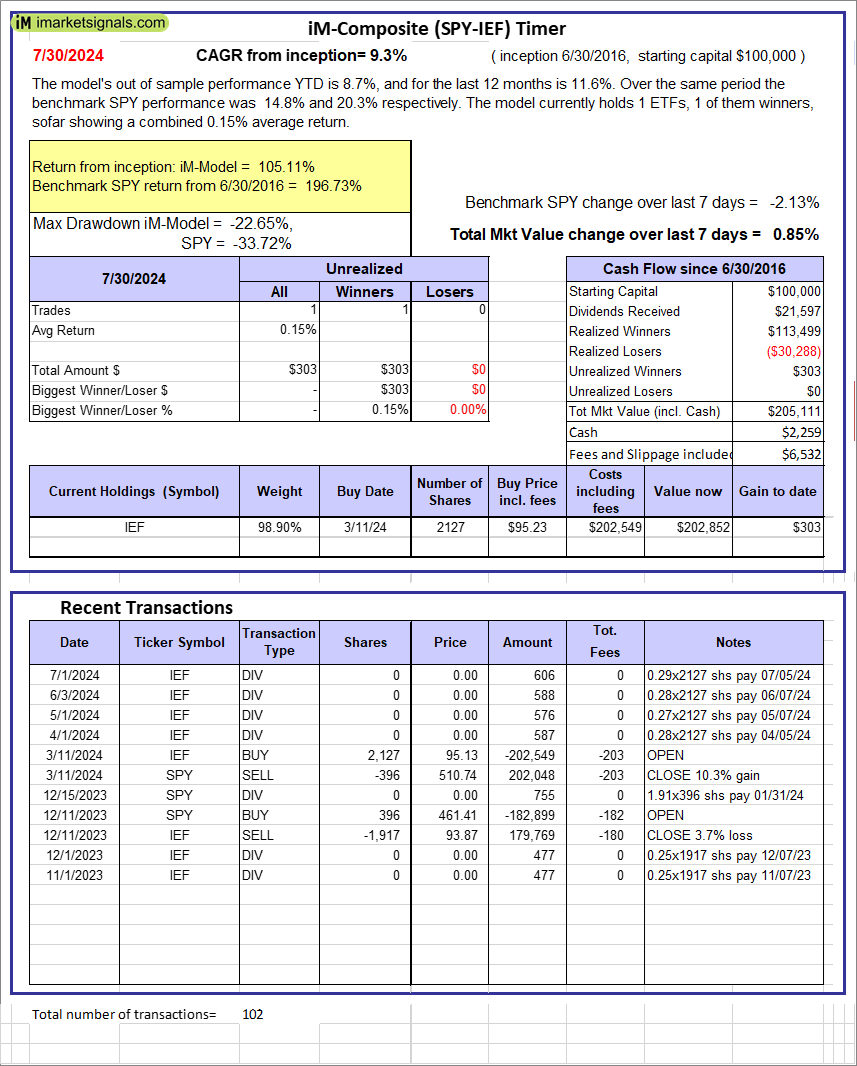 |
iM-Composite (SPY-IEF) Timer: The model’s out of sample performance YTD is 8.7%, and for the last 12 months is 11.6%. Over the same period the benchmark SPY performance was 14.8% and 20.3% respectively. Over the previous week the market value of the iM-Composite (SPY-IEF) Timer gained 0.85% at a time when SPY gained -2.13%. A starting capital of $100,000 at inception on 6/30/2016 would have grown to $205,111 which includes $2,259 cash and excludes $6,532 spent on fees and slippage. |
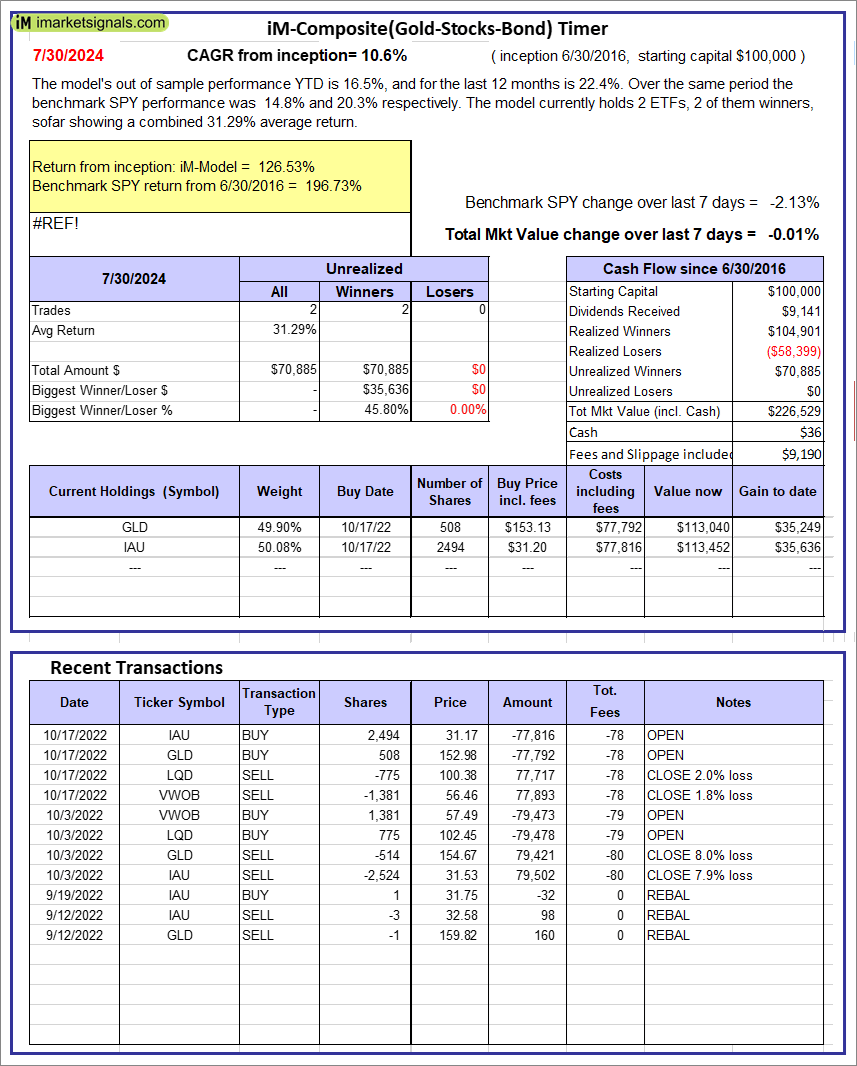 |
iM-Composite(Gold-Stocks-Bond) Timer: The model’s out of sample performance YTD is 16.5%, and for the last 12 months is 22.4%. Over the same period the benchmark SPY performance was 14.8% and 20.3% respectively. Over the previous week the market value of the iM-Composite(Gold-Stocks-Bond) Timer gained -0.01% at a time when SPY gained -2.13%. A starting capital of $100,000 at inception on 6/30/2016 would have grown to $226,529 which includes $36 cash and excludes $9,190 spent on fees and slippage. |
iM-Best Reports – 7/31/2024
Posted in pmp SPY-SH
Leave a Reply
You must be logged in to post a comment.