
  |
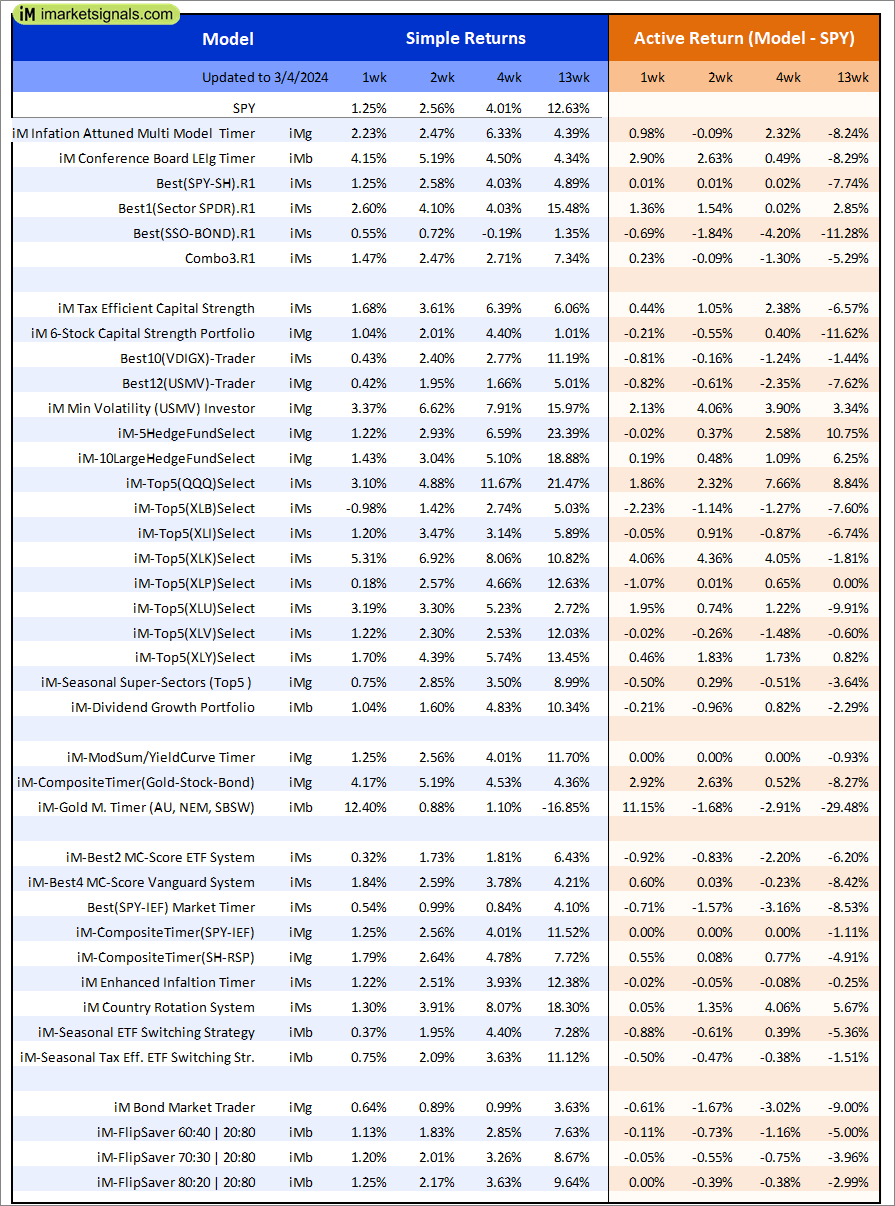
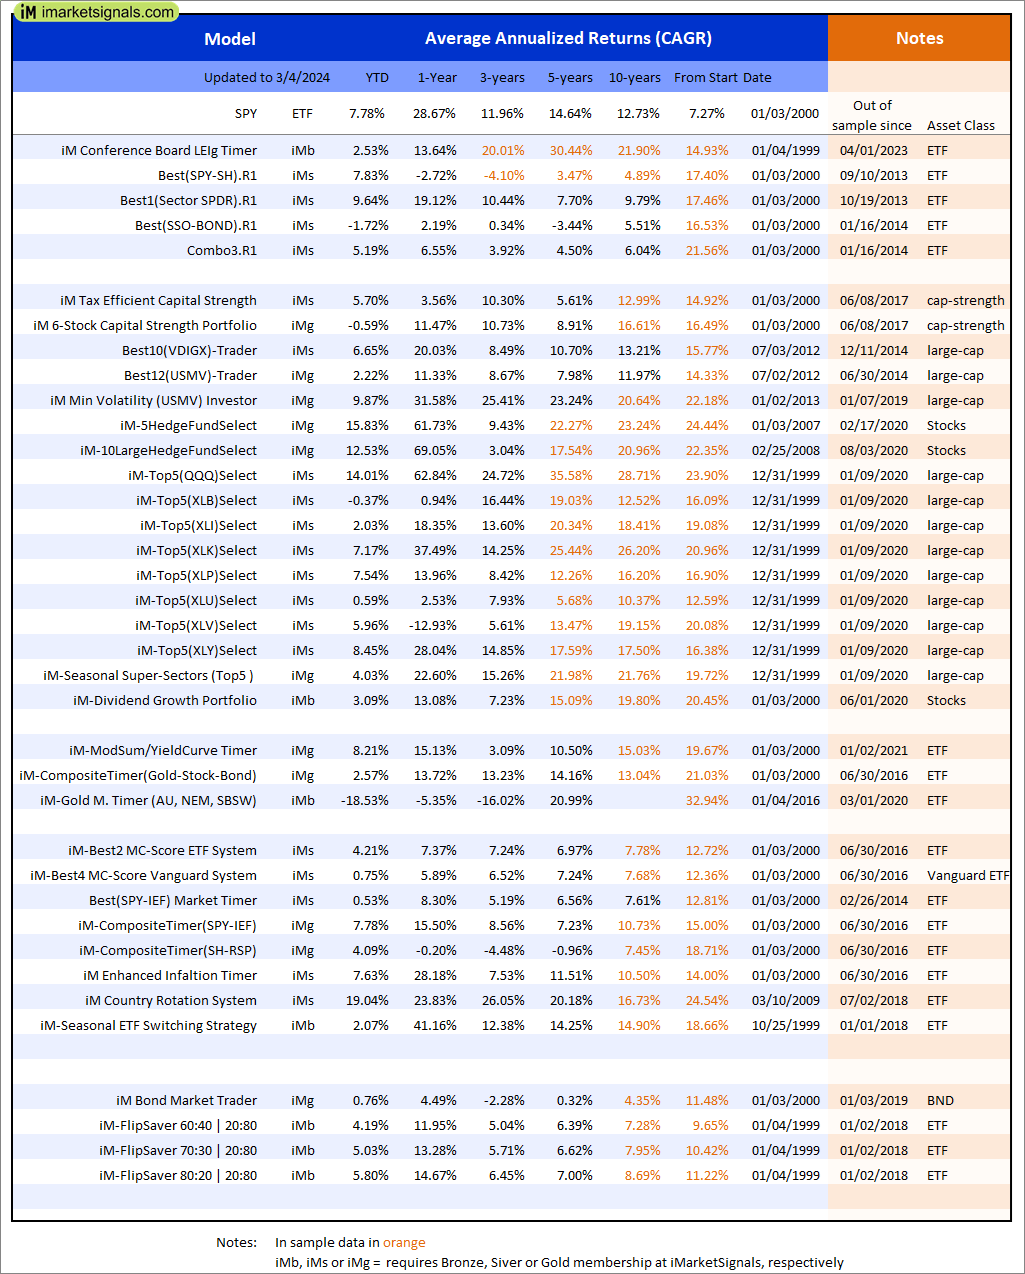
Out of sample performance summary of our models for the past 1, 2, 4 and 13 week periods. The active active return indicates how the models over- or underperformed the benchmark ETF SPY. Also the YTD, and the 1-, 3-, 5- and 10-year annualized returns are shown in the second table |
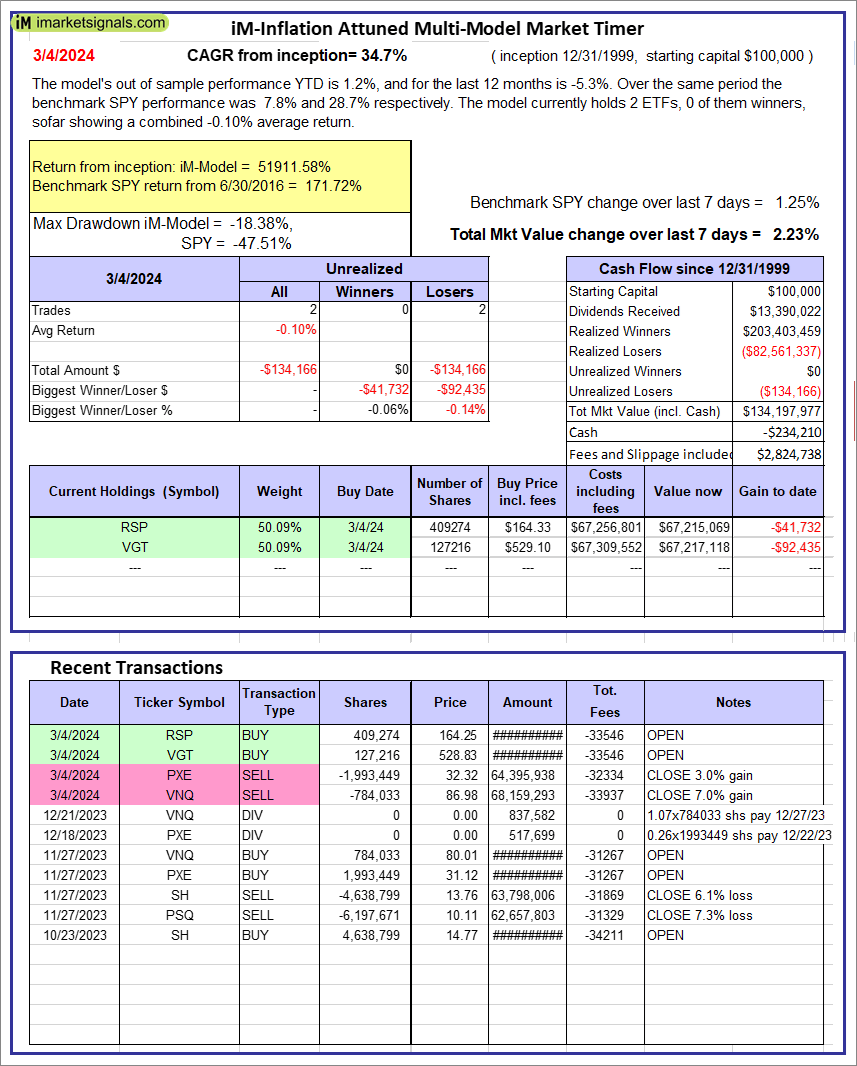 |
iM-Inflation Attuned Multi-Model Market Timer: The model’s out of sample performance YTD is 1.2%, and for the last 12 months is -5.3%. Over the same period the benchmark SPY performance was 7.8% and 28.7% respectively. Over the previous week the market value of the iM-Inflation Attuned Multi-Model Market Timer gained 2.23% at a time when SPY gained 1.25%. A starting capital of $100,000 at inception on 3/24/2017 would have grown to $134,197,977 which includes -$234,210 cash and excludes $2,824,738 spent on fees and slippage. |
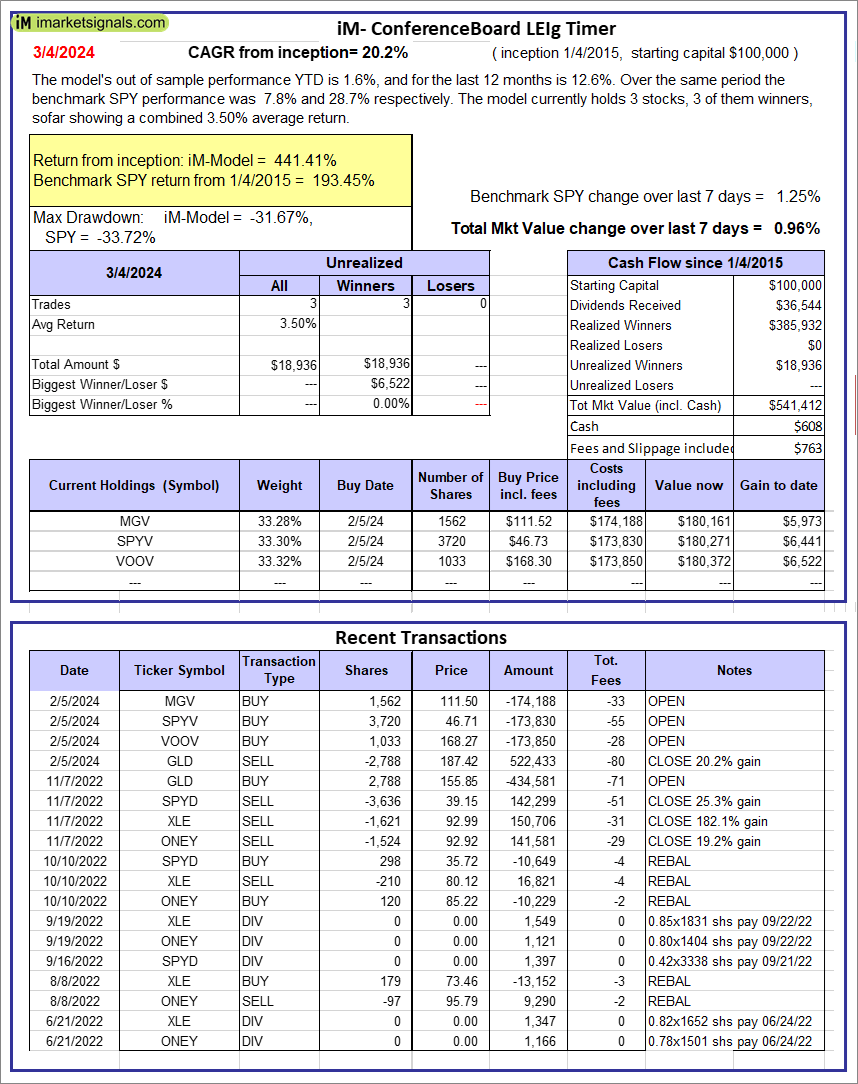 |
iM-Conference Board LEIg Timer: The model’s performance YTD is 14.3%, and for the last 12 months is 7.3%. Over the same period the benchmark SPY performance was 20.1% and 9.4% respectively. Over the previous week the market value of the iM-Conference Board LEIg Timer gained 0.96% at a time when SPY gained 1.25%. A starting capital of $100,000 at inception on 4/5/2017 would have grown to $541,412 which includes $608 cash and excludes $763 spent on fees and slippage. |
 |
iM-FlipSaver 60:40 | 20:80 – 2017: The model’s out of sample performance YTD is 4.3%, and for the last 12 months is 11.9%. Over the same period the benchmark E60B40 performance was 4.1% and 18.3% respectively. Over the previous week the market value of iM-FlipSaver 80:20 | 20:80 gained 1.14% at a time when SPY gained 0.92%. A starting capital of $100,000 at inception on 7/16/2015 would have grown to $161,492 which includes $515 cash and excludes $3,553 spent on fees and slippage. |
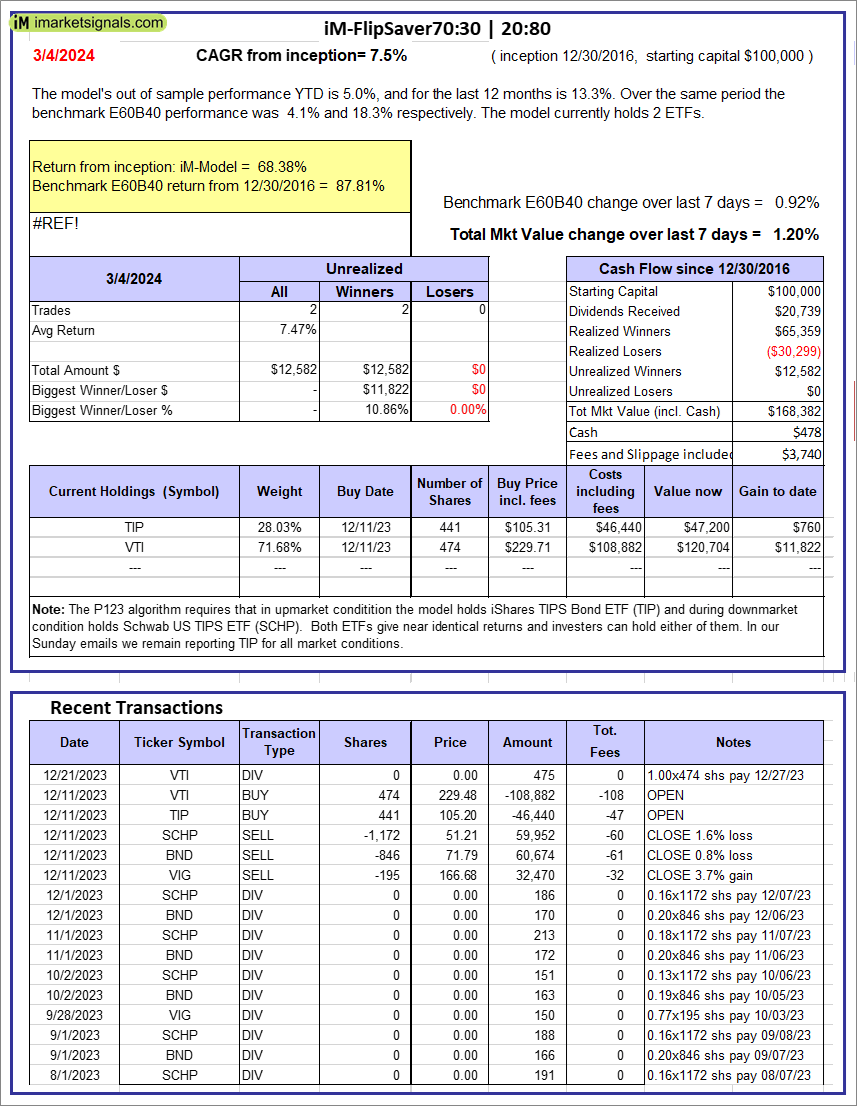 |
iM-FlipSaver 70:30 | 20:80 – 2017: The model’s out of sample performance YTD is 5.0%, and for the last 12 months is 13.3%. Over the same period the benchmark E60B40 performance was 4.1% and 18.3% respectively. Over the previous week the market value of iM-FlipSaver 70:30 | 20:80 gained 1.20% at a time when SPY gained 0.92%. A starting capital of $100,000 at inception on 7/15/2015 would have grown to $168,382 which includes $478 cash and excludes $3,740 spent on fees and slippage. |
 |
iM-FlipSaver 80:20 | 20:80 – 2017: The model’s out of sample performance YTD is 5.8%, and for the last 12 months is 14.7%. Over the same period the benchmark E60B40 performance was 4.1% and 18.3% respectively. Over the previous week the market value of iM-FlipSaver 80:20 | 20:80 gained 1.25% at a time when SPY gained 0.92%. A starting capital of $100,000 at inception on 1/2/2017 would have grown to $175,227 which includes $448 cash and excludes $3,918 spent on fees and slippage. |
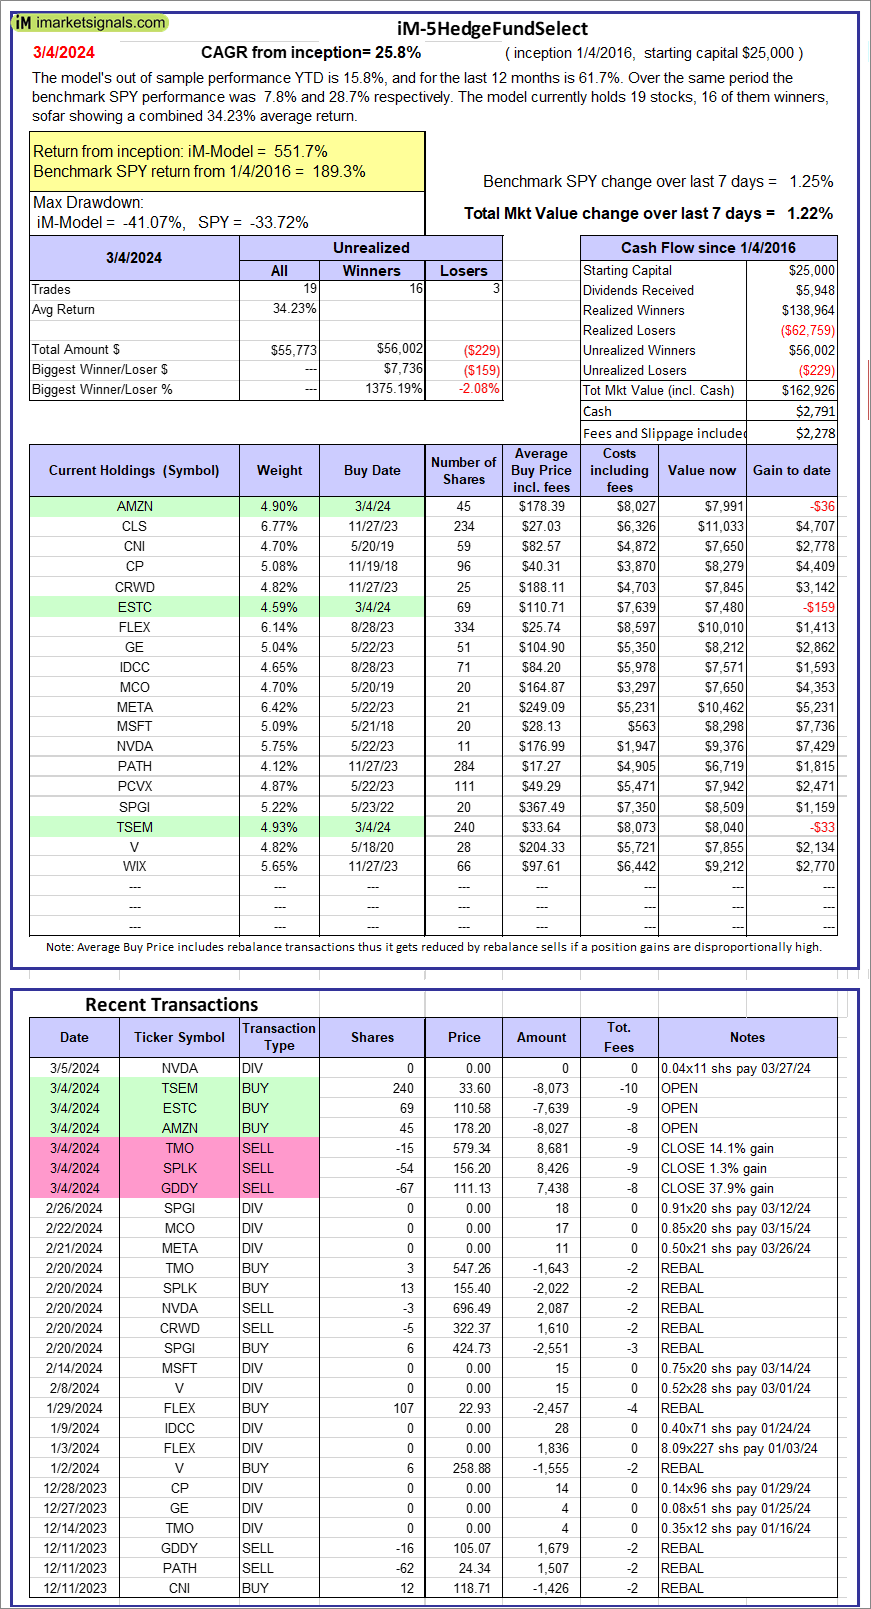 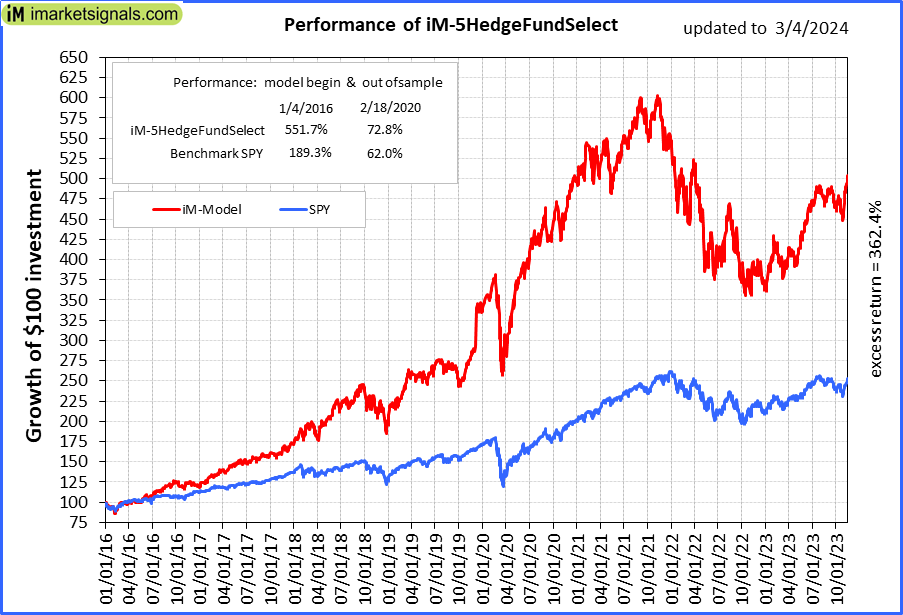 |
iM-5HedgeFundSelect: Since inception, on 1/5/2016, the model gained 551.70% while the benchmark SPY gained 189.34% over the same period. Over the previous week the market value of iM-5HedgeFundSelect gained 1.22% at a time when SPY gained 1.25%. A starting capital of $25,000 at inception on 1/5/2016 would have grown to $162,926 which includes $2,791 cash and excludes $2,278 spent on fees and slippage. |
 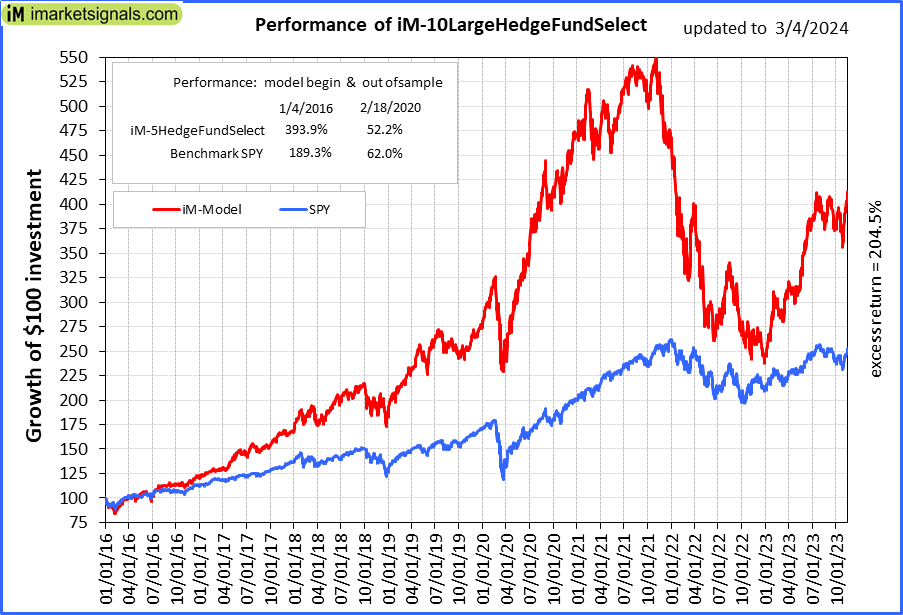 |
iM-10LargeHedgeFundSelect: Since inception, on 1/5/2016, the model gained 393.87% while the benchmark SPY gained 189.34% over the same period. Over the previous week the market value of iM-10LargeHedgeFundSelect gained 1.43% at a time when SPY gained 1.25%. A starting capital of $25,000 at inception on 1/5/2016 would have grown to $123,466 which includes $2,142 cash and excludes $1,453 spent on fees and slippage. |
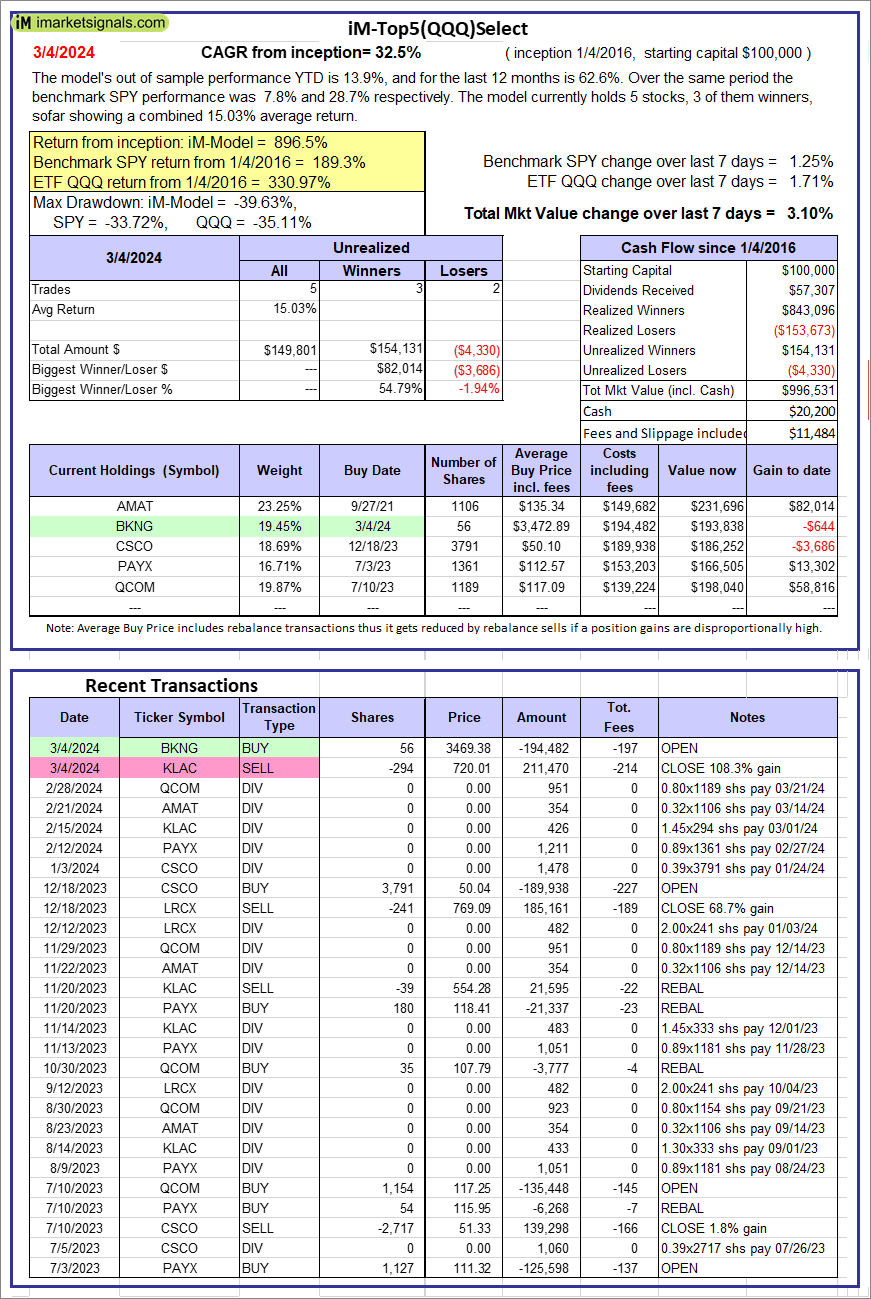 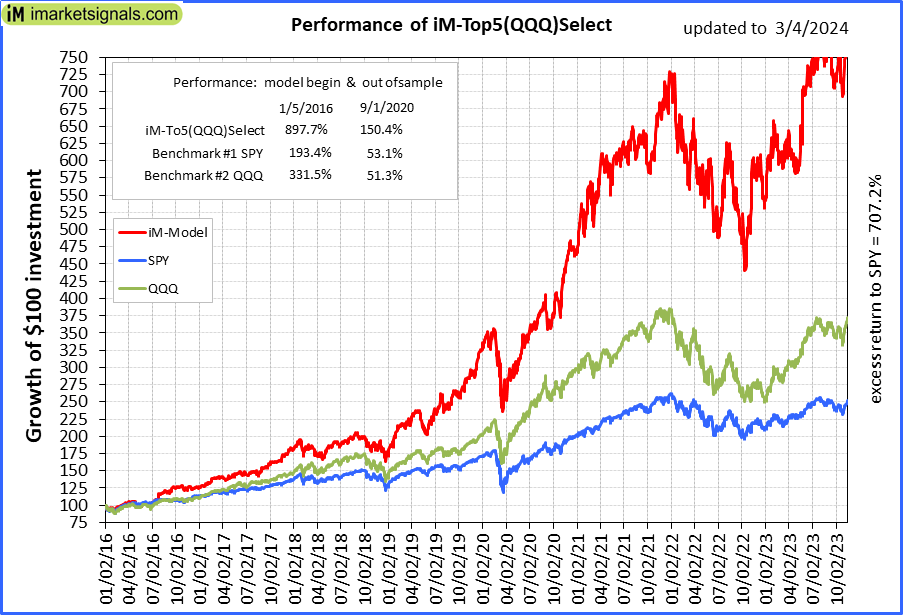 |
iM-Top5(QQQ)Select: Since inception, on 1/5/2016, the model gained 896.53% while the benchmark SPY gained 189.34% over the same period. Over the previous week the market value of iM-Top5(QQQ)Select gained 3.10% at a time when SPY gained 1.25%. A starting capital of $100,000 at inception on 1/5/2016 would have grown to $996,531 which includes $20,200 cash and excludes $11,484 spent on fees and slippage. |
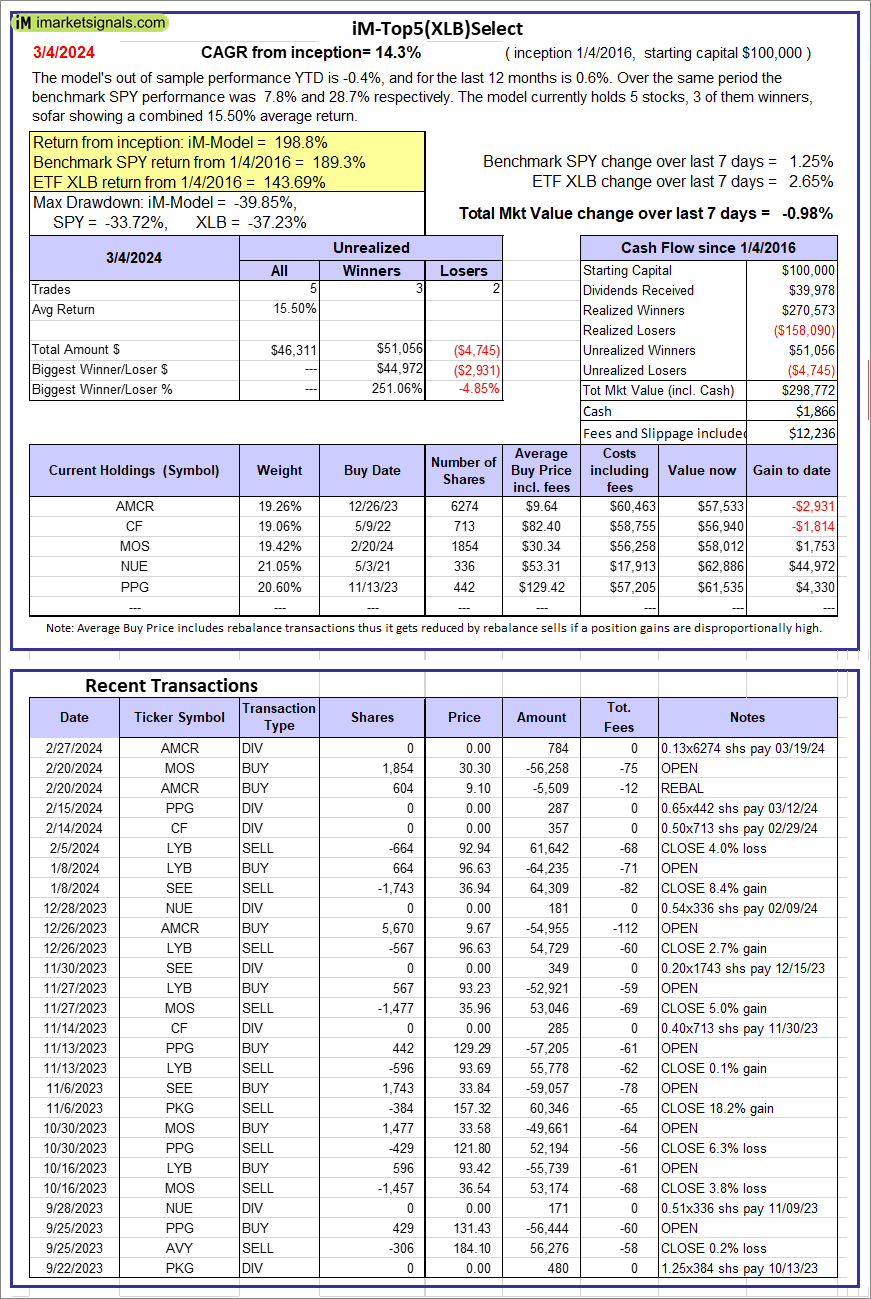 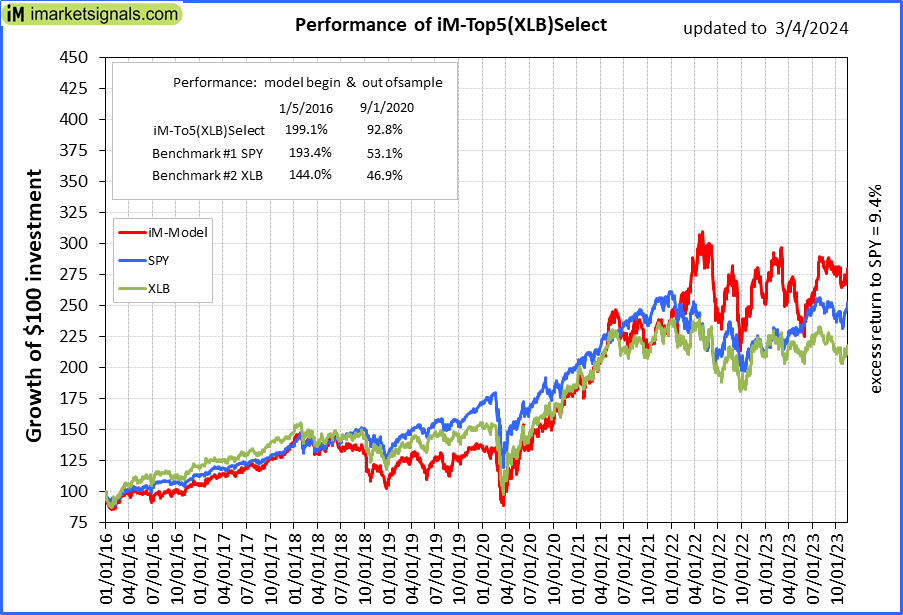 |
iM-Top5(XLB)Select: Since inception, on 1/5/2016, the model gained 198.77% while the benchmark SPY gained 189.34% over the same period. Over the previous week the market value of iM-Top5(XLB)Select gained -0.98% at a time when SPY gained 1.25%. A starting capital of $100,000 at inception on 1/5/2016 would have grown to $298,772 which includes $1,866 cash and excludes $12,236 spent on fees and slippage. |
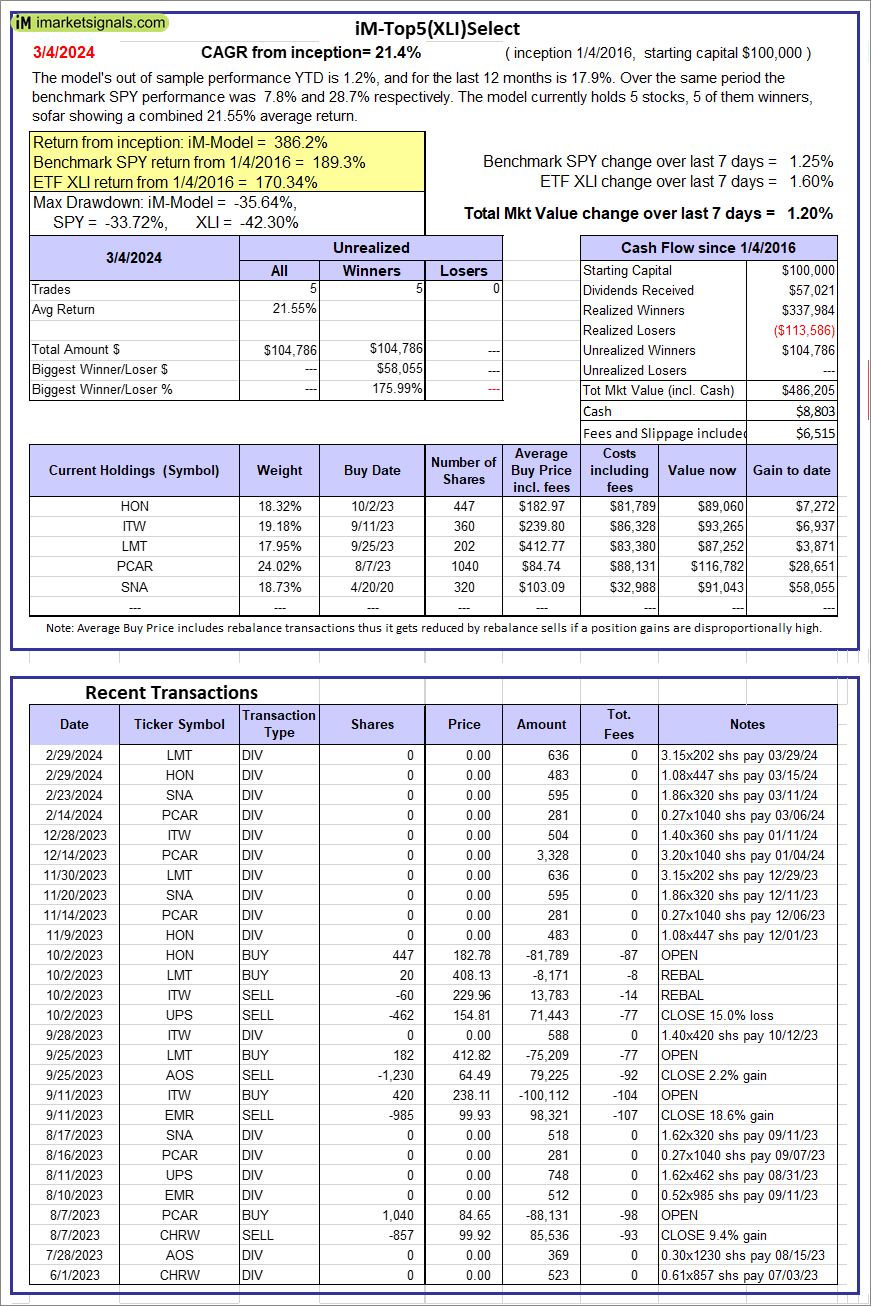 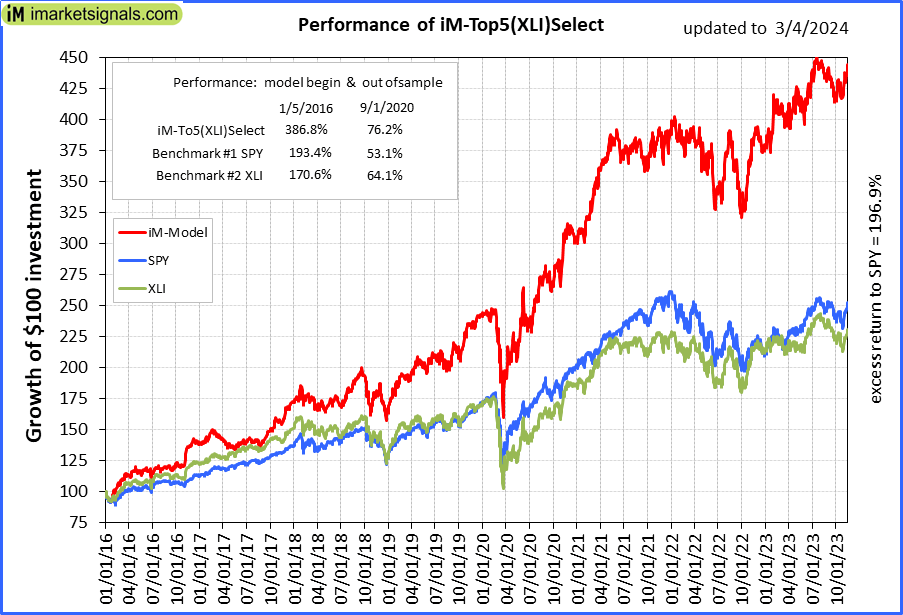 |
iM-Top5(XLI)Select: Since inception, on 1/5/2016, the model gained 386.21% while the benchmark SPY gained 189.34% over the same period. Over the previous week the market value of iM-Top5(XLI)Select gained 1.20% at a time when SPY gained 1.25%. A starting capital of $100,000 at inception on 1/5/2016 would have grown to $486,205 which includes $8,803 cash and excludes $6,515 spent on fees and slippage. |
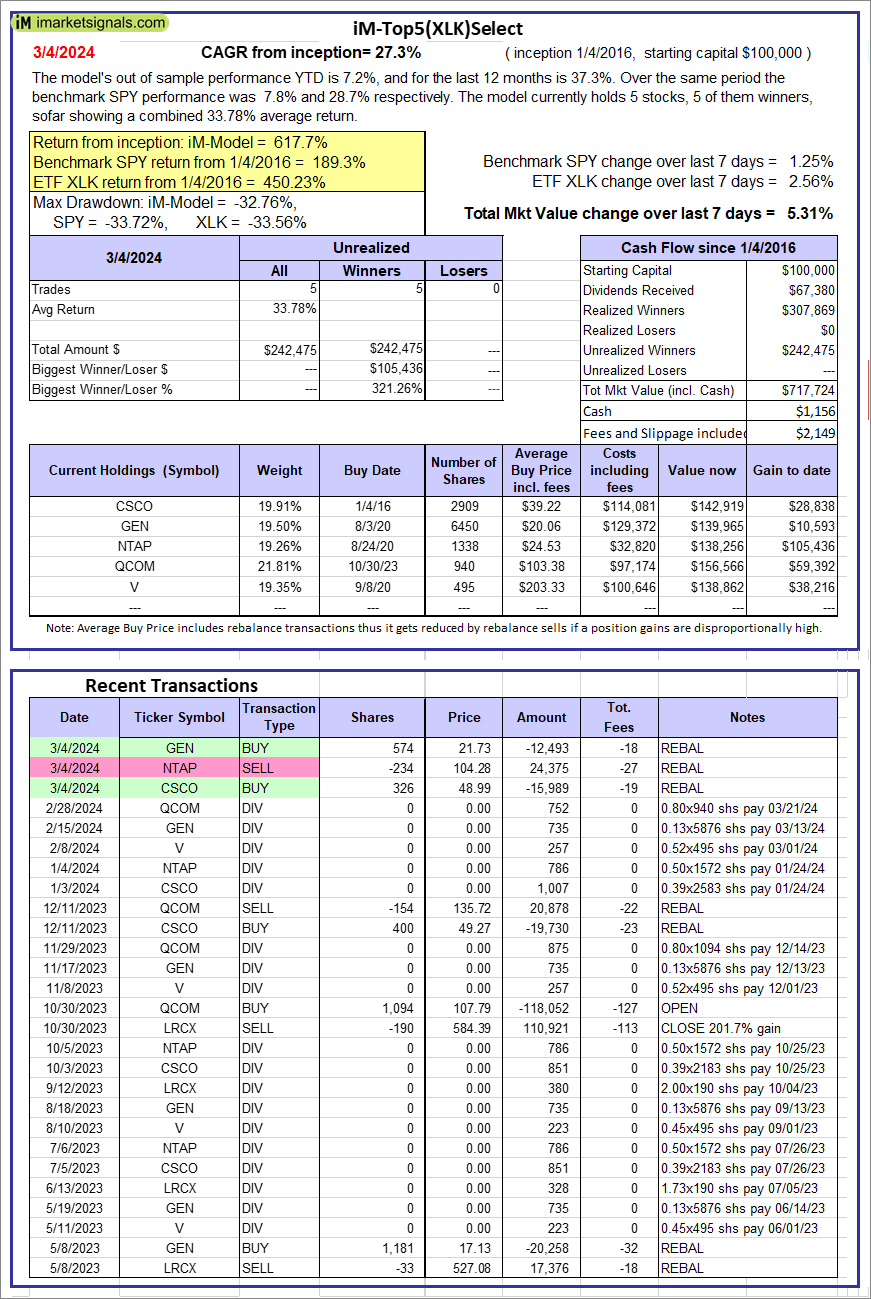 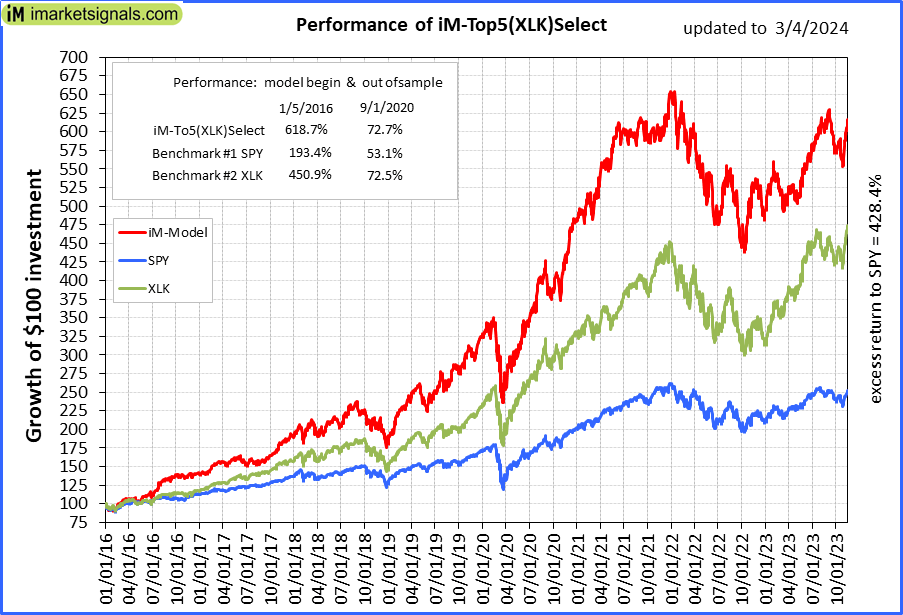 |
iM-Top5(XLK)Select: Since inception, on 1/5/2016, the model gained 617.72% while the benchmark SPY gained 189.34% over the same period. Over the previous week the market value of iM-Top5(XLK)Select gained 5.31% at a time when SPY gained 1.25%. A starting capital of $100,000 at inception on 1/5/2016 would have grown to $717,724 which includes $1,156 cash and excludes $2,149 spent on fees and slippage. |
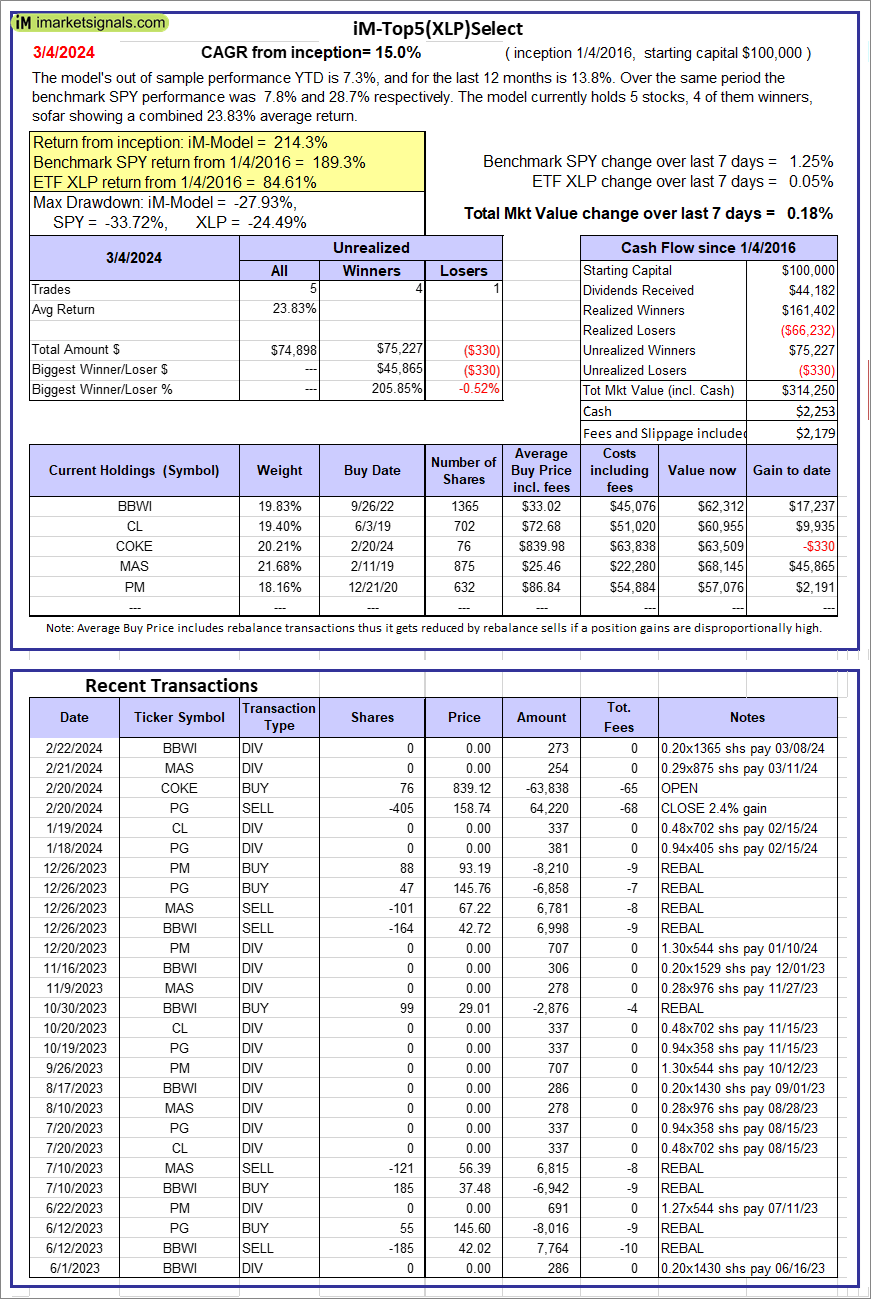 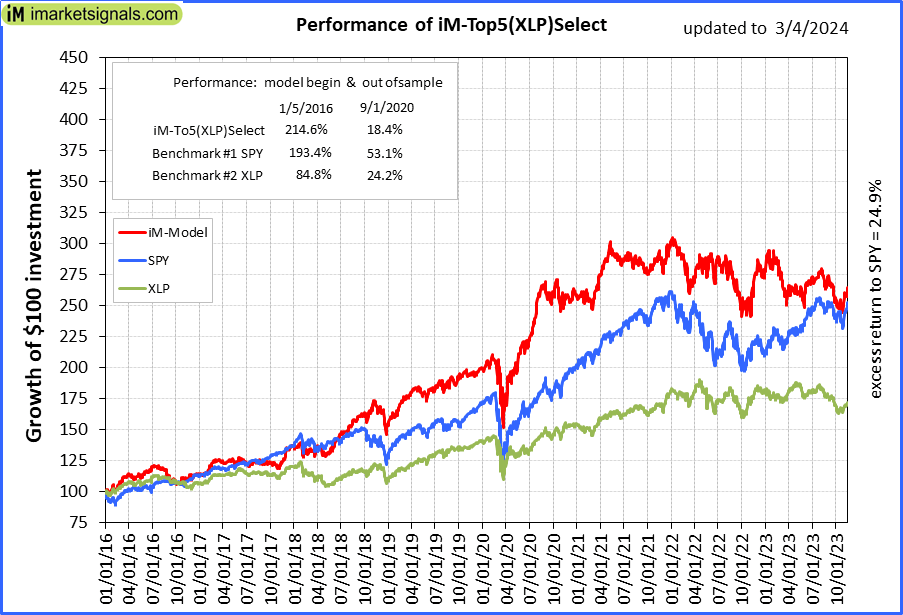 |
iM-Top5(XLP)Select: Since inception, on 1/5/2016, the model gained 214.25% while the benchmark SPY gained 189.34% over the same period. Over the previous week the market value of iM-Top5(XLP)Select gained 0.18% at a time when SPY gained 1.25%. A starting capital of $100,000 at inception on 1/5/2016 would have grown to $314,250 which includes $2,253 cash and excludes $2,179 spent on fees and slippage. |
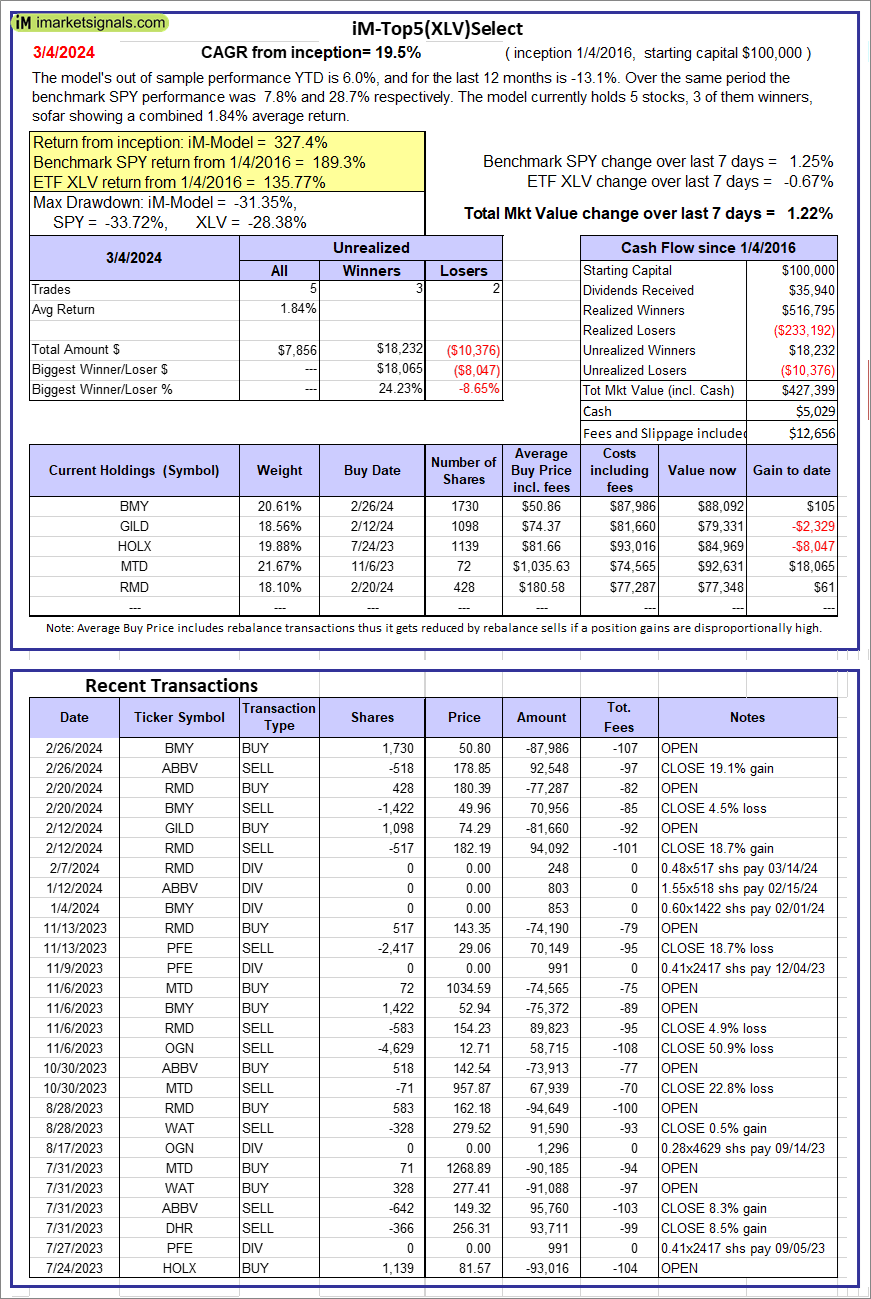 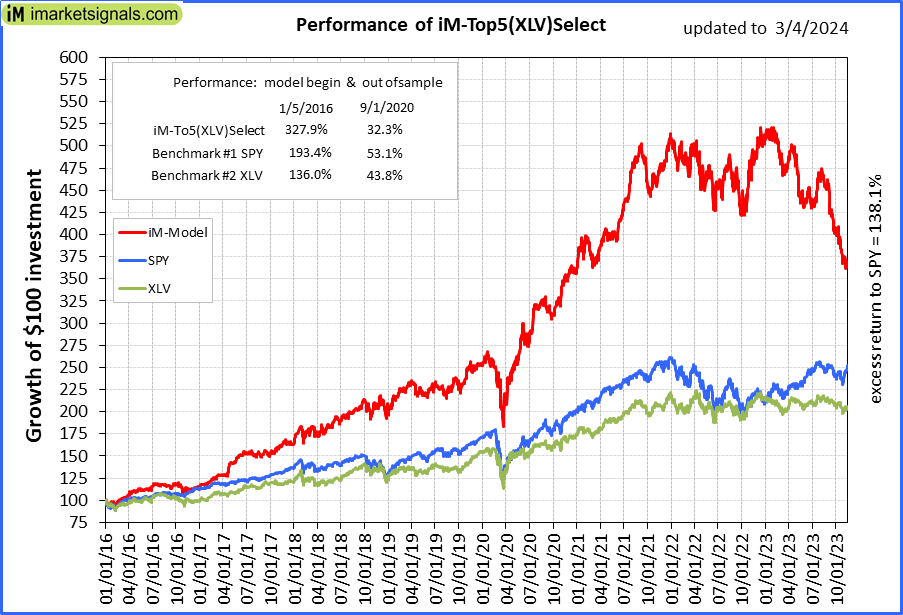 |
iM-Top5(XLV)Select: Since inception, on 1/5/2016, the model gained 327.40% while the benchmark SPY gained 189.34% over the same period. Over the previous week the market value of iM-Top5(XLV)Select gained 1.22% at a time when SPY gained 1.25%. A starting capital of $100,000 at inception on 1/5/2016 would have grown to $427,399 which includes $5,029 cash and excludes $12,656 spent on fees and slippage. |
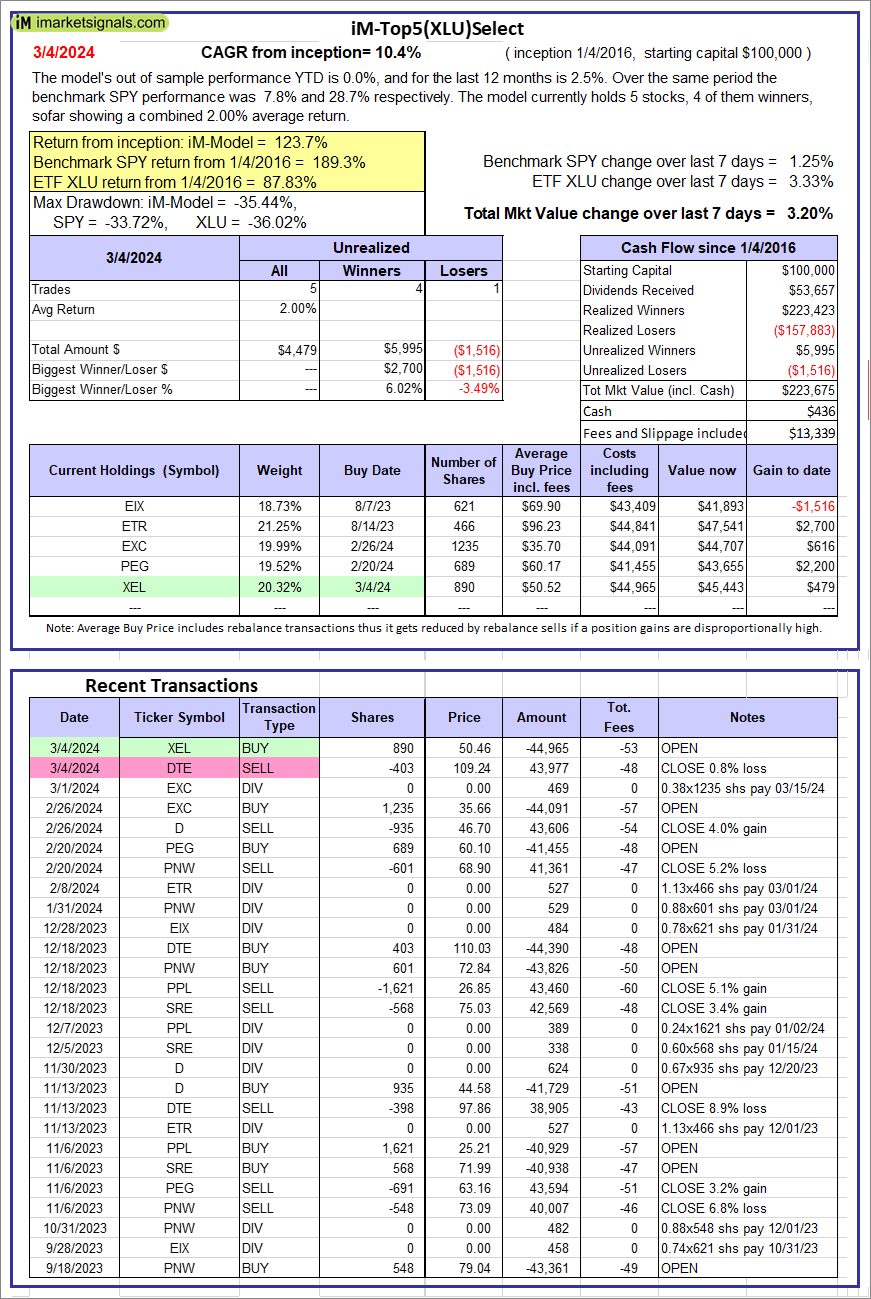 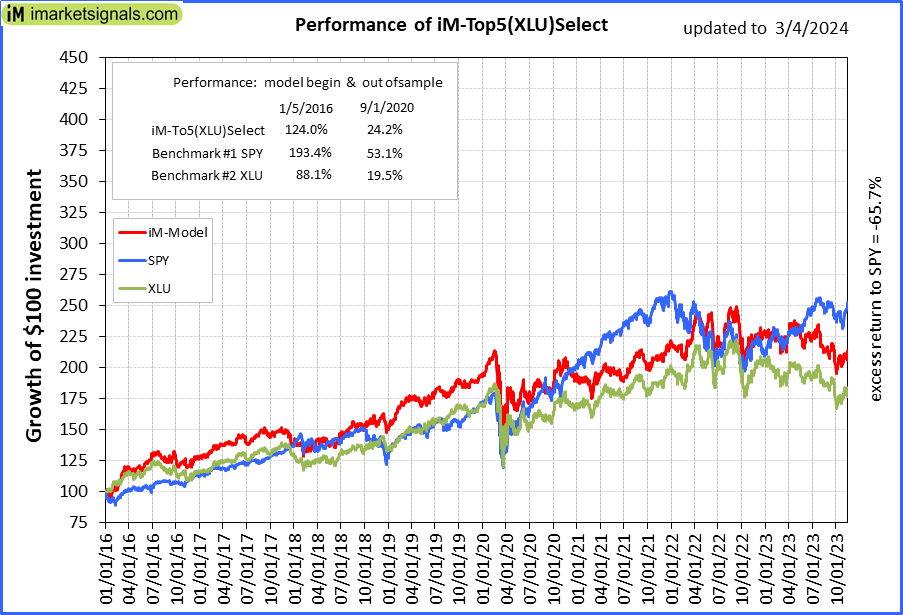 |
iM-Top5(XLU)Select: Since inception, on 1/5/2016, the model gained 123.67% while the benchmark SPY gained 189.34% over the same period. Over the previous week the market value of iM-Top5(XLU)Select gained 3.20% at a time when SPY gained 1.25%. A starting capital of $100,000 at inception on 1/5/2016 would have grown to $223,675 which includes $436 cash and excludes $13,339 spent on fees and slippage. |
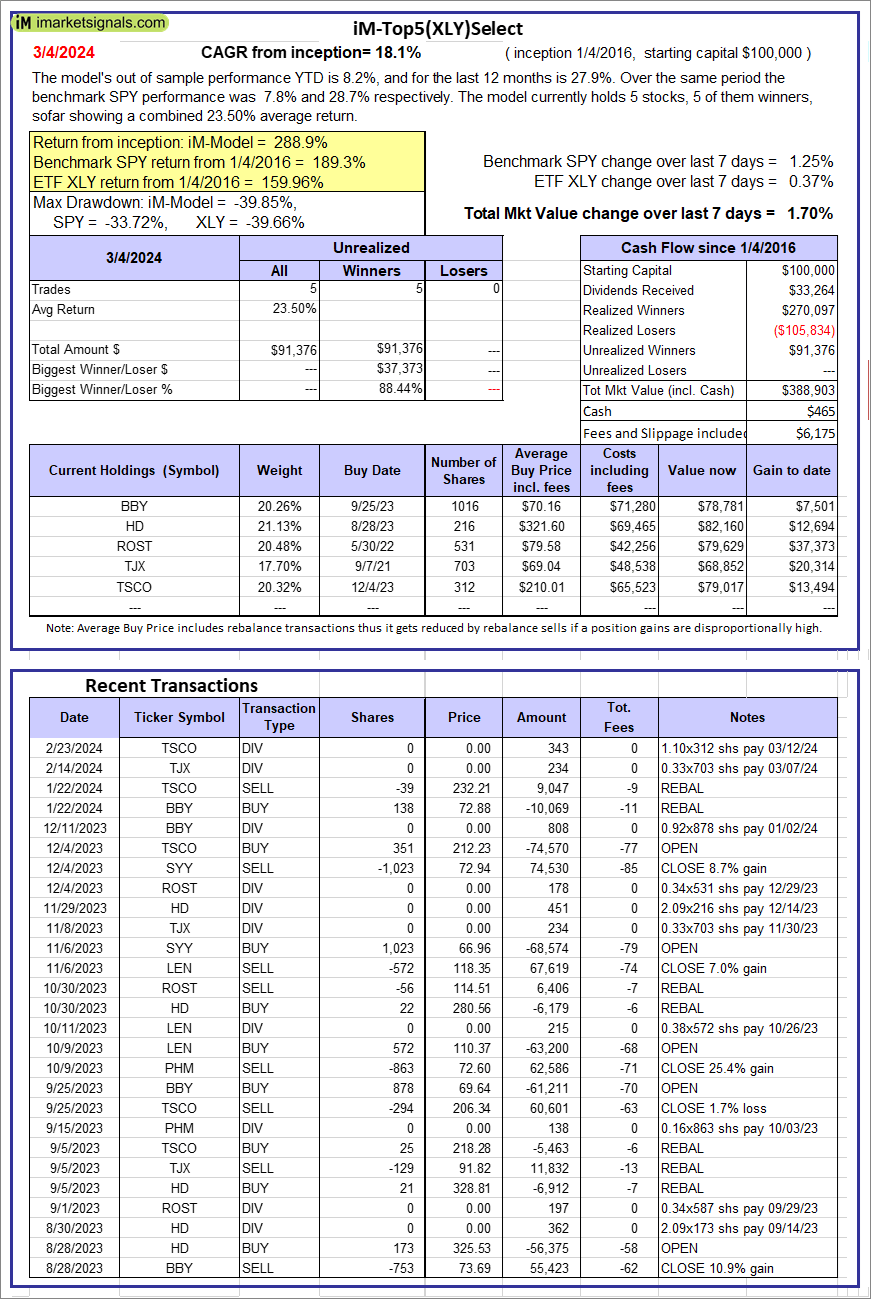 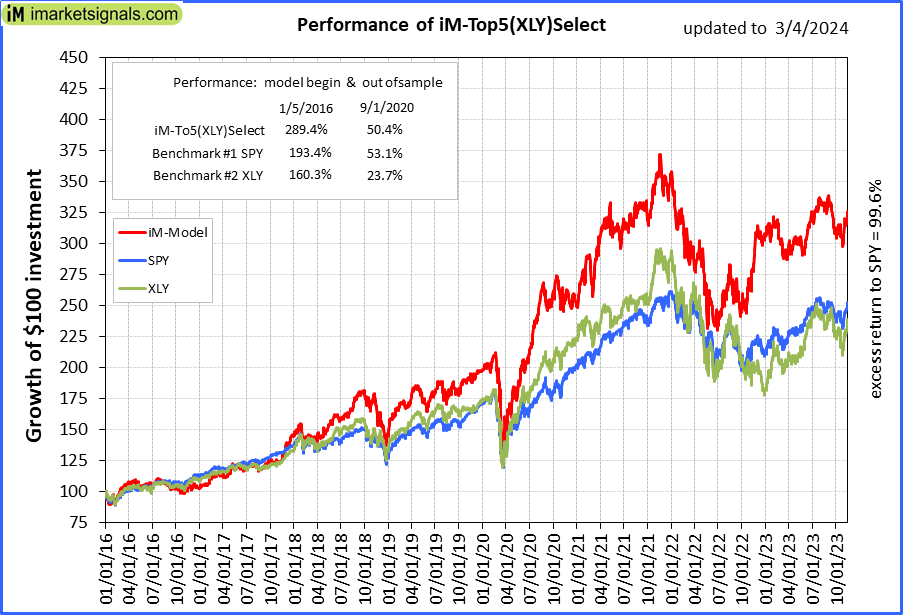 |
iM-Top5(XLY)Select: Since inception, on 1/5/2016, the model gained 288.90% while the benchmark SPY gained 189.34% over the same period. Over the previous week the market value of iM-Top5(XLY)Select gained 1.70% at a time when SPY gained 1.25%. A starting capital of $100,000 at inception on 1/5/2016 would have grown to $388,903 which includes $465 cash and excludes $6,175 spent on fees and slippage. |
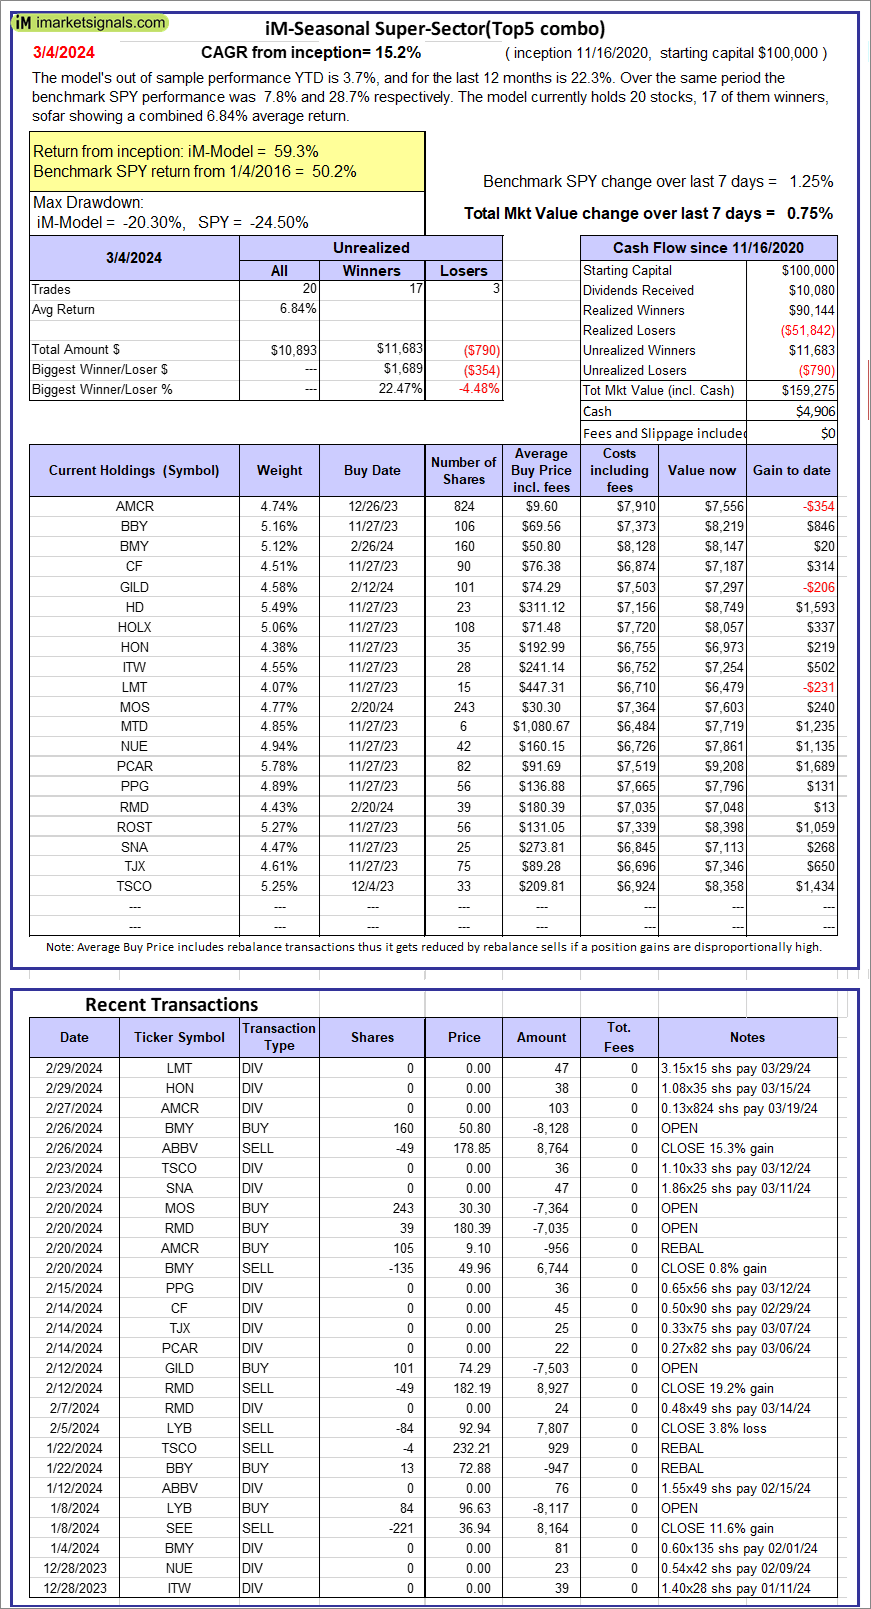 |
iM-Seasonal Super-Sectors (Top5 combo) : Since inception, on 11/17/2020, the model gained 59.27% while the benchmark SPY gained 50.20% over the same period. Over the previous week the market value of iM-Seasonal Super-Sectors (Top5 combo) gained 0.75% at a time when SPY gained 1.25%. A starting capital of $100,000 at inception on 11/17/2020 would have grown to $159,275 which includes $4,906 cash and excludes $00 spent on fees and slippage. |
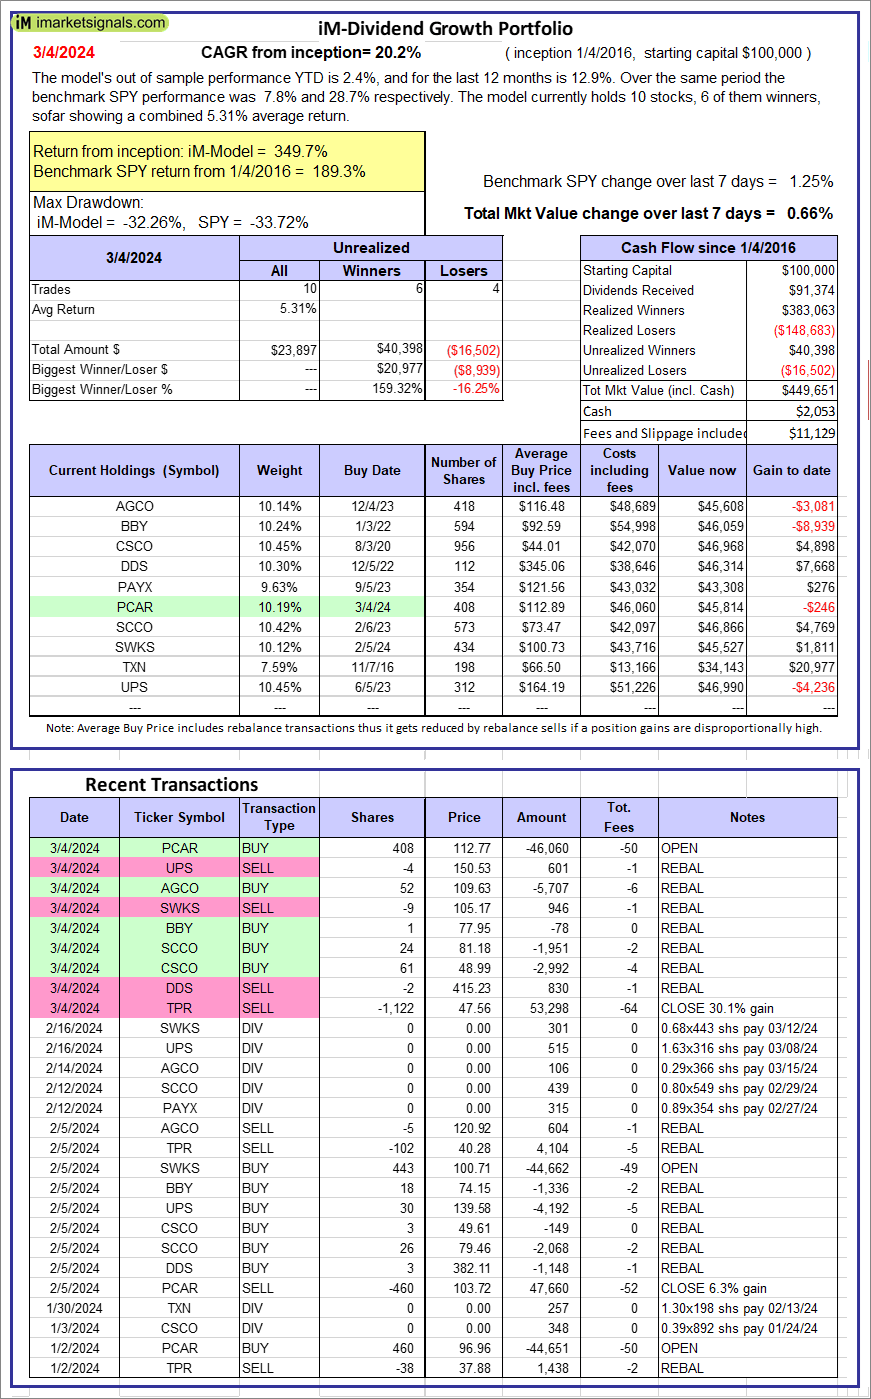 |
iM-Dividend Growth Portfolio: The model’s out of sample performance YTD is 2.4%, and for the last 12 months is 12.9%. Over the same period the benchmark SPY performance was 7.8% and 28.7% respectively. Over the previous week the market value of the iM-Dividend Growth Portfolio gained 0.66% at a time when SPY gained 1.25%. A starting capital of $100,000 at inception on 6/30/2016 would have grown to $449,651 which includes $2,053 cash and excludes $11,129 spent on fees and slippage. |
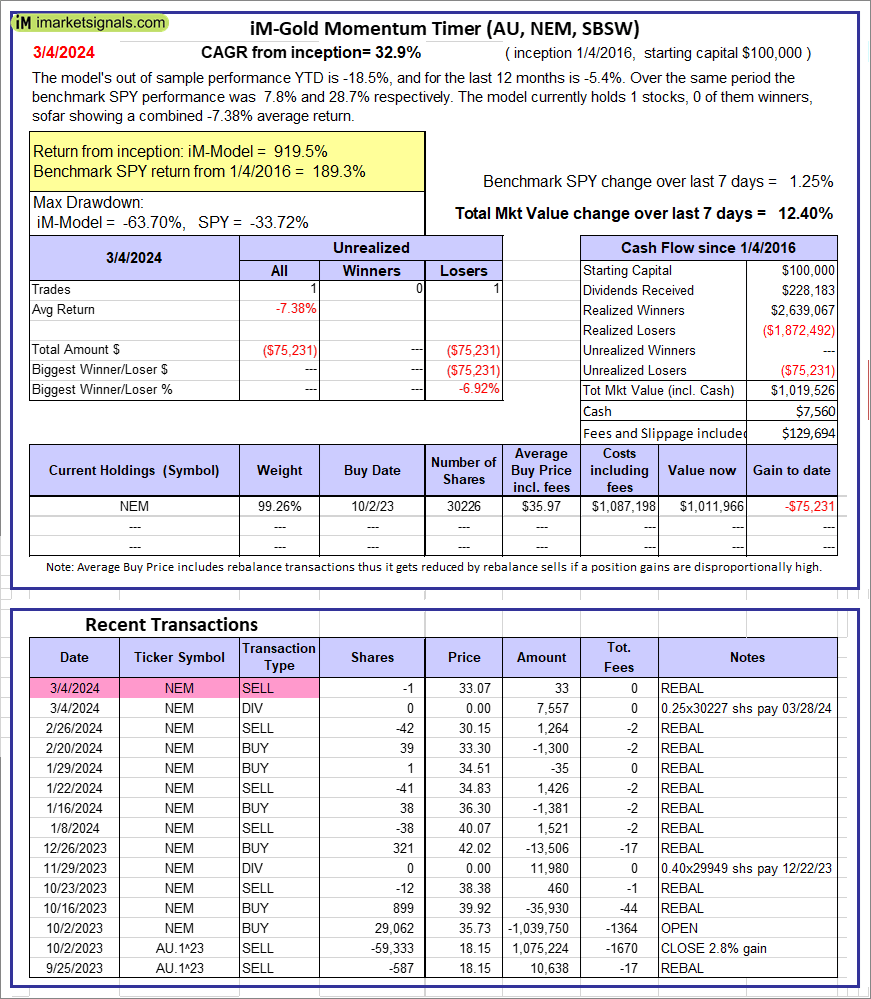 |
iM-Gold Momentum Timer (AU, NEM, SBSW): The model’s out of sample performance YTD is -18.5%, and for the last 12 months is -5.4%. Over the same period the benchmark SPY performance was 7.8% and 28.7% respectively. Over the previous week the market value of iM-Gold Momentum Timer (AU, NEM, SBSW) gained 12.40% at a time when SPY gained 1.25%. A starting capital of $100,000 at inception on 6/30/2016 would have grown to $7,560 which includes $129,694 cash and excludes Gain to date spent on fees and slippage. |
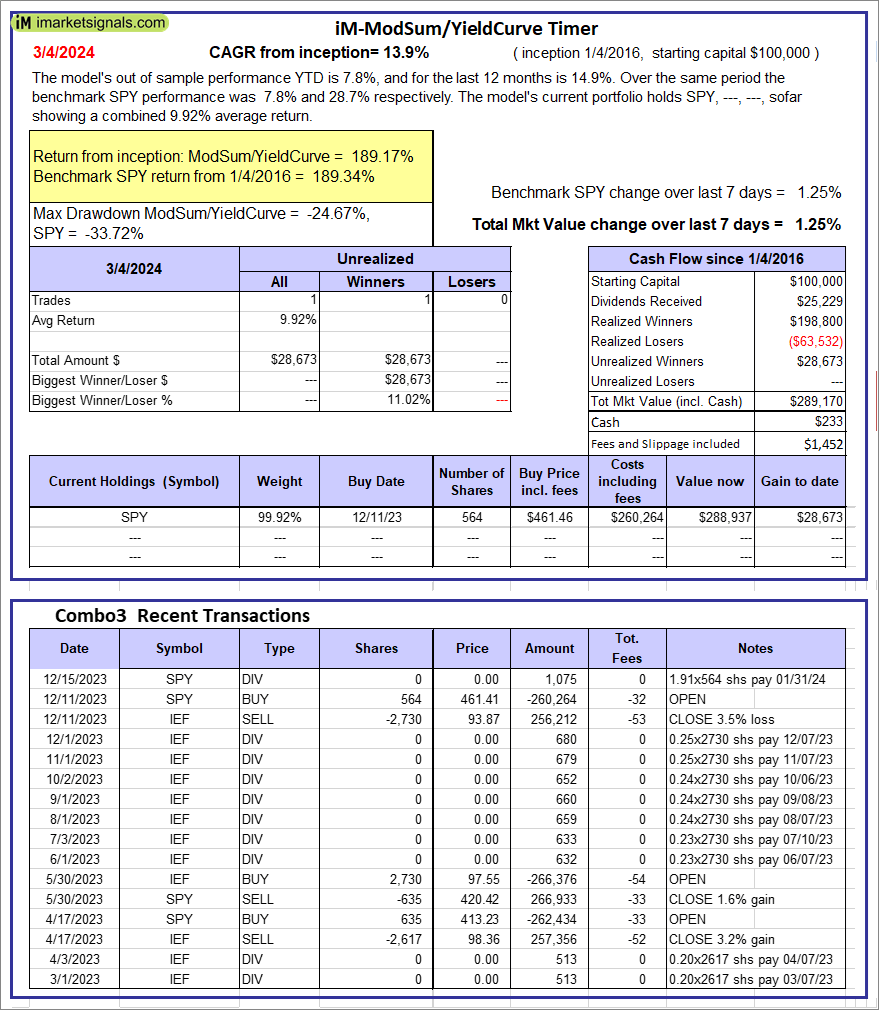 |
iM-ModSum/YieldCurve Timer: The model’s out of sample performance YTD is 7.8%, and for the last 12 months is 14.9%. Over the same period the benchmark SPY performance was 7.8% and 28.7% respectively. Over the previous week the market value of iM-PortSum/YieldCurve Timer gained 1.25% at a time when SPY gained 1.25%. A starting capital of $100,000 at inception on 1/1/2016 would have grown to $289,170 which includes $233 cash and excludes $1,452 spent on fees and slippage. |
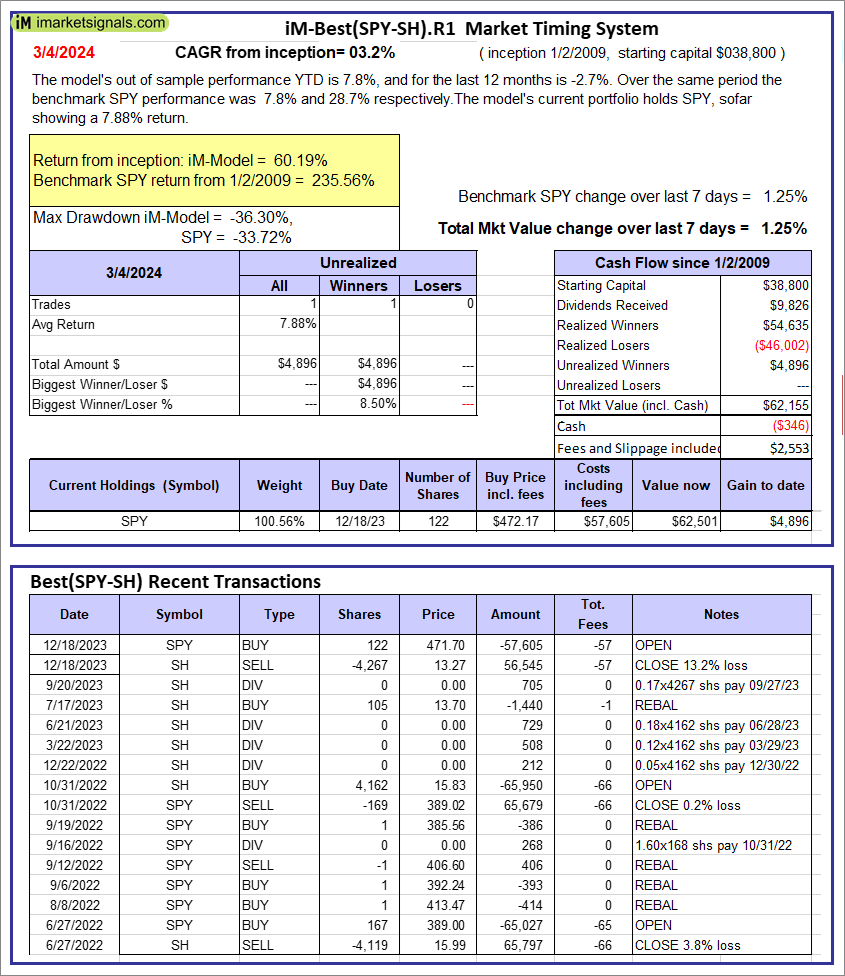 |
iM-Best(SPY-SH).R1: The model’s out of sample performance YTD is 7.8%, and for the last 12 months is -2.7%. Over the same period the benchmark SPY performance was 7.8% and 28.7% respectively. Over the previous week the market value of Best(SPY-SH) gained 1.25% at a time when SPY gained 1.25%. A starting capital of $100,000 at inception on 1/2/2009 would have grown to $62,155 which includes -$346 cash and excludes $2,553 spent on fees and slippage. |
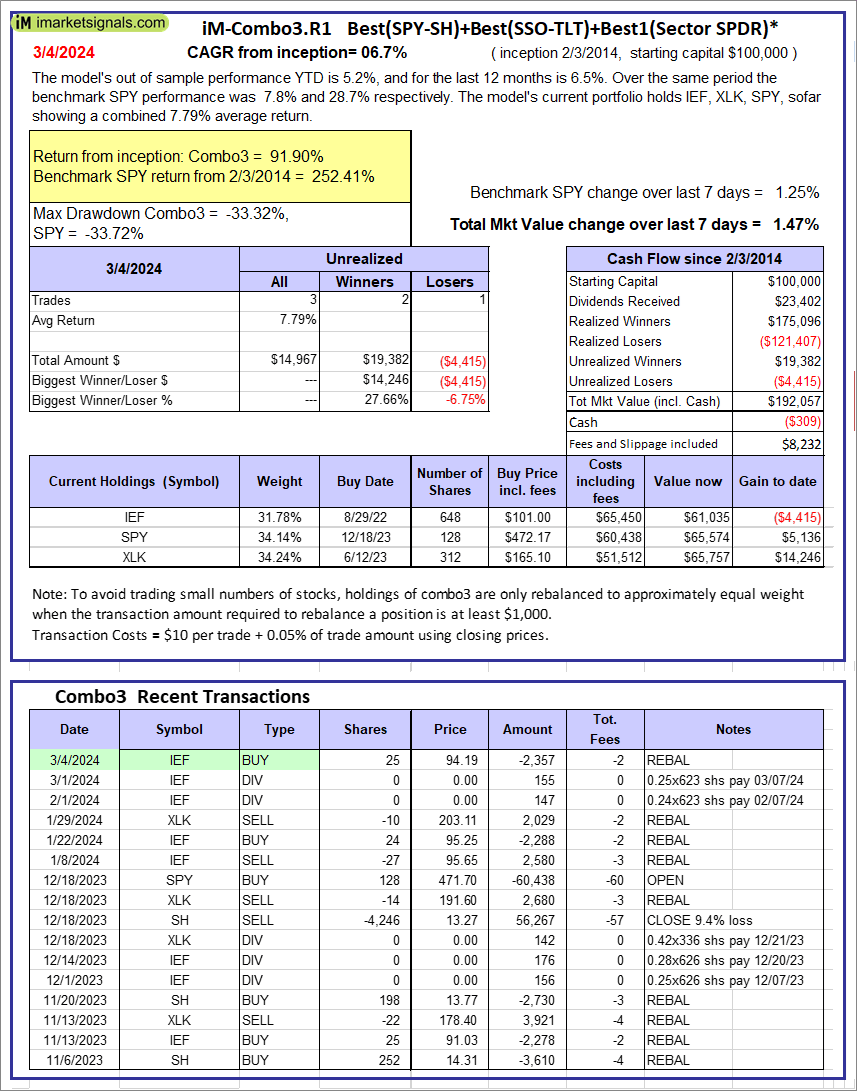 |
iM-Combo3.R1: The model’s out of sample performance YTD is 5.2%, and for the last 12 months is 6.5%. Over the same period the benchmark SPY performance was 7.8% and 28.7% respectively. Over the previous week the market value of iM-Combo3.R1 gained 1.47% at a time when SPY gained 1.25%. A starting capital of $100,000 at inception on 2/3/2014 would have grown to $192,057 which includes -$309 cash and excludes $8,232 spent on fees and slippage. |
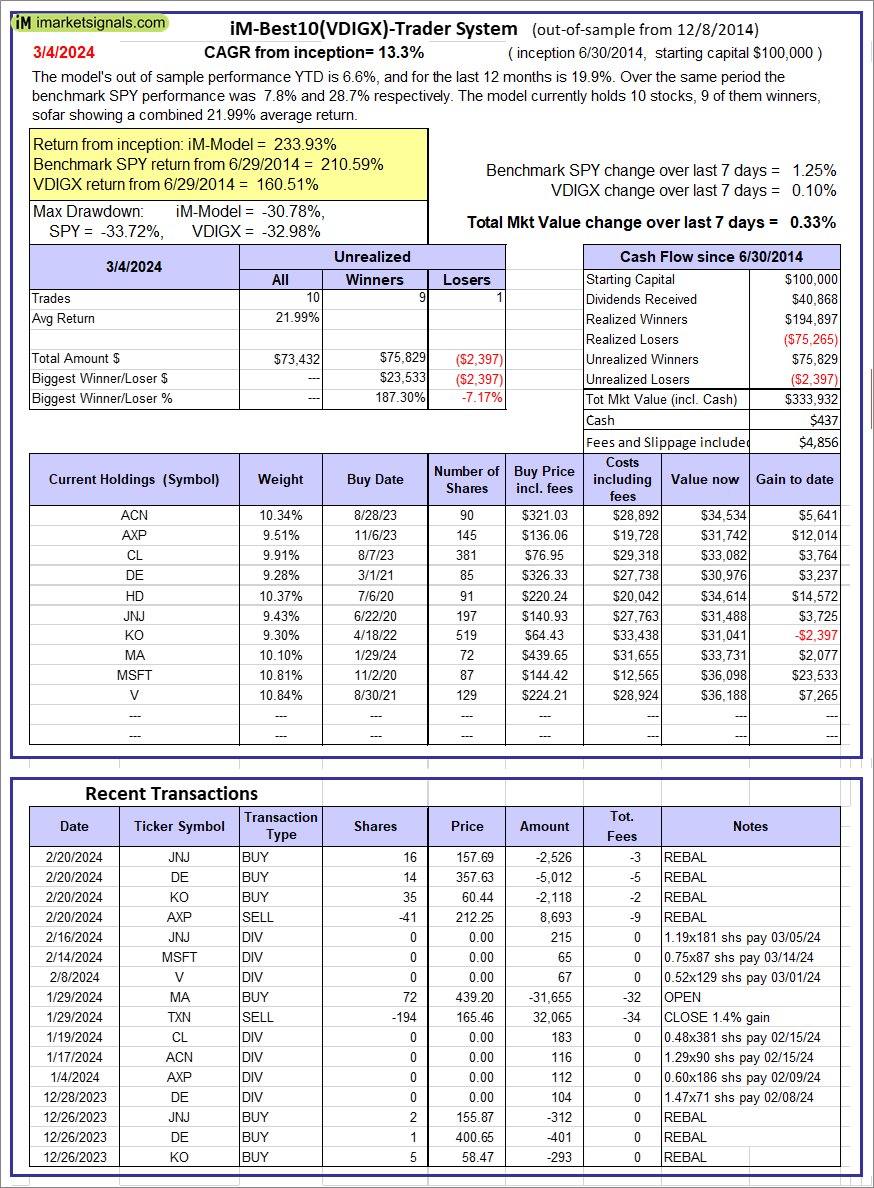 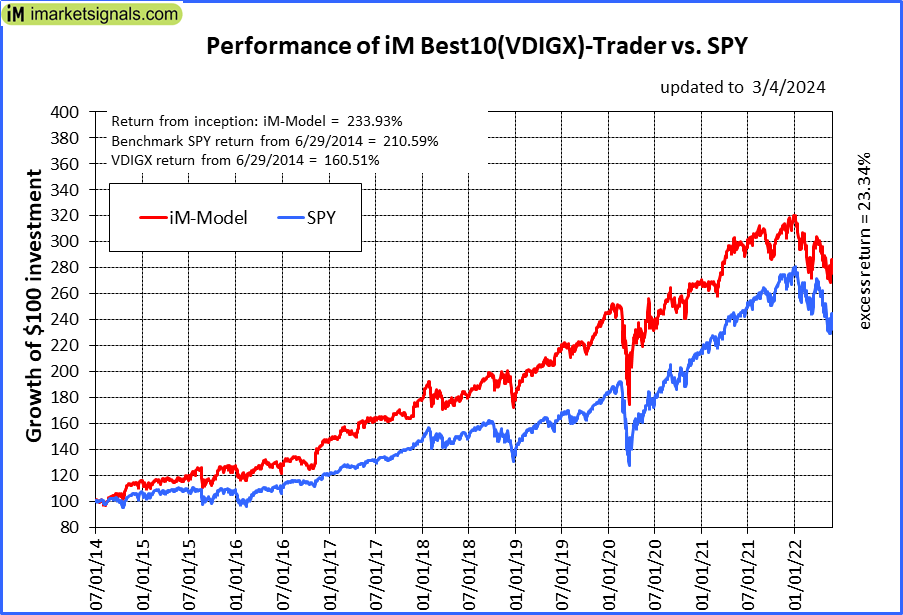 |
iM-Best10(VDIGX)-Trader: The model’s out of sample performance YTD is 6.6%, and for the last 12 months is 19.9%. Over the same period the benchmark SPY performance was 7.8% and 28.7% respectively. Since inception, on 7/1/2014, the model gained 233.93% while the benchmark SPY gained 210.59% and VDIGX gained 160.51% over the same period. Over the previous week the market value of iM-Best10(VDIGX) gained 0.33% at a time when SPY gained 1.25%. A starting capital of $100,000 at inception on 7/1/2014 would have grown to $333,932 which includes $437 cash and excludes $4,856 spent on fees and slippage. |
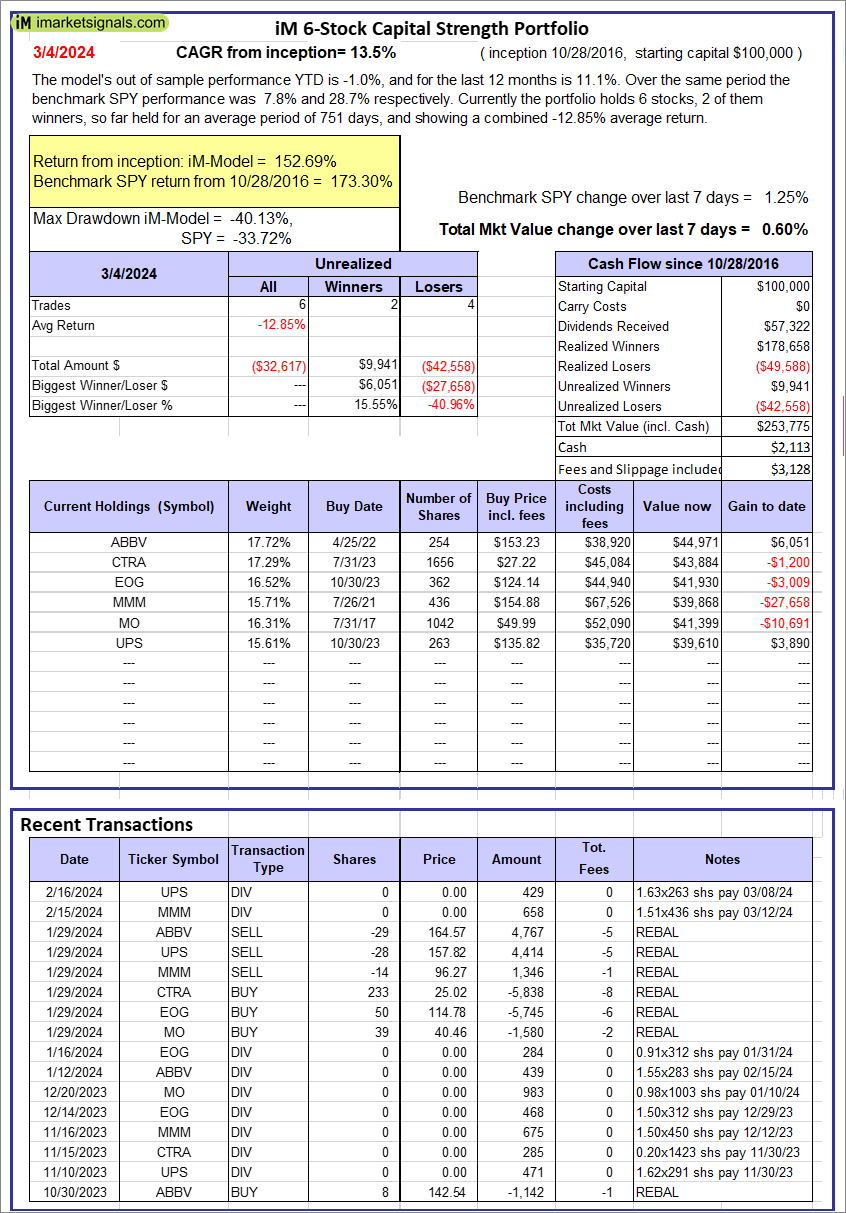 |
iM 6-Stock Capital Strength Portfolio: The model’s out of sample performance YTD is -1.0%, and for the last 12 months is 11.1%. Over the same period the benchmark SPY performance was 7.8% and 28.7% respectively. Over the previous week the market value of the iM 6-Stock Capital Strength Portfolio gained 0.60% at a time when SPY gained 1.25%. A starting capital of $100,000 at inception on 10/28/2016 would have grown to $253,775 which includes $2,113 cash and excludes $3,128 spent on fees and slippage. |
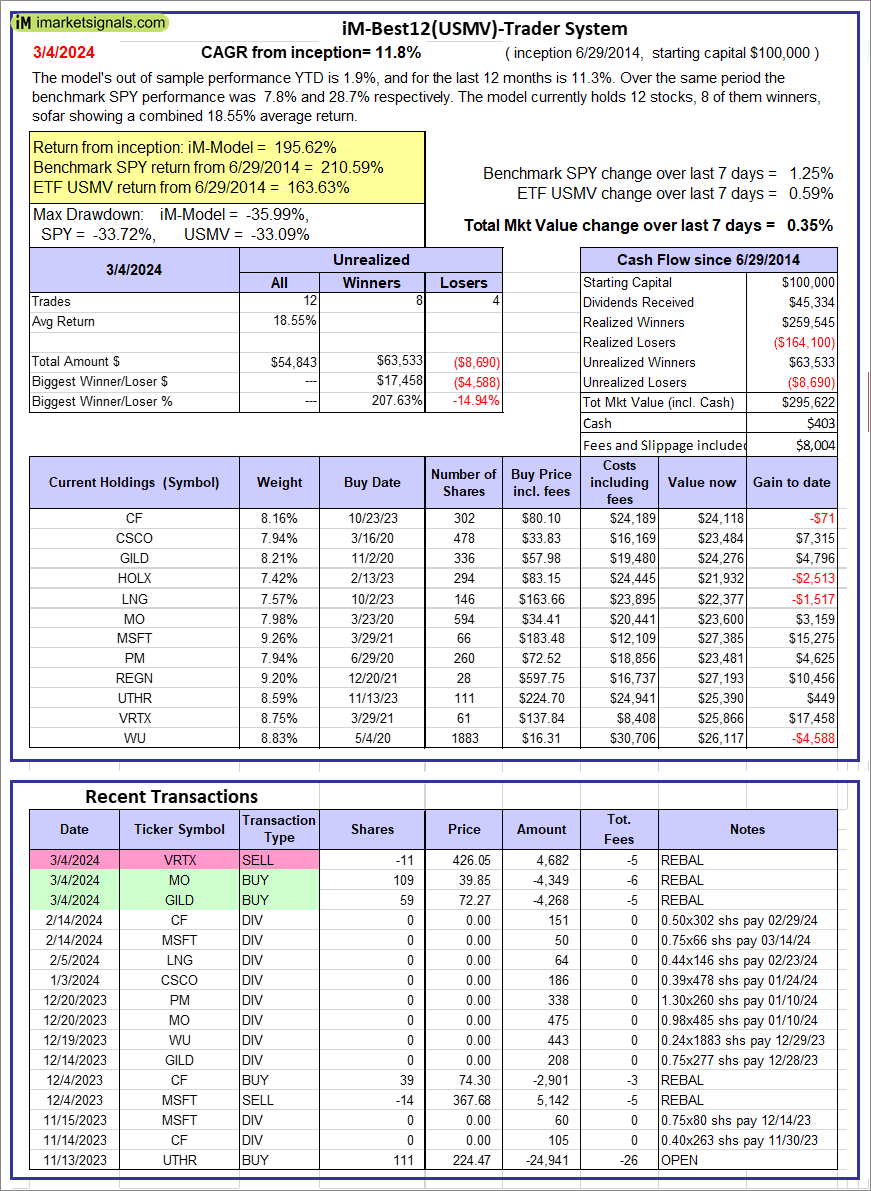 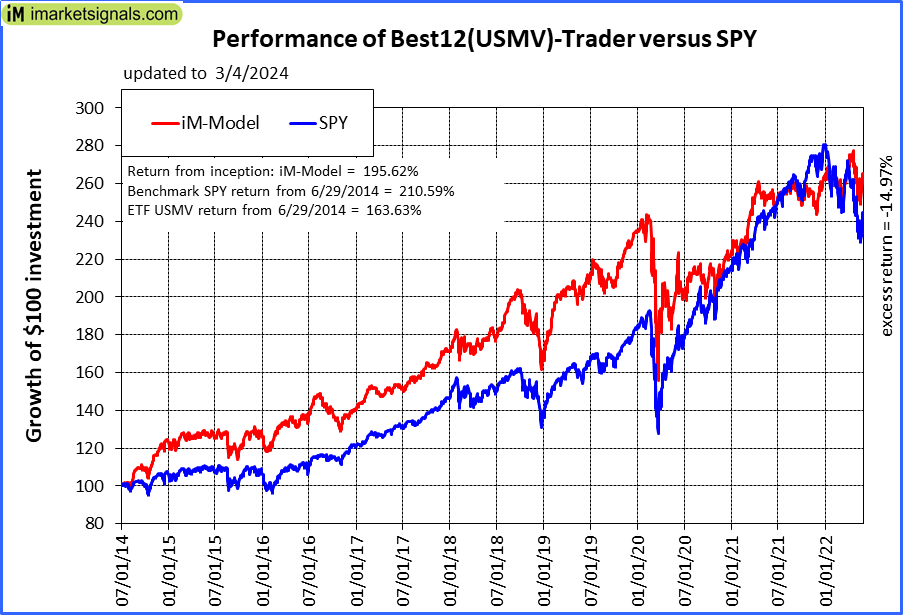 |
iM-Best12(USMV)-Trader: The model’s out of sample performance YTD is 1.9%, and for the last 12 months is 11.3%. Over the same period the benchmark SPY performance was 7.8% and 28.7% respectively. Since inception, on 6/30/2014, the model gained 195.62% while the benchmark SPY gained 210.59% and the ETF USMV gained 163.63% over the same period. Over the previous week the market value of iM-Best12(USMV)-Trader gained 0.35% at a time when SPY gained 1.25%. A starting capital of $100,000 at inception on 6/30/2014 would have grown to $295,622 which includes $403 cash and excludes $8,004 spent on fees and slippage. |
 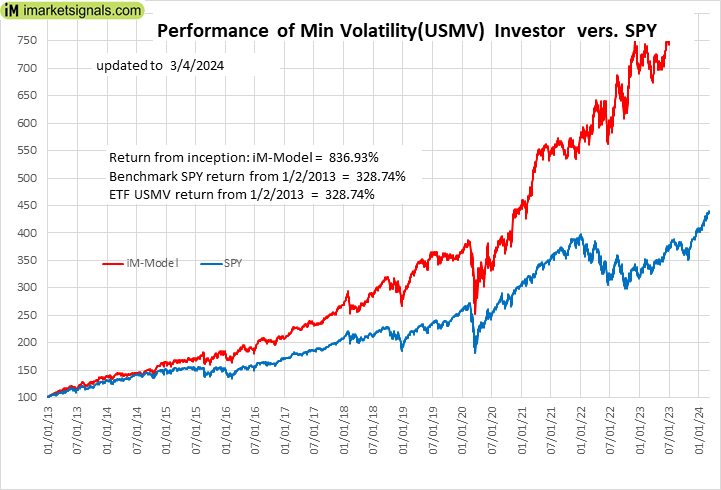 |
iM-Min Volatility(USMV) Investor (Tax Efficient): The model’s out of sample performance YTD is 9.8%, and for the last 12 months is 31.5%. Over the same period the benchmark SPY performance was 7.8% and 28.7% respectively. Since inception, on 1/3/2013, the model gained 836.93% while the benchmark SPY gained 328.74% and the ETF USMV gained 328.74% over the same period. Over the previous week the market value of iM-Best12(USMV)Q1 gained 3.37% at a time when SPY gained 1.25%. A starting capital of $100,000 at inception on 1/3/2013 would have grown to $936,929 which includes $4,635 cash and excludes $9,140 spent on fees and slippage. |
 |
iM-Bond Market Trader (High-Yield Bond or 10-yr Treasury Bond): The model’s out of sample performance YTD is 0.8%, and for the last 12 months is 4.3%. Over the same period the benchmark BND performance was -1.3% and 3.7% respectively. Over the previous week the market value of the iM-Bond Market Trader (High-Yield Bond or 10-yr Treasury Bond) gained 0.64% at a time when BND gained 0.42%. A starting capital of $10,000 at inception on 1/3/2000 would have grown to $138,319 which includes $2,209 cash and excludes $2,553 spent on fees and slippage. |
|
|
iM-ModSum/YieldCurve Timer: The model’s out of sample performance YTD is 7.8%, and for the last 12 months is 14.9%. Over the same period the benchmark SPY performance was 7.8% and 28.7% respectively. Over the previous week the market value of iM-PortSum/YieldCurve Timer gained 1.25% at a time when SPY gained 1.25%. A starting capital of $100,000 at inception on 1/1/2016 would have grown to $289,170 which includes $233 cash and excludes $1,452 spent on fees and slippage. |
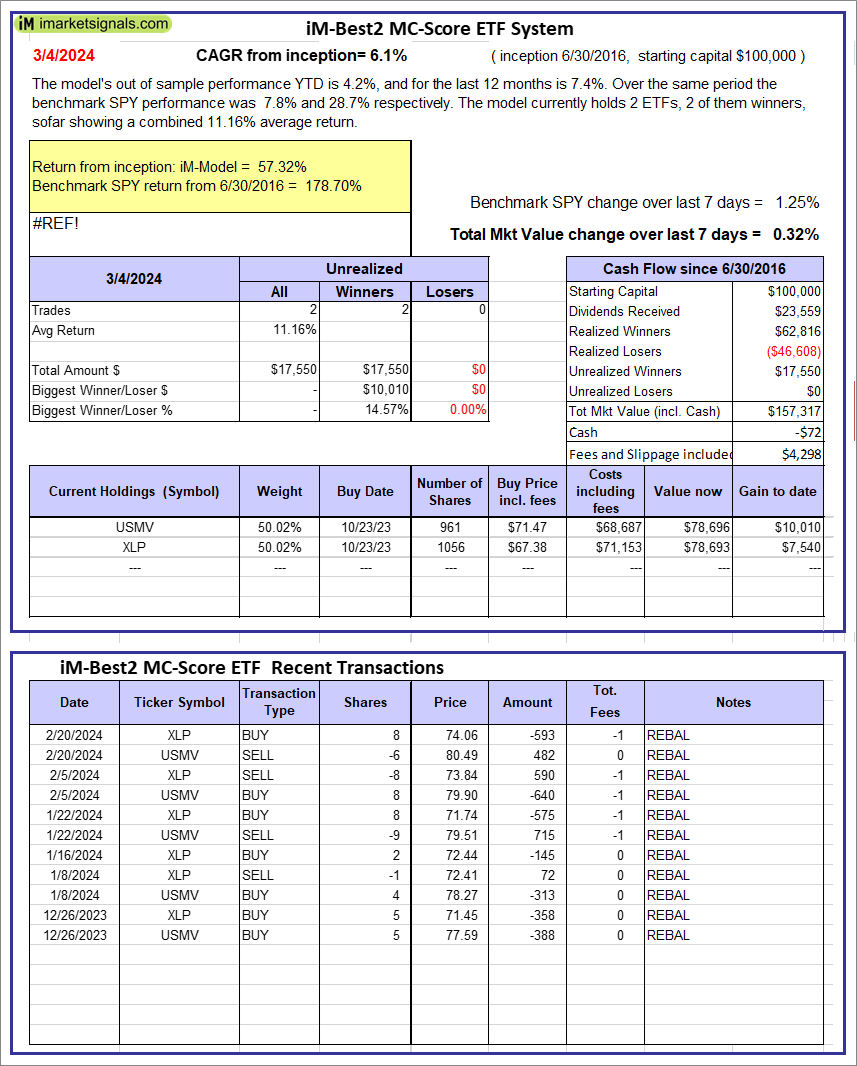 |
iM-Best2 MC-Score ETF System: The model’s out of sample performance YTD is 4.2%, and for the last 12 months is 7.4%. Over the same period the benchmark SPY performance was 7.8% and 28.7% respectively. Over the previous week the market value of the iM-Best2 MC-Score ETF System gained 0.32% at a time when SPY gained 1.25%. A starting capital of $100,000 at inception on 6/30/2016 would have grown to $157,317 which includes -$72 cash and excludes $4,298 spent on fees and slippage. |
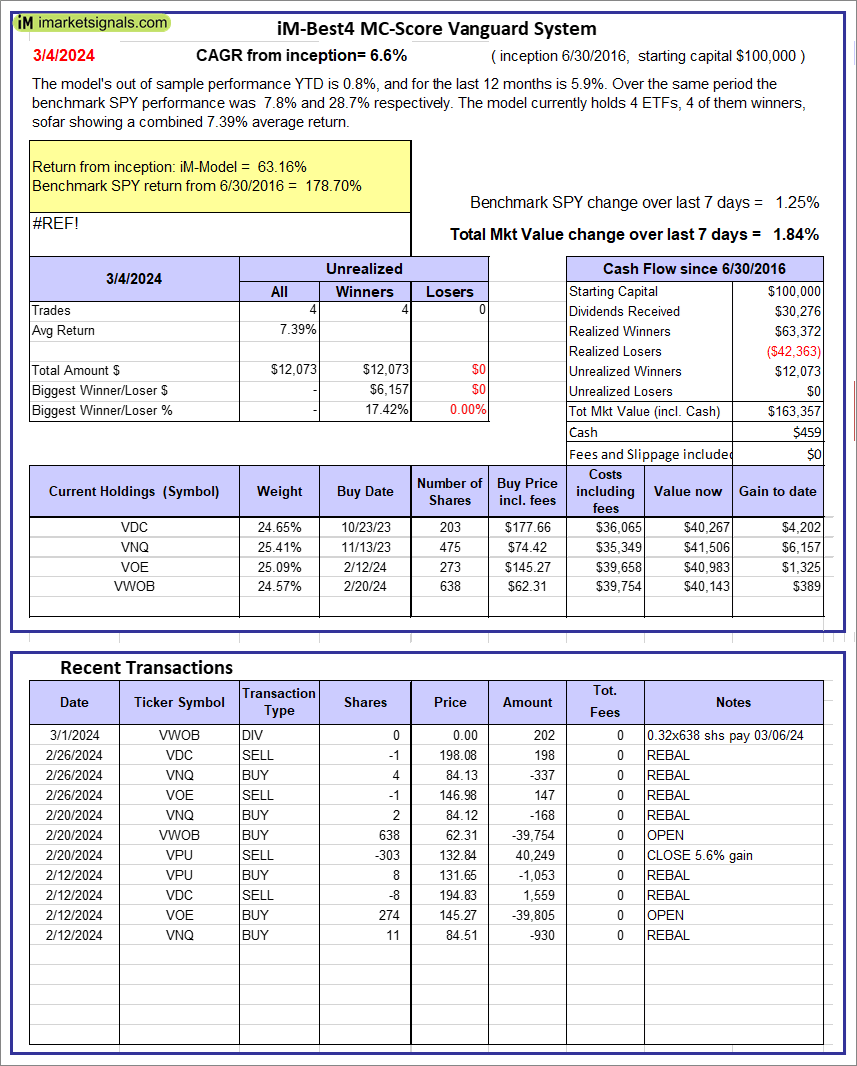 |
iM-Best4 MC-Score Vanguard System: The model’s out of sample performance YTD is 0.8%, and for the last 12 months is 5.9%. Over the same period the benchmark SPY performance was 7.8% and 28.7% respectively. Over the previous week the market value of the iM-Best4 MC-Score Vanguard System gained 1.84% at a time when SPY gained 1.25%. A starting capital of $100,000 at inception on 6/30/2016 would have grown to $163,357 which includes $459 cash and excludes $00 spent on fees and slippage. |
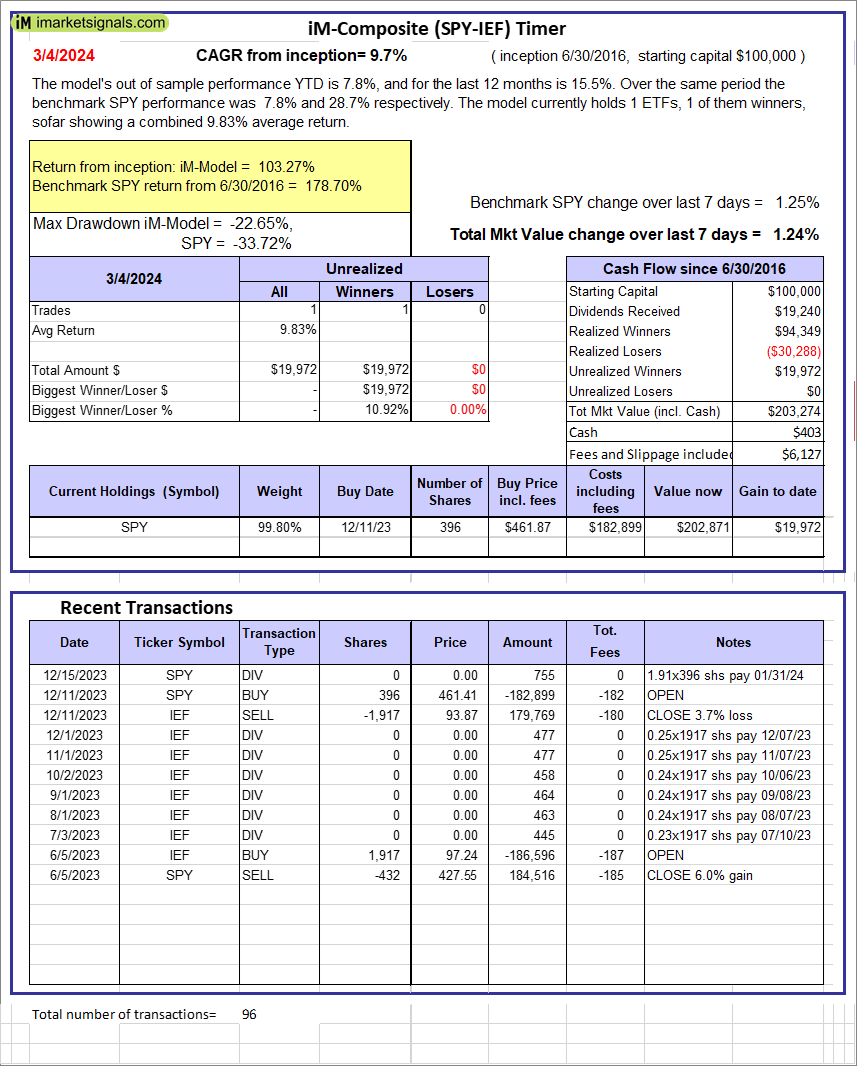 |
iM-Composite (SPY-IEF) Timer: The model’s out of sample performance YTD is 7.8%, and for the last 12 months is 15.5%. Over the same period the benchmark SPY performance was 7.8% and 28.7% respectively. Over the previous week the market value of the iM-Composite (SPY-IEF) Timer gained 1.24% at a time when SPY gained 1.25%. A starting capital of $100,000 at inception on 6/30/2016 would have grown to $203,274 which includes $403 cash and excludes $6,127 spent on fees and slippage. |
 |
iM-Composite(Gold-Stocks-Bond) Timer: The model’s out of sample performance YTD is 2.6%, and for the last 12 months is 13.7%. Over the same period the benchmark SPY performance was 7.8% and 28.7% respectively. Over the previous week the market value of the iM-Composite(Gold-Stocks-Bond) Timer gained 4.17% at a time when SPY gained 1.25%. A starting capital of $100,000 at inception on 6/30/2016 would have grown to $199,494 which includes $36 cash and excludes $9,190 spent on fees and slippage. |
iM-Best Reports – 3/4/2024
Posted in pmp SPY-SH
Leave a Reply
You must be logged in to post a comment.