
  |
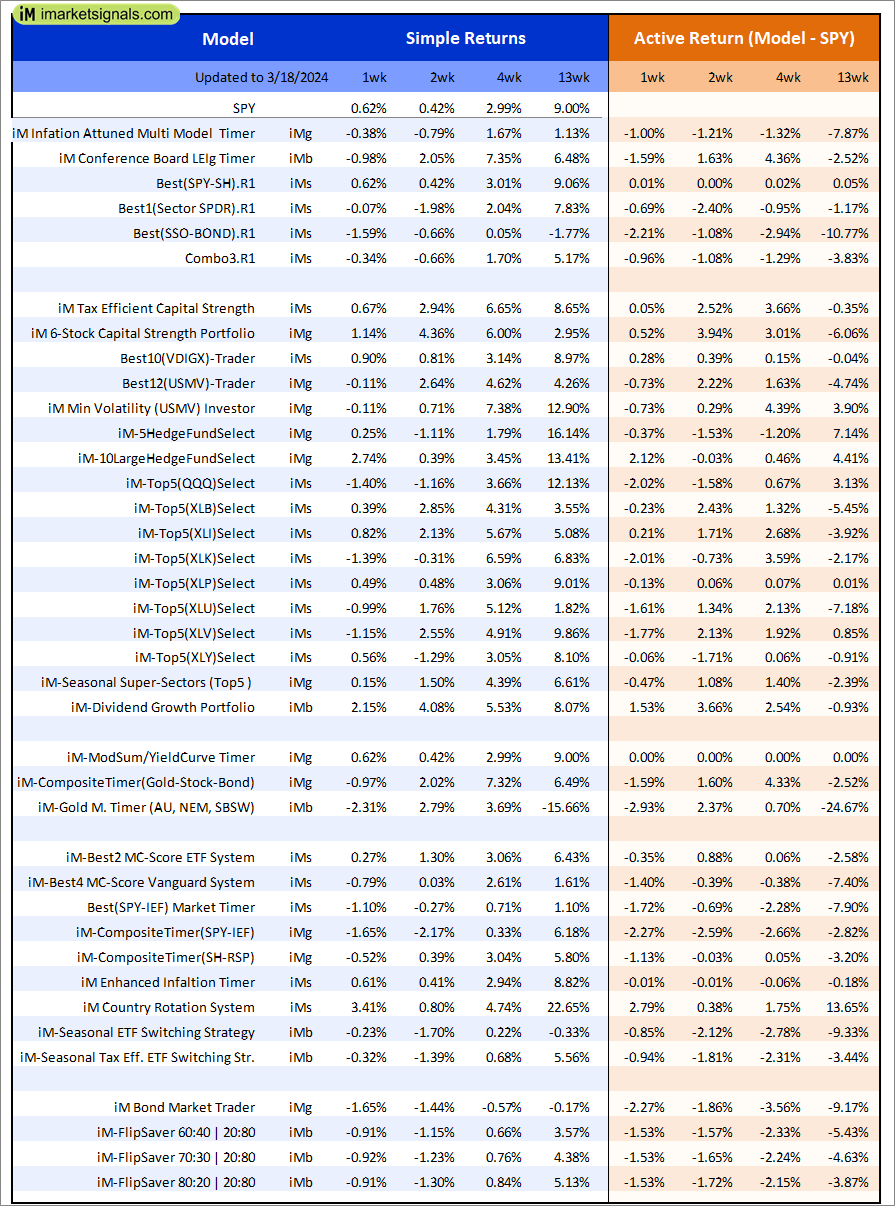
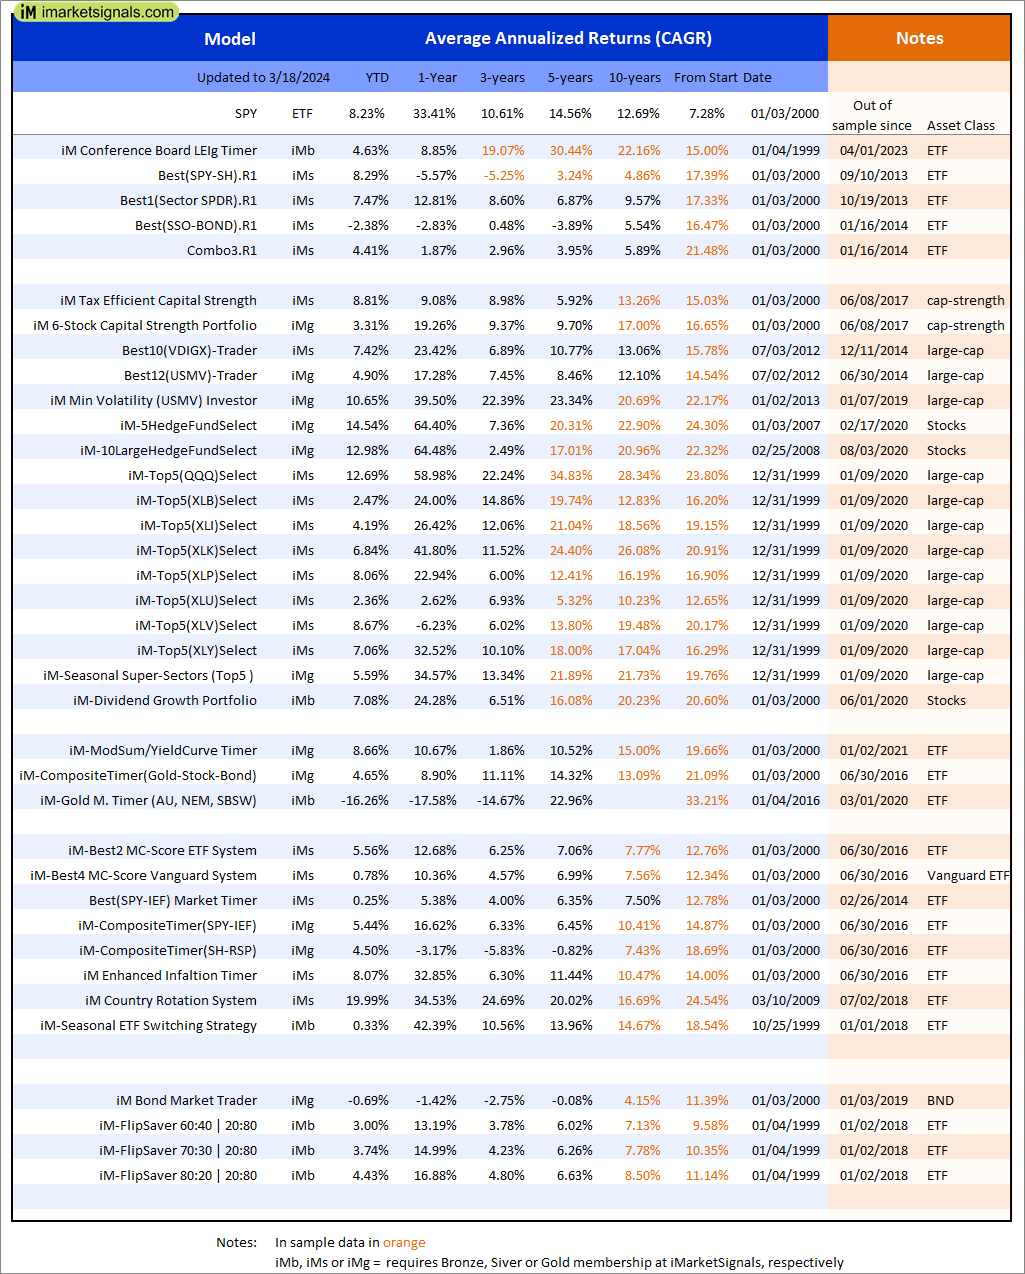
Out of sample performance summary of our models for the past 1, 2, 4 and 13 week periods. The active active return indicates how the models over- or underperformed the benchmark ETF SPY. Also the YTD, and the 1-, 3-, 5- and 10-year annualized returns are shown in the second table |
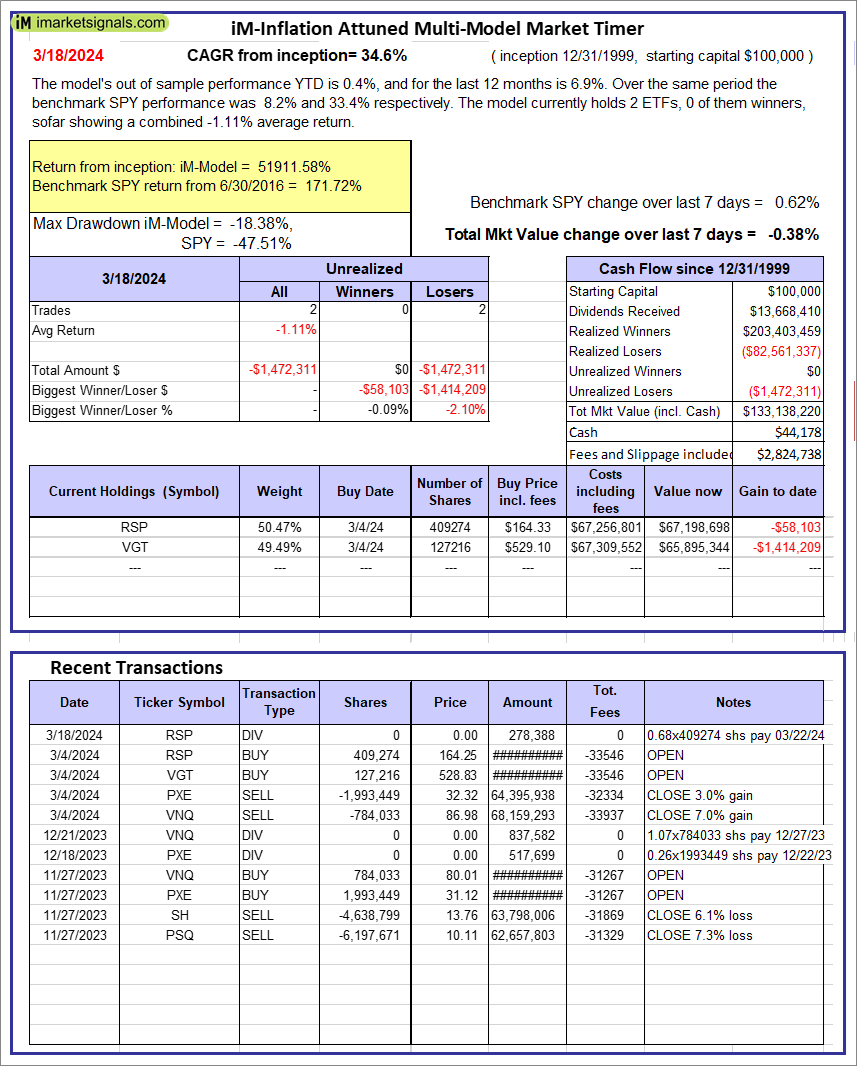 |
iM-Inflation Attuned Multi-Model Market Timer: The model’s out of sample performance YTD is 0.4%, and for the last 12 months is 6.9%. Over the same period the benchmark SPY performance was 8.2% and 33.4% respectively. Over the previous week the market value of the iM-Inflation Attuned Multi-Model Market Timer gained -0.38% at a time when SPY gained 0.62%. A starting capital of $100,000 at inception on 3/24/2017 would have grown to $133,138,220 which includes $44,178 cash and excludes $2,824,738 spent on fees and slippage. |
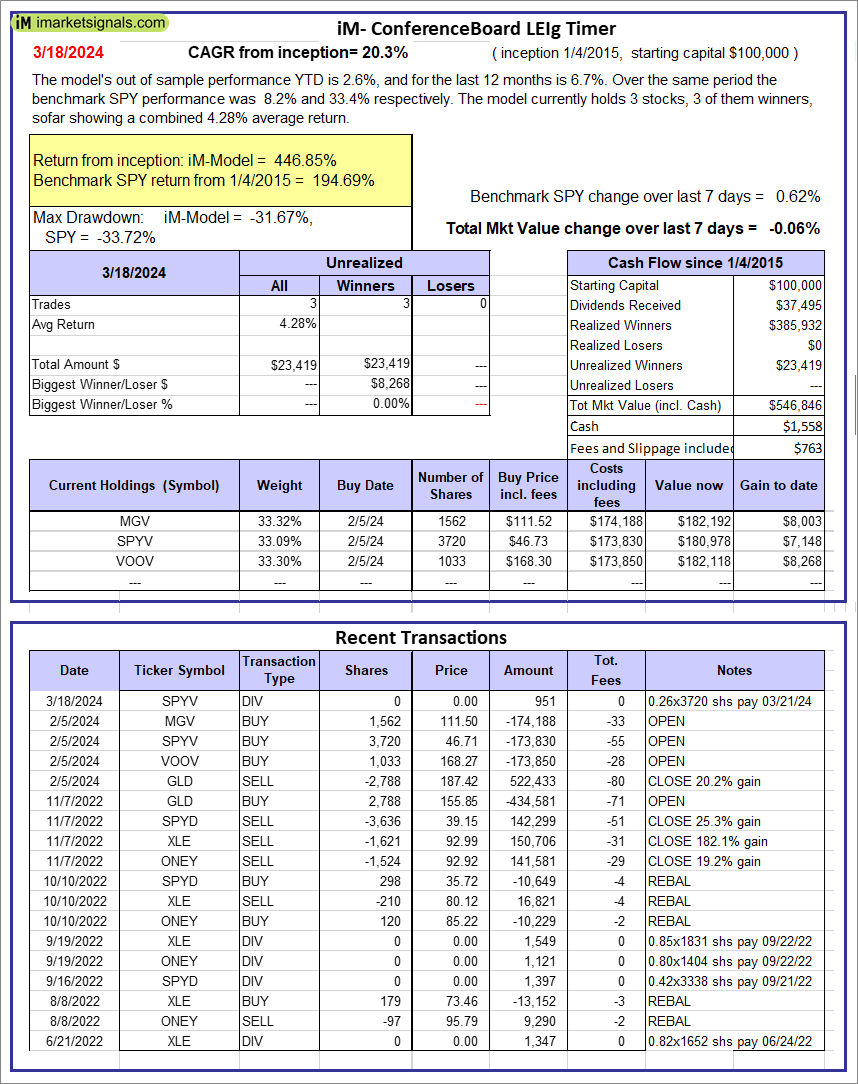 |
iM-Conference Board LEIg Timer: The model’s performance YTD is 14.3%, and for the last 12 months is 7.3%. Over the same period the benchmark SPY performance was 20.1% and 9.4% respectively. Over the previous week the market value of the iM-Conference Board LEIg Timer gained -0.06% at a time when SPY gained 0.62%. A starting capital of $100,000 at inception on 4/5/2017 would have grown to $546,846 which includes $1,558 cash and excludes $763 spent on fees and slippage. |
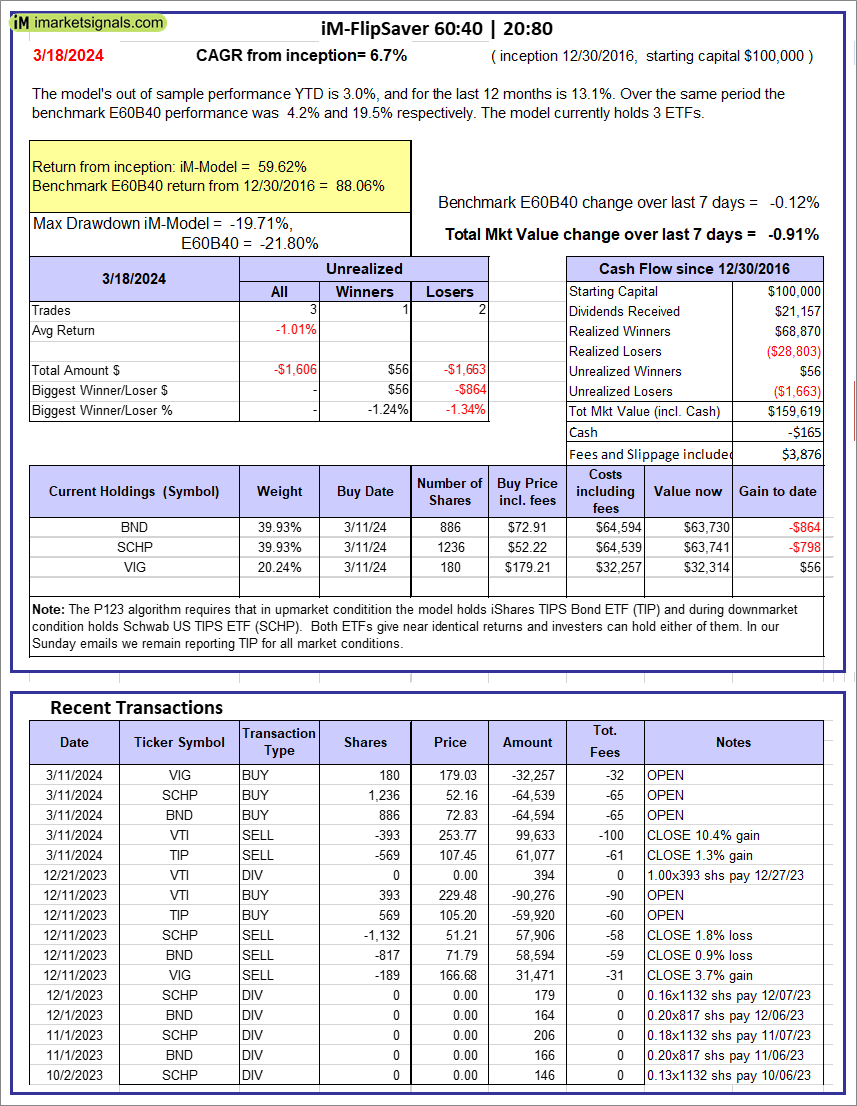 |
iM-FlipSaver 60:40 | 20:80 – 2017: The model’s out of sample performance YTD is 3.0%, and for the last 12 months is 13.1%. Over the same period the benchmark E60B40 performance was 4.2% and 19.5% respectively. Over the previous week the market value of iM-FlipSaver 80:20 | 20:80 gained -0.91% at a time when SPY gained -0.12%. A starting capital of $100,000 at inception on 7/16/2015 would have grown to $159,619 which includes -$165 cash and excludes $3,876 spent on fees and slippage. |
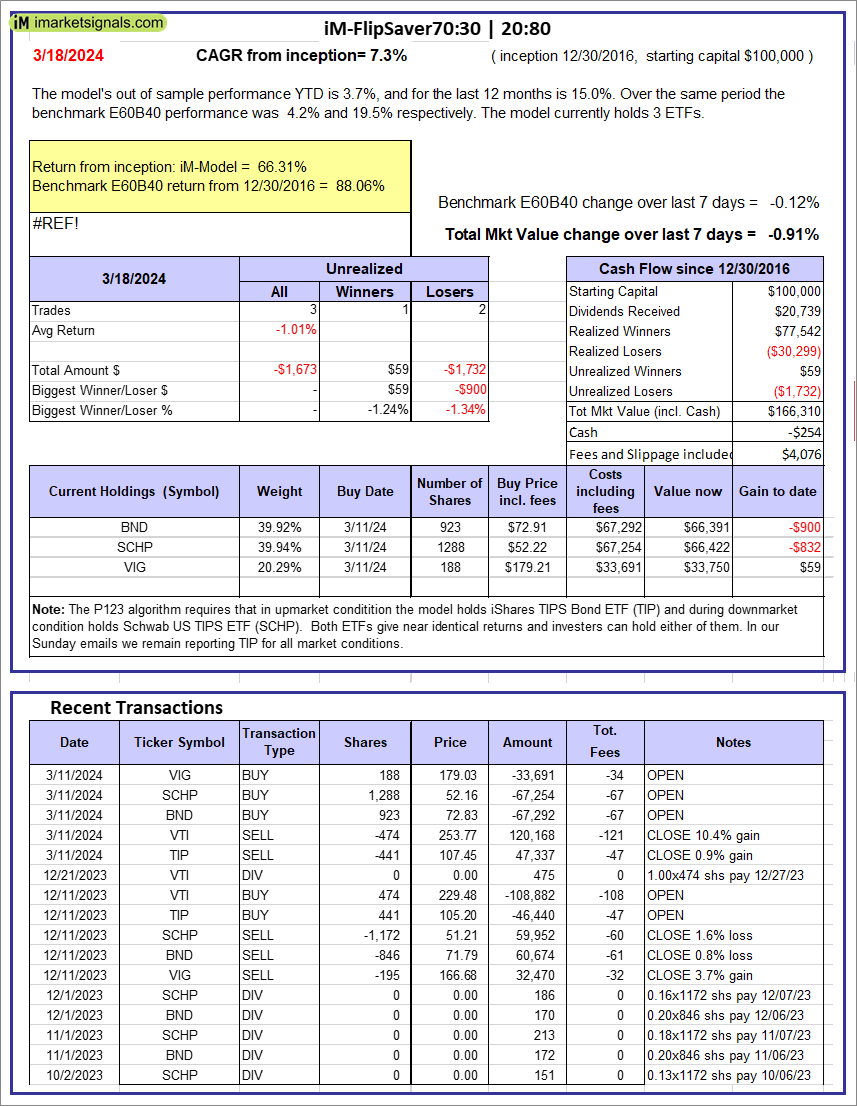 |
iM-FlipSaver 70:30 | 20:80 – 2017: The model’s out of sample performance YTD is 3.7%, and for the last 12 months is 15.0%. Over the same period the benchmark E60B40 performance was 4.2% and 19.5% respectively. Over the previous week the market value of iM-FlipSaver 70:30 | 20:80 gained -0.91% at a time when SPY gained -0.12%. A starting capital of $100,000 at inception on 7/15/2015 would have grown to $166,310 which includes -$254 cash and excludes $4,076 spent on fees and slippage. |
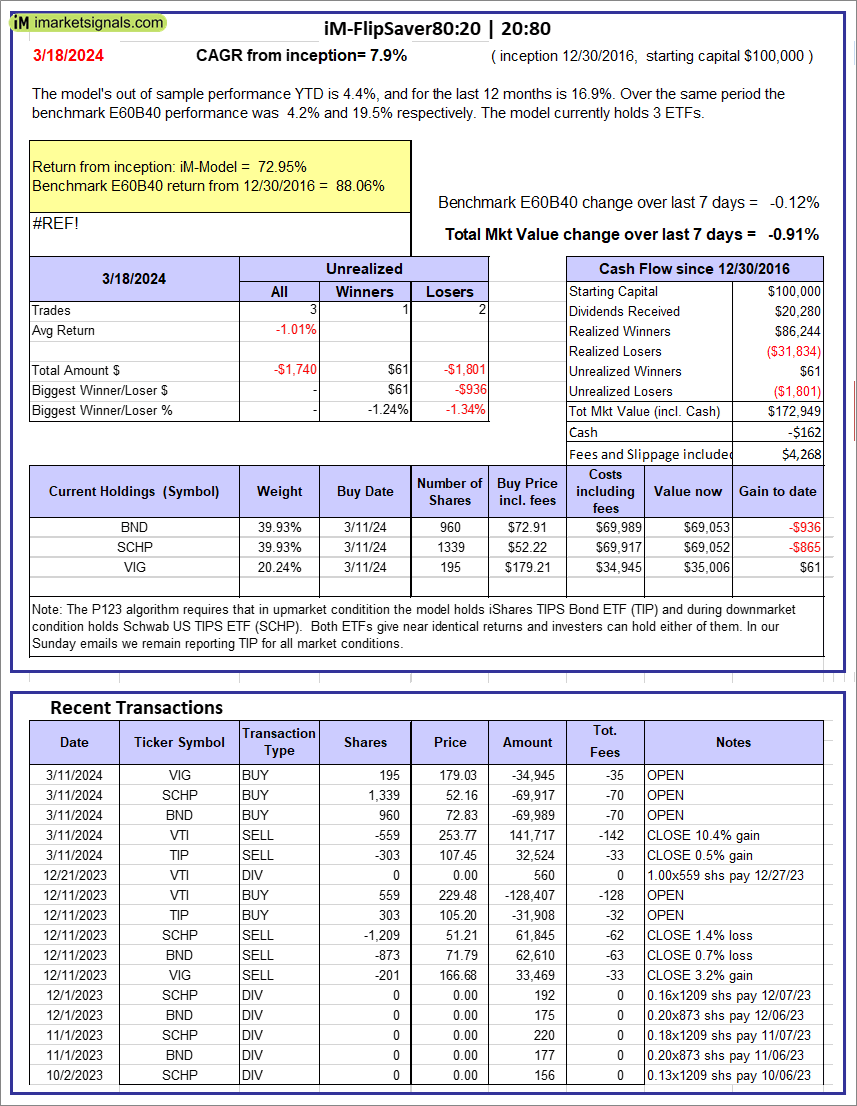 |
iM-FlipSaver 80:20 | 20:80 – 2017: The model’s out of sample performance YTD is 4.4%, and for the last 12 months is 16.9%. Over the same period the benchmark E60B40 performance was 4.2% and 19.5% respectively. Over the previous week the market value of iM-FlipSaver 80:20 | 20:80 gained -0.91% at a time when SPY gained -0.12%. A starting capital of $100,000 at inception on 1/2/2017 would have grown to $172,949 which includes -$162 cash and excludes $4,268 spent on fees and slippage. |
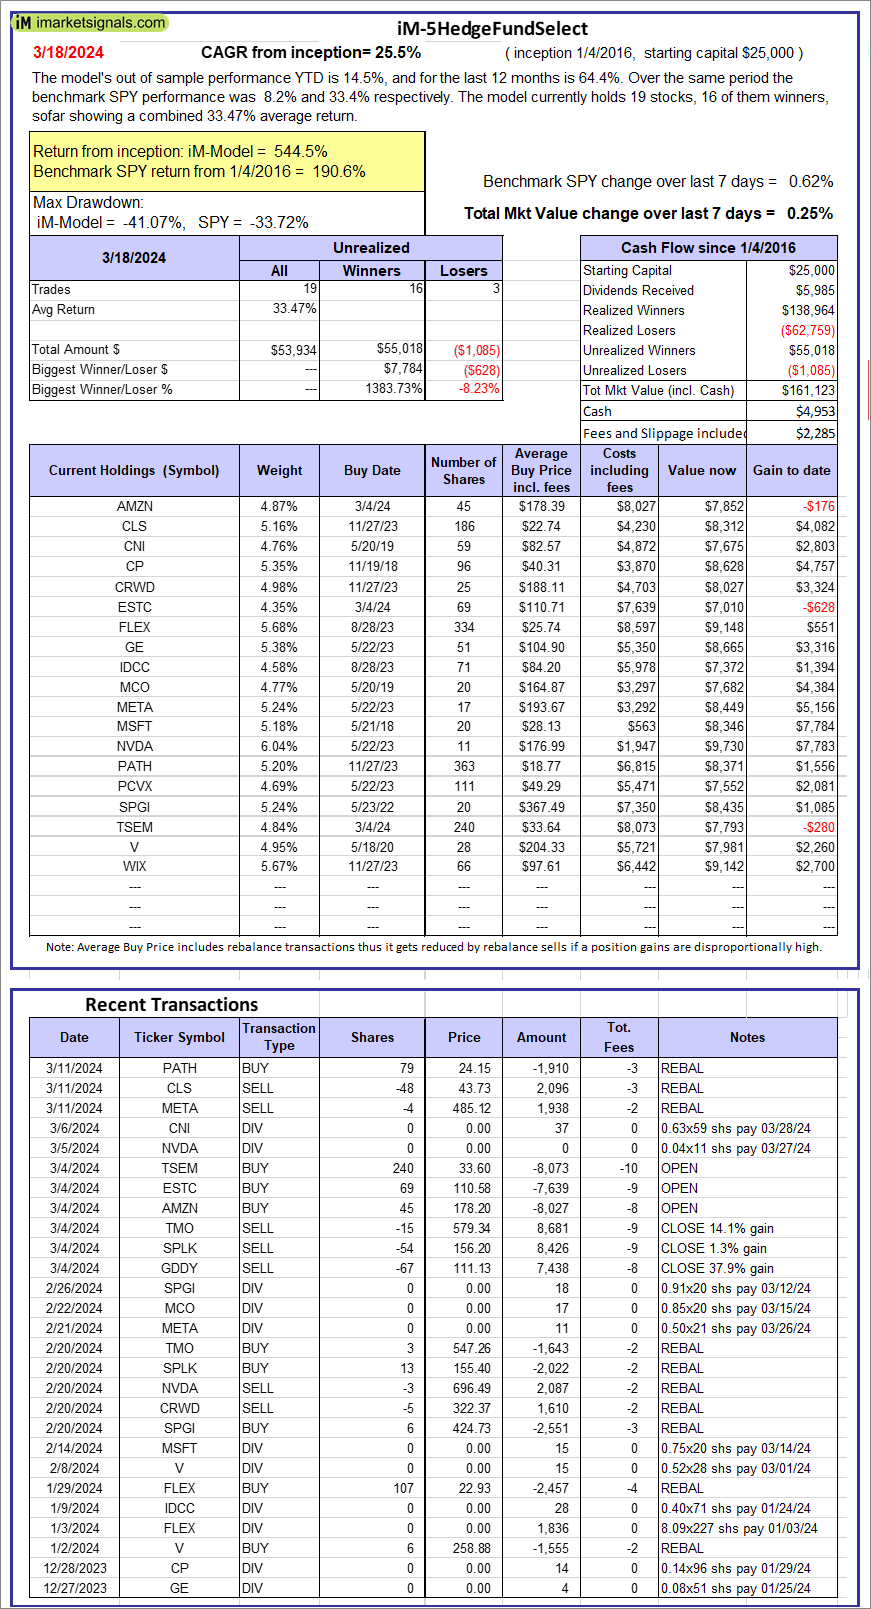 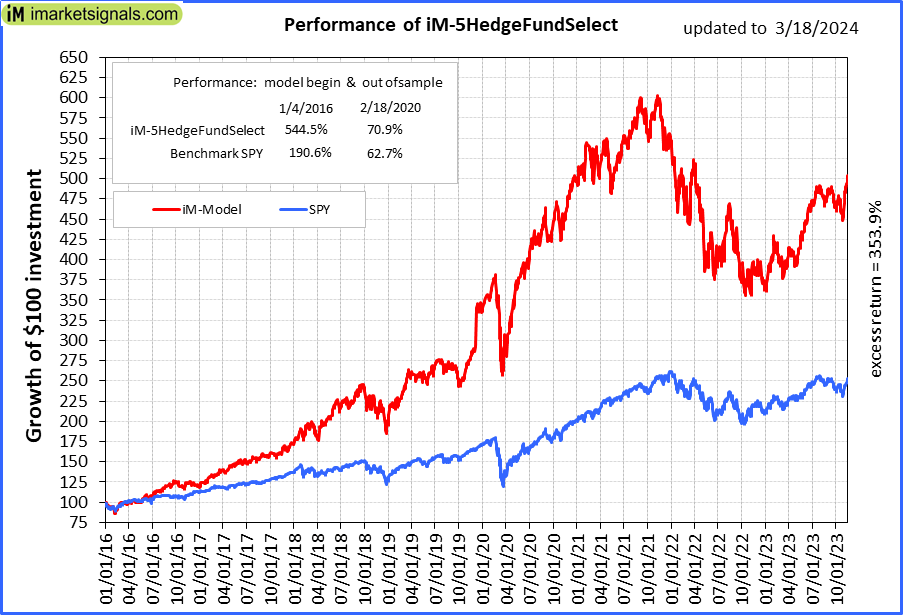 |
iM-5HedgeFundSelect: Since inception, on 1/5/2016, the model gained 544.49% while the benchmark SPY gained 190.56% over the same period. Over the previous week the market value of iM-5HedgeFundSelect gained 0.25% at a time when SPY gained 0.62%. A starting capital of $25,000 at inception on 1/5/2016 would have grown to $161,123 which includes $4,953 cash and excludes $2,285 spent on fees and slippage. |
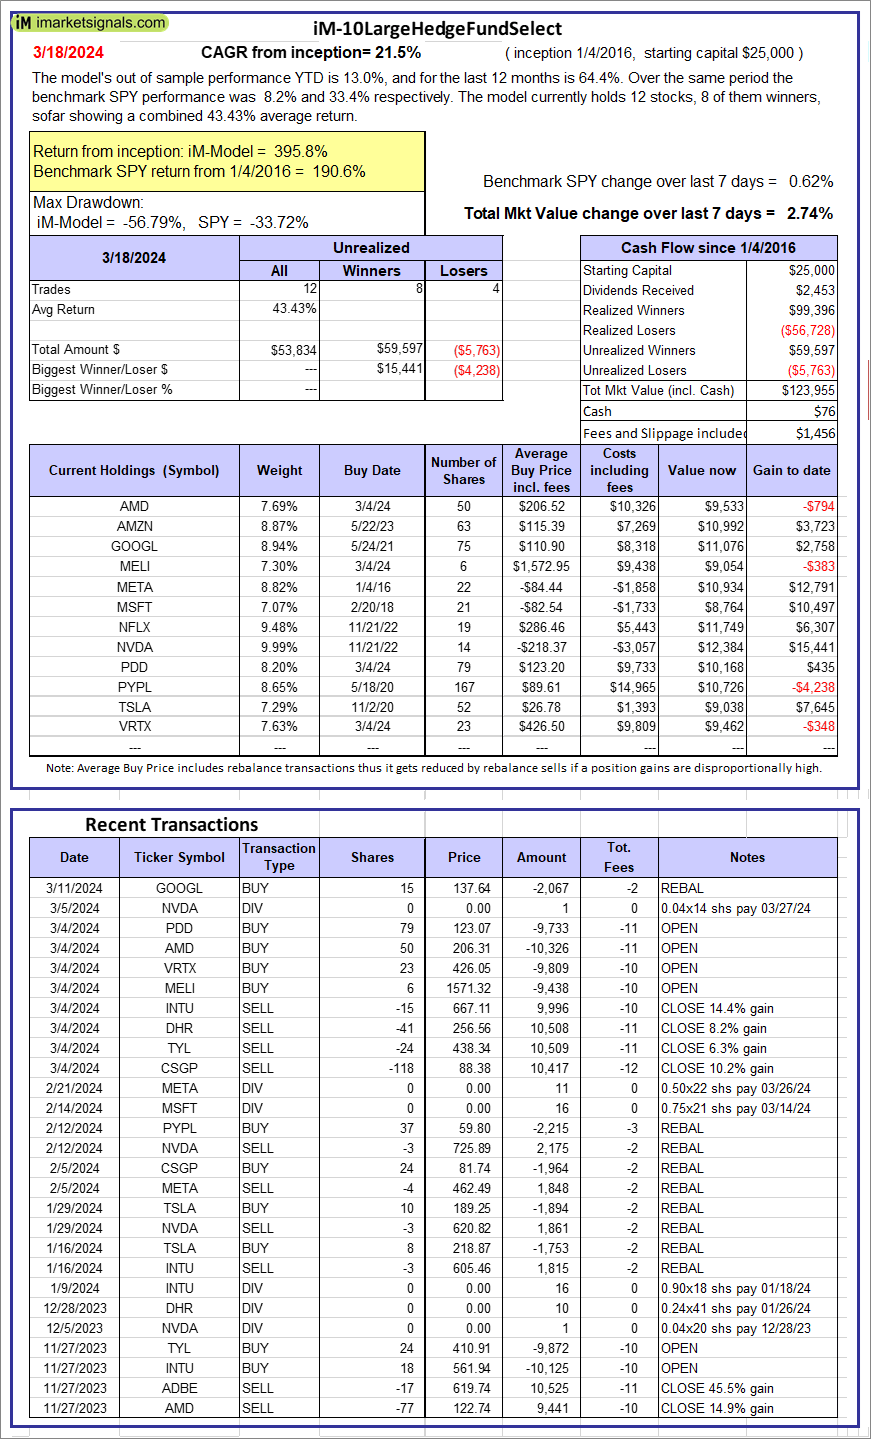 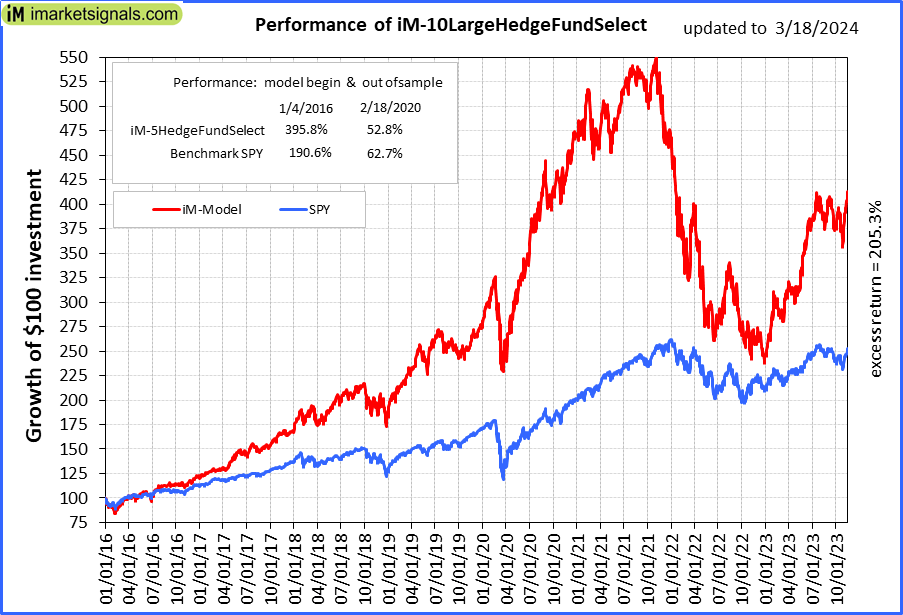 |
iM-10LargeHedgeFundSelect: Since inception, on 1/5/2016, the model gained 395.82% while the benchmark SPY gained 190.56% over the same period. Over the previous week the market value of iM-10LargeHedgeFundSelect gained 2.74% at a time when SPY gained 0.62%. A starting capital of $25,000 at inception on 1/5/2016 would have grown to $123,955 which includes $76 cash and excludes $1,456 spent on fees and slippage. |
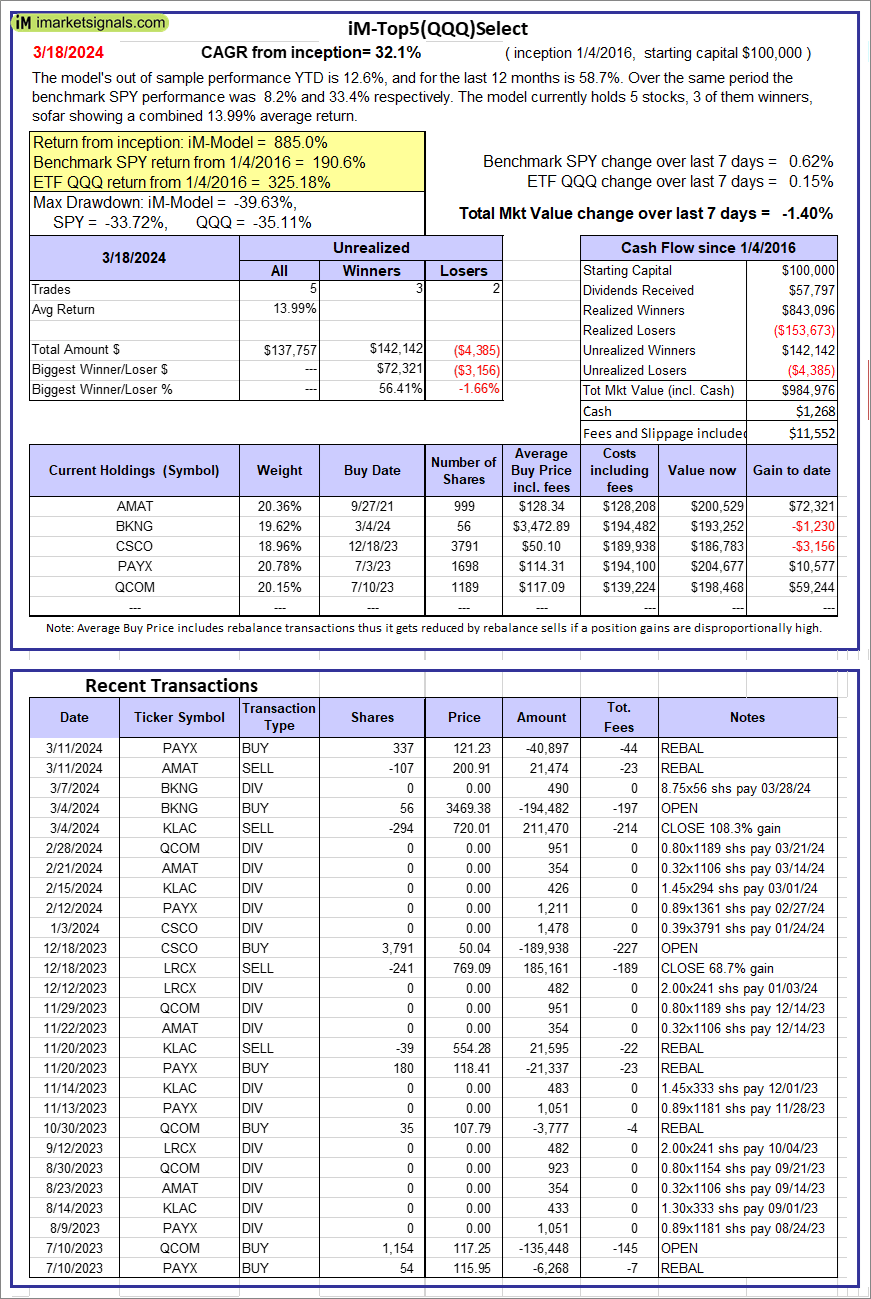 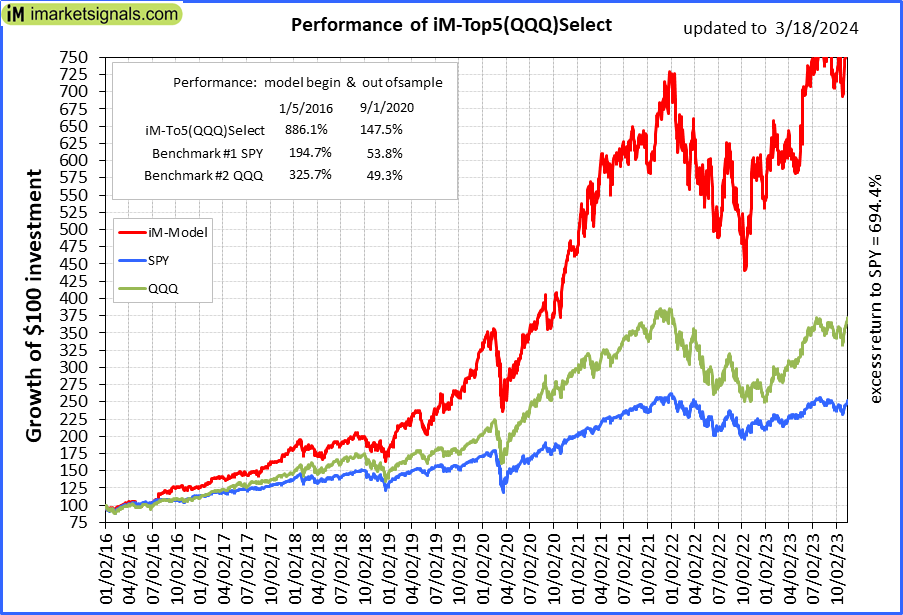 |
iM-Top5(QQQ)Select: Since inception, on 1/5/2016, the model gained 884.98% while the benchmark SPY gained 190.56% over the same period. Over the previous week the market value of iM-Top5(QQQ)Select gained -1.40% at a time when SPY gained 0.62%. A starting capital of $100,000 at inception on 1/5/2016 would have grown to $984,976 which includes $1,268 cash and excludes $11,552 spent on fees and slippage. |
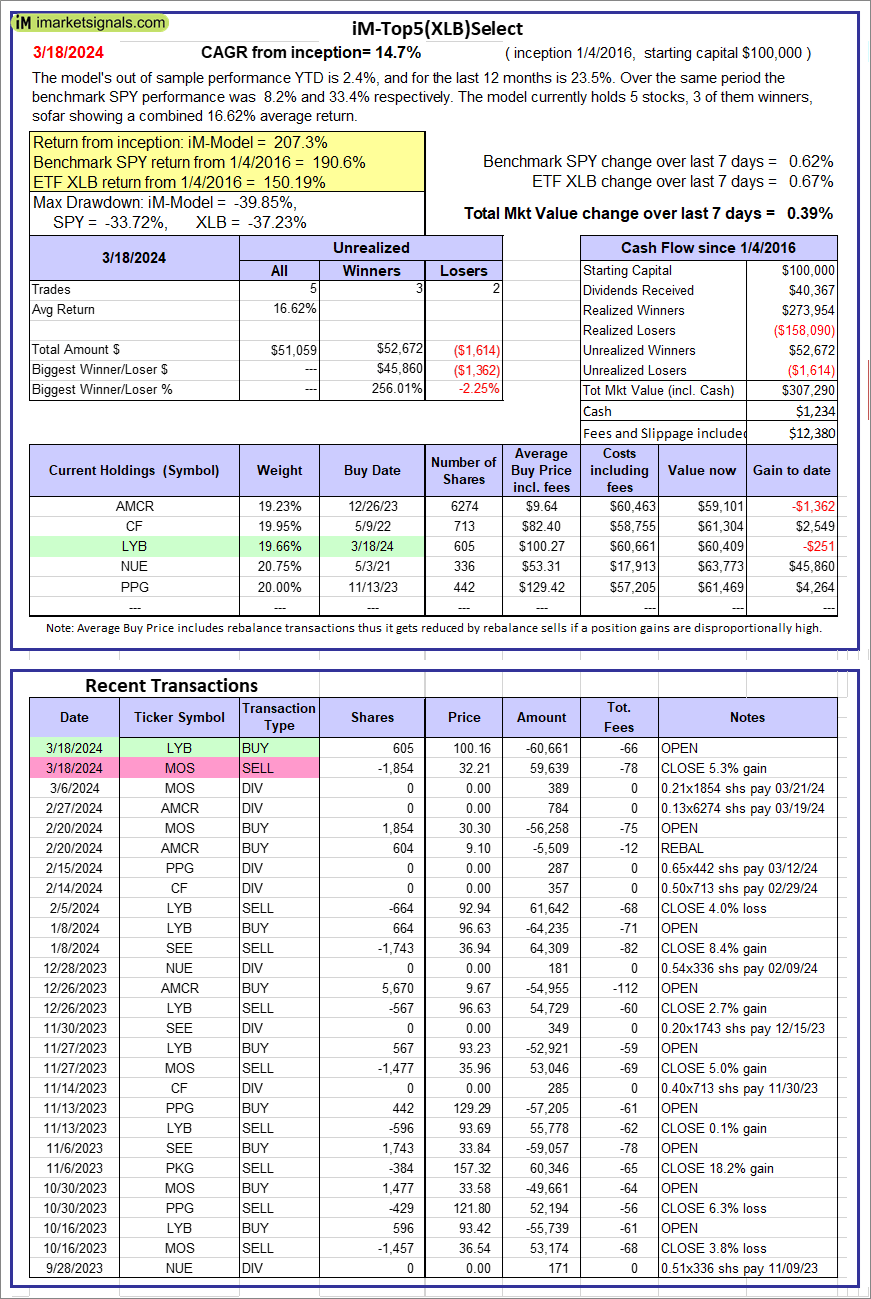 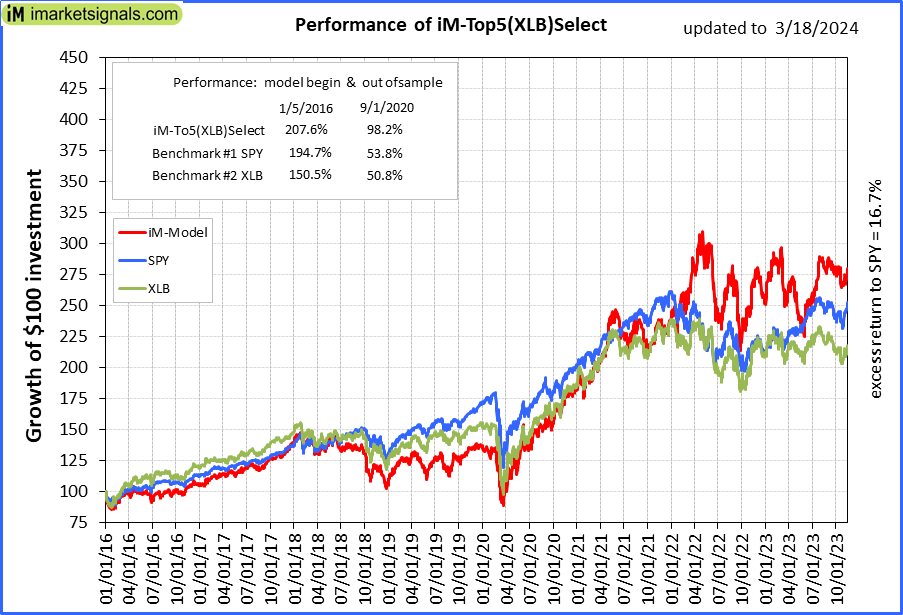 |
iM-Top5(XLB)Select: Since inception, on 1/5/2016, the model gained 207.29% while the benchmark SPY gained 190.56% over the same period. Over the previous week the market value of iM-Top5(XLB)Select gained 0.39% at a time when SPY gained 0.62%. A starting capital of $100,000 at inception on 1/5/2016 would have grown to $307,290 which includes $1,234 cash and excludes $12,380 spent on fees and slippage. |
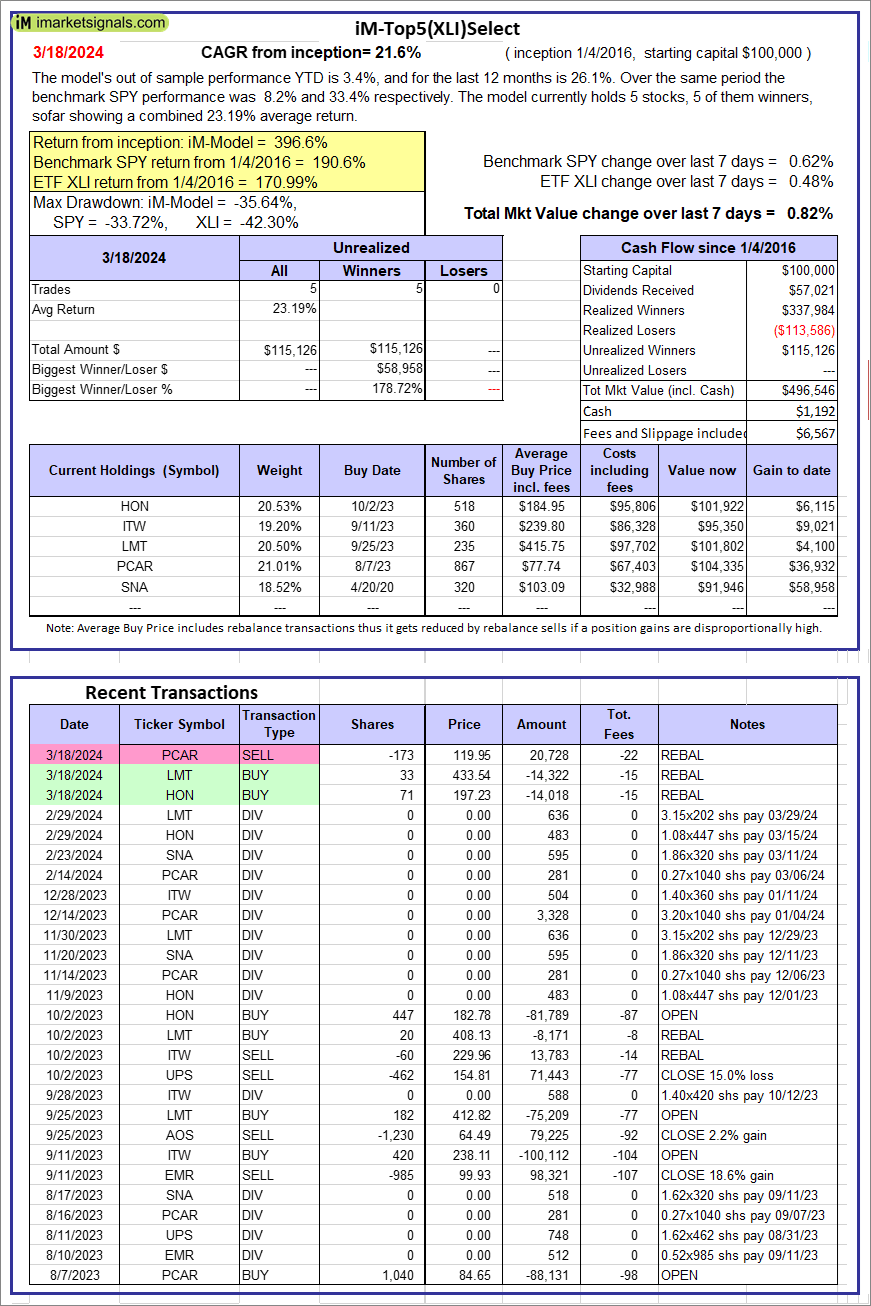 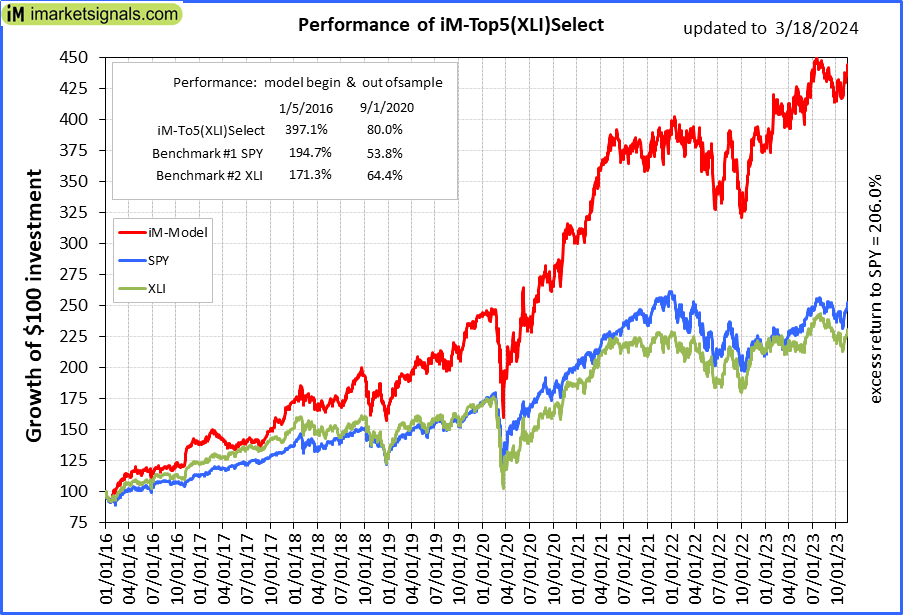 |
iM-Top5(XLI)Select: Since inception, on 1/5/2016, the model gained 396.55% while the benchmark SPY gained 190.56% over the same period. Over the previous week the market value of iM-Top5(XLI)Select gained 0.82% at a time when SPY gained 0.62%. A starting capital of $100,000 at inception on 1/5/2016 would have grown to $496,546 which includes $1,192 cash and excludes $6,567 spent on fees and slippage. |
 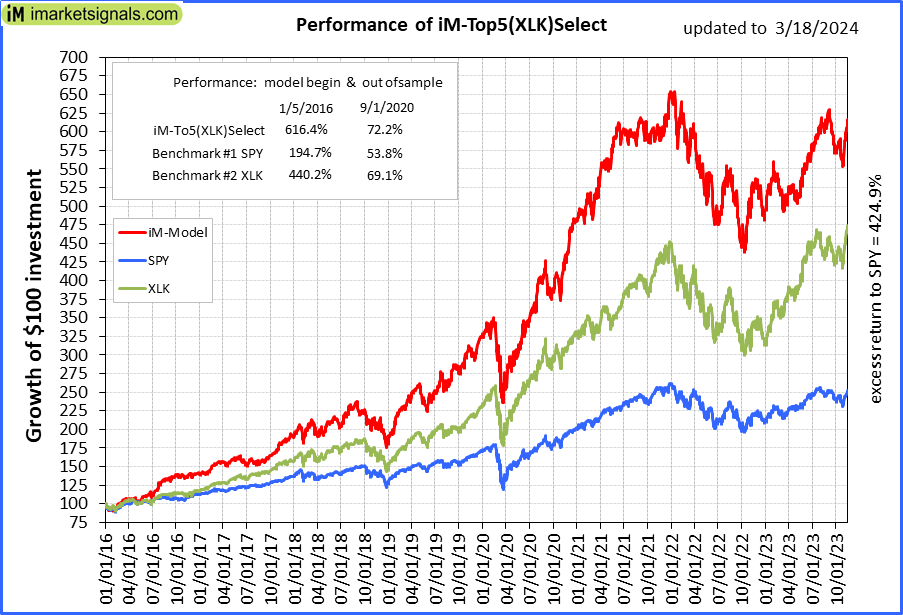 |
iM-Top5(XLK)Select: Since inception, on 1/5/2016, the model gained 615.50% while the benchmark SPY gained 190.56% over the same period. Over the previous week the market value of iM-Top5(XLK)Select gained -1.39% at a time when SPY gained 0.62%. A starting capital of $100,000 at inception on 1/5/2016 would have grown to $715,500 which includes $1,156 cash and excludes $2,149 spent on fees and slippage. |
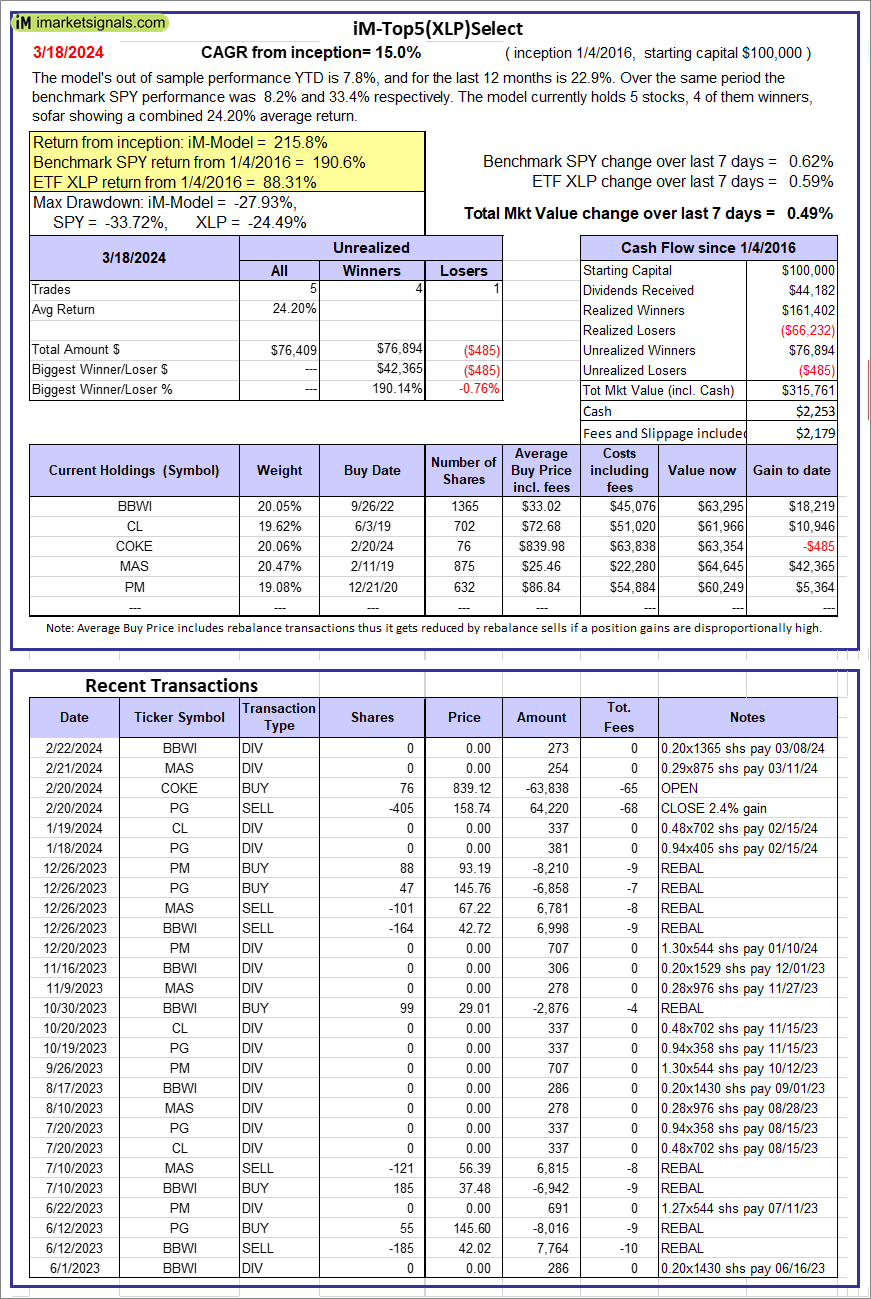  |
iM-Top5(XLP)Select: Since inception, on 1/5/2016, the model gained 215.76% while the benchmark SPY gained 190.56% over the same period. Over the previous week the market value of iM-Top5(XLP)Select gained 0.49% at a time when SPY gained 0.62%. A starting capital of $100,000 at inception on 1/5/2016 would have grown to $315,761 which includes $2,253 cash and excludes $2,179 spent on fees and slippage. |
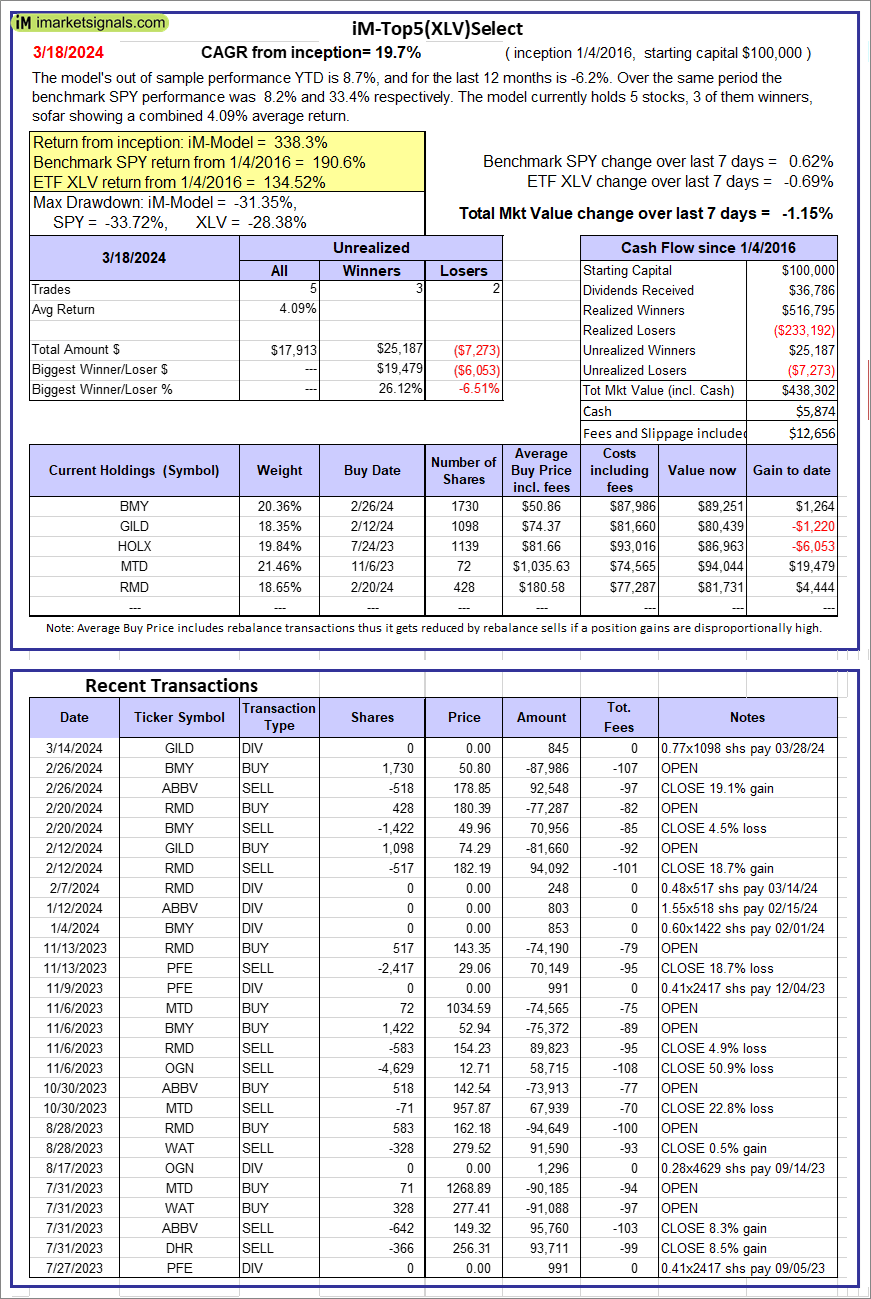 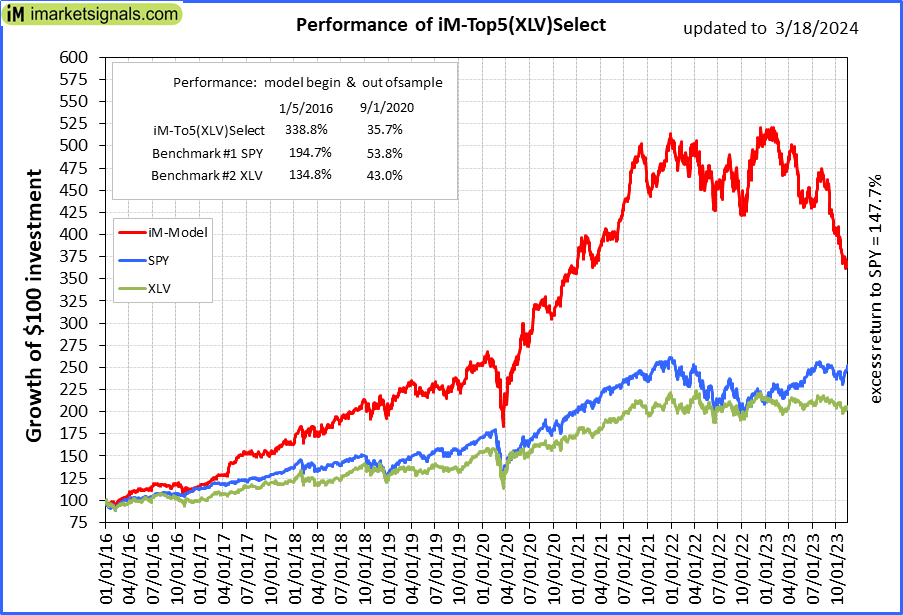 |
iM-Top5(XLV)Select: Since inception, on 1/5/2016, the model gained 338.30% while the benchmark SPY gained 190.56% over the same period. Over the previous week the market value of iM-Top5(XLV)Select gained -1.15% at a time when SPY gained 0.62%. A starting capital of $100,000 at inception on 1/5/2016 would have grown to $438,302 which includes $5,874 cash and excludes $12,656 spent on fees and slippage. |
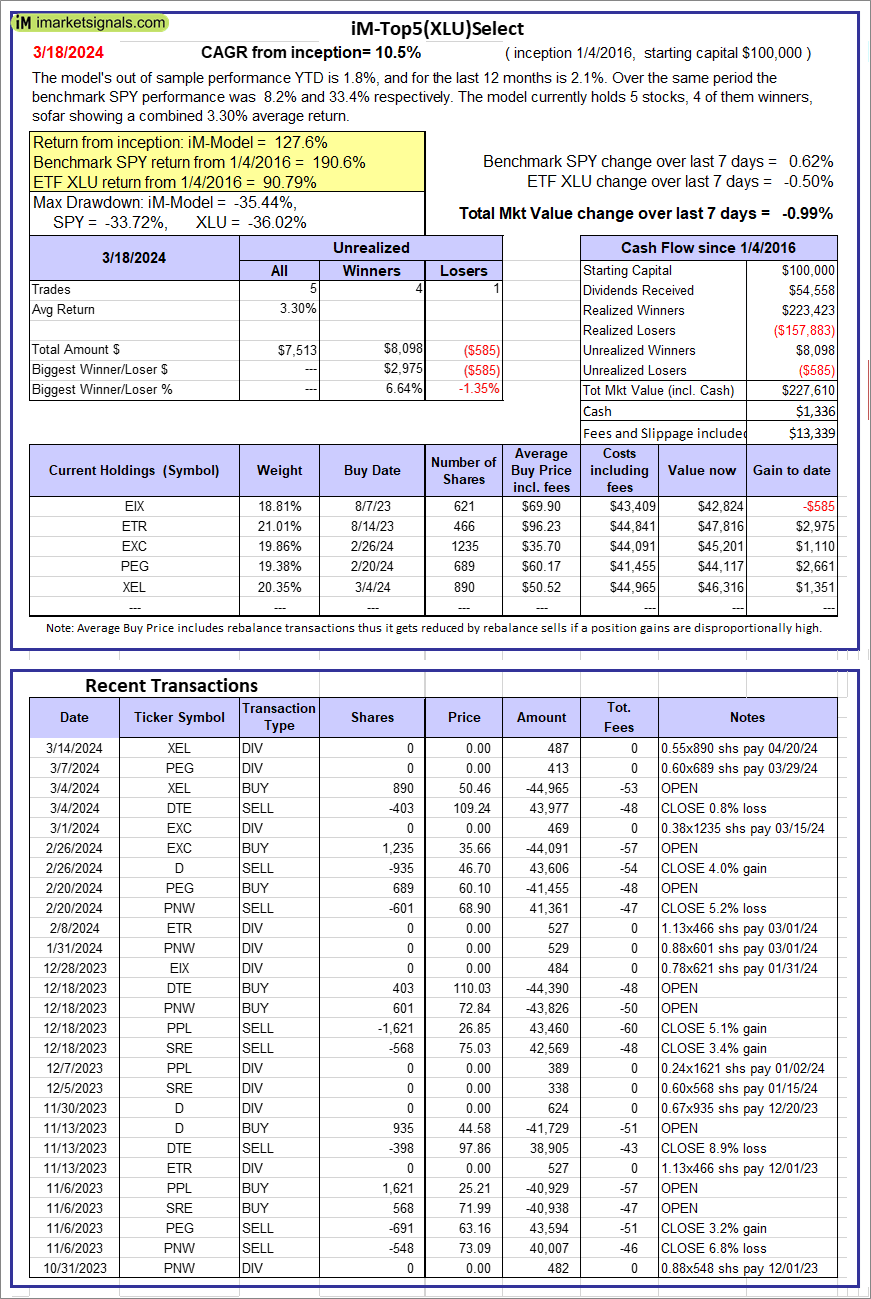 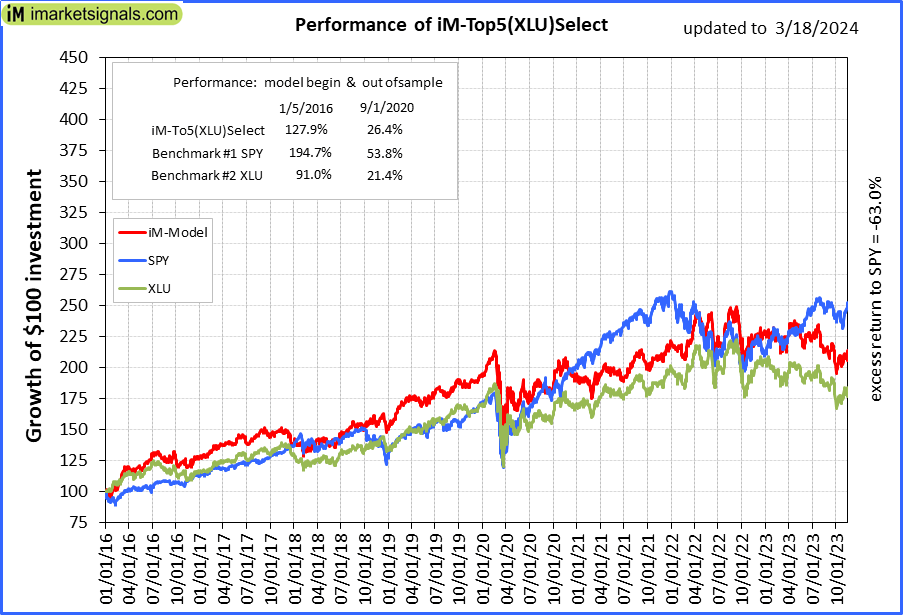 |
iM-Top5(XLU)Select: Since inception, on 1/5/2016, the model gained 127.61% while the benchmark SPY gained 190.56% over the same period. Over the previous week the market value of iM-Top5(XLU)Select gained -0.99% at a time when SPY gained 0.62%. A starting capital of $100,000 at inception on 1/5/2016 would have grown to $227,610 which includes $1,336 cash and excludes $13,339 spent on fees and slippage. |
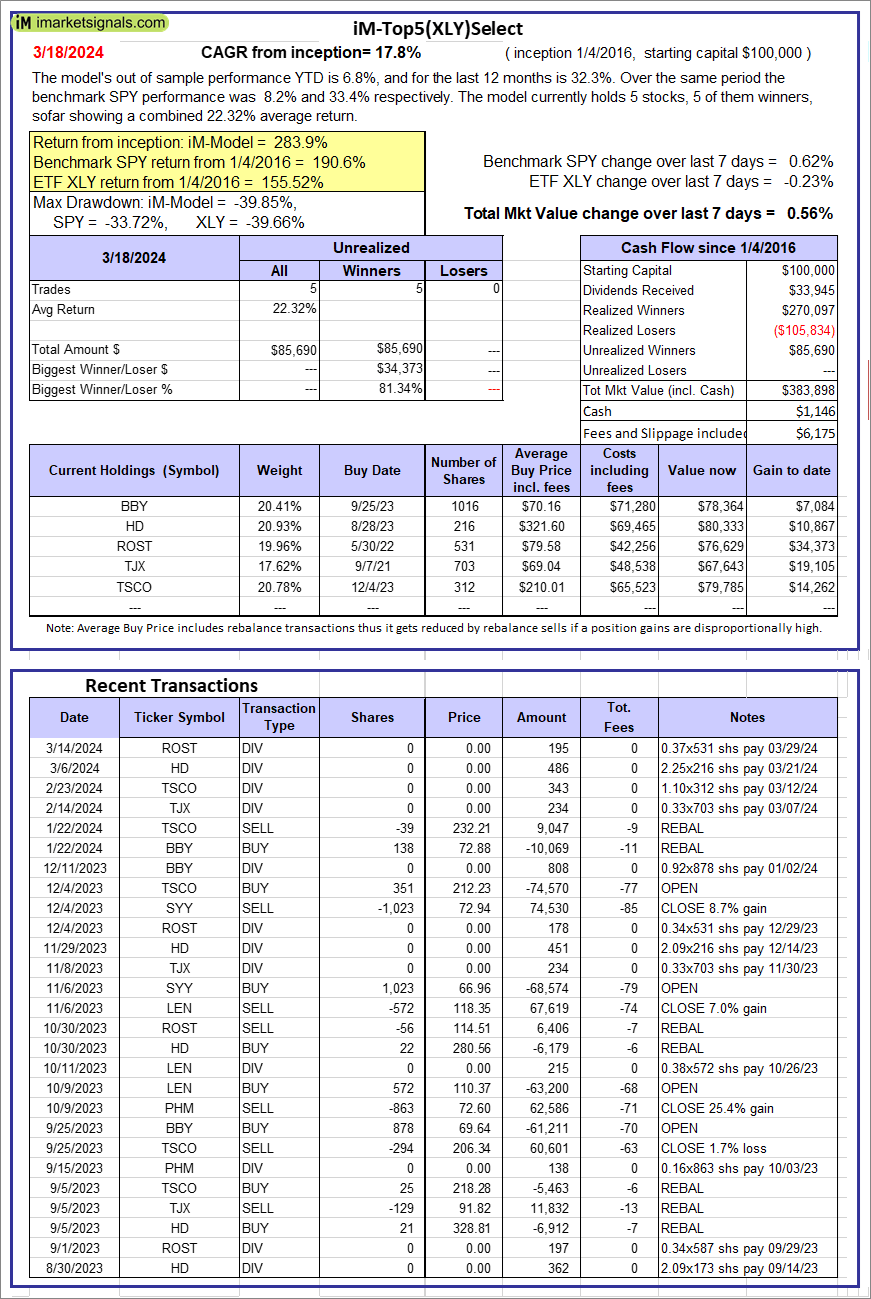 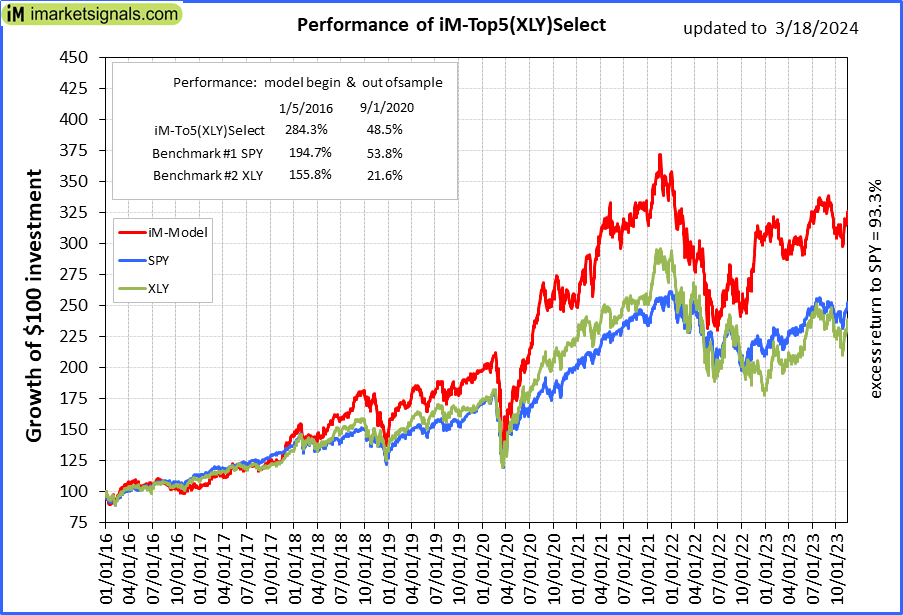 |
iM-Top5(XLY)Select: Since inception, on 1/5/2016, the model gained 283.90% while the benchmark SPY gained 190.56% over the same period. Over the previous week the market value of iM-Top5(XLY)Select gained 0.56% at a time when SPY gained 0.62%. A starting capital of $100,000 at inception on 1/5/2016 would have grown to $383,898 which includes $1,146 cash and excludes $6,175 spent on fees and slippage. |
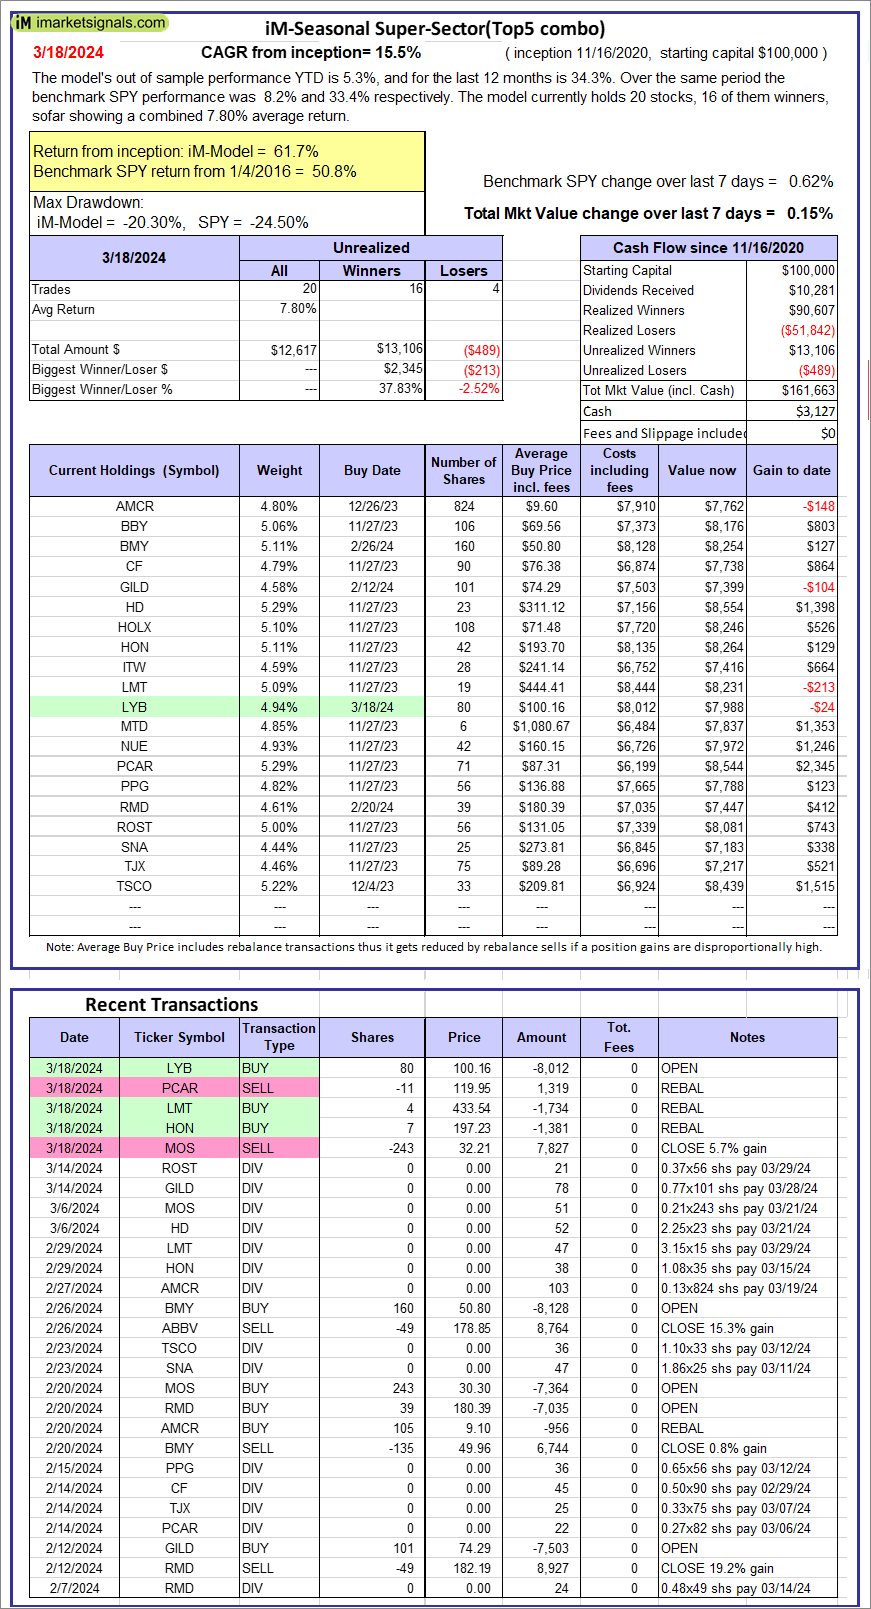 |
iM-Seasonal Super-Sectors (Top5 combo) : Since inception, on 11/17/2020, the model gained 61.66% while the benchmark SPY gained 50.83% over the same period. Over the previous week the market value of iM-Seasonal Super-Sectors (Top5 combo) gained 0.15% at a time when SPY gained 0.62%. A starting capital of $100,000 at inception on 11/17/2020 would have grown to $161,663 which includes $3,127 cash and excludes $00 spent on fees and slippage. |
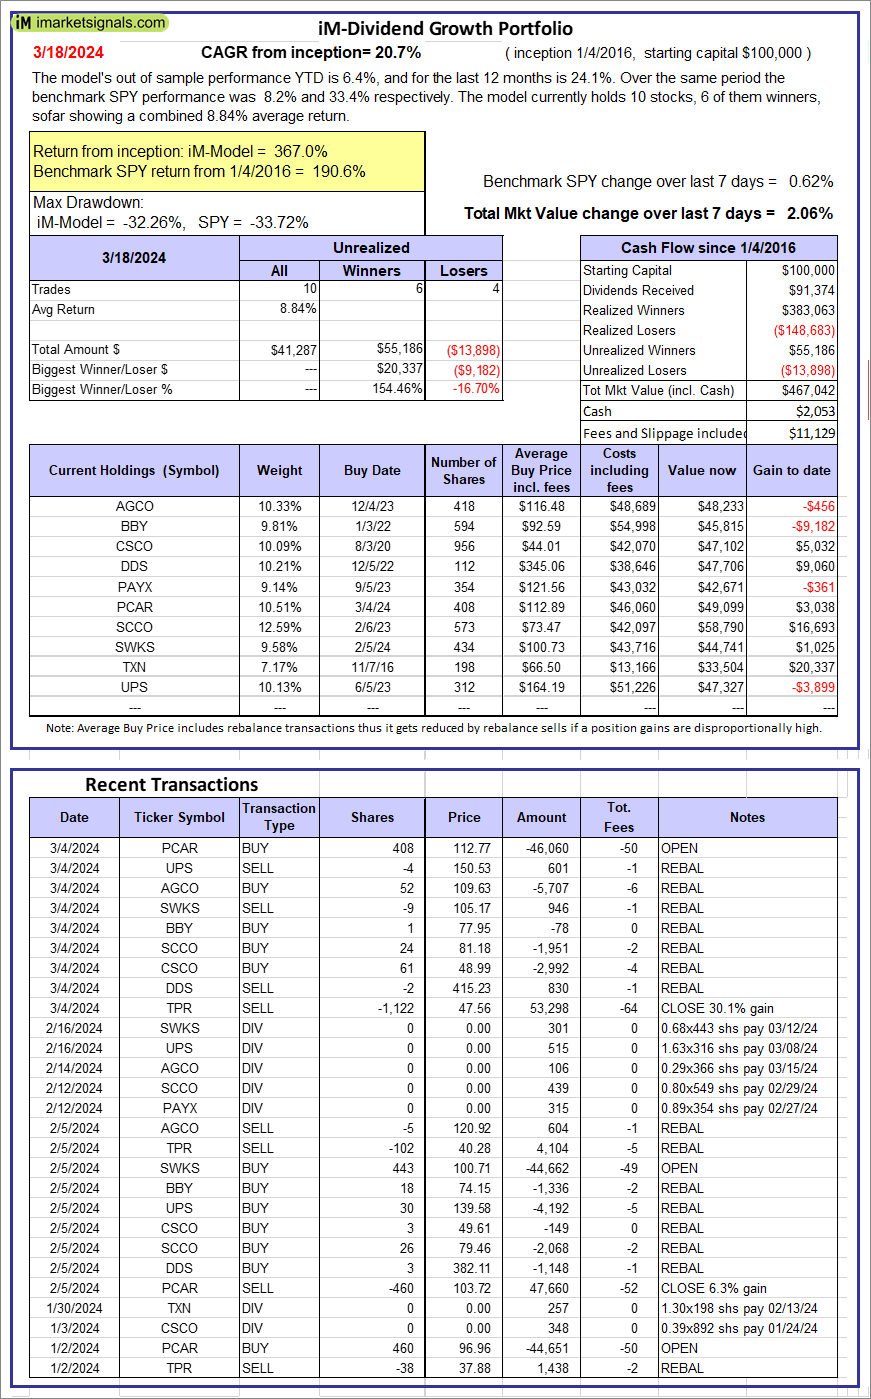 |
iM-Dividend Growth Portfolio: The model’s out of sample performance YTD is 6.4%, and for the last 12 months is 24.1%. Over the same period the benchmark SPY performance was 8.2% and 33.4% respectively. Over the previous week the market value of the iM-Dividend Growth Portfolio gained 2.06% at a time when SPY gained 0.62%. A starting capital of $100,000 at inception on 6/30/2016 would have grown to $467,042 which includes $2,053 cash and excludes $11,129 spent on fees and slippage. |
 |
iM-Gold Momentum Timer (AU, NEM, SBSW): The model’s out of sample performance YTD is -16.3%, and for the last 12 months is -17.6%. Over the same period the benchmark SPY performance was 8.2% and 33.4% respectively. Over the previous week the market value of iM-Gold Momentum Timer (AU, NEM, SBSW) gained -2.31% at a time when SPY gained 0.62%. A starting capital of $100,000 at inception on 6/30/2016 would have grown to $7,560 which includes $129,694 cash and excludes Gain to date spent on fees and slippage. |
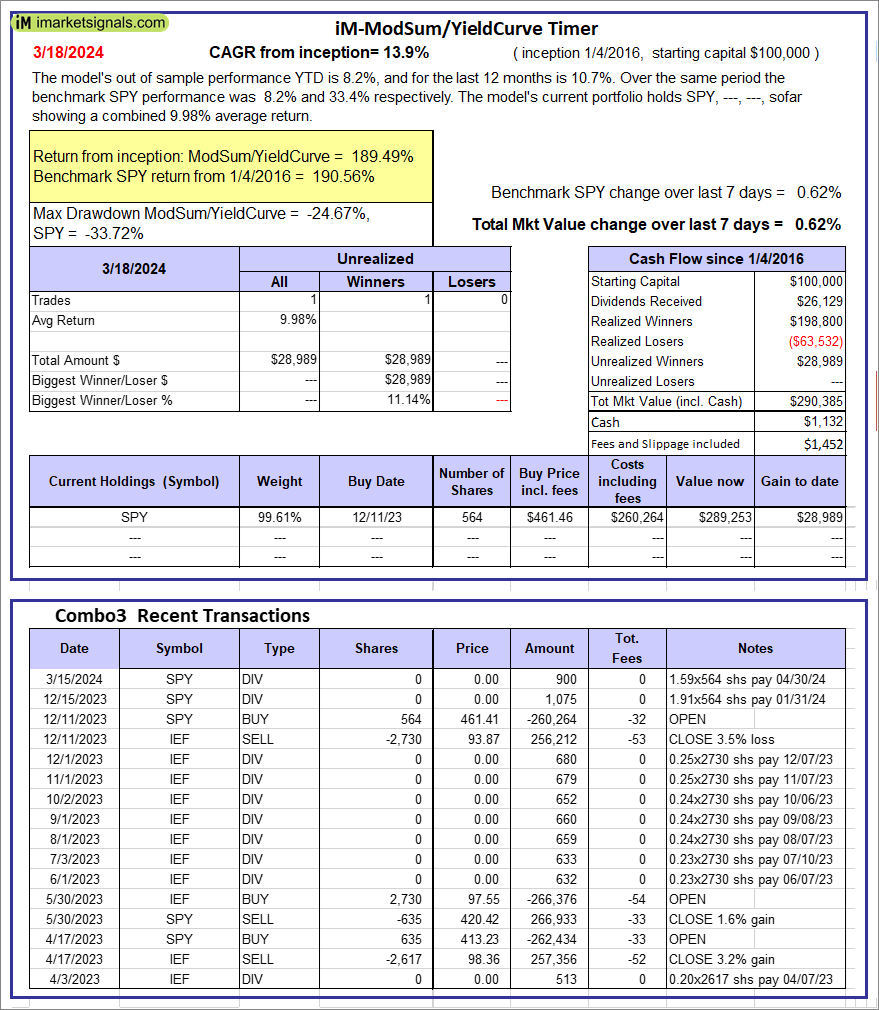 |
iM-ModSum/YieldCurve Timer: The model’s out of sample performance YTD is 8.2%, and for the last 12 months is 10.7%. Over the same period the benchmark SPY performance was 8.2% and 33.4% respectively. Over the previous week the market value of iM-PortSum/YieldCurve Timer gained 0.62% at a time when SPY gained 0.62%. A starting capital of $100,000 at inception on 1/1/2016 would have grown to $290,385 which includes $1,132 cash and excludes $1,452 spent on fees and slippage. |
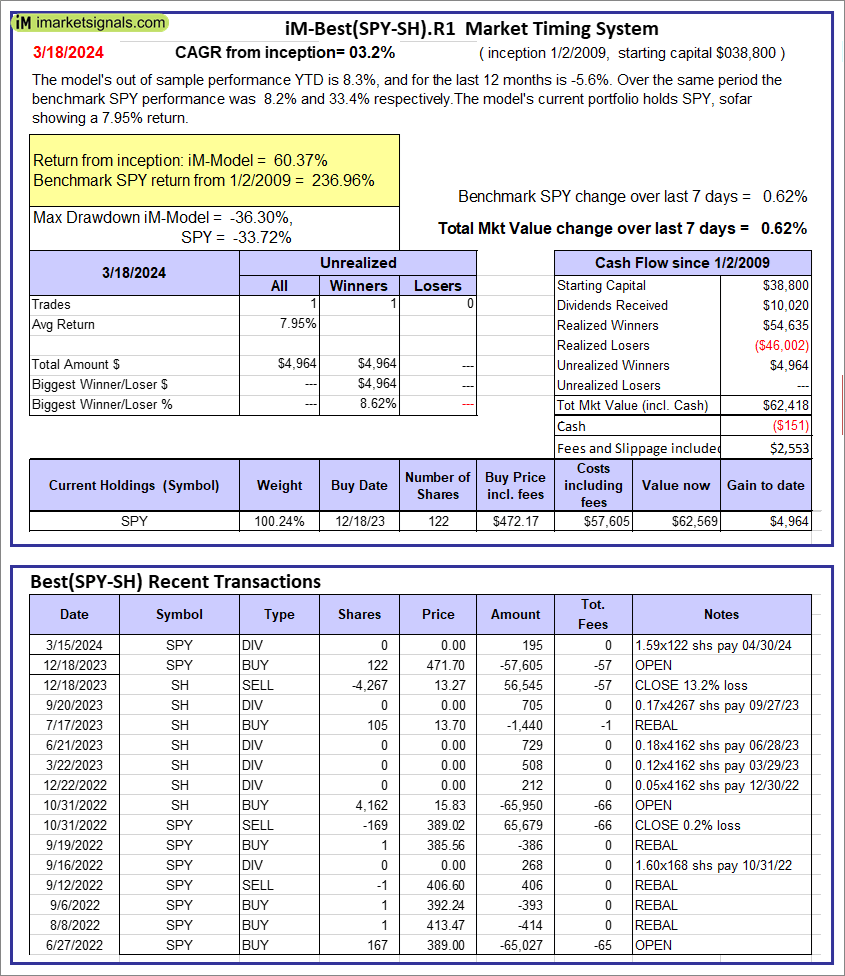 |
iM-Best(SPY-SH).R1: The model’s out of sample performance YTD is 8.3%, and for the last 12 months is -5.6%. Over the same period the benchmark SPY performance was 8.2% and 33.4% respectively. Over the previous week the market value of Best(SPY-SH) gained 0.62% at a time when SPY gained 0.62%. A starting capital of $100,000 at inception on 1/2/2009 would have grown to $62,418 which includes -$151 cash and excludes $2,553 spent on fees and slippage. |
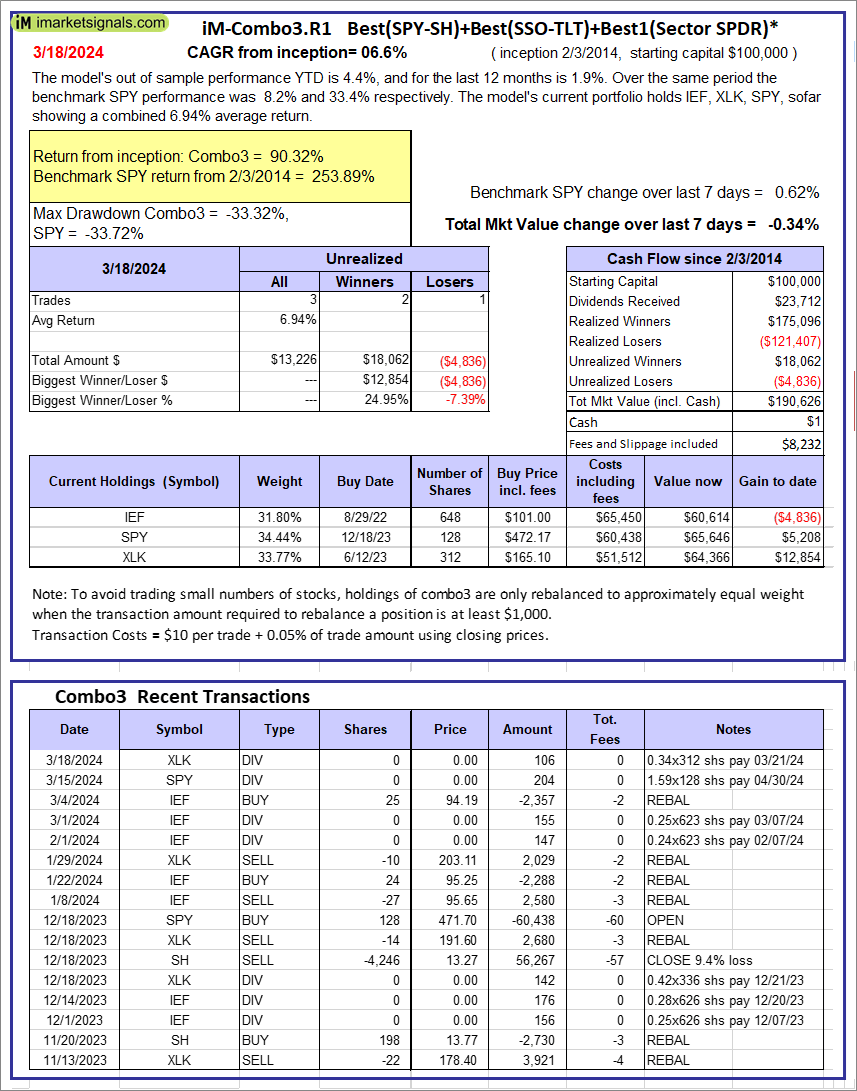 |
iM-Combo3.R1: The model’s out of sample performance YTD is 4.4%, and for the last 12 months is 1.9%. Over the same period the benchmark SPY performance was 8.2% and 33.4% respectively. Over the previous week the market value of iM-Combo3.R1 gained -0.34% at a time when SPY gained 0.62%. A starting capital of $100,000 at inception on 2/3/2014 would have grown to $190,626 which includes $1 cash and excludes $8,232 spent on fees and slippage. |
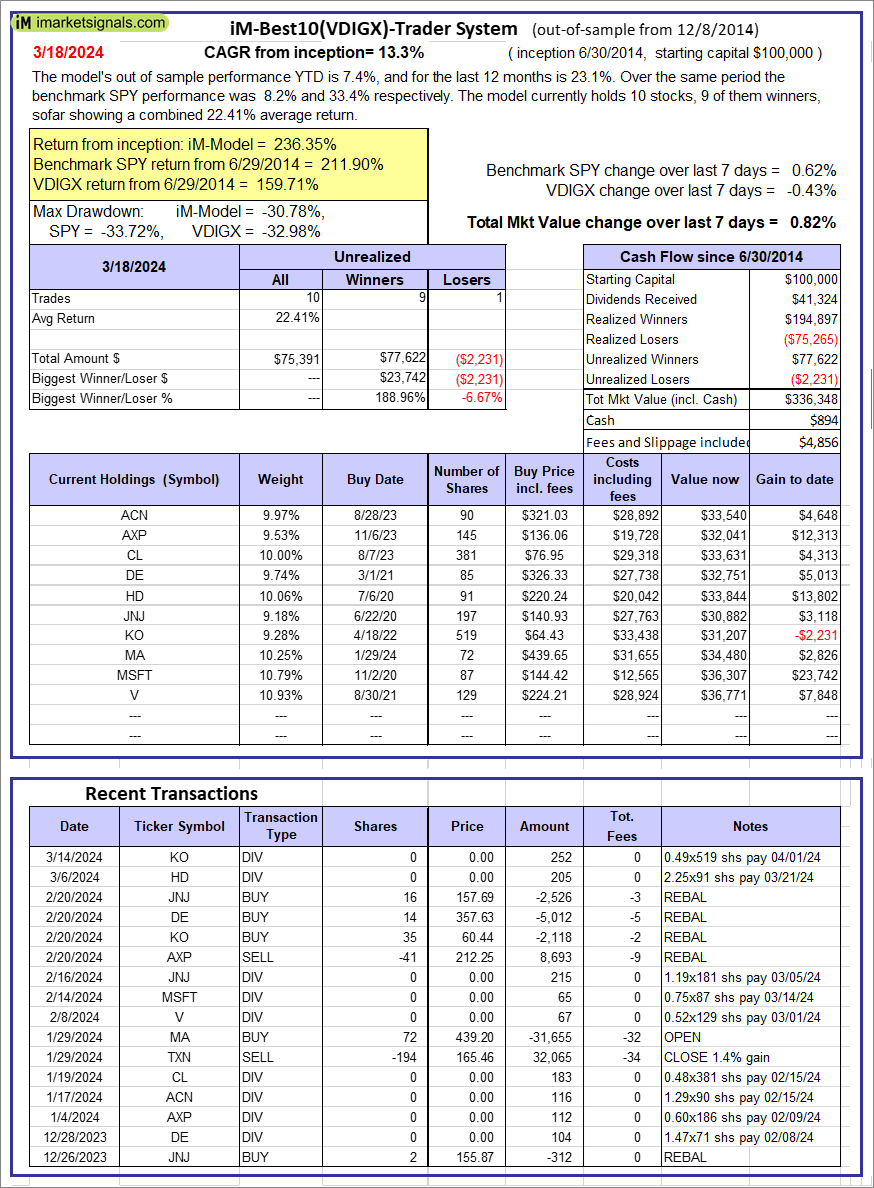 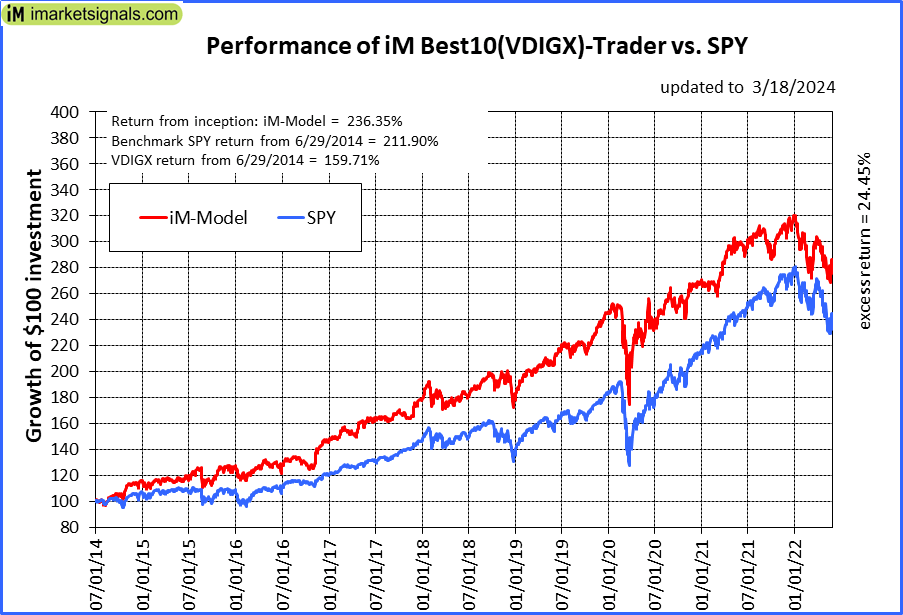 |
iM-Best10(VDIGX)-Trader: The model’s out of sample performance YTD is 7.4%, and for the last 12 months is 23.1%. Over the same period the benchmark SPY performance was 8.2% and 33.4% respectively. Since inception, on 7/1/2014, the model gained 236.35% while the benchmark SPY gained 211.90% and VDIGX gained 159.71% over the same period. Over the previous week the market value of iM-Best10(VDIGX) gained 0.82% at a time when SPY gained 0.62%. A starting capital of $100,000 at inception on 7/1/2014 would have grown to $336,348 which includes $894 cash and excludes $4,856 spent on fees and slippage. |
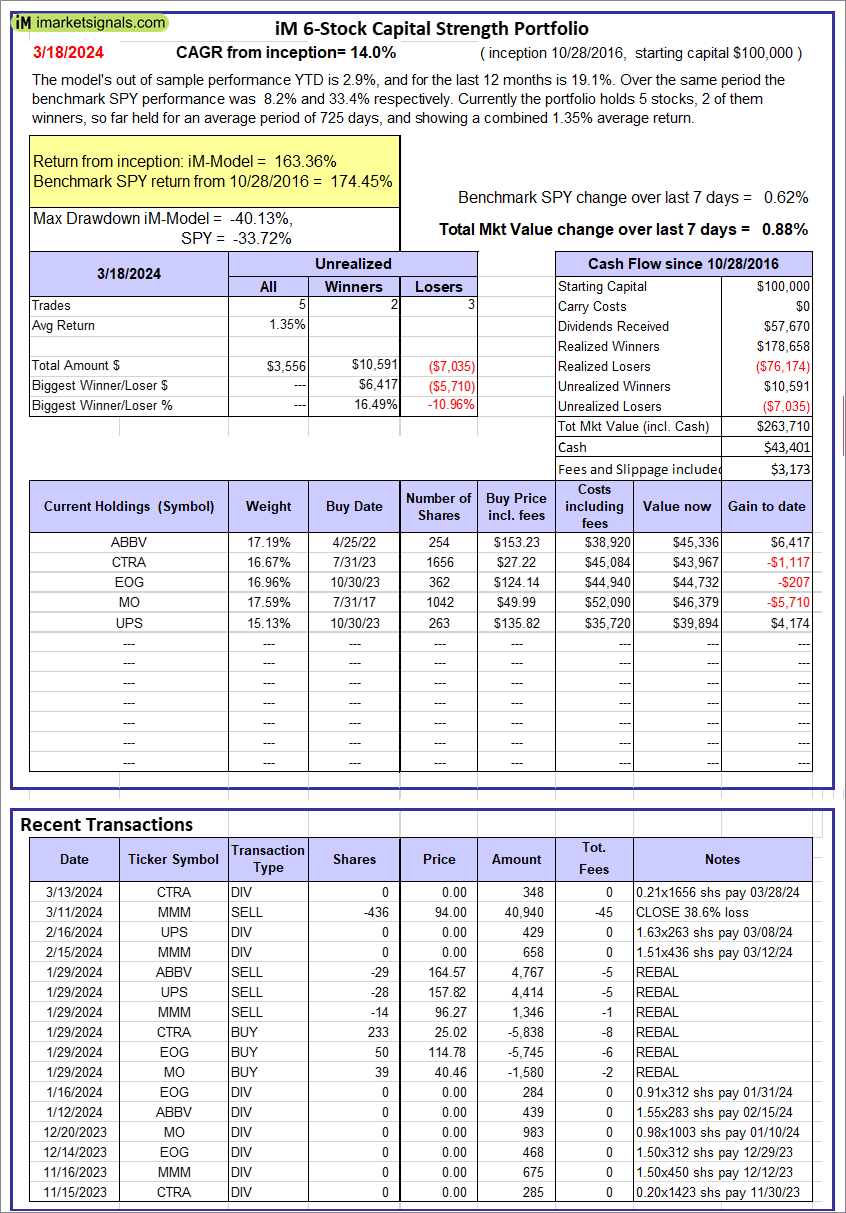 |
iM 6-Stock Capital Strength Portfolio: The model’s out of sample performance YTD is 2.9%, and for the last 12 months is 19.1%. Over the same period the benchmark SPY performance was 8.2% and 33.4% respectively. Over the previous week the market value of the iM 6-Stock Capital Strength Portfolio gained 0.88% at a time when SPY gained 0.62%. A starting capital of $100,000 at inception on 10/28/2016 would have grown to $263,710 which includes $43,401 cash and excludes $3,173 spent on fees and slippage. |
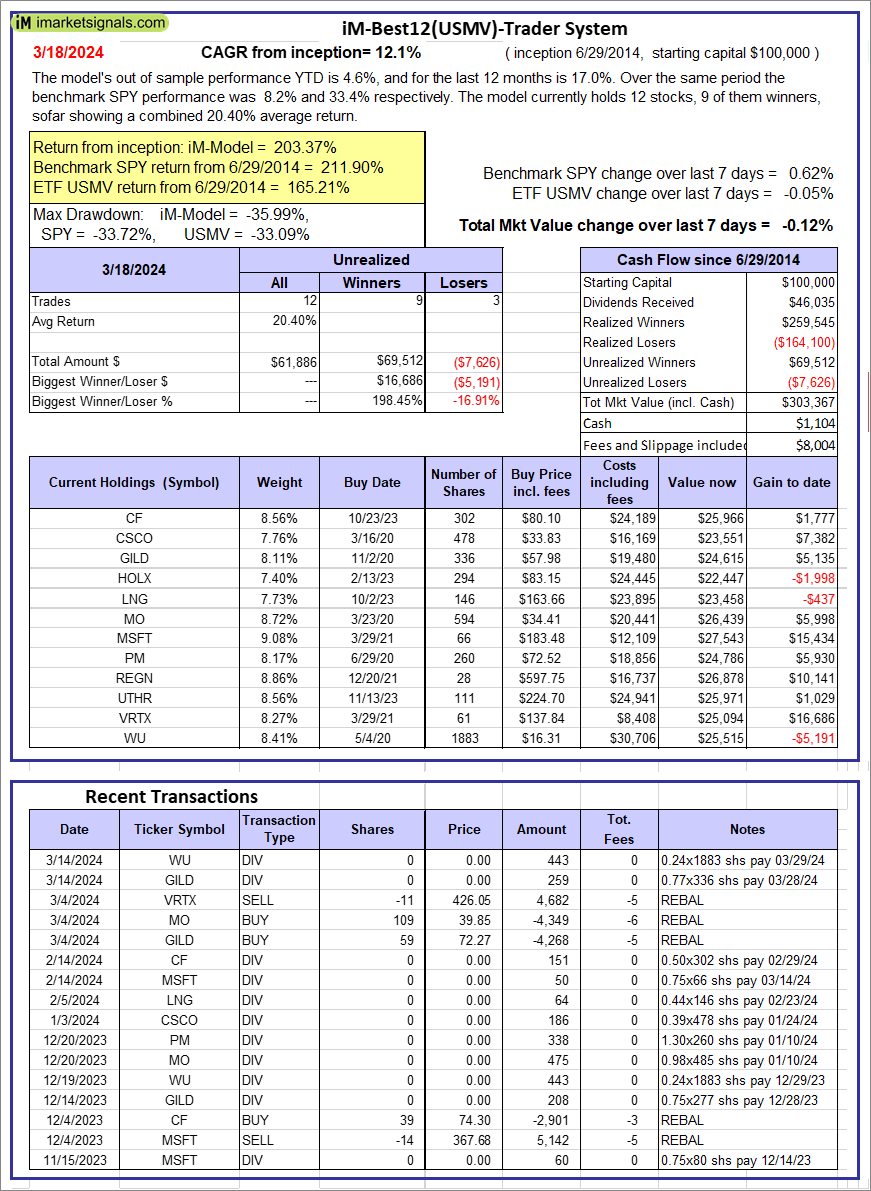 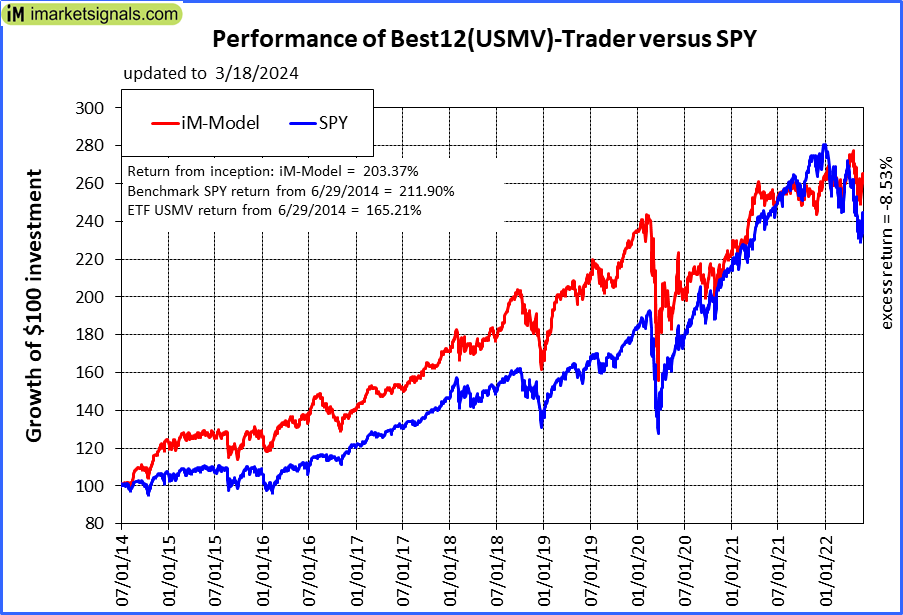 |
iM-Best12(USMV)-Trader: The model’s out of sample performance YTD is 4.6%, and for the last 12 months is 17.0%. Over the same period the benchmark SPY performance was 8.2% and 33.4% respectively. Since inception, on 6/30/2014, the model gained 203.37% while the benchmark SPY gained 211.90% and the ETF USMV gained 165.21% over the same period. Over the previous week the market value of iM-Best12(USMV)-Trader gained -0.12% at a time when SPY gained 0.62%. A starting capital of $100,000 at inception on 6/30/2014 would have grown to $303,367 which includes $1,104 cash and excludes $8,004 spent on fees and slippage. |
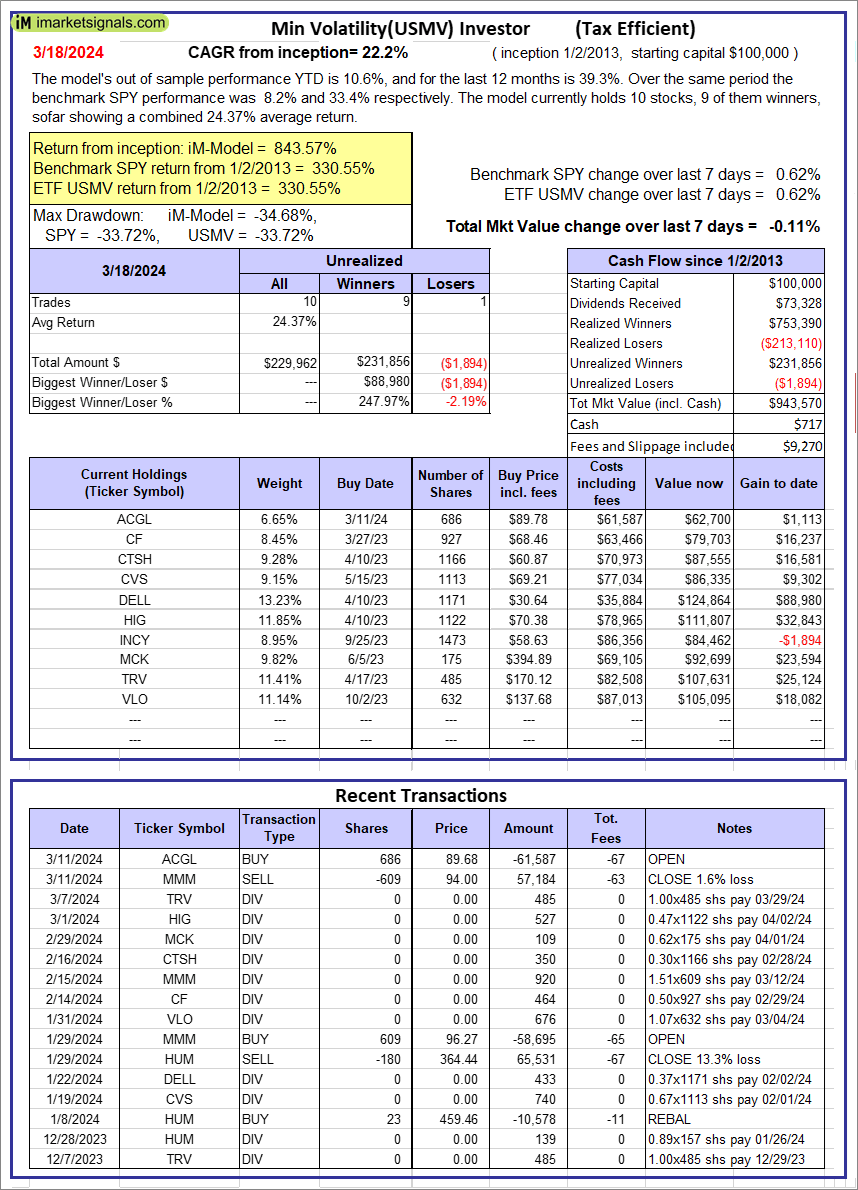 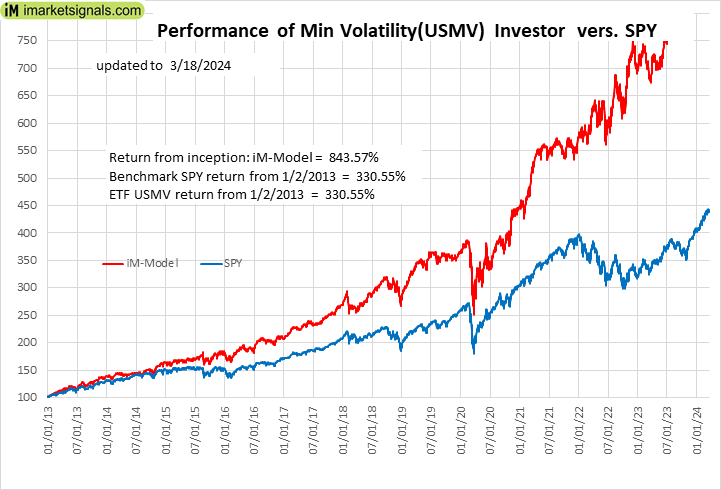 |
iM-Min Volatility(USMV) Investor (Tax Efficient): The model’s out of sample performance YTD is 10.6%, and for the last 12 months is 39.3%. Over the same period the benchmark SPY performance was 8.2% and 33.4% respectively. Since inception, on 1/3/2013, the model gained 843.57% while the benchmark SPY gained 330.55% and the ETF USMV gained 330.55% over the same period. Over the previous week the market value of iM-Best12(USMV)Q1 gained -0.11% at a time when SPY gained 0.62%. A starting capital of $100,000 at inception on 1/3/2013 would have grown to $943,570 which includes $717 cash and excludes $9,270 spent on fees and slippage. |
 |
iM-Bond Market Trader (High-Yield Bond or 10-yr Treasury Bond): The model’s out of sample performance YTD is -0.7%, and for the last 12 months is -1.4%. Over the same period the benchmark BND performance was -1.6% and 0.8% respectively. Over the previous week the market value of the iM-Bond Market Trader (High-Yield Bond or 10-yr Treasury Bond) gained -1.65% at a time when BND gained -1.24%. A starting capital of $10,000 at inception on 1/3/2000 would have grown to $136,324 which includes $130 cash and excludes $2,613 spent on fees and slippage. |
|
|
iM-ModSum/YieldCurve Timer: The model’s out of sample performance YTD is 8.2%, and for the last 12 months is 10.7%. Over the same period the benchmark SPY performance was 8.2% and 33.4% respectively. Over the previous week the market value of iM-PortSum/YieldCurve Timer gained 0.62% at a time when SPY gained 0.62%. A starting capital of $100,000 at inception on 1/1/2016 would have grown to $290,385 which includes $1,132 cash and excludes $1,452 spent on fees and slippage. |
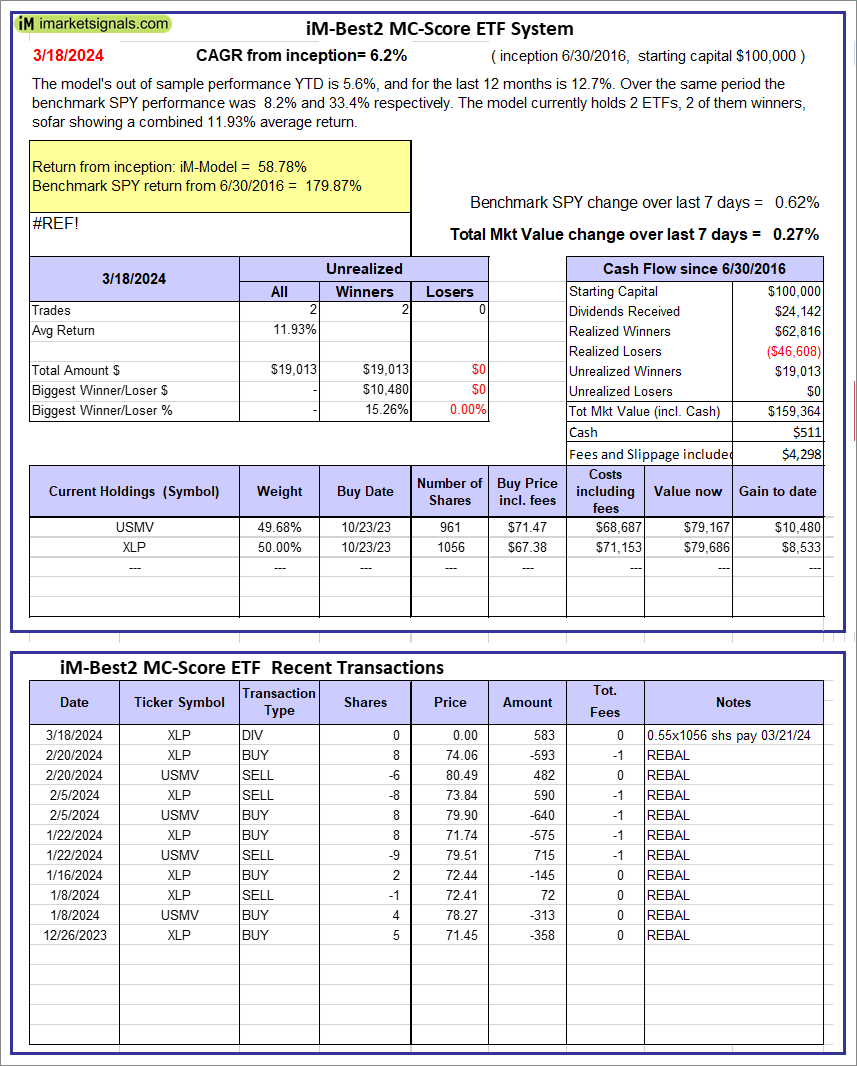 |
iM-Best2 MC-Score ETF System: The model’s out of sample performance YTD is 5.6%, and for the last 12 months is 12.7%. Over the same period the benchmark SPY performance was 8.2% and 33.4% respectively. Over the previous week the market value of the iM-Best2 MC-Score ETF System gained 0.27% at a time when SPY gained 0.62%. A starting capital of $100,000 at inception on 6/30/2016 would have grown to $159,364 which includes $511 cash and excludes $4,298 spent on fees and slippage. |
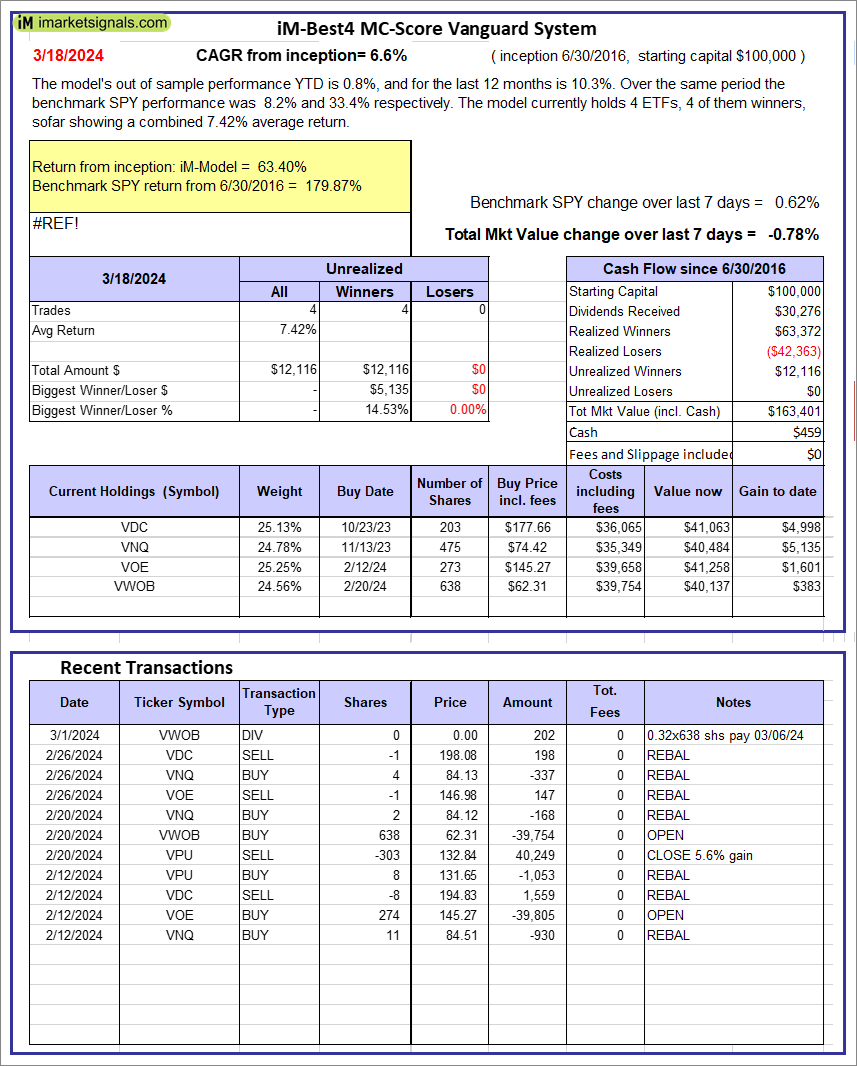 |
iM-Best4 MC-Score Vanguard System: The model’s out of sample performance YTD is 0.8%, and for the last 12 months is 10.3%. Over the same period the benchmark SPY performance was 8.2% and 33.4% respectively. Over the previous week the market value of the iM-Best4 MC-Score Vanguard System gained -0.78% at a time when SPY gained 0.62%. A starting capital of $100,000 at inception on 6/30/2016 would have grown to $163,401 which includes $459 cash and excludes $00 spent on fees and slippage. |
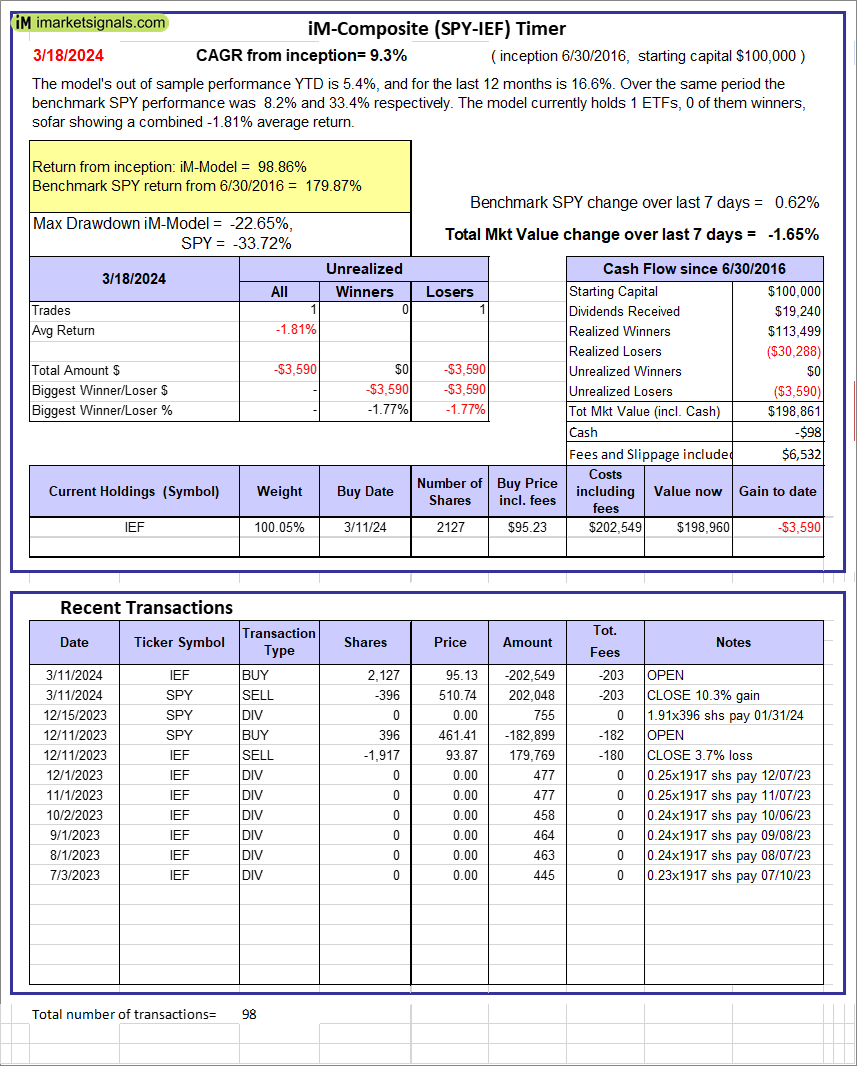 |
iM-Composite (SPY-IEF) Timer: The model’s out of sample performance YTD is 5.4%, and for the last 12 months is 16.6%. Over the same period the benchmark SPY performance was 8.2% and 33.4% respectively. Over the previous week the market value of the iM-Composite (SPY-IEF) Timer gained -1.65% at a time when SPY gained 0.62%. A starting capital of $100,000 at inception on 6/30/2016 would have grown to $198,861 which includes -$98 cash and excludes $6,532 spent on fees and slippage. |
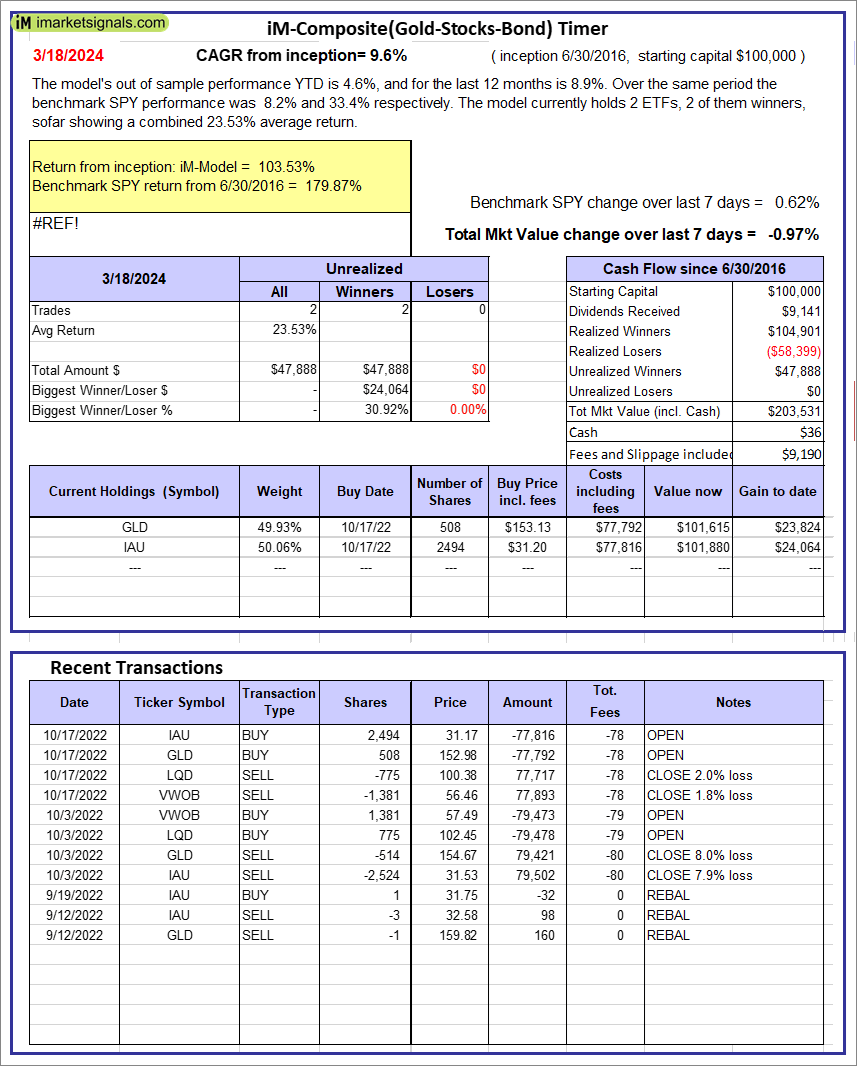 |
iM-Composite(Gold-Stocks-Bond) Timer: The model’s out of sample performance YTD is 4.6%, and for the last 12 months is 8.9%. Over the same period the benchmark SPY performance was 8.2% and 33.4% respectively. Over the previous week the market value of the iM-Composite(Gold-Stocks-Bond) Timer gained -0.97% at a time when SPY gained 0.62%. A starting capital of $100,000 at inception on 6/30/2016 would have grown to $203,531 which includes $36 cash and excludes $9,190 spent on fees and slippage. |
iM-Best Reports – 3/18/2024
Posted in pmp SPY-SH
Leave a Reply
You must be logged in to post a comment.