
  |
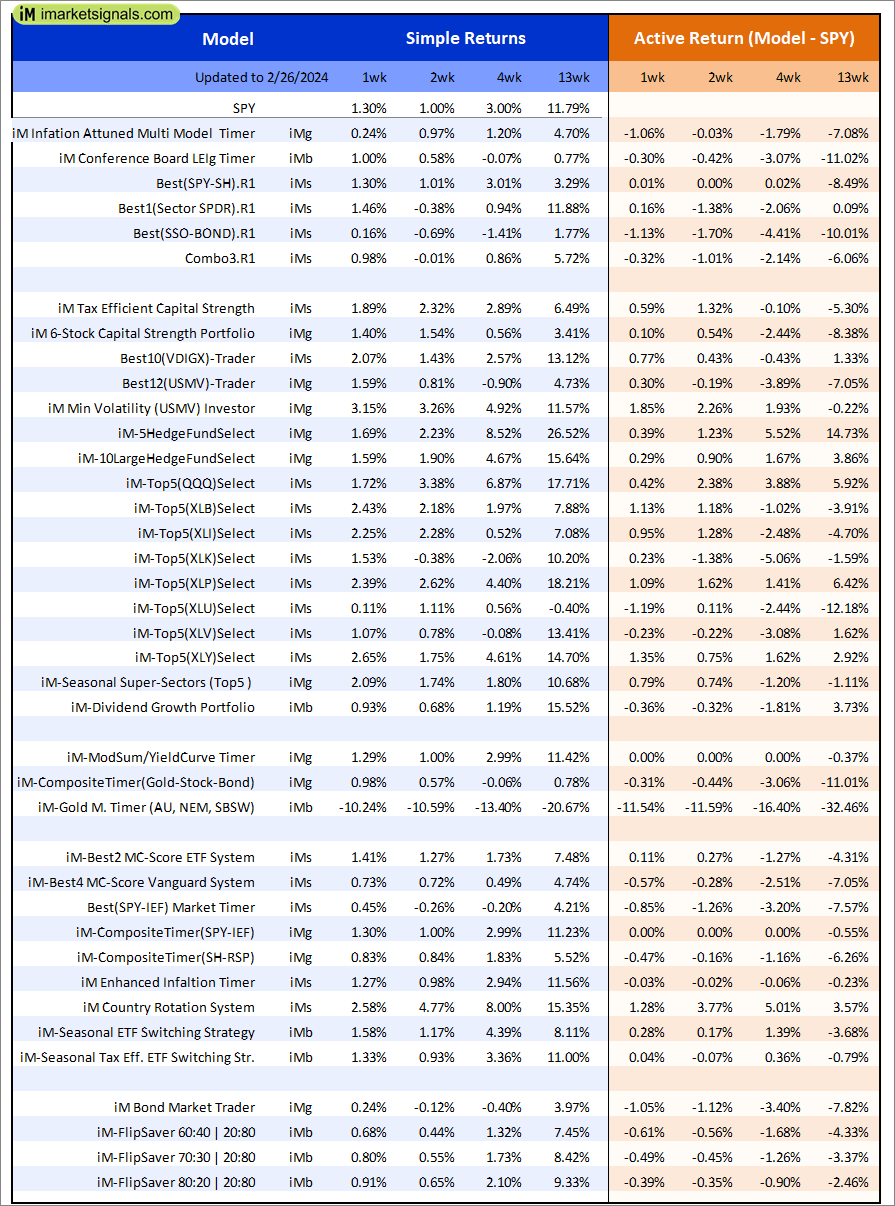
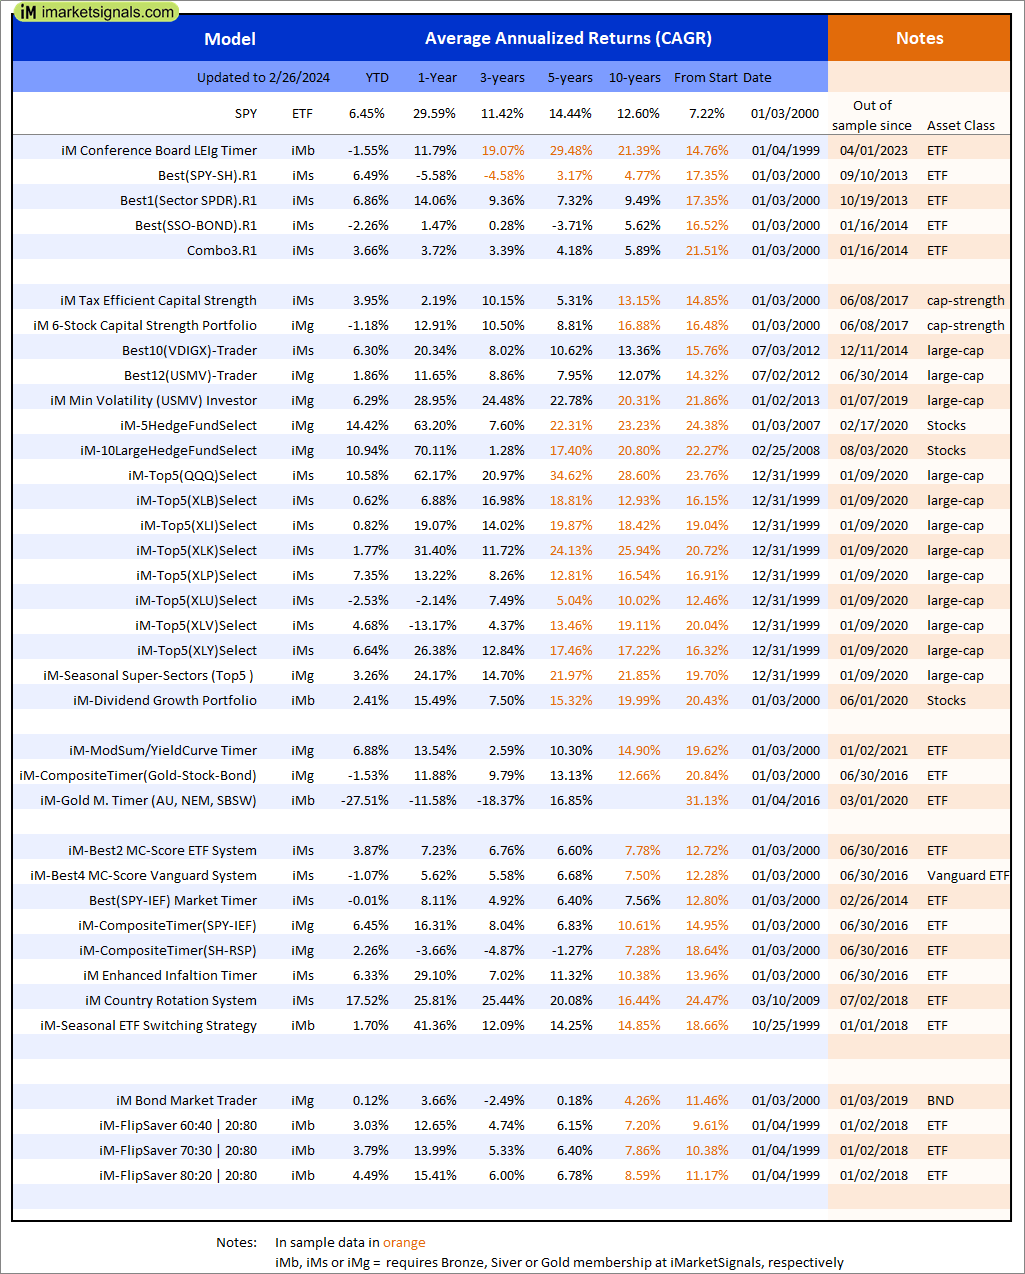
Out of sample performance summary of our models for the past 1, 2, 4 and 13 week periods. The active active return indicates how the models over- or underperformed the benchmark ETF SPY. Also the YTD, and the 1-, 3-, 5- and 10-year annualized returns are shown in the second table |
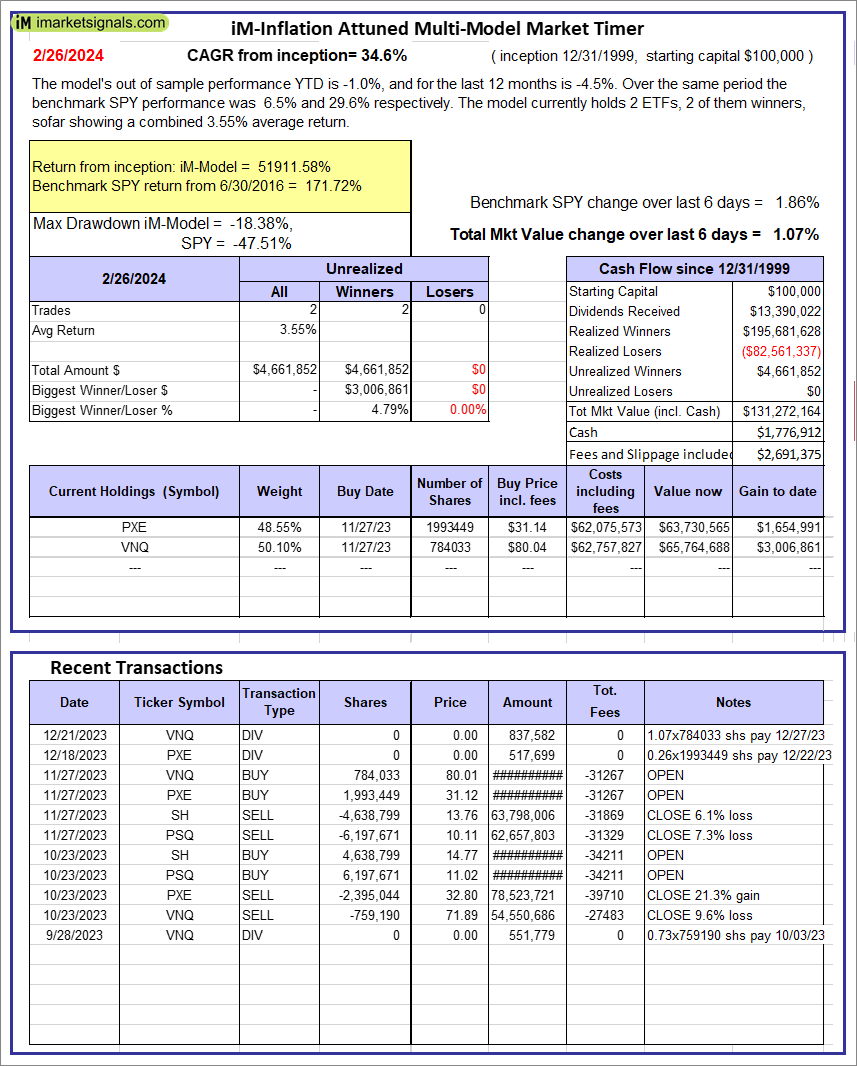 |
iM-Inflation Attuned Multi-Model Market Timer: The model’s out of sample performance YTD is -1.0%, and for the last 12 months is -4.5%. Over the same period the benchmark SPY performance was 6.5% and 29.6% respectively. Over the previous week the market value of the iM-Inflation Attuned Multi-Model Market Timer gained 1.07% at a time when SPY gained 1.86%. A starting capital of $100,000 at inception on 3/24/2017 would have grown to $131,272,164 which includes $1,776,912 cash and excludes $2,691,375 spent on fees and slippage. |
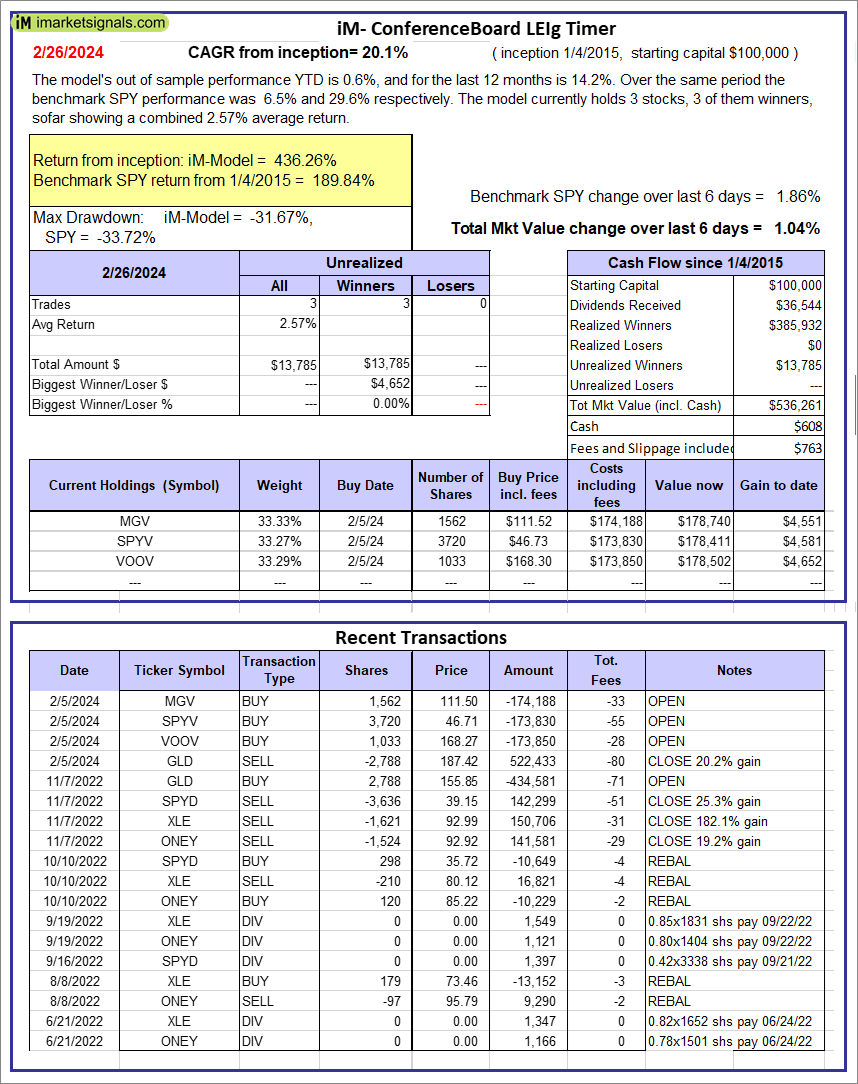 |
iM-Conference Board LEIg Timer: The model’s performance YTD is 14.3%, and for the last 12 months is 7.3%. Over the same period the benchmark SPY performance was 20.1% and 9.4% respectively. Over the previous week the market value of the iM-Conference Board LEIg Timer gained 1.04% at a time when SPY gained 1.86%. A starting capital of $100,000 at inception on 4/5/2017 would have grown to $536,261 which includes $608 cash and excludes $763 spent on fees and slippage. |
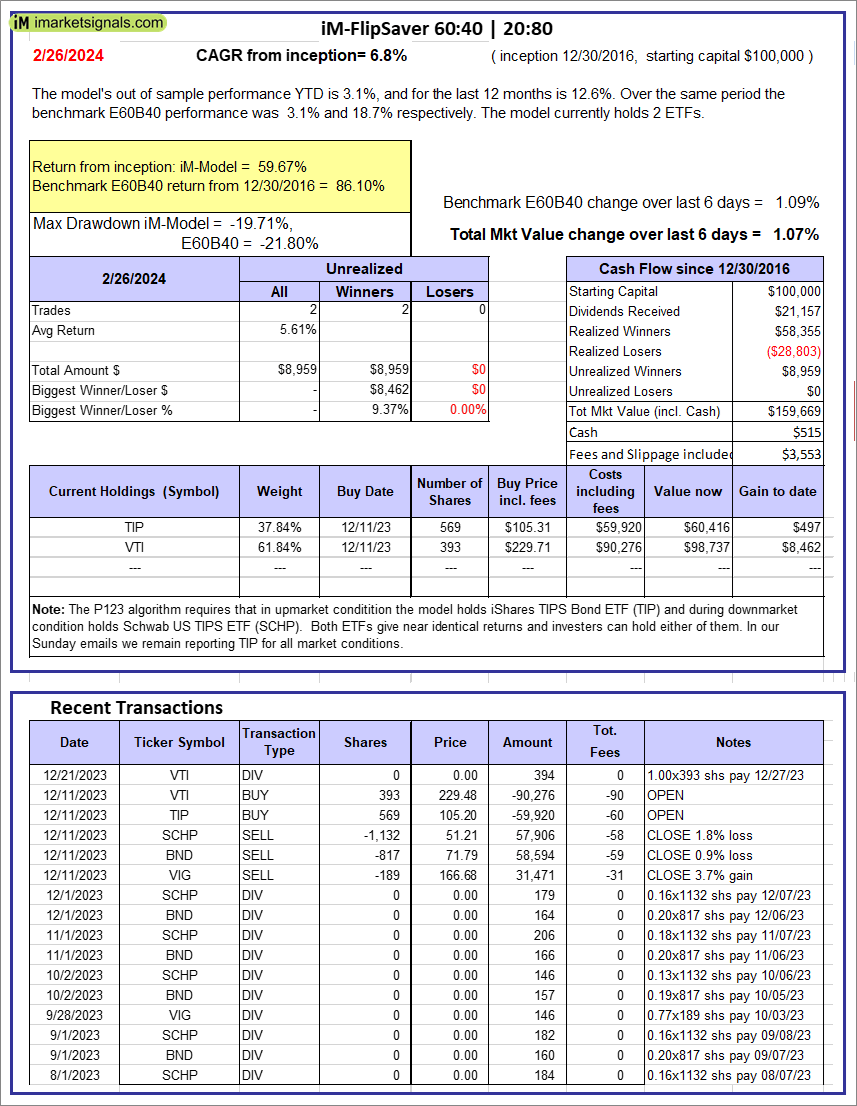 |
iM-FlipSaver 60:40 | 20:80 – 2017: The model’s out of sample performance YTD is 3.1%, and for the last 12 months is 12.6%. Over the same period the benchmark E60B40 performance was 3.1% and 18.7% respectively. Over the previous week the market value of iM-FlipSaver 80:20 | 20:80 gained 1.07% at a time when SPY gained 1.09%. A starting capital of $100,000 at inception on 7/16/2015 would have grown to $159,669 which includes $515 cash and excludes $3,553 spent on fees and slippage. |
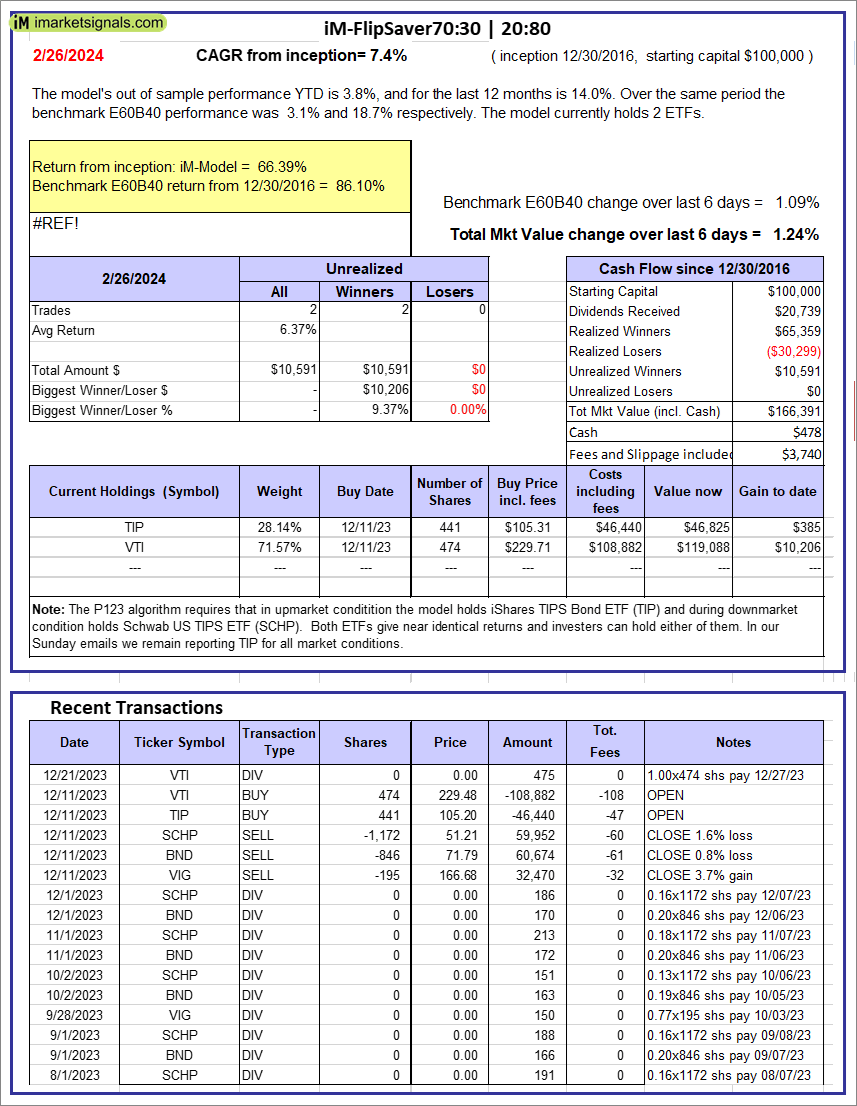 |
iM-FlipSaver 70:30 | 20:80 – 2017: The model’s out of sample performance YTD is 3.8%, and for the last 12 months is 14.0%. Over the same period the benchmark E60B40 performance was 3.1% and 18.7% respectively. Over the previous week the market value of iM-FlipSaver 70:30 | 20:80 gained 1.24% at a time when SPY gained 1.09%. A starting capital of $100,000 at inception on 7/15/2015 would have grown to $166,391 which includes $478 cash and excludes $3,740 spent on fees and slippage. |
 |
iM-FlipSaver 80:20 | 20:80 – 2017: The model’s out of sample performance YTD is 4.5%, and for the last 12 months is 15.4%. Over the same period the benchmark E60B40 performance was 3.1% and 18.7% respectively. Over the previous week the market value of iM-FlipSaver 80:20 | 20:80 gained 1.42% at a time when SPY gained 1.09%. A starting capital of $100,000 at inception on 1/2/2017 would have grown to $173,063 which includes $448 cash and excludes $3,918 spent on fees and slippage. |
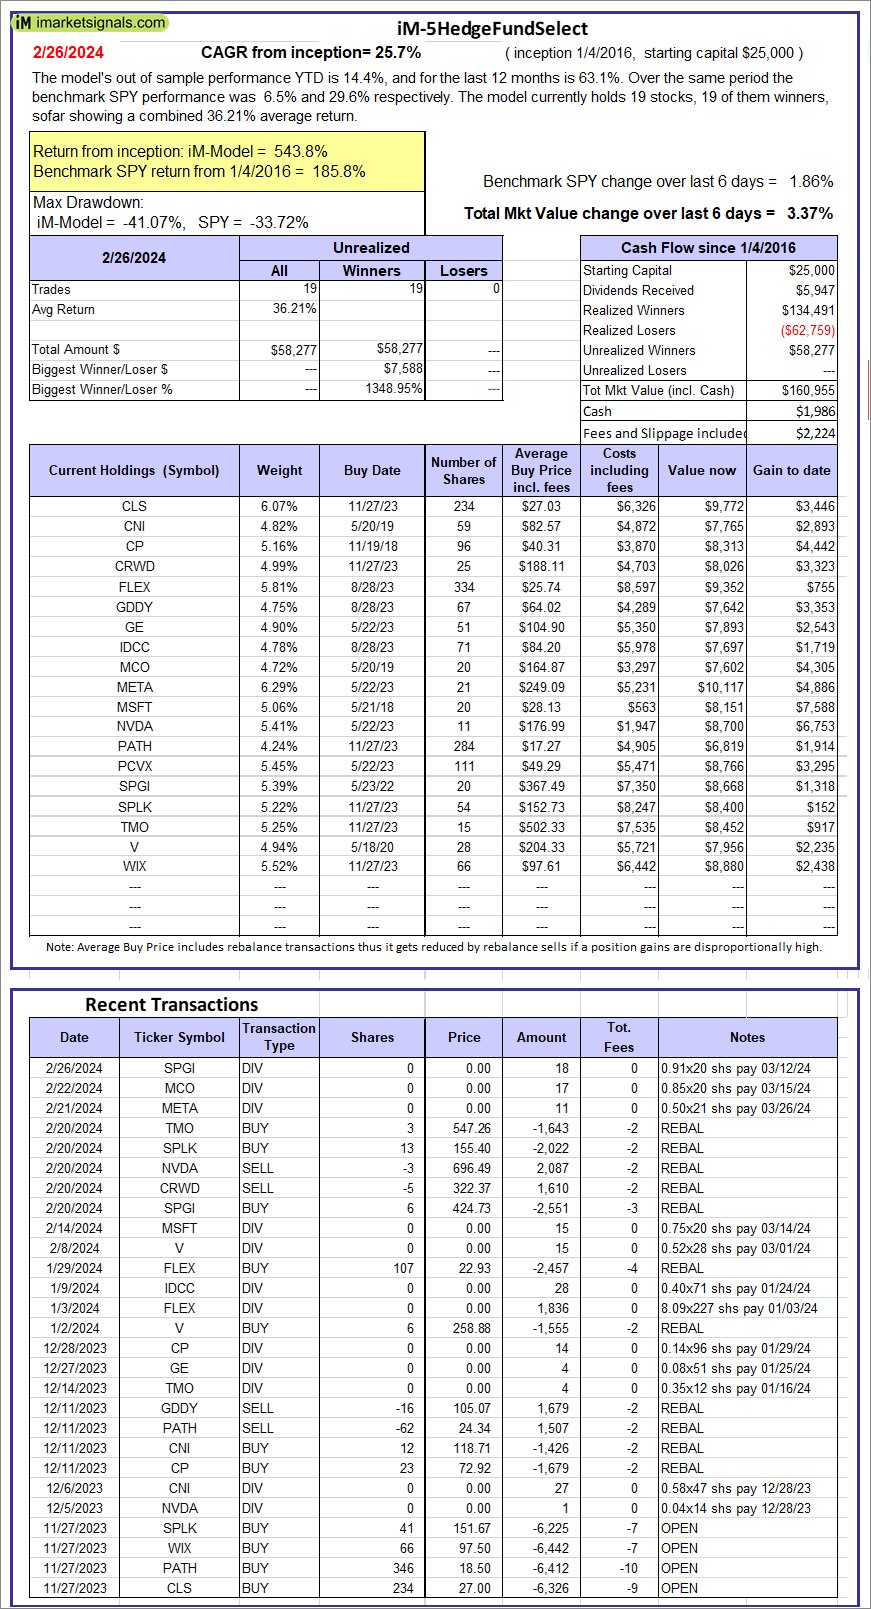 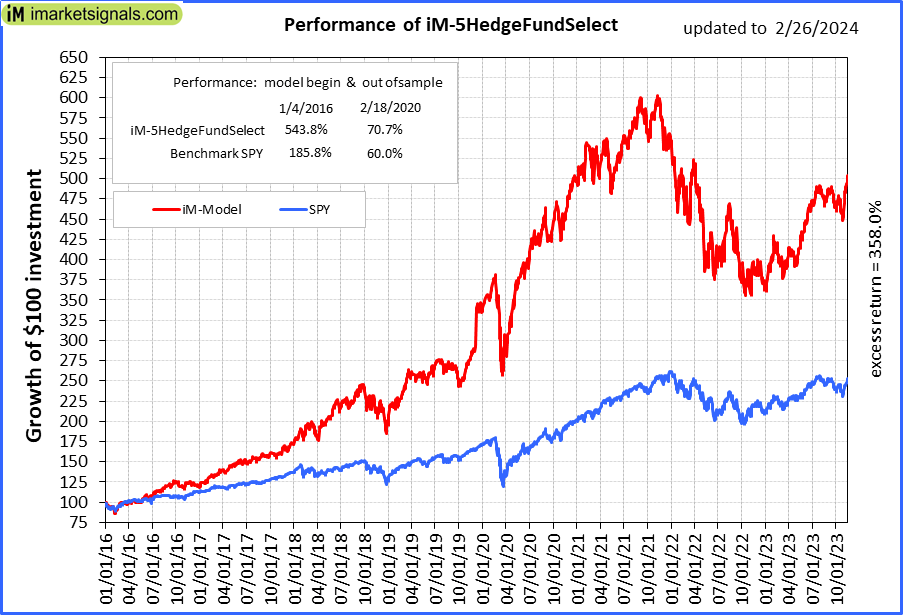 |
iM-5HedgeFundSelect: Since inception, on 1/5/2016, the model gained 543.82% while the benchmark SPY gained 185.78% over the same period. Over the previous week the market value of iM-5HedgeFundSelect gained 3.37% at a time when SPY gained 1.86%. A starting capital of $25,000 at inception on 1/5/2016 would have grown to $160,955 which includes $1,986 cash and excludes $2,224 spent on fees and slippage. |
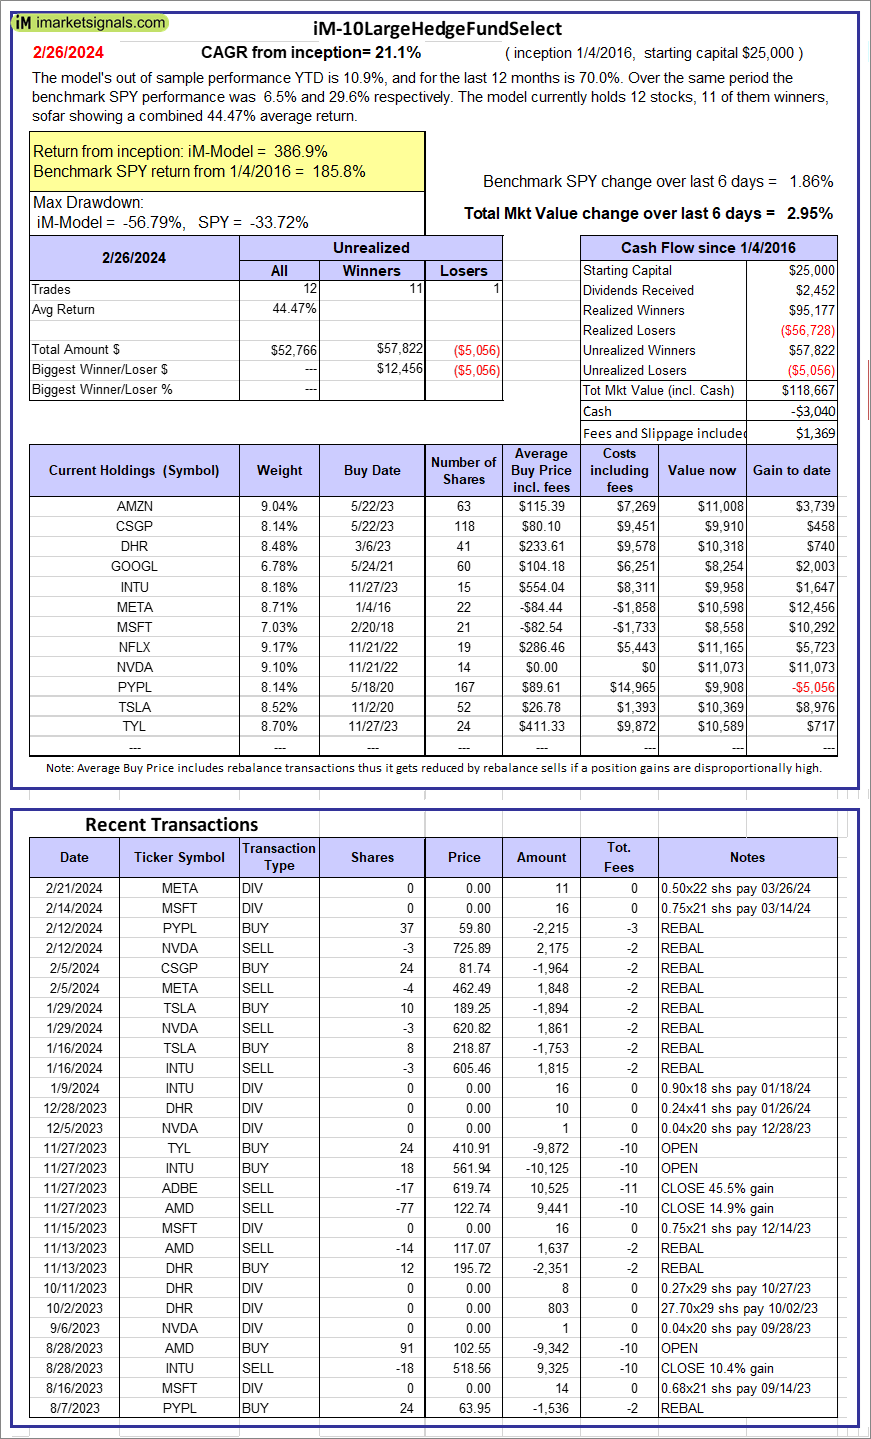 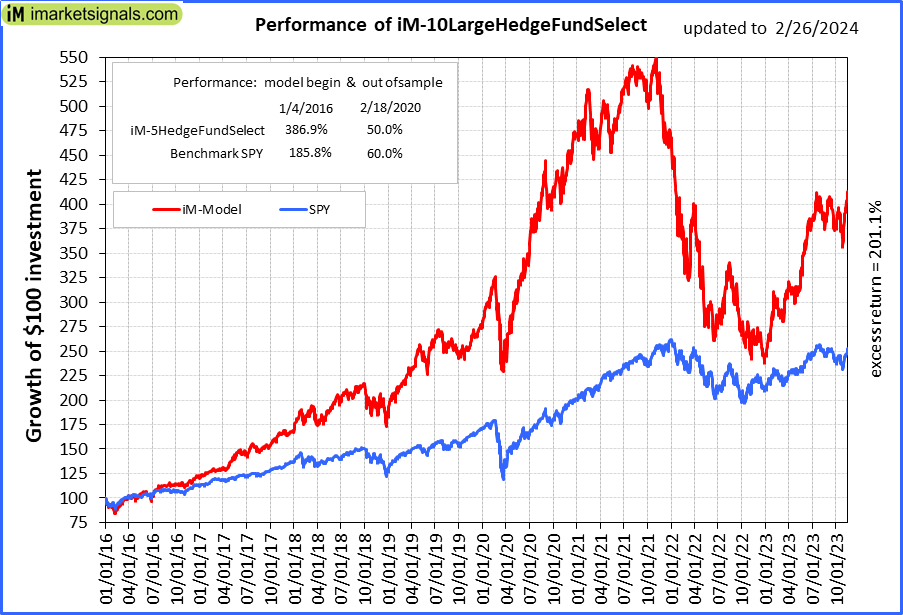 |
iM-10LargeHedgeFundSelect: Since inception, on 1/5/2016, the model gained 386.90% while the benchmark SPY gained 185.78% over the same period. Over the previous week the market value of iM-10LargeHedgeFundSelect gained 2.95% at a time when SPY gained 1.86%. A starting capital of $25,000 at inception on 1/5/2016 would have grown to $118,667 which includes -$3,040 cash and excludes $1,369 spent on fees and slippage. |
 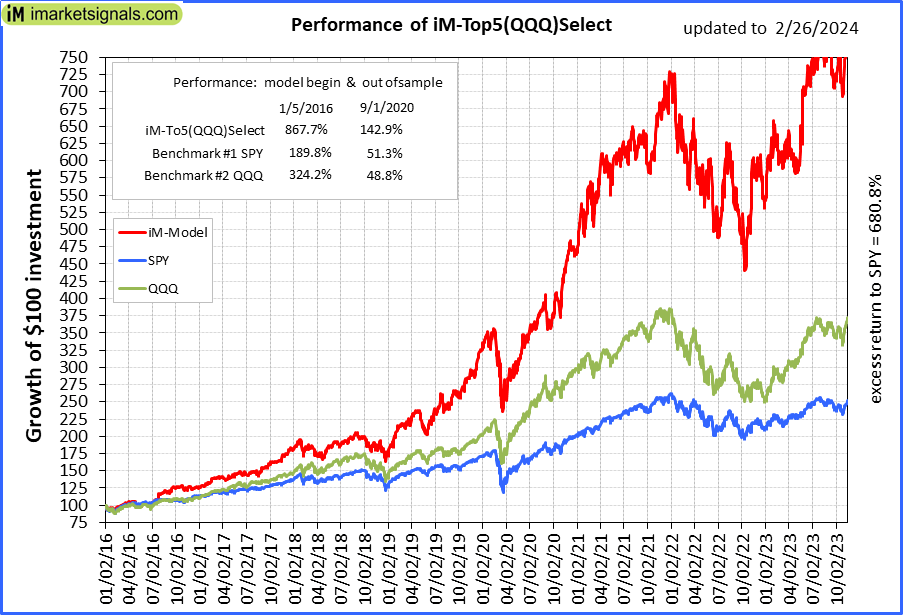 |
iM-Top5(QQQ)Select: Since inception, on 1/5/2016, the model gained 866.53% while the benchmark SPY gained 185.78% over the same period. Over the previous week the market value of iM-Top5(QQQ)Select gained 3.28% at a time when SPY gained 1.86%. A starting capital of $100,000 at inception on 1/5/2016 would have grown to $966,531 which includes $2,261 cash and excludes $11,074 spent on fees and slippage. |
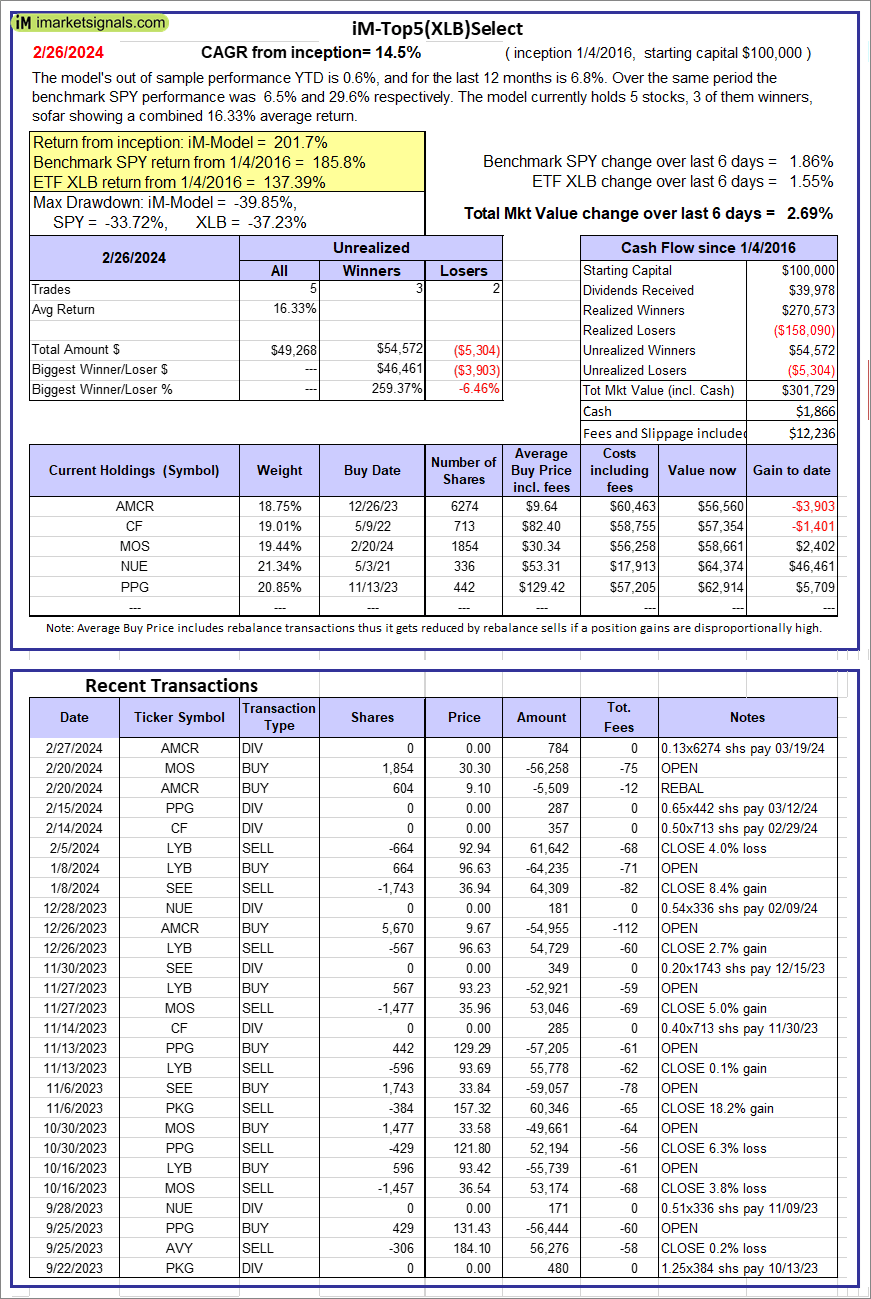 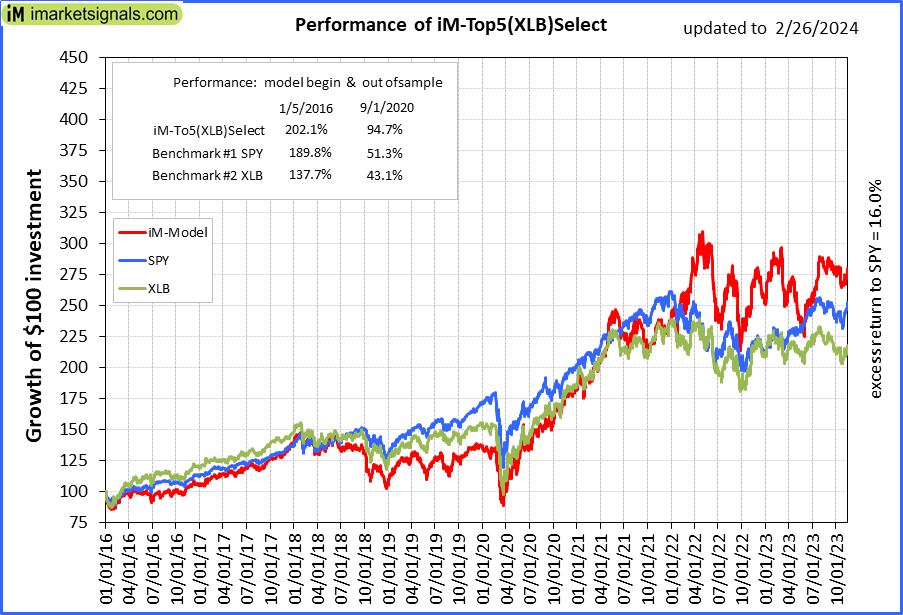 |
iM-Top5(XLB)Select: Since inception, on 1/5/2016, the model gained 201.73% while the benchmark SPY gained 185.78% over the same period. Over the previous week the market value of iM-Top5(XLB)Select gained 2.69% at a time when SPY gained 1.86%. A starting capital of $100,000 at inception on 1/5/2016 would have grown to $301,729 which includes $1,866 cash and excludes $12,236 spent on fees and slippage. |
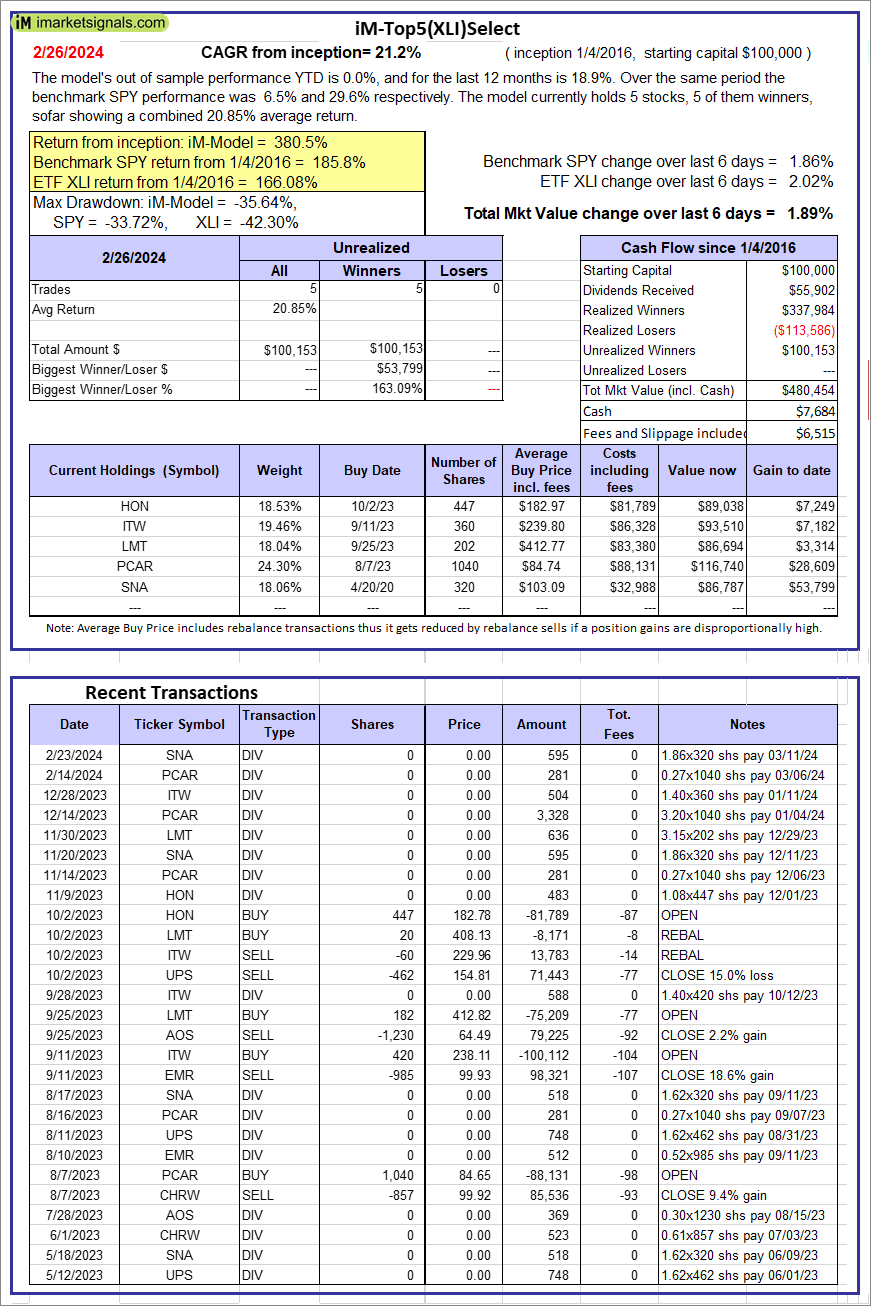 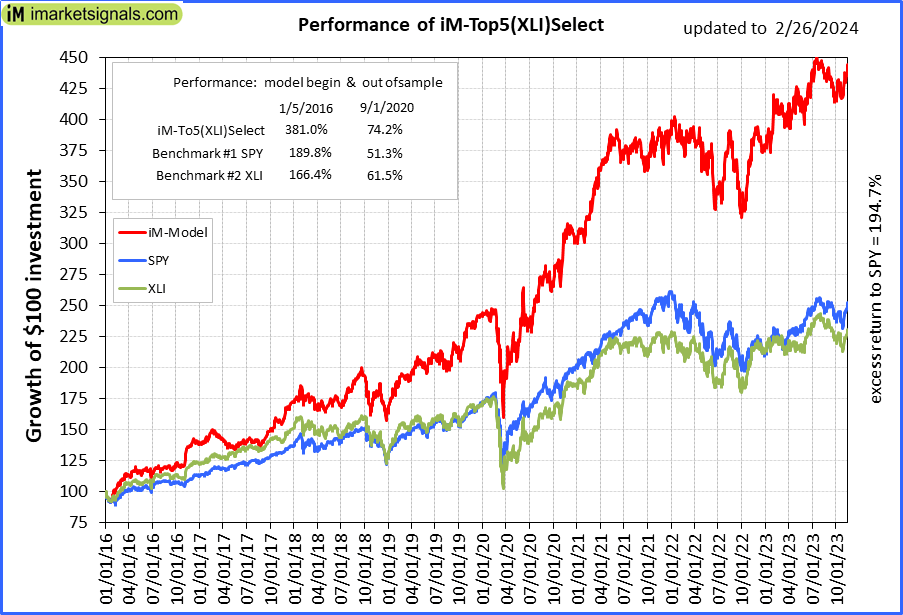 |
iM-Top5(XLI)Select: Since inception, on 1/5/2016, the model gained 380.45% while the benchmark SPY gained 185.78% over the same period. Over the previous week the market value of iM-Top5(XLI)Select gained 1.89% at a time when SPY gained 1.86%. A starting capital of $100,000 at inception on 1/5/2016 would have grown to $480,454 which includes $7,684 cash and excludes $6,515 spent on fees and slippage. |
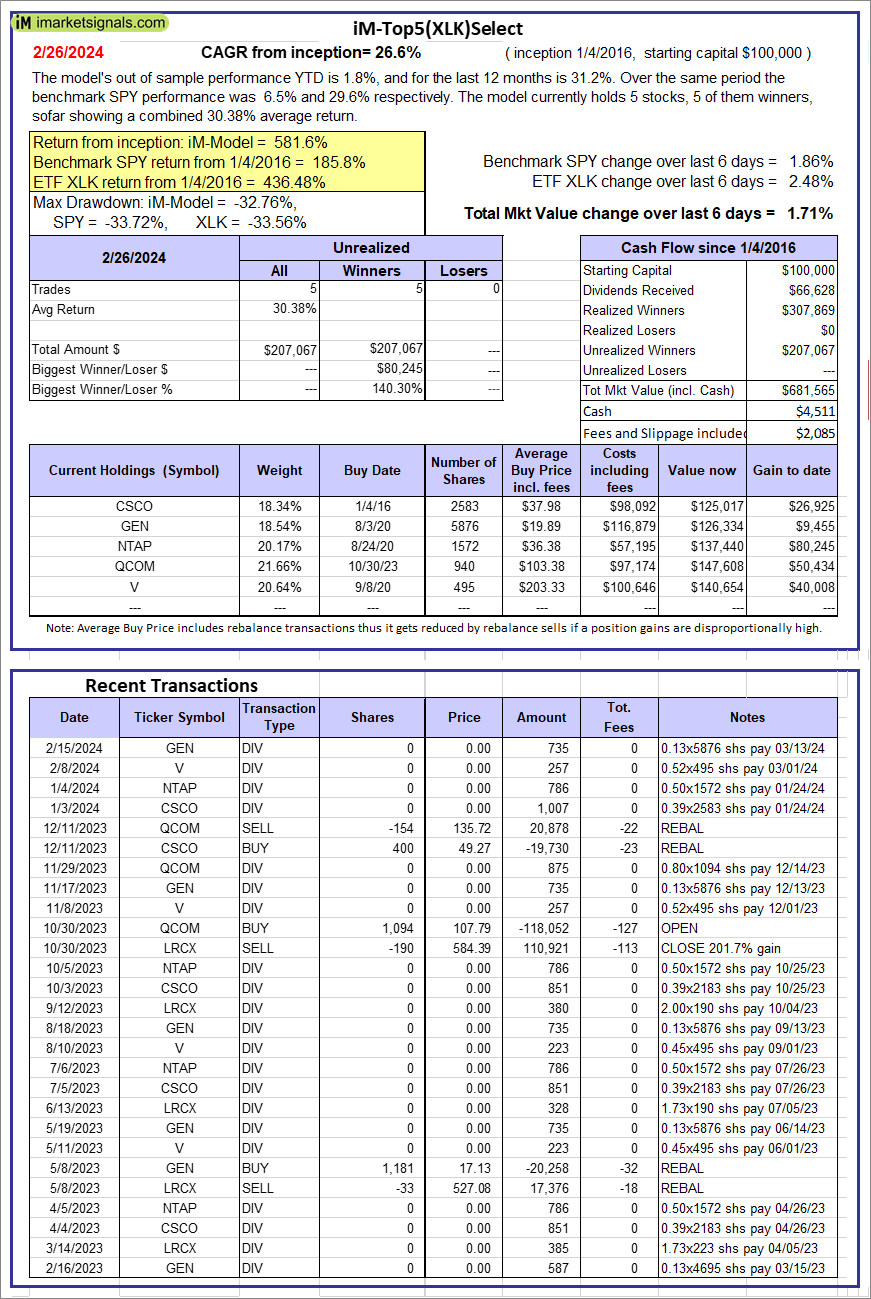 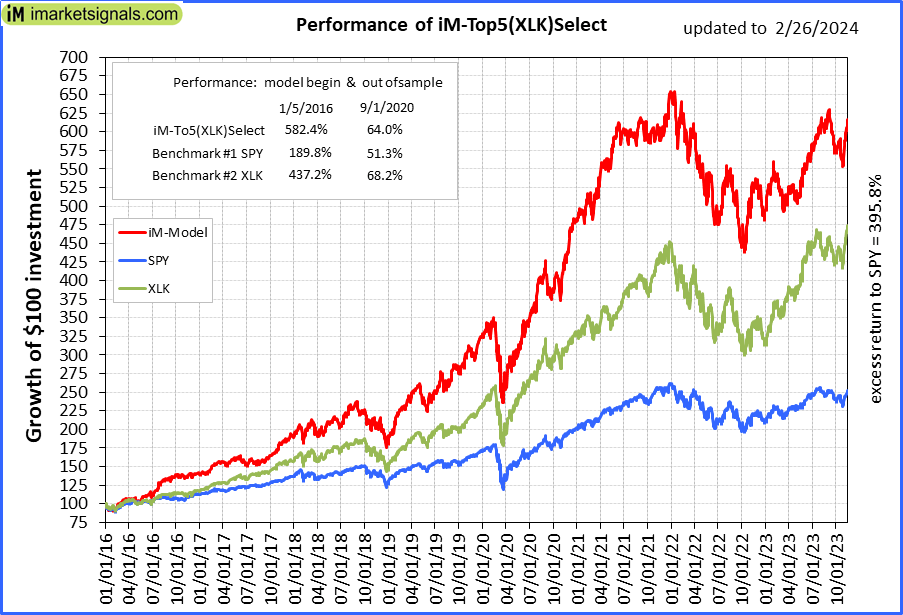 |
iM-Top5(XLK)Select: Since inception, on 1/5/2016, the model gained 581.56% while the benchmark SPY gained 185.78% over the same period. Over the previous week the market value of iM-Top5(XLK)Select gained 1.71% at a time when SPY gained 1.86%. A starting capital of $100,000 at inception on 1/5/2016 would have grown to $681,565 which includes $4,511 cash and excludes $2,085 spent on fees and slippage. |
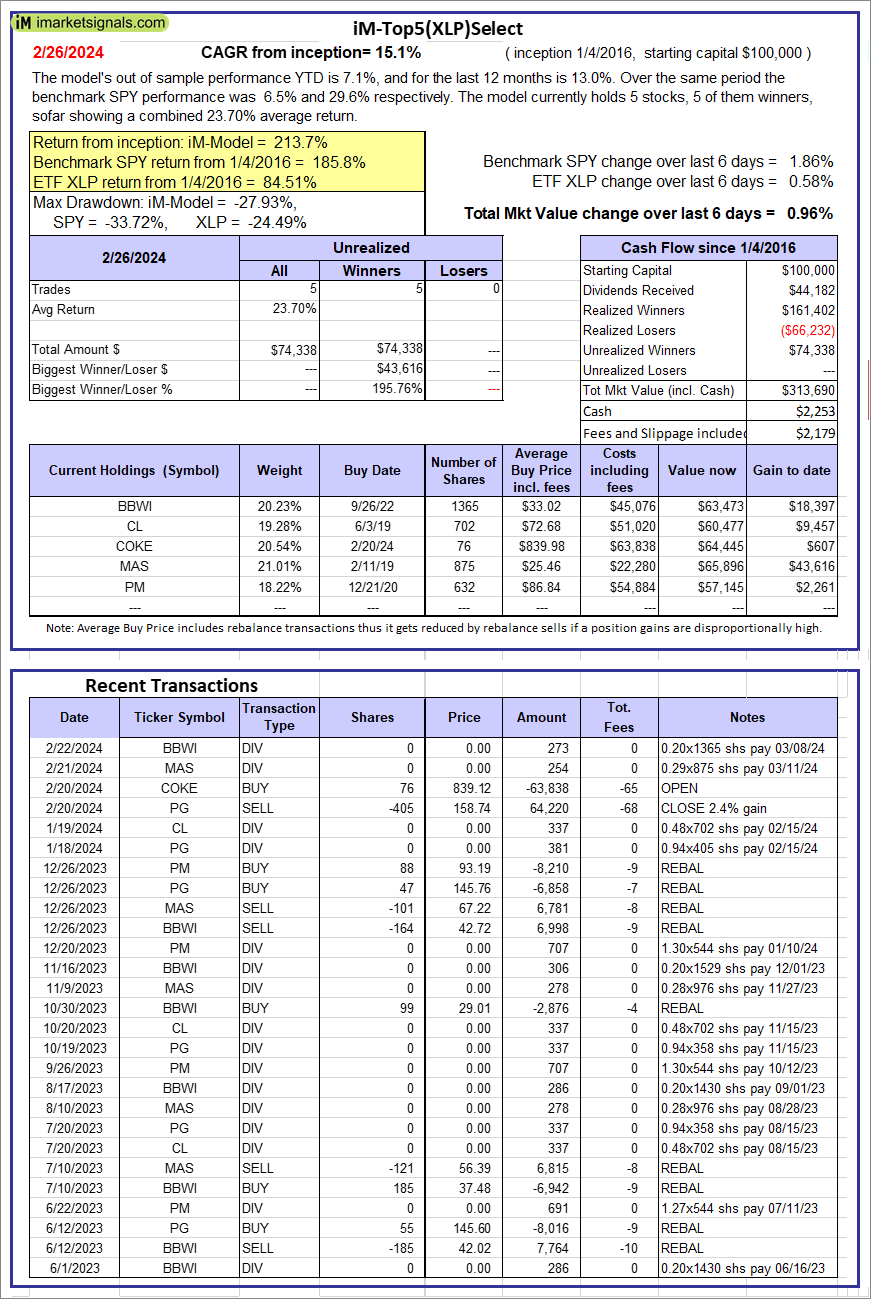 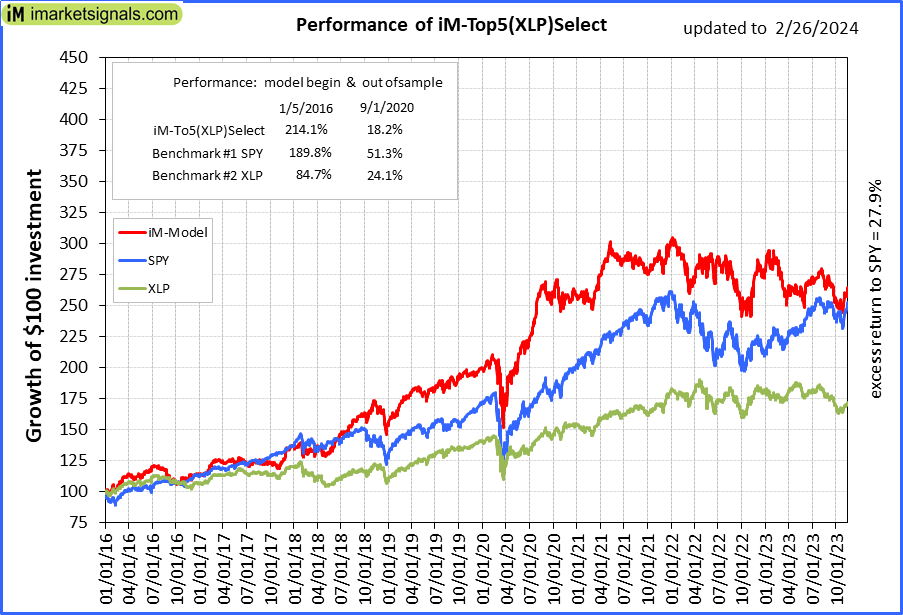 |
iM-Top5(XLP)Select: Since inception, on 1/5/2016, the model gained 213.69% while the benchmark SPY gained 185.78% over the same period. Over the previous week the market value of iM-Top5(XLP)Select gained 0.96% at a time when SPY gained 1.86%. A starting capital of $100,000 at inception on 1/5/2016 would have grown to $313,690 which includes $2,253 cash and excludes $2,179 spent on fees and slippage. |
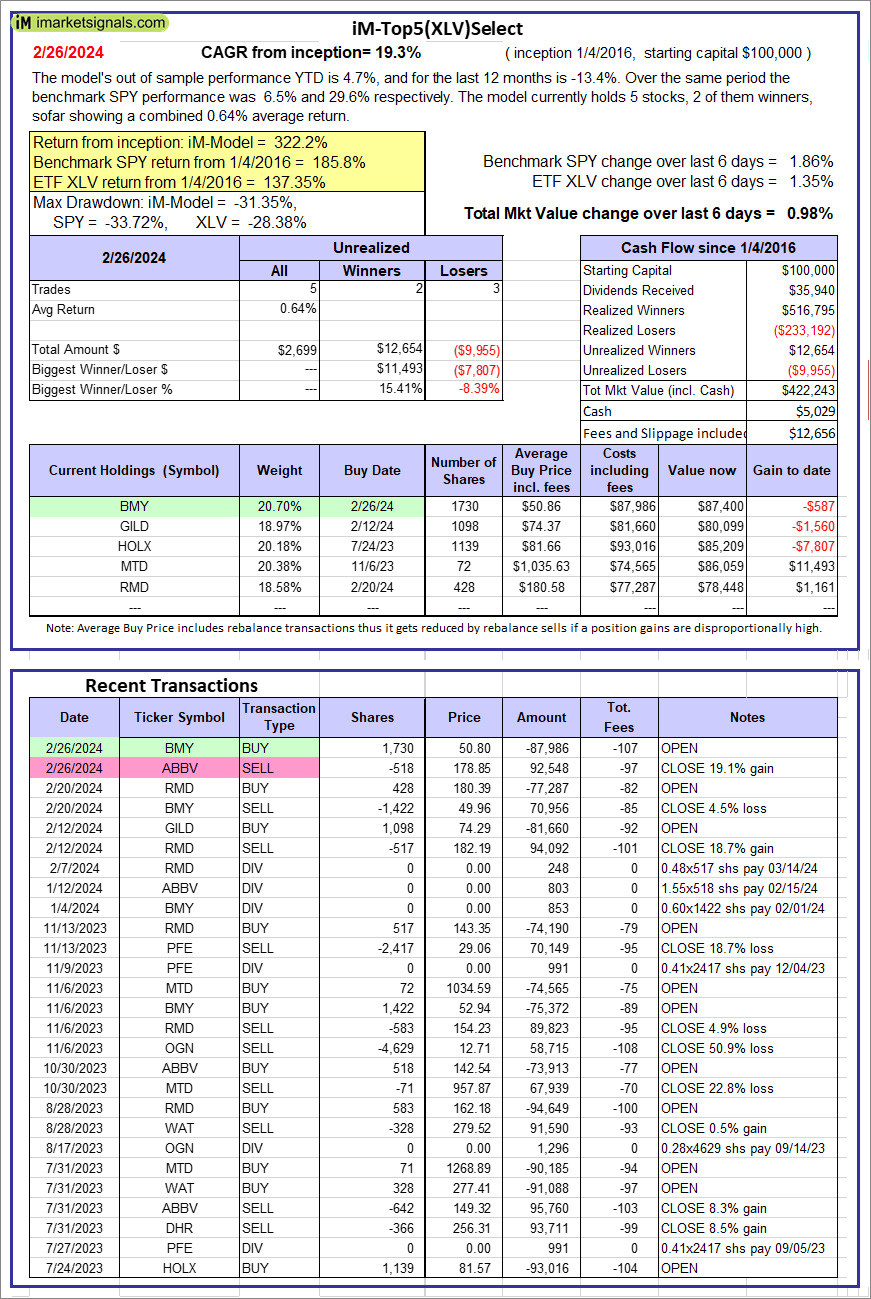 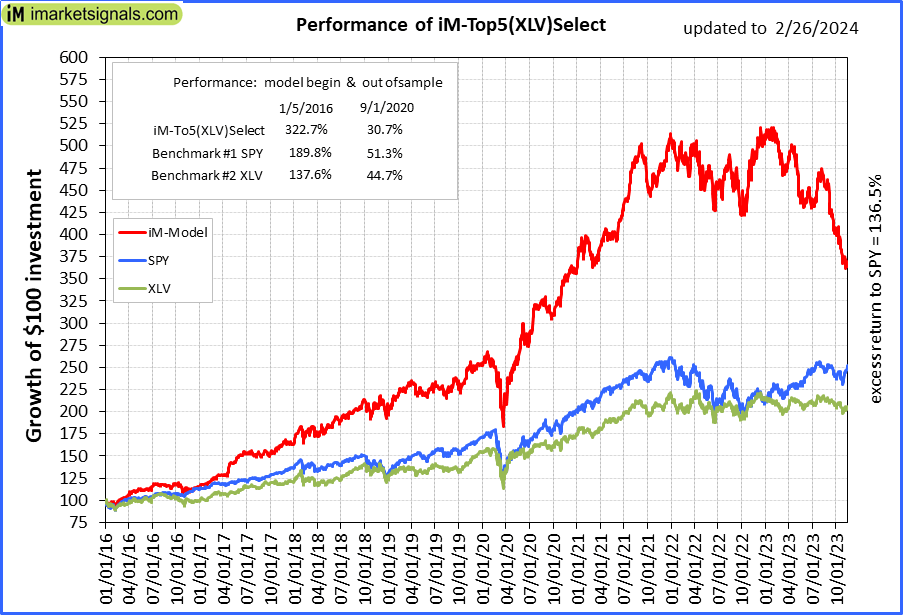 |
iM-Top5(XLV)Select: Since inception, on 1/5/2016, the model gained 322.24% while the benchmark SPY gained 185.78% over the same period. Over the previous week the market value of iM-Top5(XLV)Select gained 0.98% at a time when SPY gained 1.86%. A starting capital of $100,000 at inception on 1/5/2016 would have grown to $422,243 which includes $5,029 cash and excludes $12,656 spent on fees and slippage. |
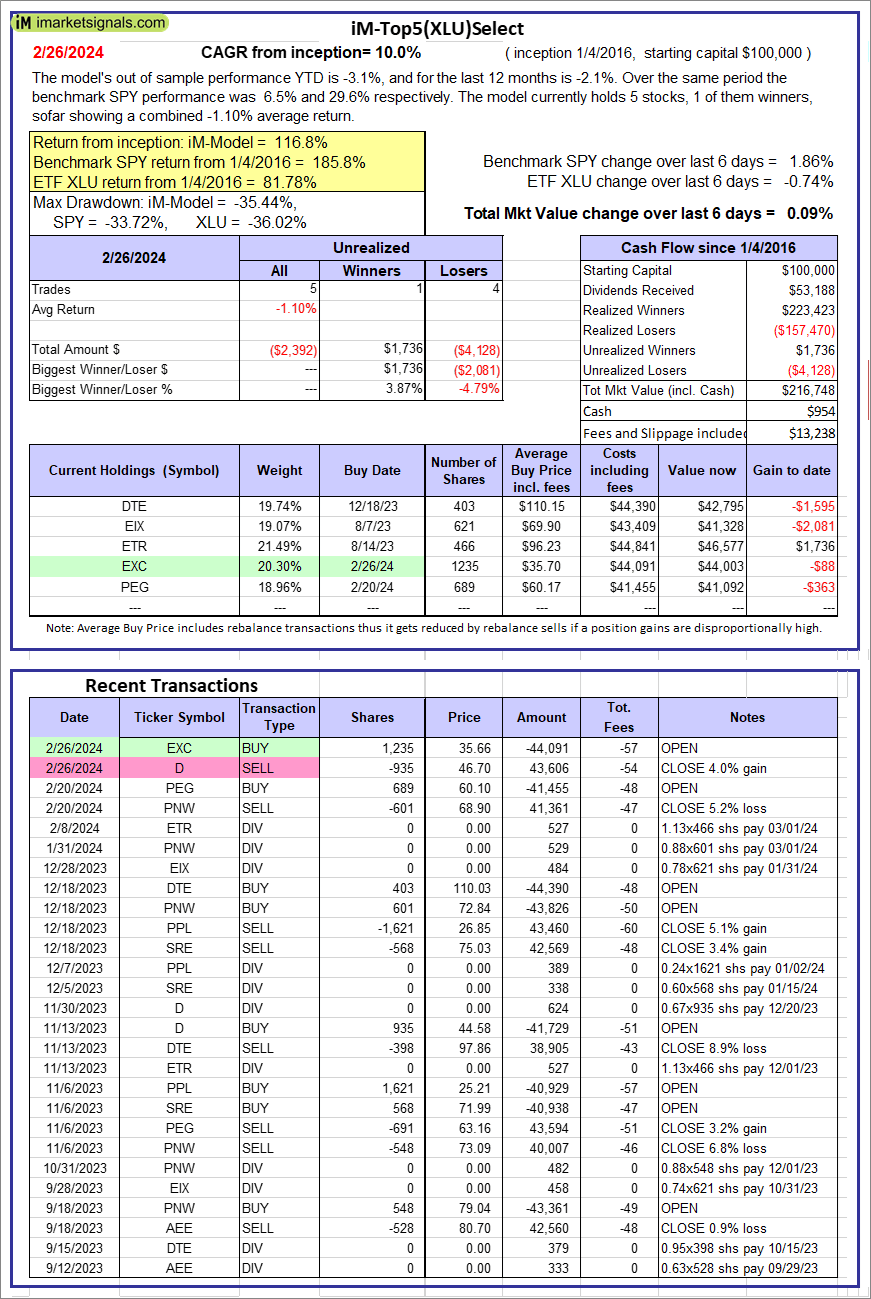 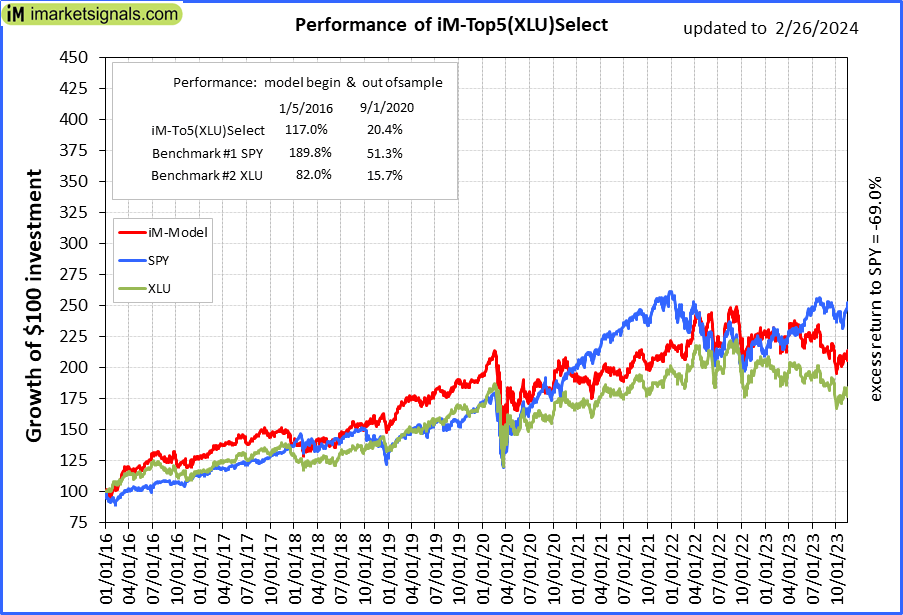 |
iM-Top5(XLU)Select: Since inception, on 1/5/2016, the model gained 116.75% while the benchmark SPY gained 185.78% over the same period. Over the previous week the market value of iM-Top5(XLU)Select gained 0.09% at a time when SPY gained 1.86%. A starting capital of $100,000 at inception on 1/5/2016 would have grown to $216,748 which includes $954 cash and excludes $13,238 spent on fees and slippage. |
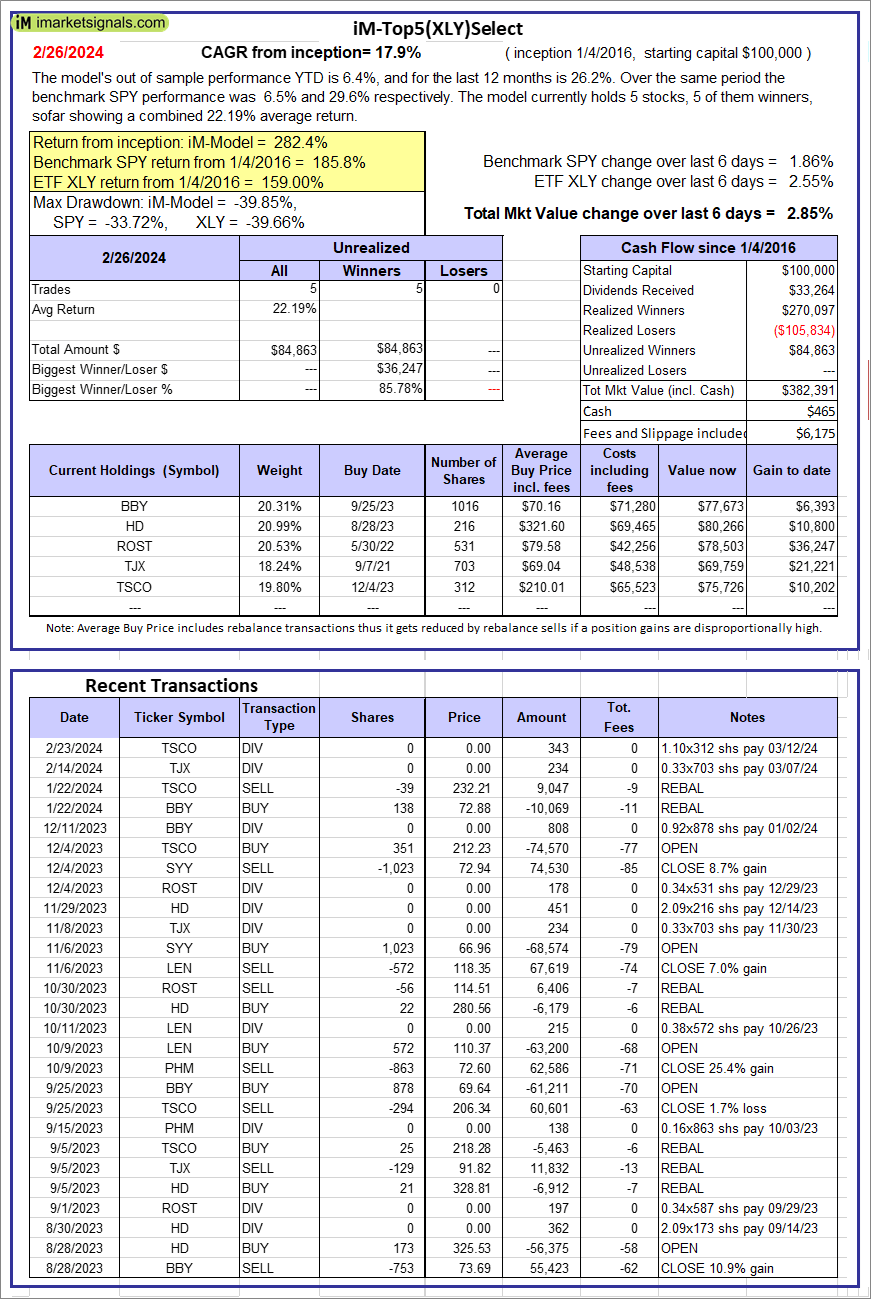 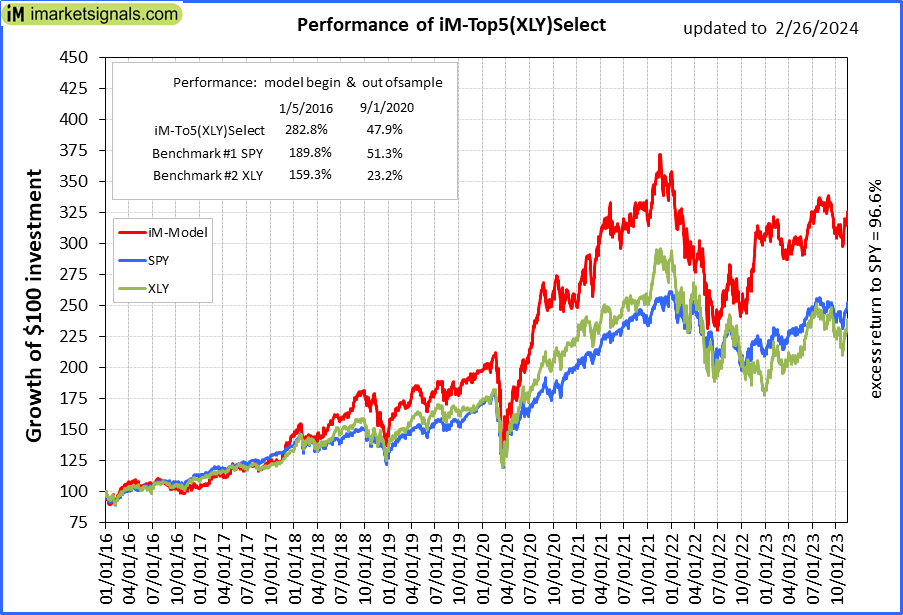 |
iM-Top5(XLY)Select: Since inception, on 1/5/2016, the model gained 282.39% while the benchmark SPY gained 185.78% over the same period. Over the previous week the market value of iM-Top5(XLY)Select gained 2.85% at a time when SPY gained 1.86%. A starting capital of $100,000 at inception on 1/5/2016 would have grown to $382,391 which includes $465 cash and excludes $6,175 spent on fees and slippage. |
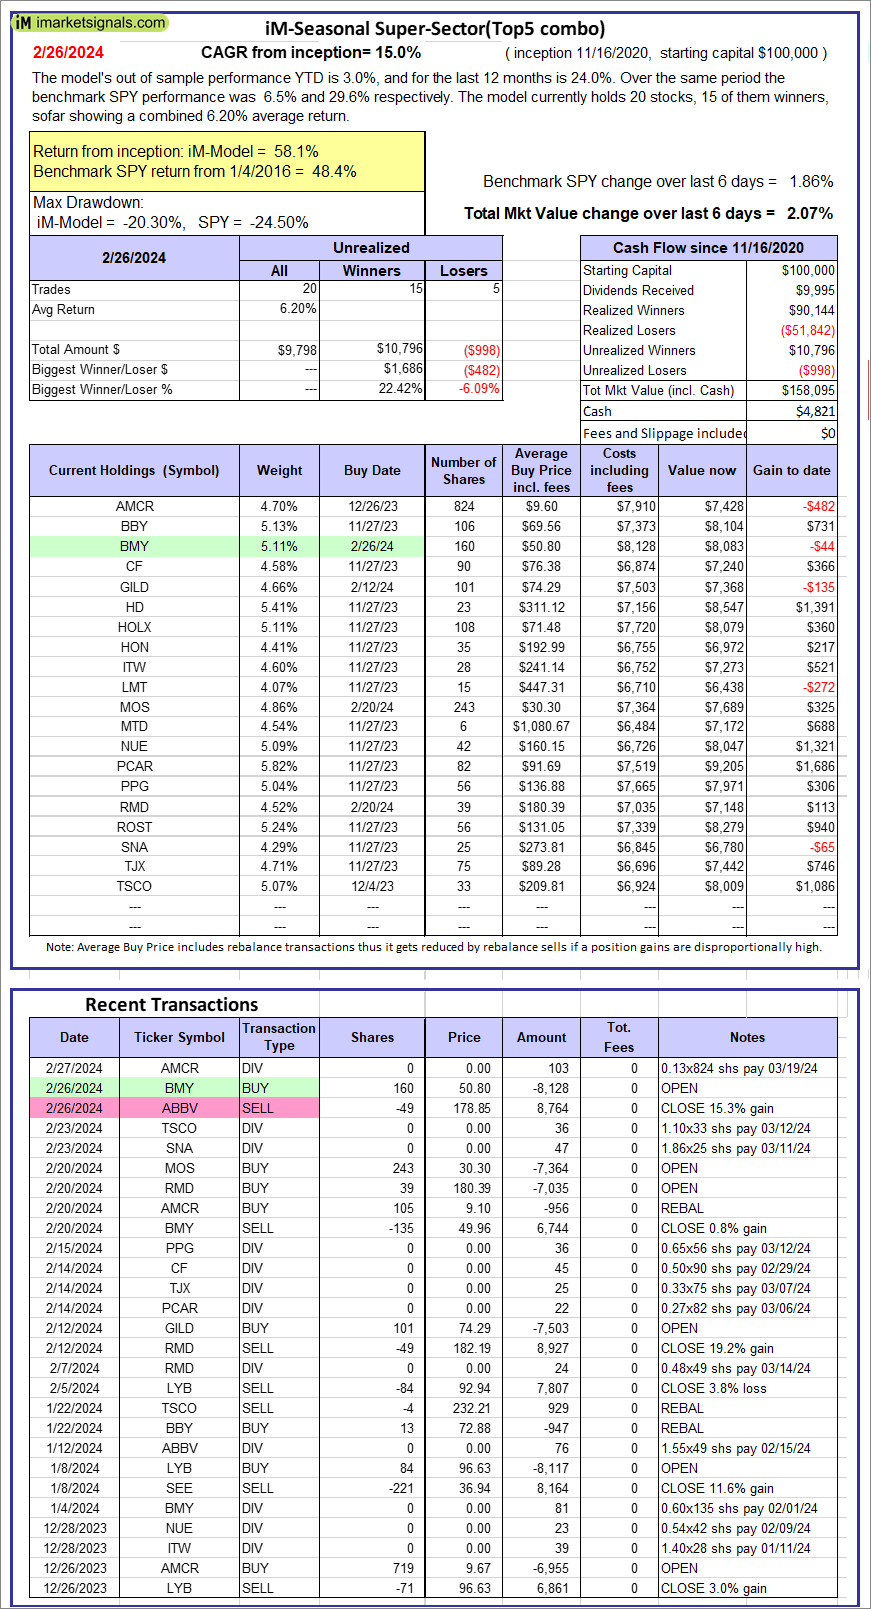 |
iM-Seasonal Super-Sectors (Top5 combo) : Since inception, on 11/17/2020, the model gained 58.09% while the benchmark SPY gained 48.35% over the same period. Over the previous week the market value of iM-Seasonal Super-Sectors (Top5 combo) gained 2.07% at a time when SPY gained 1.86%. A starting capital of $100,000 at inception on 11/17/2020 would have grown to $158,095 which includes $4,821 cash and excludes $00 spent on fees and slippage. |
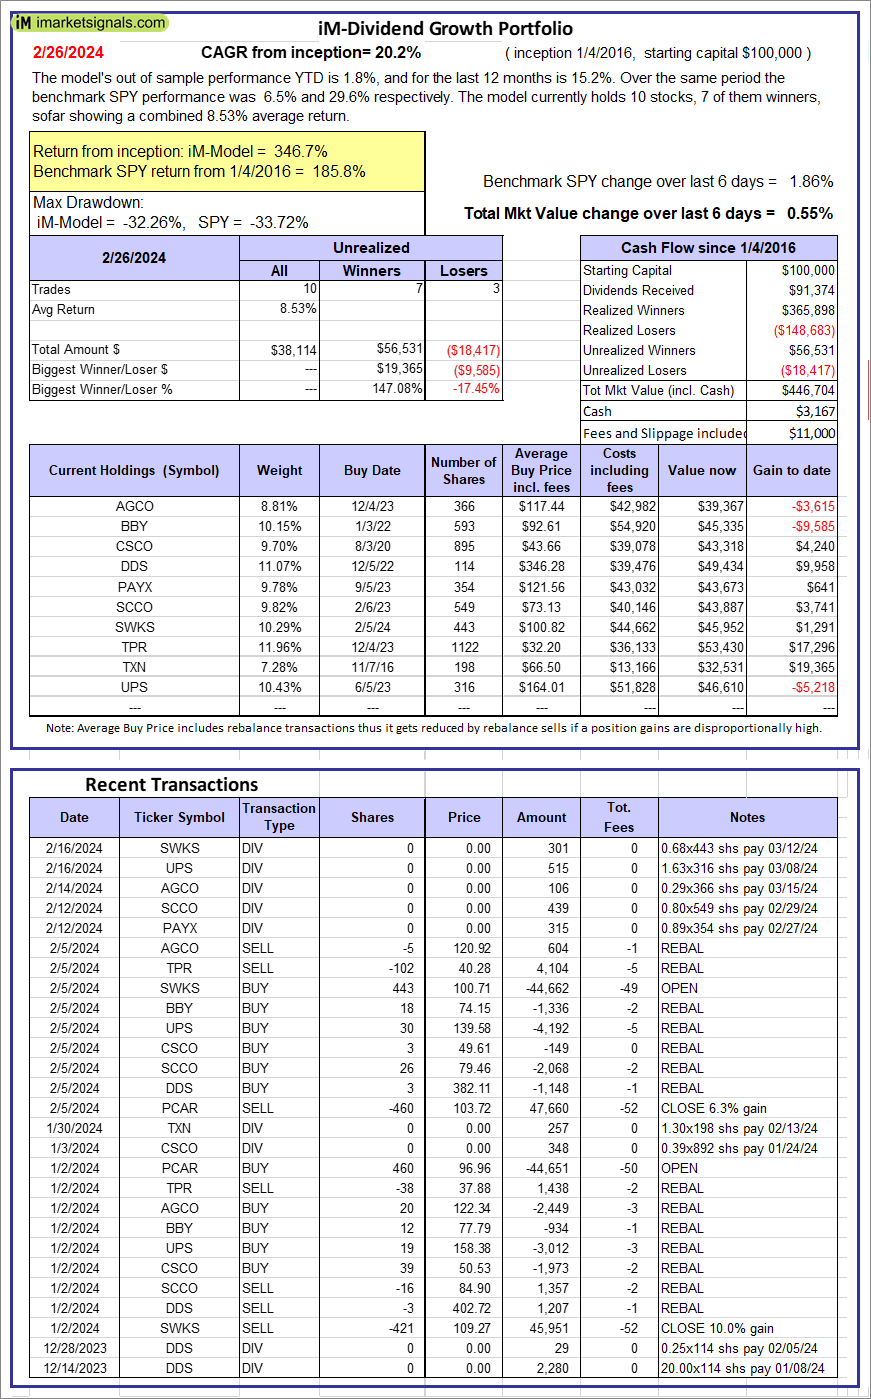 |
iM-Dividend Growth Portfolio: The model’s out of sample performance YTD is 1.8%, and for the last 12 months is 15.2%. Over the same period the benchmark SPY performance was 6.5% and 29.6% respectively. Over the previous week the market value of the iM-Dividend Growth Portfolio gained 0.55% at a time when SPY gained 1.86%. A starting capital of $100,000 at inception on 6/30/2016 would have grown to $446,704 which includes $3,167 cash and excludes $11,000 spent on fees and slippage. |
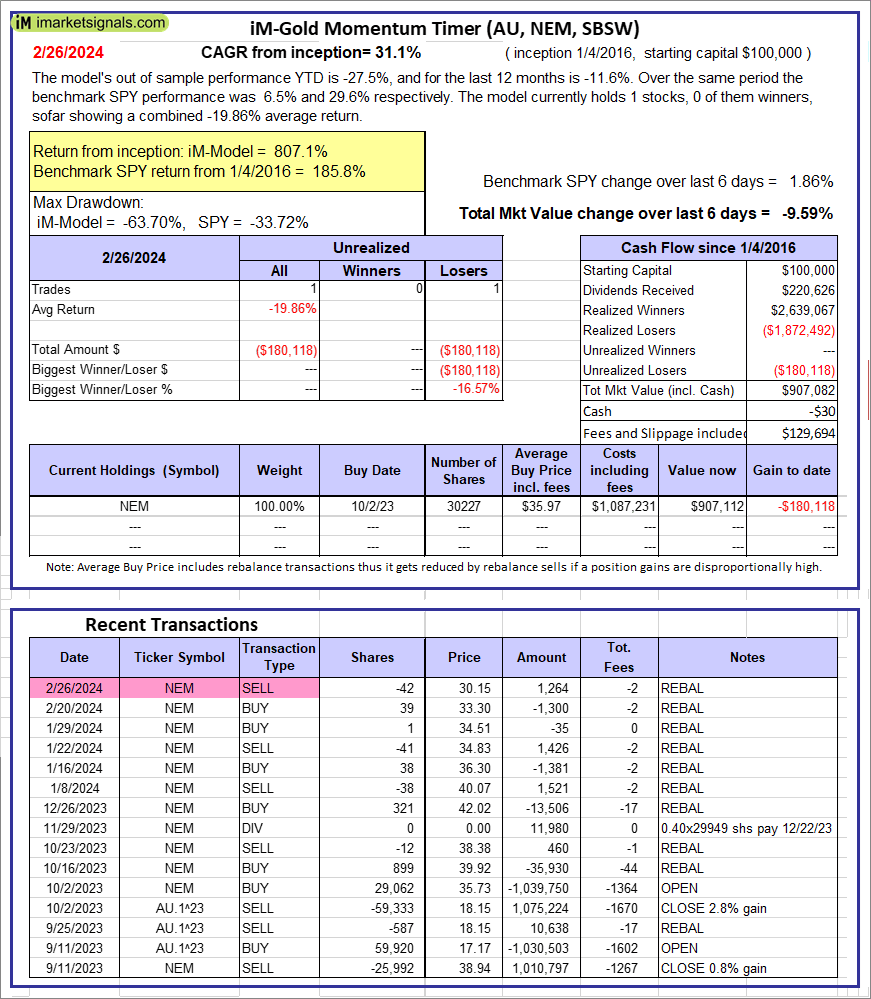 |
iM-Gold Momentum Timer (AU, NEM, SBSW): The model’s out of sample performance YTD is -27.5%, and for the last 12 months is -11.6%. Over the same period the benchmark SPY performance was 6.5% and 29.6% respectively. Over the previous week the market value of iM-Gold Momentum Timer (AU, NEM, SBSW) gained -9.59% at a time when SPY gained 1.86%. A starting capital of $100,000 at inception on 6/30/2016 would have grown to -$30 which includes $129,694 cash and excludes Gain to date spent on fees and slippage. |
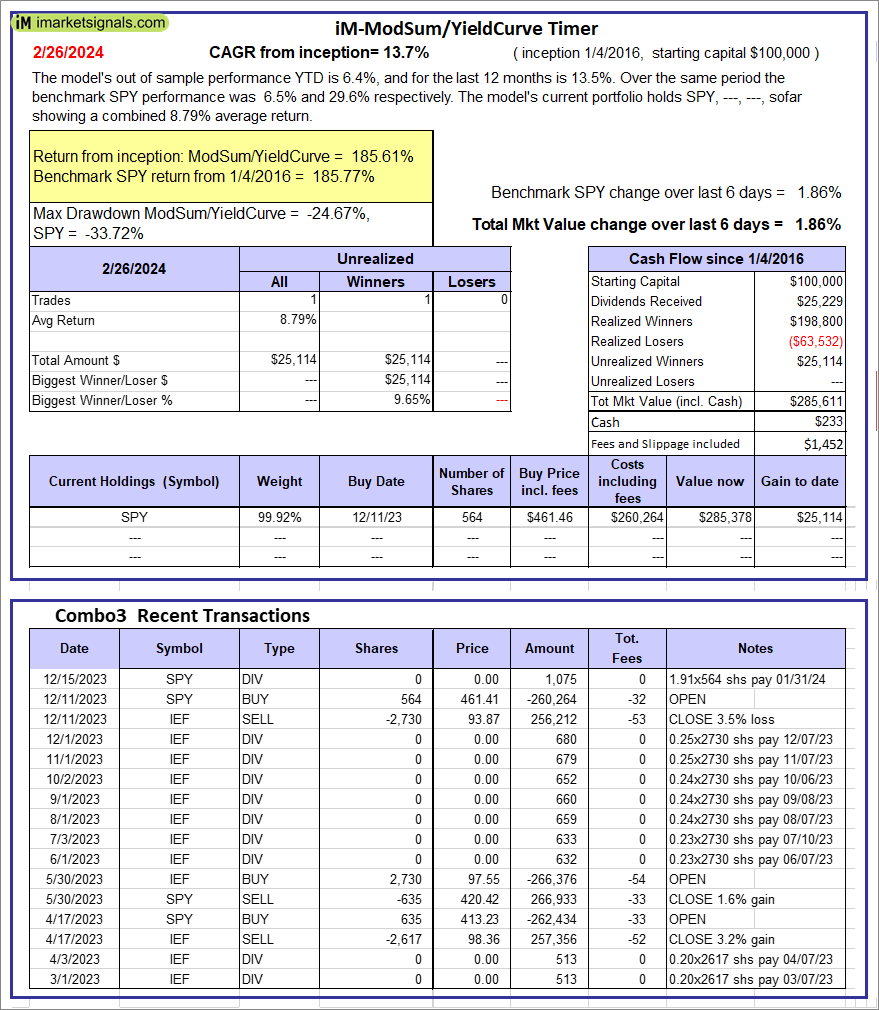 |
iM-ModSum/YieldCurve Timer: The model’s out of sample performance YTD is 6.4%, and for the last 12 months is 13.5%. Over the same period the benchmark SPY performance was 6.5% and 29.6% respectively. Over the previous week the market value of iM-PortSum/YieldCurve Timer gained 1.86% at a time when SPY gained 1.86%. A starting capital of $100,000 at inception on 1/1/2016 would have grown to $285,611 which includes $233 cash and excludes $1,452 spent on fees and slippage. |
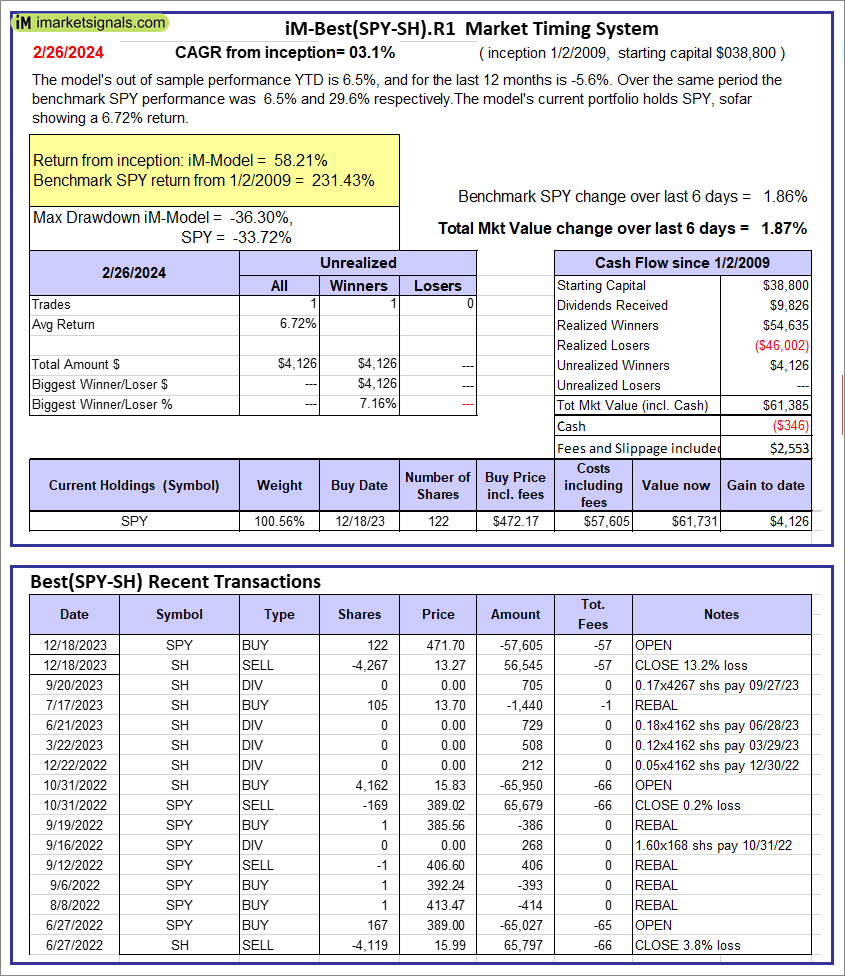 |
iM-Best(SPY-SH).R1: The model’s out of sample performance YTD is 6.5%, and for the last 12 months is -5.6%. Over the same period the benchmark SPY performance was 6.5% and 29.6% respectively. Over the previous week the market value of Best(SPY-SH) gained 1.87% at a time when SPY gained 1.86%. A starting capital of $100,000 at inception on 1/2/2009 would have grown to $61,385 which includes -$346 cash and excludes $2,553 spent on fees and slippage. |
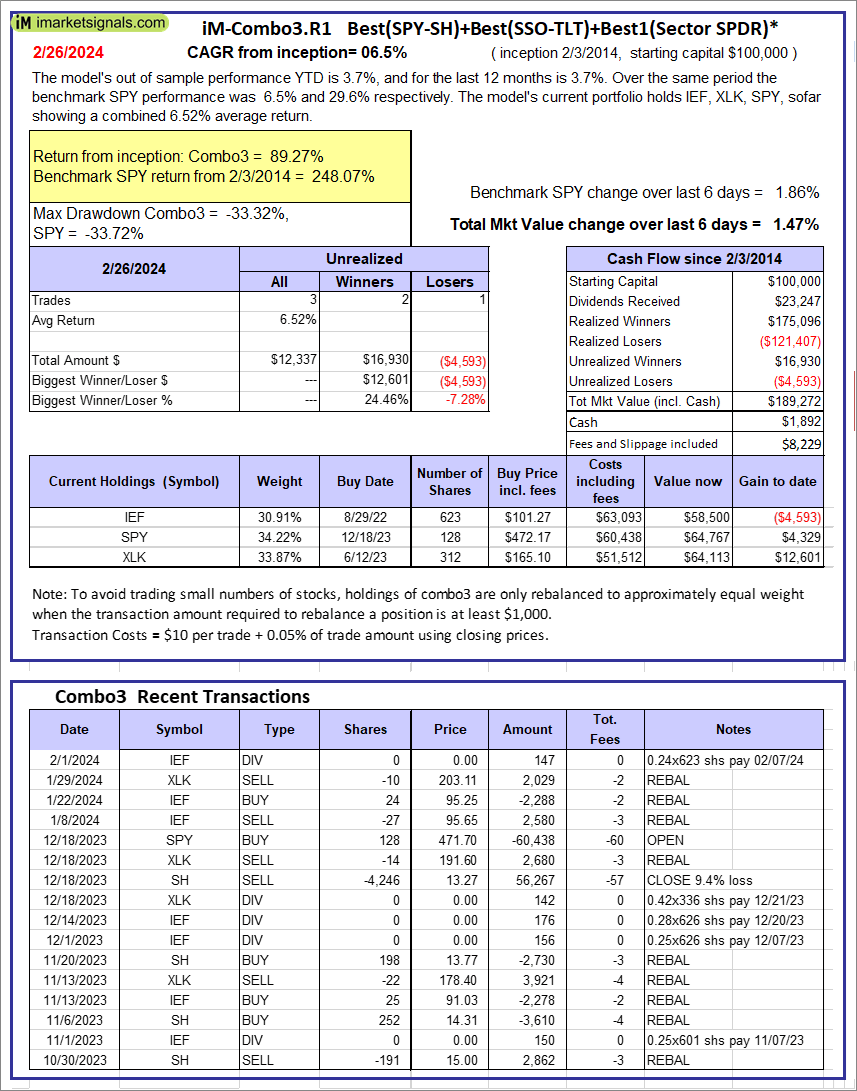 |
iM-Combo3.R1: The model’s out of sample performance YTD is 3.7%, and for the last 12 months is 3.7%. Over the same period the benchmark SPY performance was 6.5% and 29.6% respectively. Over the previous week the market value of iM-Combo3.R1 gained 1.47% at a time when SPY gained 1.86%. A starting capital of $100,000 at inception on 2/3/2014 would have grown to $189,272 which includes $1,892 cash and excludes $8,229 spent on fees and slippage. |
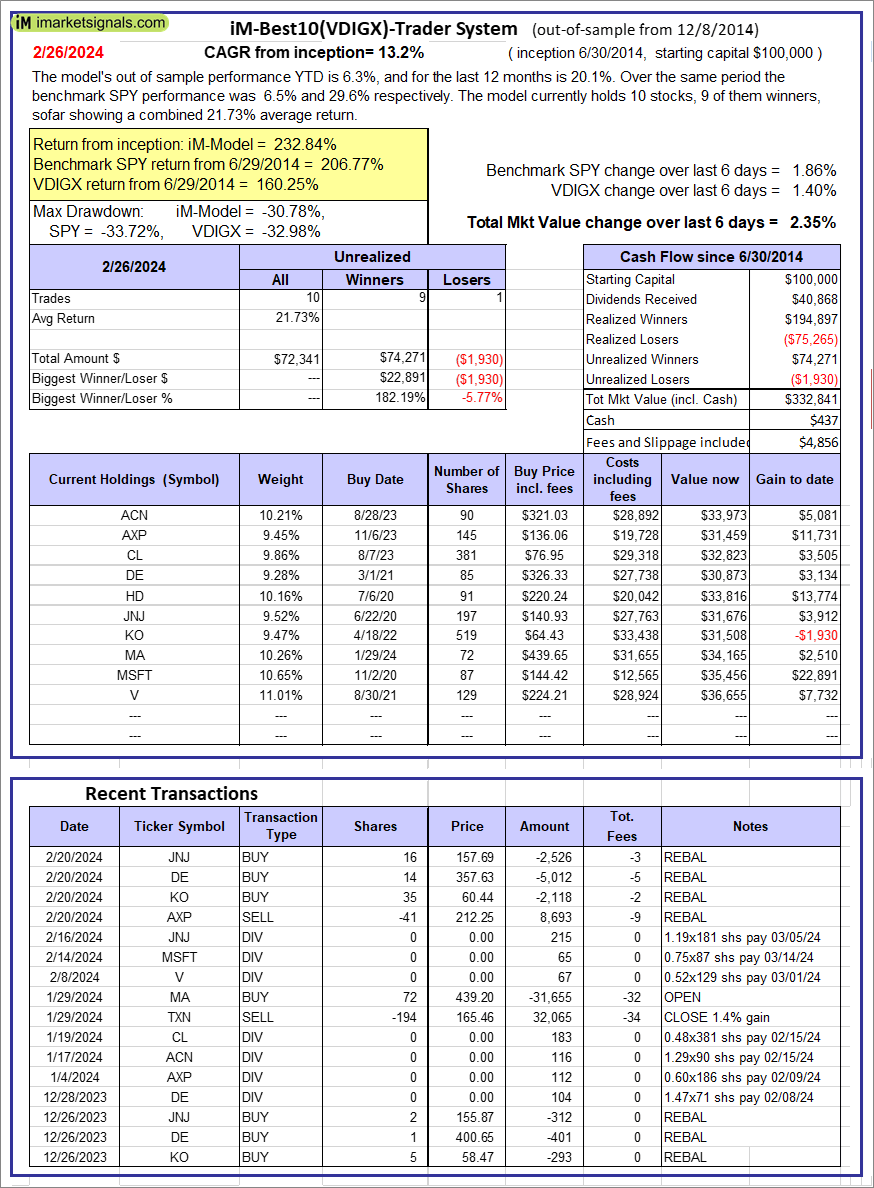 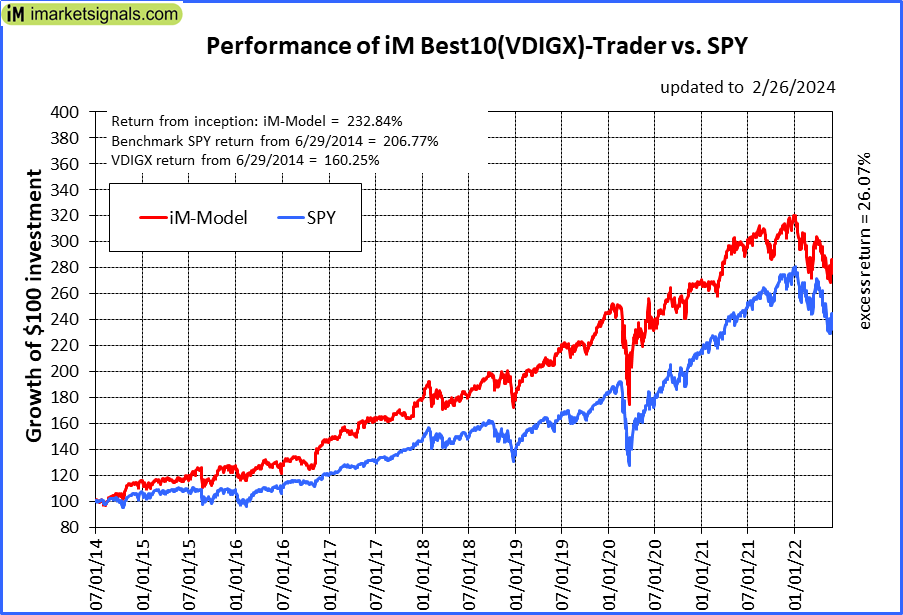 |
iM-Best10(VDIGX)-Trader: The model’s out of sample performance YTD is 6.3%, and for the last 12 months is 20.1%. Over the same period the benchmark SPY performance was 6.5% and 29.6% respectively. Since inception, on 7/1/2014, the model gained 232.84% while the benchmark SPY gained 206.77% and VDIGX gained 160.25% over the same period. Over the previous week the market value of iM-Best10(VDIGX) gained 2.35% at a time when SPY gained 1.86%. A starting capital of $100,000 at inception on 7/1/2014 would have grown to $332,841 which includes $437 cash and excludes $4,856 spent on fees and slippage. |
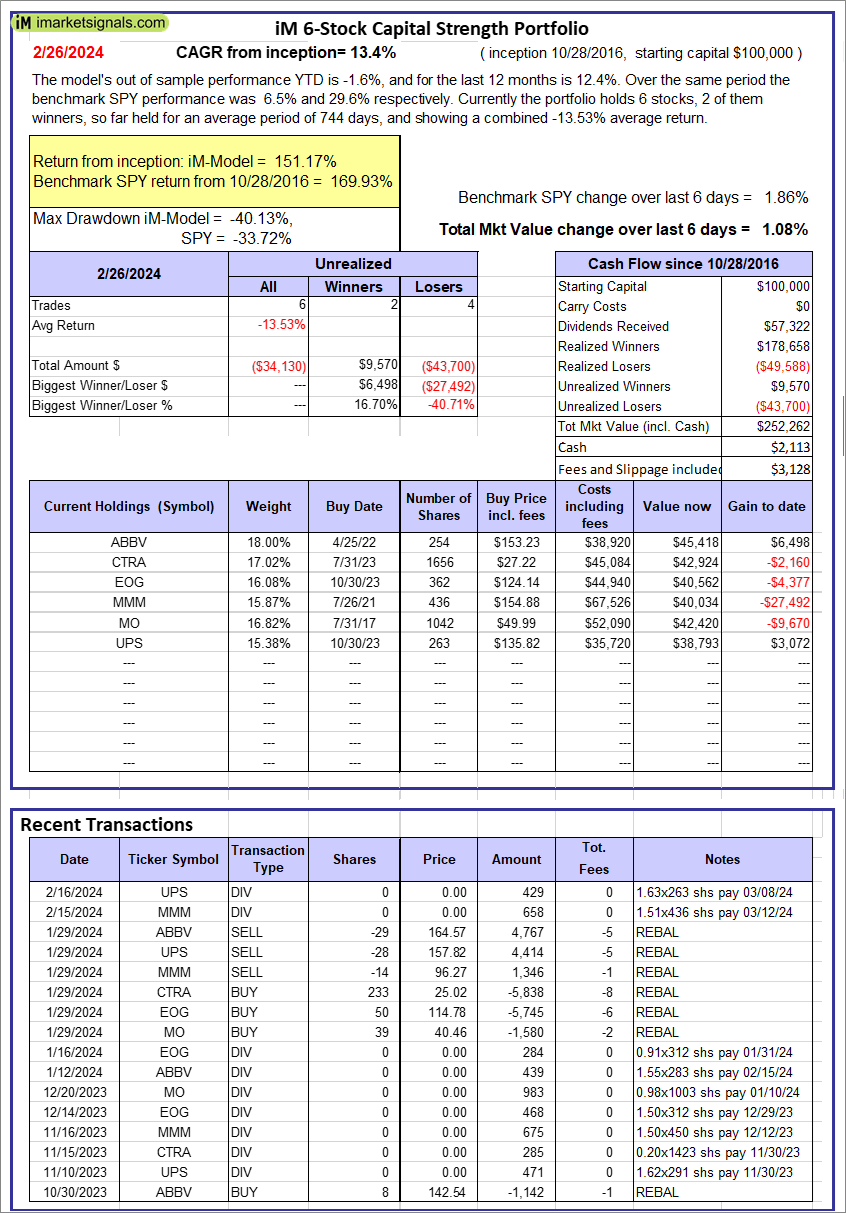 |
iM 6-Stock Capital Strength Portfolio: The model’s out of sample performance YTD is -1.6%, and for the last 12 months is 12.4%. Over the same period the benchmark SPY performance was 6.5% and 29.6% respectively. Over the previous week the market value of the iM 6-Stock Capital Strength Portfolio gained 1.08% at a time when SPY gained 1.86%. A starting capital of $100,000 at inception on 10/28/2016 would have grown to $252,262 which includes $2,113 cash and excludes $3,128 spent on fees and slippage. |
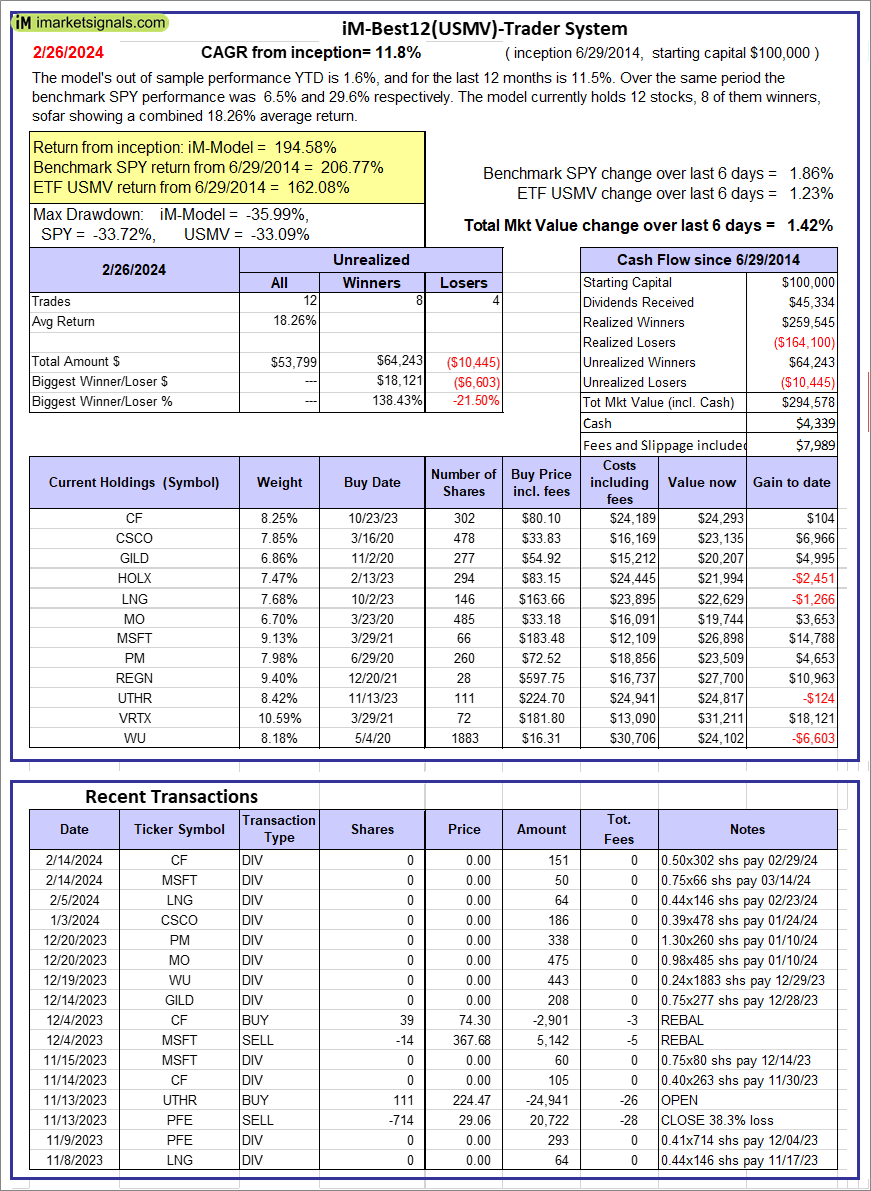 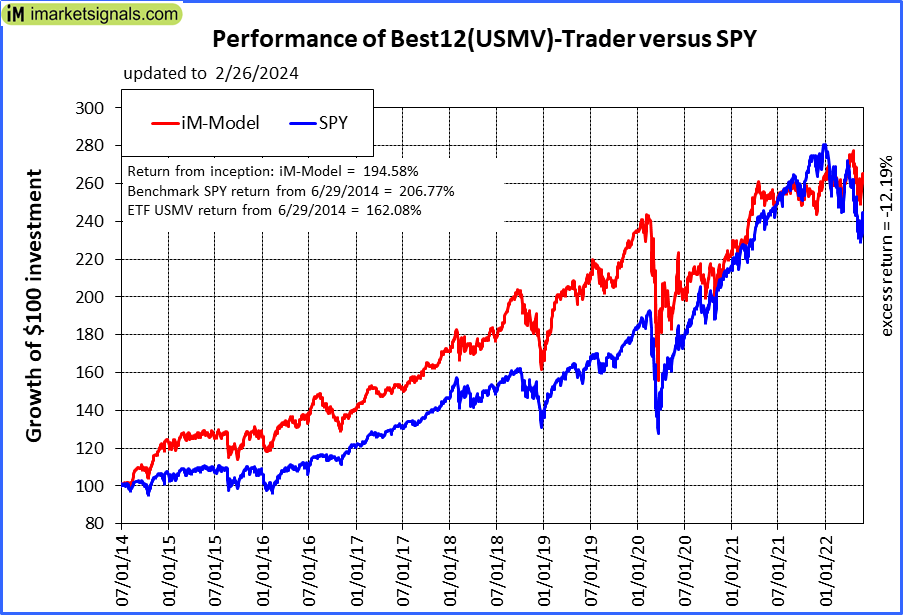 |
iM-Best12(USMV)-Trader: The model’s out of sample performance YTD is 1.6%, and for the last 12 months is 11.5%. Over the same period the benchmark SPY performance was 6.5% and 29.6% respectively. Since inception, on 6/30/2014, the model gained 194.58% while the benchmark SPY gained 206.77% and the ETF USMV gained 162.08% over the same period. Over the previous week the market value of iM-Best12(USMV)-Trader gained 1.42% at a time when SPY gained 1.86%. A starting capital of $100,000 at inception on 6/30/2014 would have grown to $294,578 which includes $4,339 cash and excludes $7,989 spent on fees and slippage. |
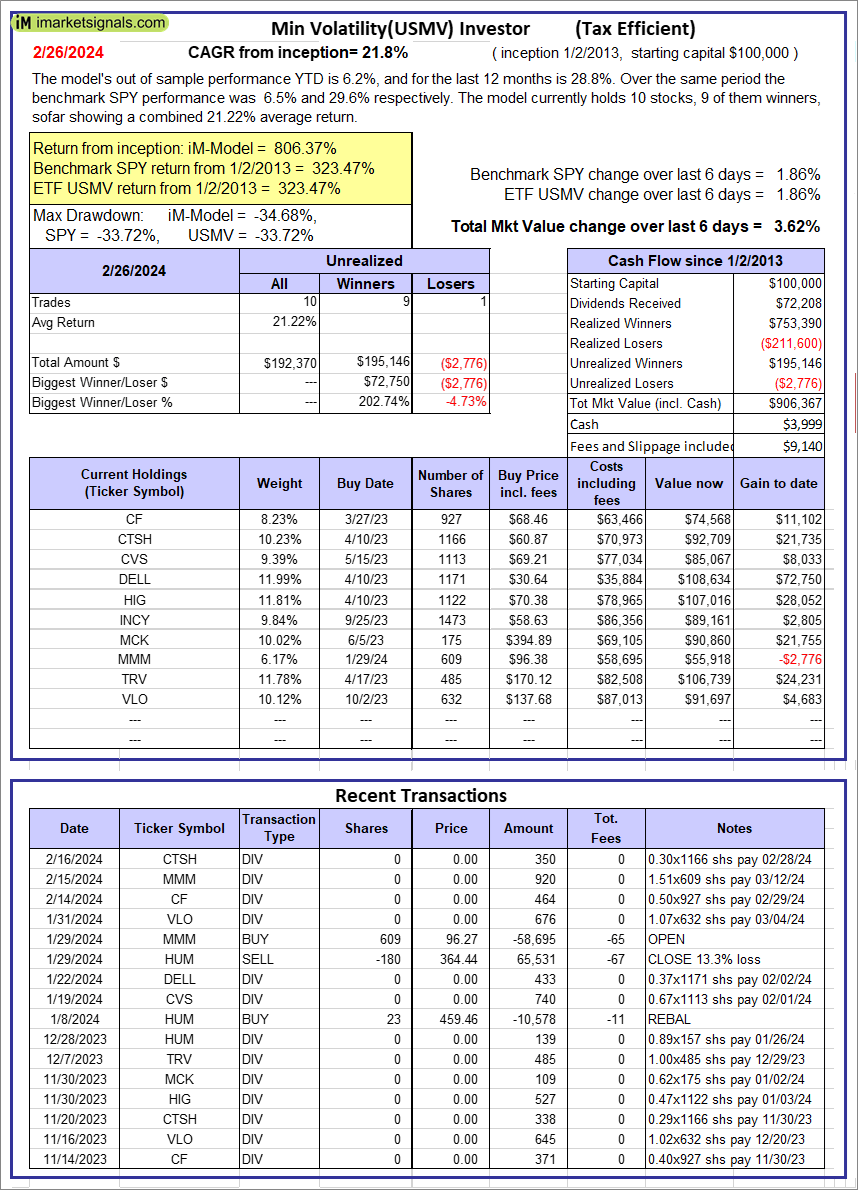 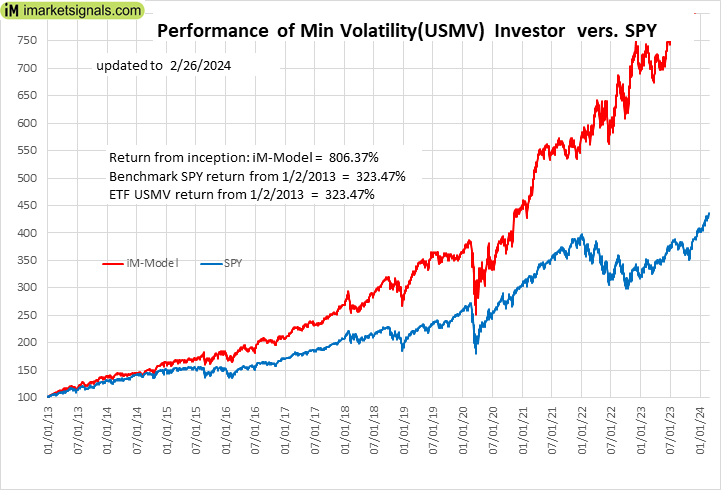 |
iM-Min Volatility(USMV) Investor (Tax Efficient): The model’s out of sample performance YTD is 6.2%, and for the last 12 months is 28.8%. Over the same period the benchmark SPY performance was 6.5% and 29.6% respectively. Since inception, on 1/3/2013, the model gained 806.37% while the benchmark SPY gained 323.47% and the ETF USMV gained 323.47% over the same period. Over the previous week the market value of iM-Best12(USMV)Q1 gained 3.62% at a time when SPY gained 1.86%. A starting capital of $100,000 at inception on 1/3/2013 would have grown to $906,367 which includes $3,999 cash and excludes $9,140 spent on fees and slippage. |
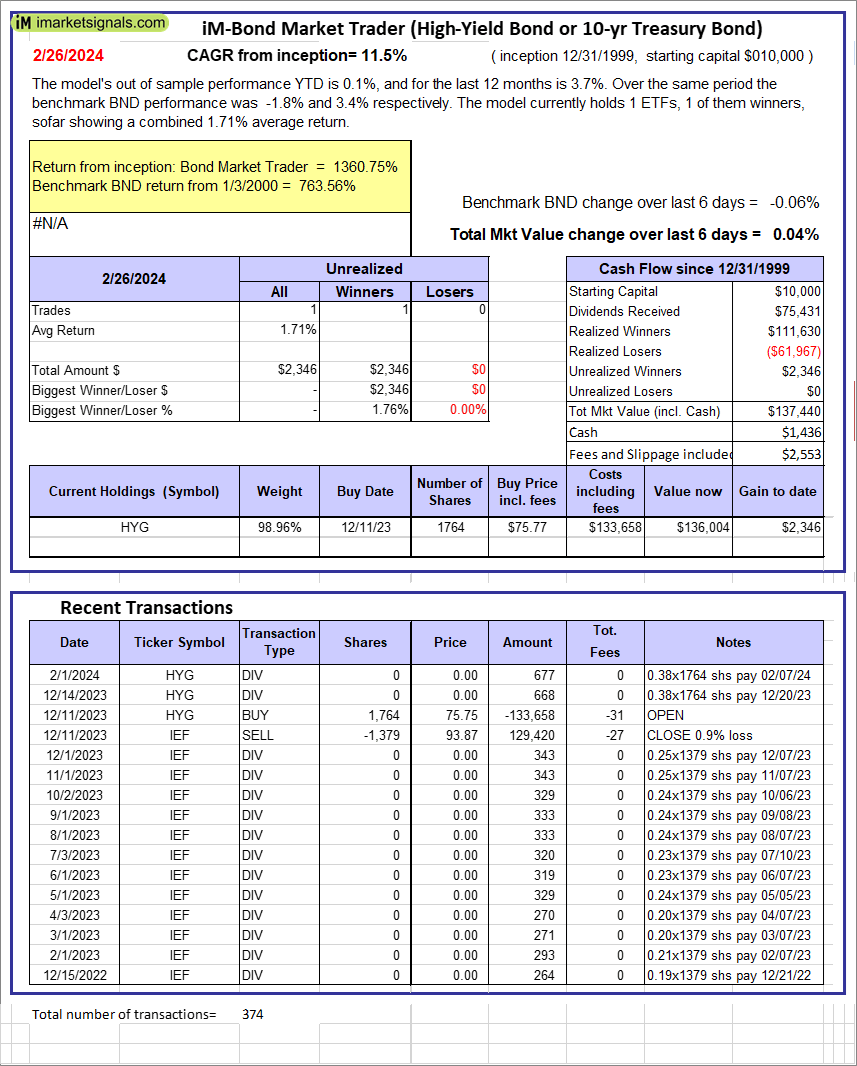 |
iM-Bond Market Trader (High-Yield Bond or 10-yr Treasury Bond): The model’s out of sample performance YTD is 0.1%, and for the last 12 months is 3.7%. Over the same period the benchmark BND performance was -1.8% and 3.4% respectively. Over the previous week the market value of the iM-Bond Market Trader (High-Yield Bond or 10-yr Treasury Bond) gained 0.04% at a time when BND gained -0.06%. A starting capital of $10,000 at inception on 1/3/2000 would have grown to $137,440 which includes $1,436 cash and excludes $2,553 spent on fees and slippage. |
|
|
iM-ModSum/YieldCurve Timer: The model’s out of sample performance YTD is 6.4%, and for the last 12 months is 13.5%. Over the same period the benchmark SPY performance was 6.5% and 29.6% respectively. Over the previous week the market value of iM-PortSum/YieldCurve Timer gained 1.86% at a time when SPY gained 1.86%. A starting capital of $100,000 at inception on 1/1/2016 would have grown to $285,611 which includes $233 cash and excludes $1,452 spent on fees and slippage. |
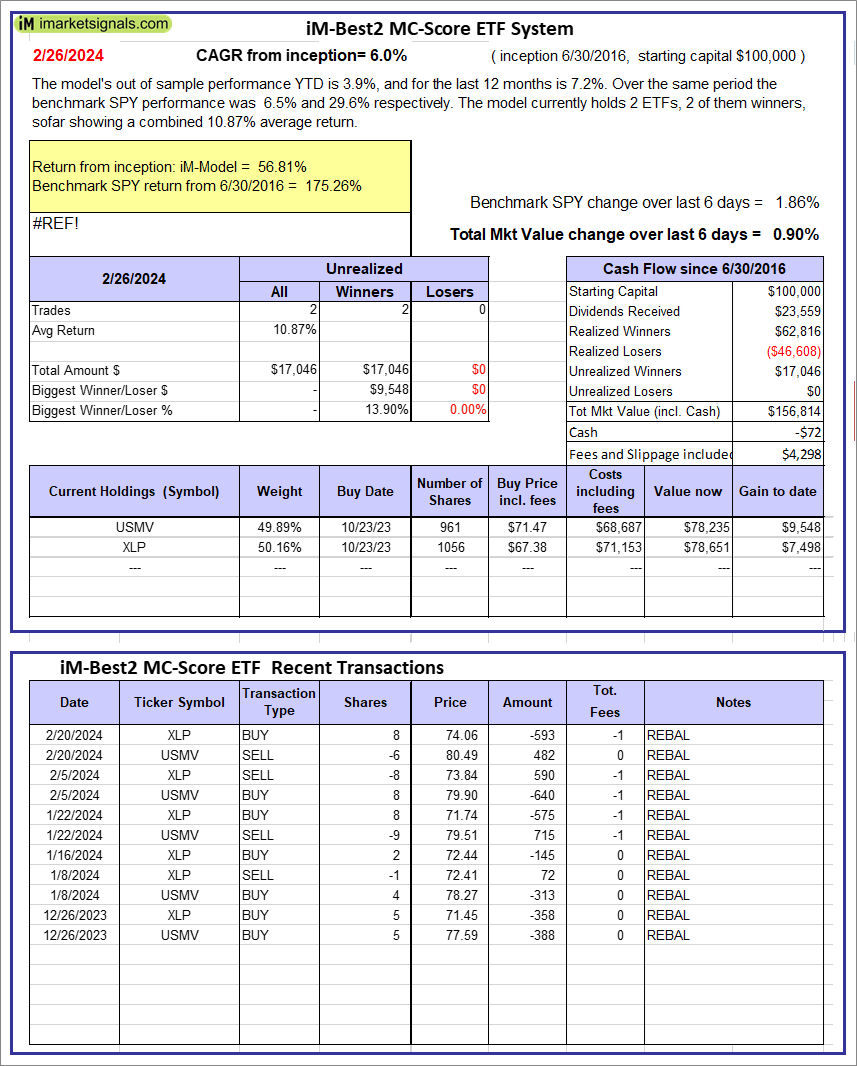 |
iM-Best2 MC-Score ETF System: The model’s out of sample performance YTD is 3.9%, and for the last 12 months is 7.2%. Over the same period the benchmark SPY performance was 6.5% and 29.6% respectively. Over the previous week the market value of the iM-Best2 MC-Score ETF System gained 0.90% at a time when SPY gained 1.86%. A starting capital of $100,000 at inception on 6/30/2016 would have grown to $156,814 which includes -$72 cash and excludes $4,298 spent on fees and slippage. |
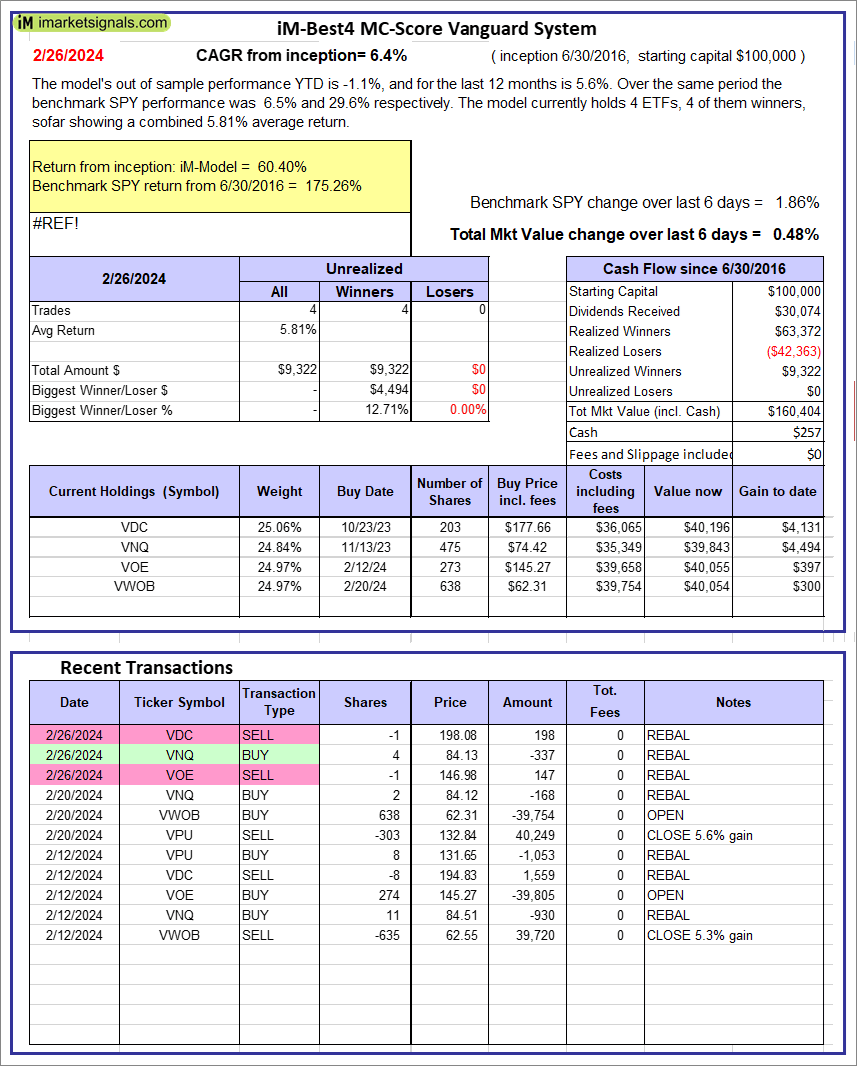 |
iM-Best4 MC-Score Vanguard System: The model’s out of sample performance YTD is -1.1%, and for the last 12 months is 5.6%. Over the same period the benchmark SPY performance was 6.5% and 29.6% respectively. Over the previous week the market value of the iM-Best4 MC-Score Vanguard System gained 0.48% at a time when SPY gained 1.86%. A starting capital of $100,000 at inception on 6/30/2016 would have grown to $160,404 which includes $257 cash and excludes $00 spent on fees and slippage. |
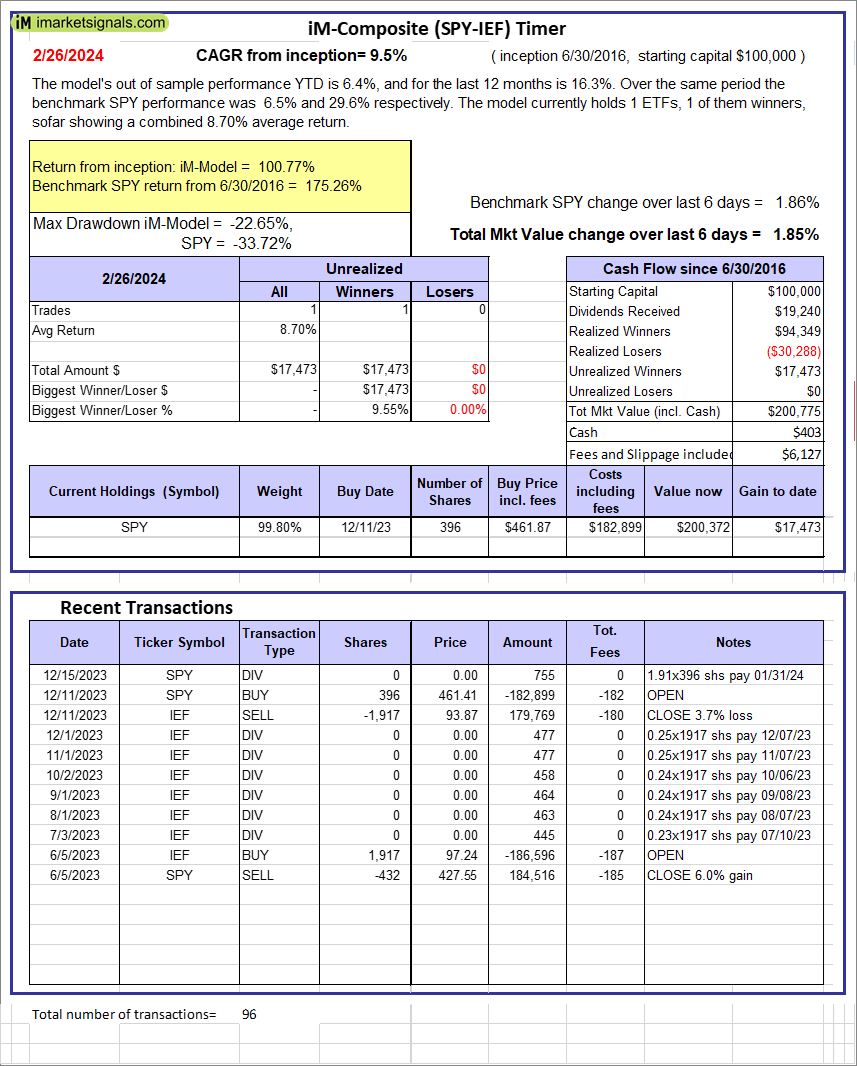 |
iM-Composite (SPY-IEF) Timer: The model’s out of sample performance YTD is 6.4%, and for the last 12 months is 16.3%. Over the same period the benchmark SPY performance was 6.5% and 29.6% respectively. Over the previous week the market value of the iM-Composite (SPY-IEF) Timer gained 1.85% at a time when SPY gained 1.86%. A starting capital of $100,000 at inception on 6/30/2016 would have grown to $200,775 which includes $403 cash and excludes $6,127 spent on fees and slippage. |
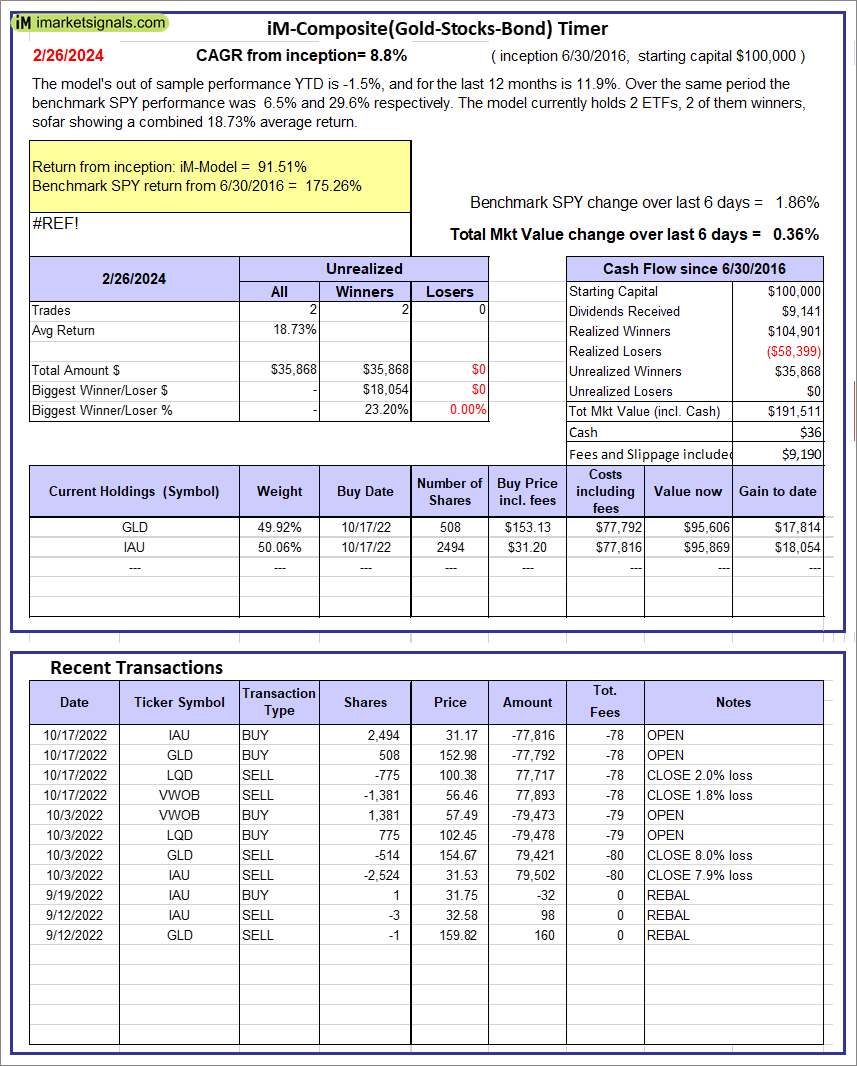 |
iM-Composite(Gold-Stocks-Bond) Timer: The model’s out of sample performance YTD is -1.5%, and for the last 12 months is 11.9%. Over the same period the benchmark SPY performance was 6.5% and 29.6% respectively. Over the previous week the market value of the iM-Composite(Gold-Stocks-Bond) Timer gained 0.36% at a time when SPY gained 1.86%. A starting capital of $100,000 at inception on 6/30/2016 would have grown to $191,511 which includes $36 cash and excludes $9,190 spent on fees and slippage. |
iM-Best Reports – 2/26/2024
Posted in pmp SPY-SH
Leave a Reply
You must be logged in to post a comment.