
  |
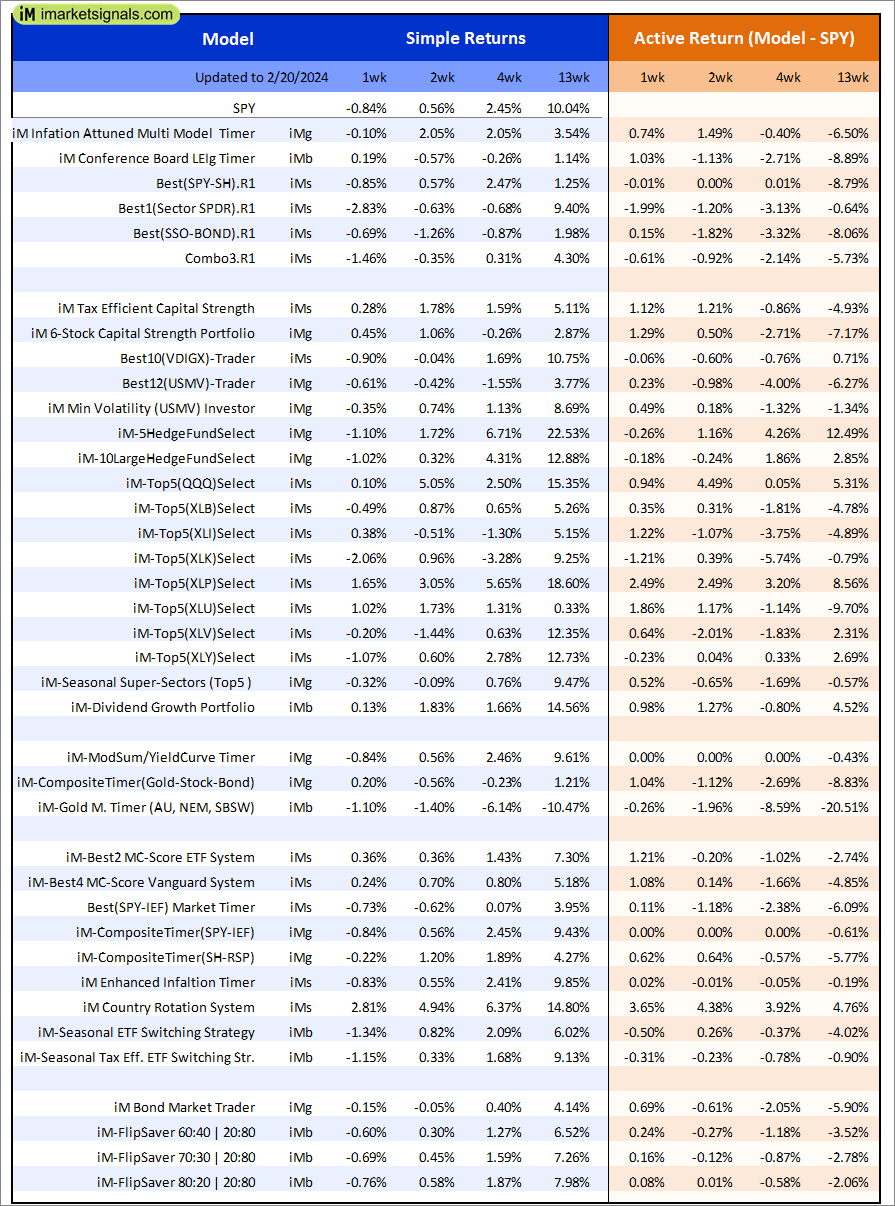
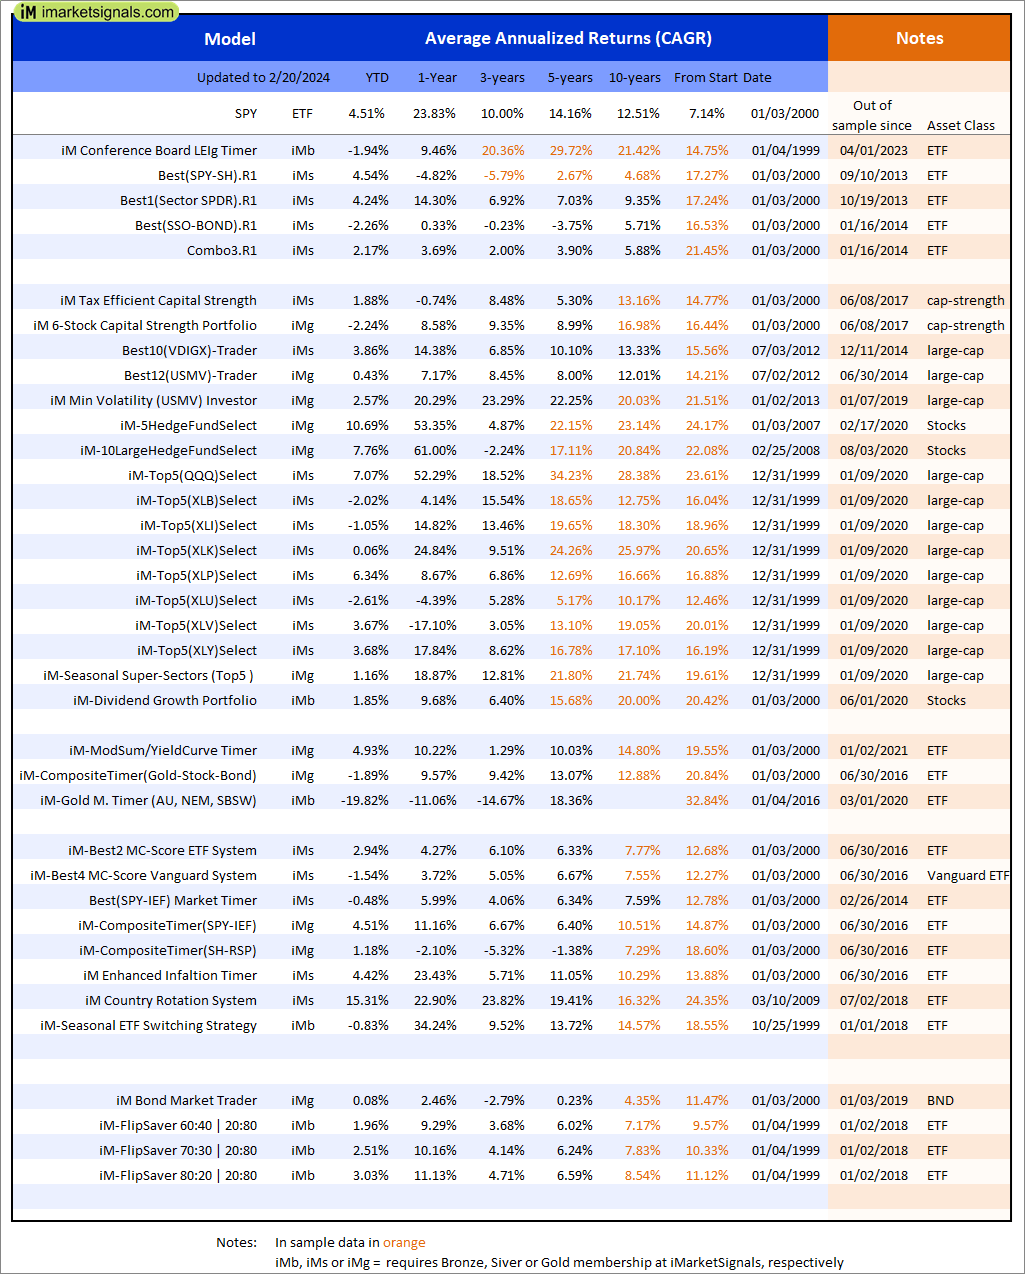
Out of sample performance summary of our models for the past 1, 2, 4 and 13 week periods. The active active return indicates how the models over- or underperformed the benchmark ETF SPY. Also the YTD, and the 1-, 3-, 5- and 10-year annualized returns are shown in the second table |
 |
iM-Inflation Attuned Multi-Model Market Timer: The model’s out of sample performance YTD is -2.1%, and for the last 12 months is -6.5%. Over the same period the benchmark SPY performance was 4.5% and 23.8% respectively. Over the previous week the market value of the iM-Inflation Attuned Multi-Model Market Timer gained -0.10% at a time when SPY gained -0.84%. A starting capital of $100,000 at inception on 3/24/2017 would have grown to $129,886,565 which includes $1,776,912 cash and excludes $2,691,375 spent on fees and slippage. |
 |
iM-Conference Board LEIg Timer: The model’s performance YTD is 14.3%, and for the last 12 months is 7.3%. Over the same period the benchmark SPY performance was 20.1% and 9.4% respectively. Over the previous week the market value of the iM-Conference Board LEIg Timer gained 0.26% at a time when SPY gained -0.84%. A starting capital of $100,000 at inception on 4/5/2017 would have grown to $530,718 which includes $608 cash and excludes $763 spent on fees and slippage. |
 |
iM-FlipSaver 60:40 | 20:80 – 2017: The model’s out of sample performance YTD is 2.0%, and for the last 12 months is 9.2%. Over the same period the benchmark E60B40 performance was 2.0% and 15.1% respectively. Over the previous week the market value of iM-FlipSaver 80:20 | 20:80 gained -0.61% at a time when SPY gained -0.67%. A starting capital of $100,000 at inception on 7/16/2015 would have grown to $157,980 which includes $515 cash and excludes $3,553 spent on fees and slippage. |
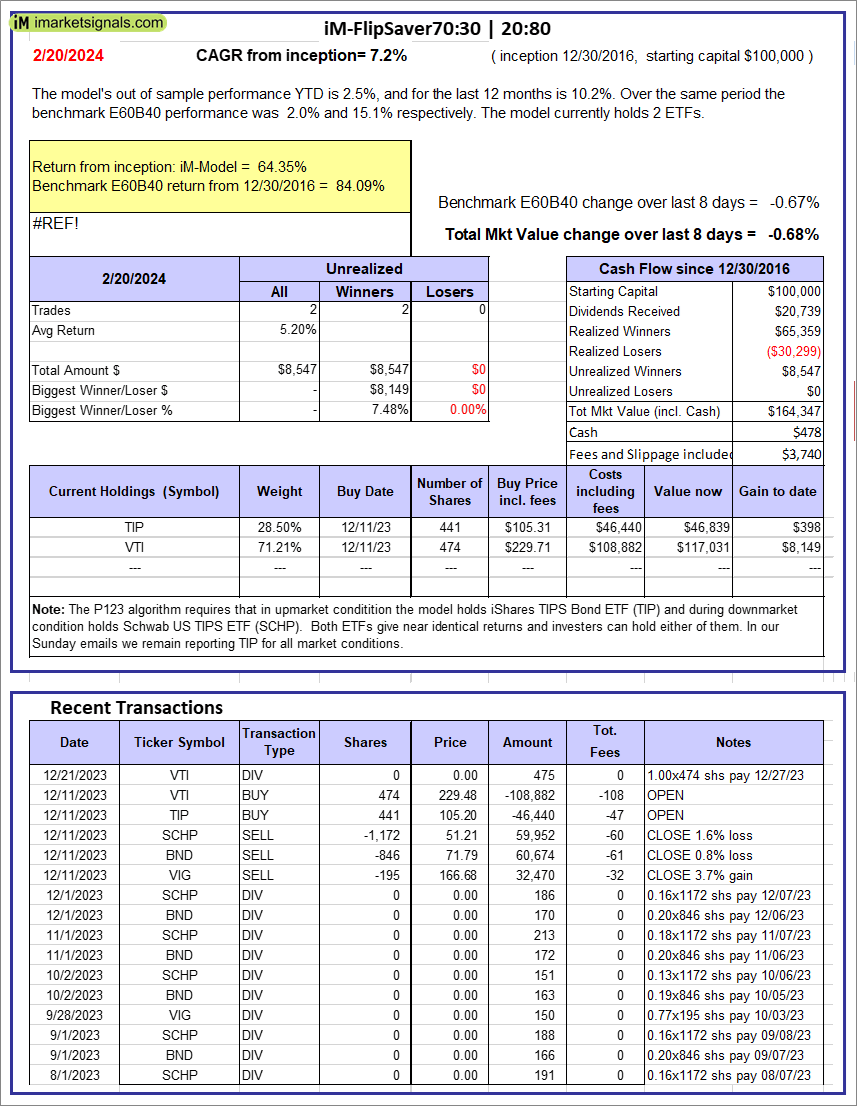 |
iM-FlipSaver 70:30 | 20:80 – 2017: The model’s out of sample performance YTD is 2.5%, and for the last 12 months is 10.2%. Over the same period the benchmark E60B40 performance was 2.0% and 15.1% respectively. Over the previous week the market value of iM-FlipSaver 70:30 | 20:80 gained -0.68% at a time when SPY gained -0.67%. A starting capital of $100,000 at inception on 7/15/2015 would have grown to $164,347 which includes $478 cash and excludes $3,740 spent on fees and slippage. |
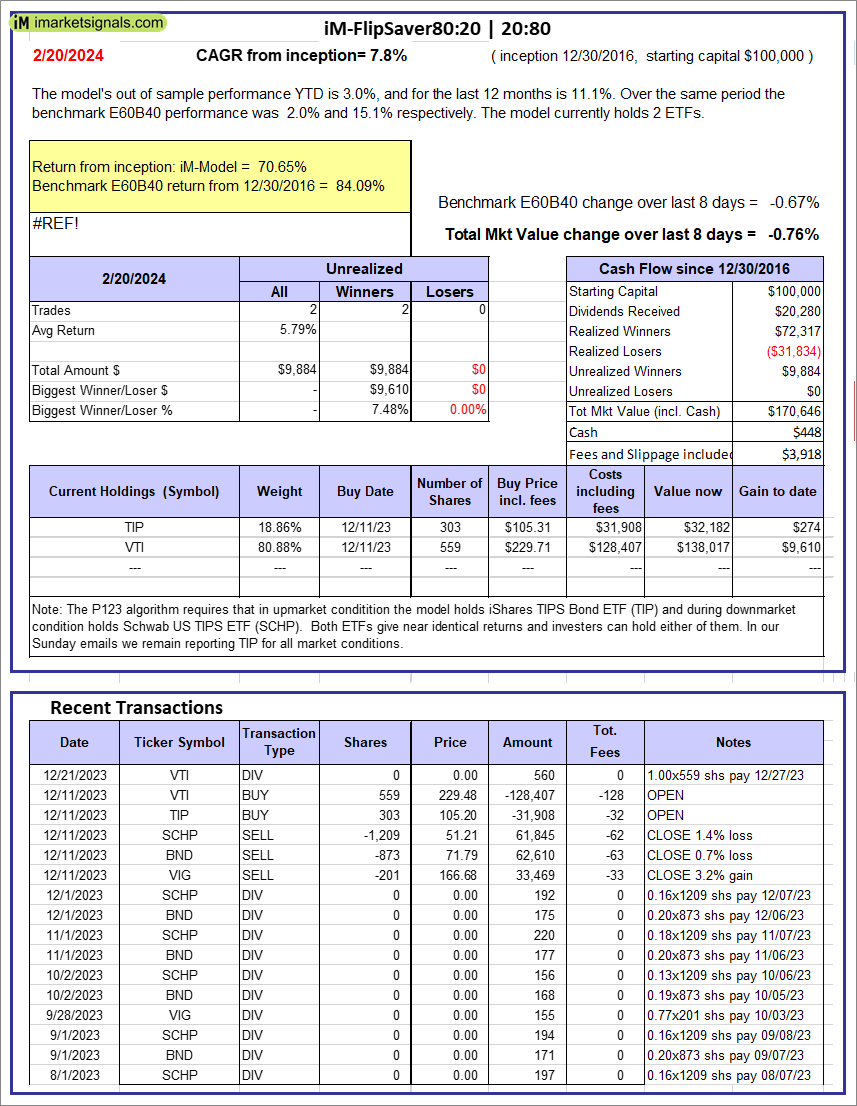 |
iM-FlipSaver 80:20 | 20:80 – 2017: The model’s out of sample performance YTD is 3.0%, and for the last 12 months is 11.1%. Over the same period the benchmark E60B40 performance was 2.0% and 15.1% respectively. Over the previous week the market value of iM-FlipSaver 80:20 | 20:80 gained -0.76% at a time when SPY gained -0.67%. A starting capital of $100,000 at inception on 1/2/2017 would have grown to $170,646 which includes $448 cash and excludes $3,918 spent on fees and slippage. |
  |
iM-5HedgeFundSelect: Since inception, on 1/5/2016, the model gained 522.82% while the benchmark SPY gained 180.56% over the same period. Over the previous week the market value of iM-5HedgeFundSelect gained -1.10% at a time when SPY gained -0.84%. A starting capital of $25,000 at inception on 1/5/2016 would have grown to $155,705 which includes $1,950 cash and excludes $2,224 spent on fees and slippage. |
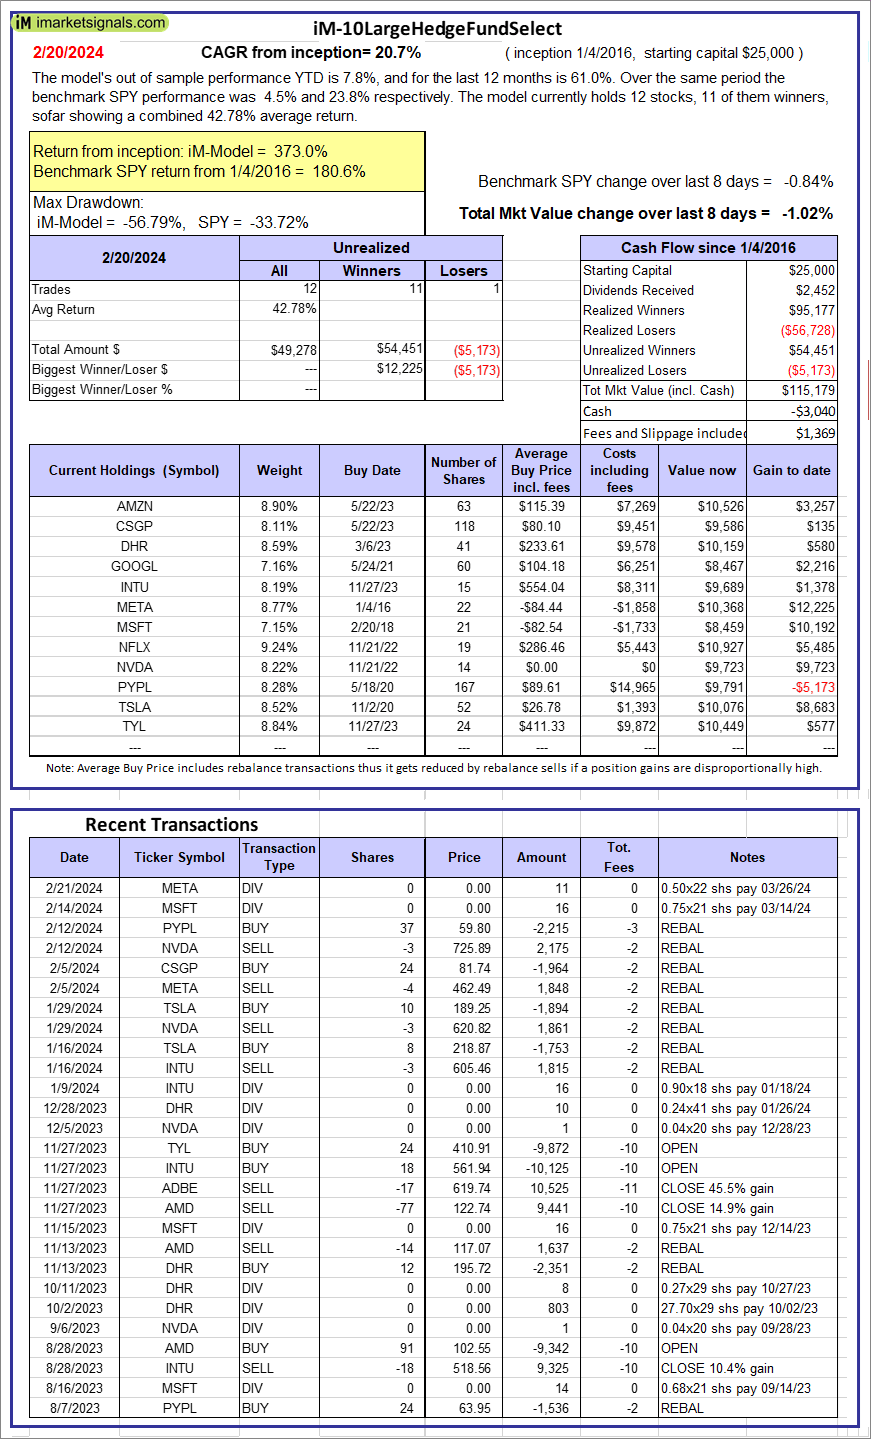  |
iM-10LargeHedgeFundSelect: Since inception, on 1/5/2016, the model gained 372.95% while the benchmark SPY gained 180.56% over the same period. Over the previous week the market value of iM-10LargeHedgeFundSelect gained -1.02% at a time when SPY gained -0.84%. A starting capital of $25,000 at inception on 1/5/2016 would have grown to $115,179 which includes -$3,040 cash and excludes $1,369 spent on fees and slippage. |
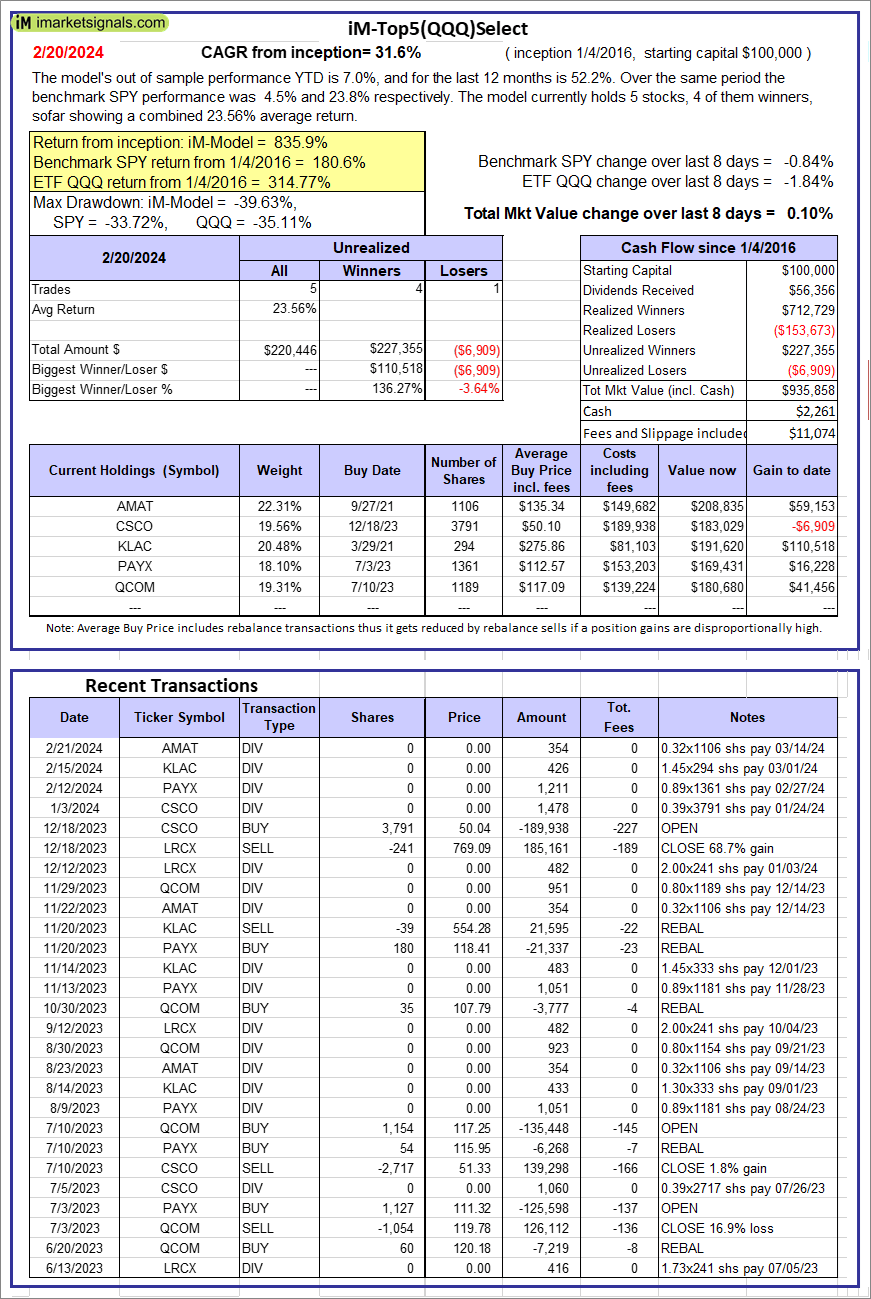 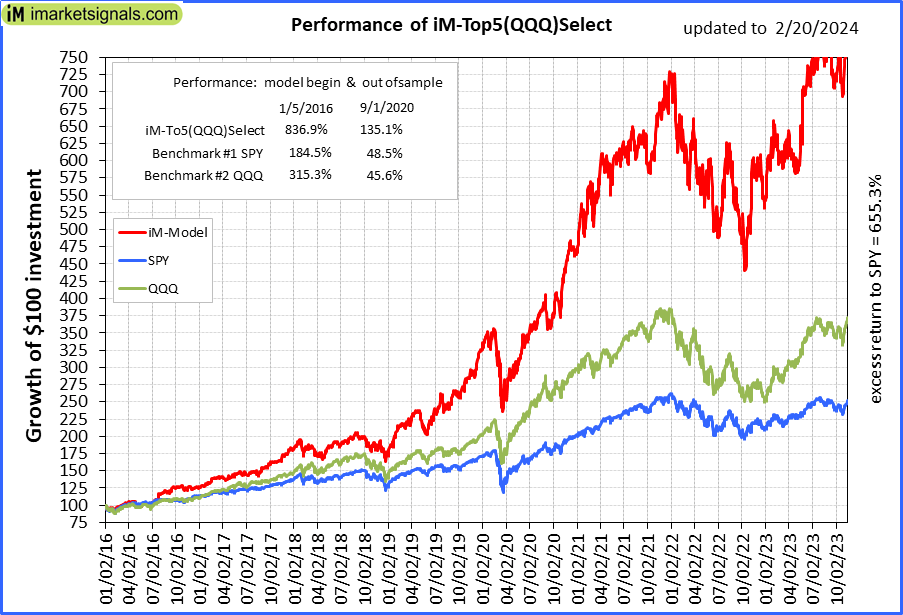 |
iM-Top5(QQQ)Select: Since inception, on 1/5/2016, the model gained 835.86% while the benchmark SPY gained 180.56% over the same period. Over the previous week the market value of iM-Top5(QQQ)Select gained 0.10% at a time when SPY gained -0.84%. A starting capital of $100,000 at inception on 1/5/2016 would have grown to $935,858 which includes $2,261 cash and excludes $11,074 spent on fees and slippage. |
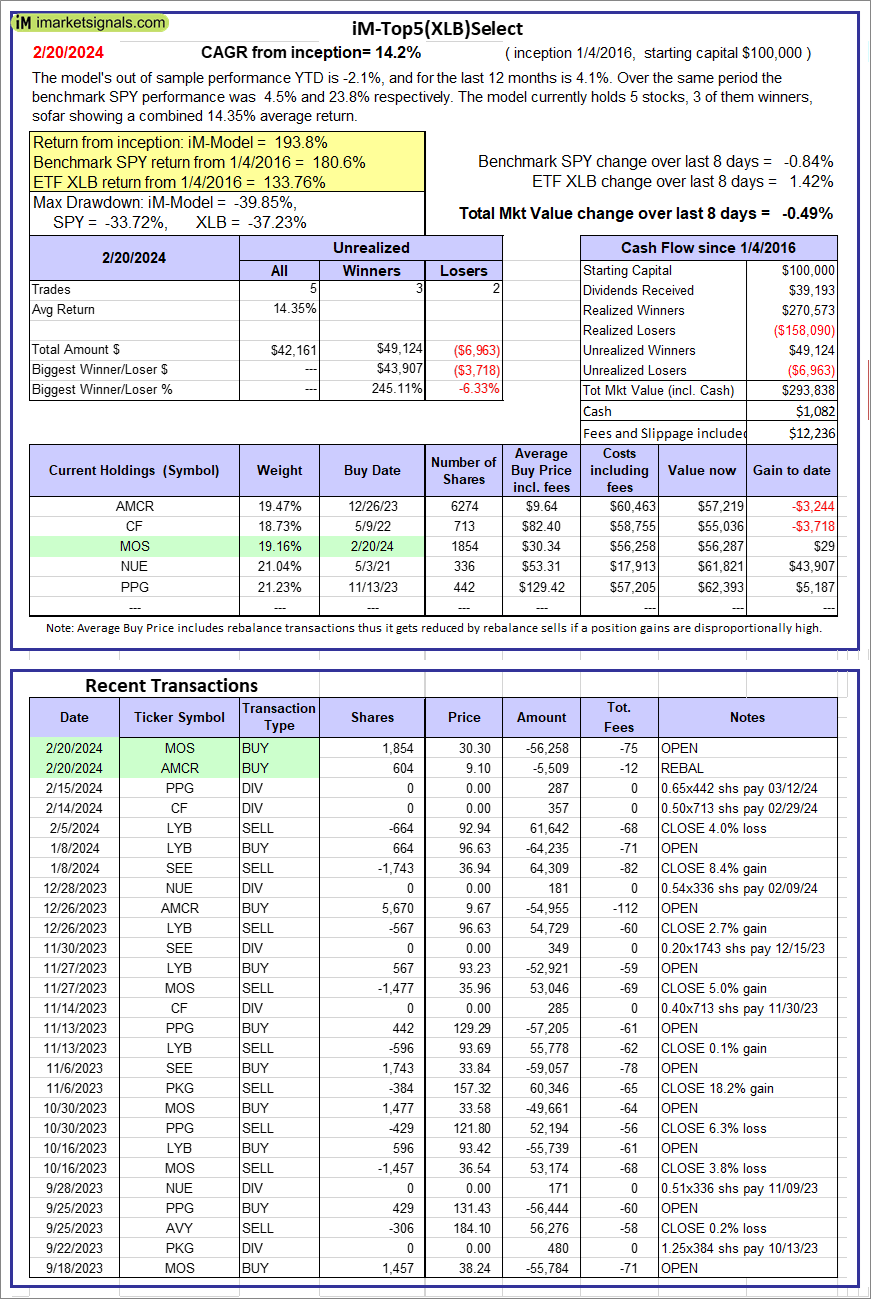  |
iM-Top5(XLB)Select: Since inception, on 1/5/2016, the model gained 193.84% while the benchmark SPY gained 180.56% over the same period. Over the previous week the market value of iM-Top5(XLB)Select gained -0.49% at a time when SPY gained -0.84%. A starting capital of $100,000 at inception on 1/5/2016 would have grown to $293,838 which includes $1,082 cash and excludes $12,236 spent on fees and slippage. |
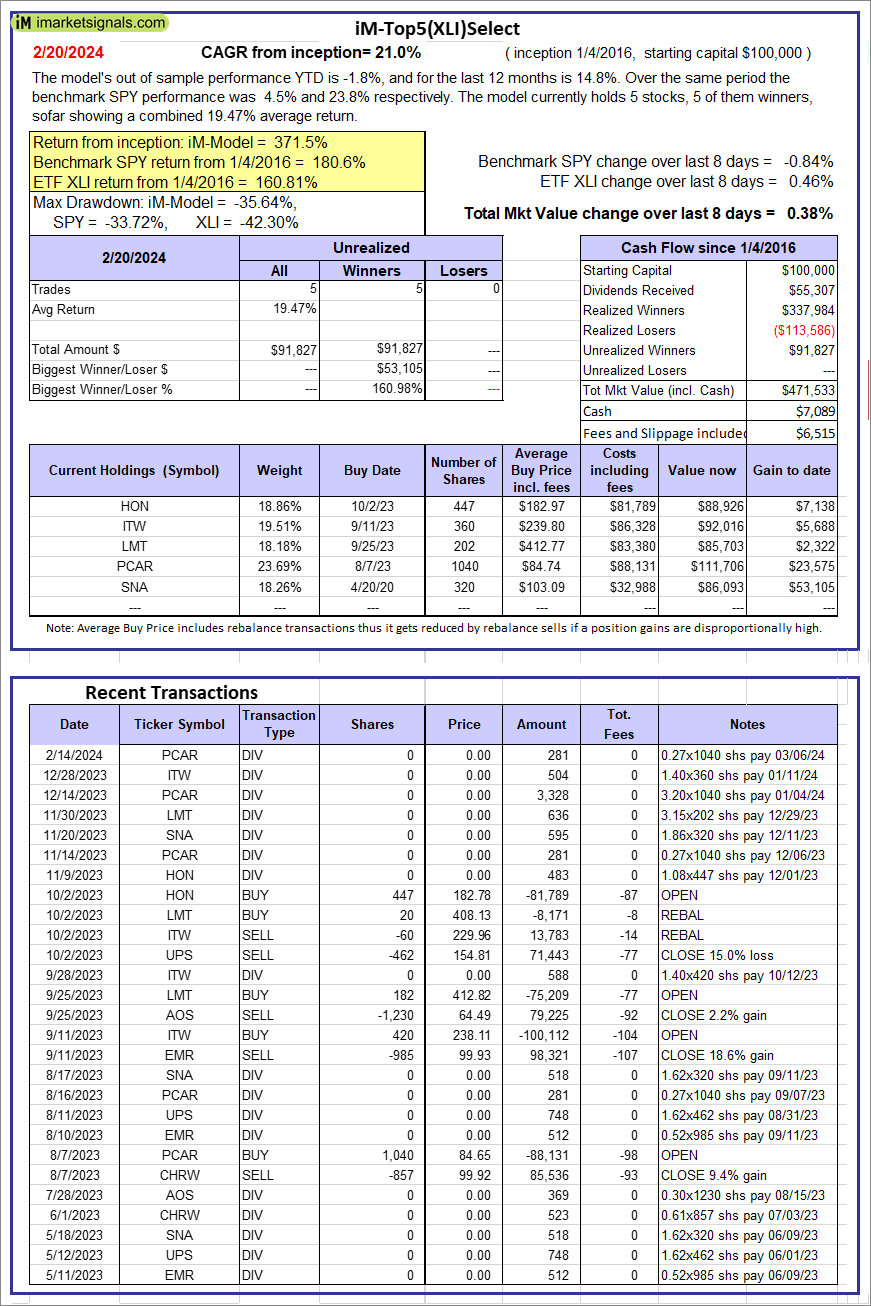 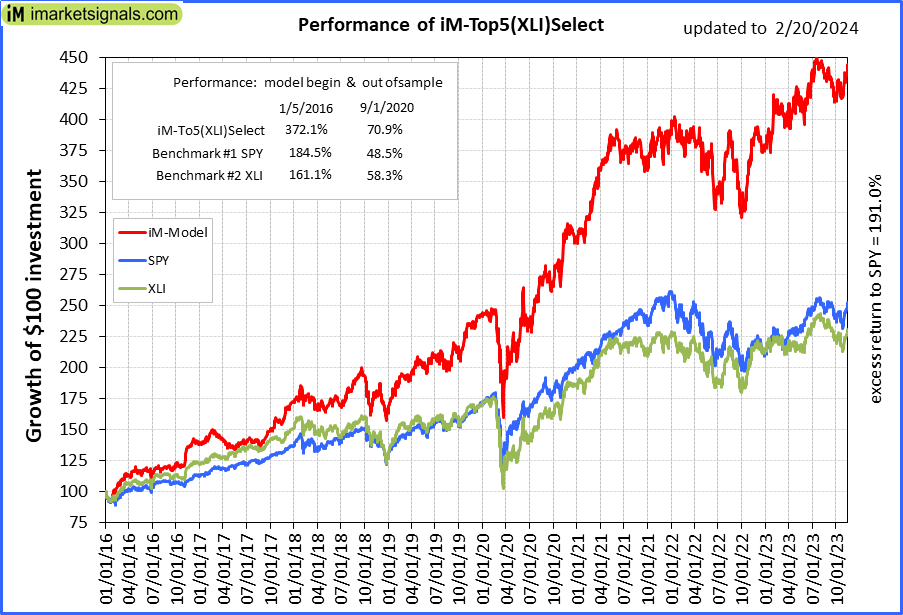 |
iM-Top5(XLI)Select: Since inception, on 1/5/2016, the model gained 371.53% while the benchmark SPY gained 180.56% over the same period. Over the previous week the market value of iM-Top5(XLI)Select gained 0.38% at a time when SPY gained -0.84%. A starting capital of $100,000 at inception on 1/5/2016 would have grown to $471,533 which includes $7,089 cash and excludes $6,515 spent on fees and slippage. |
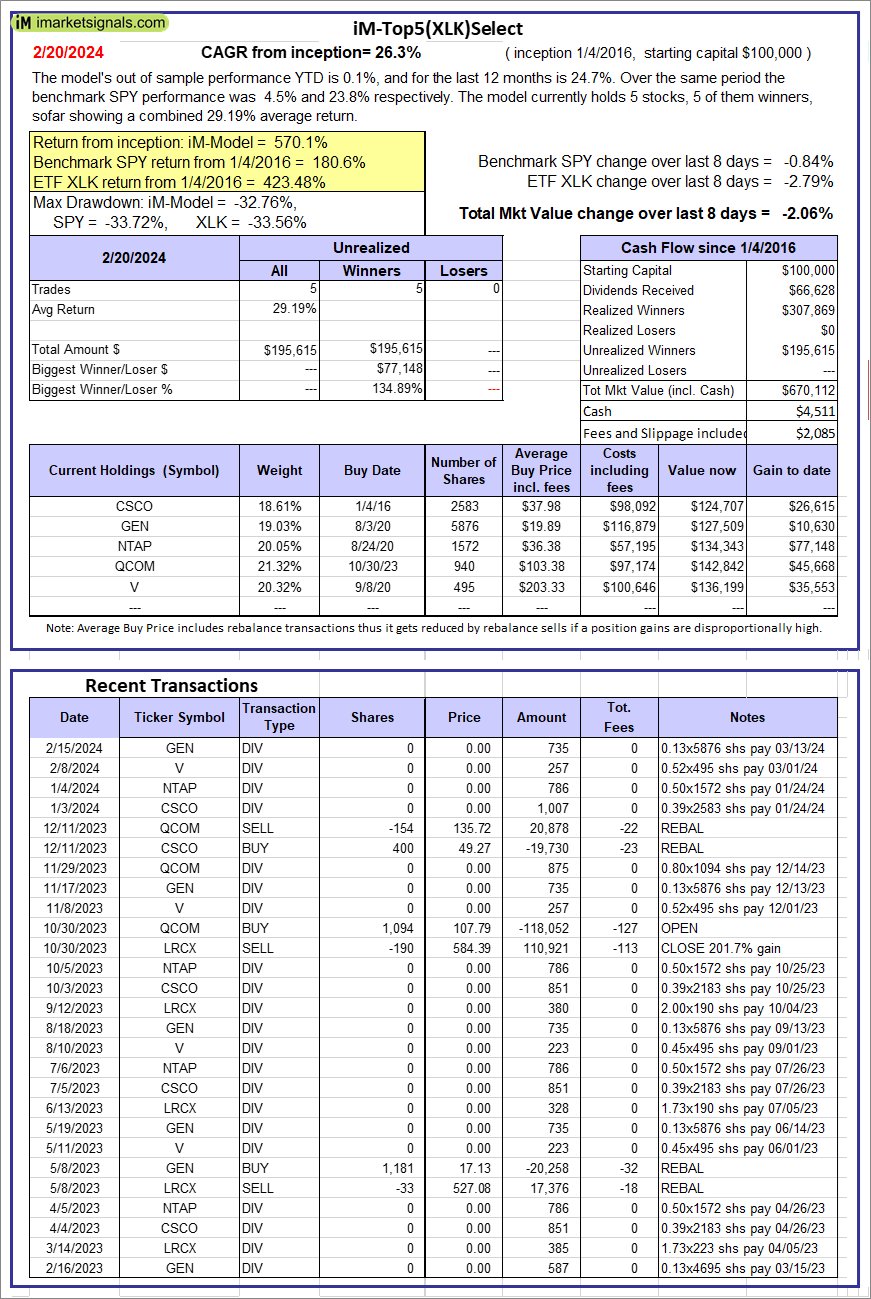 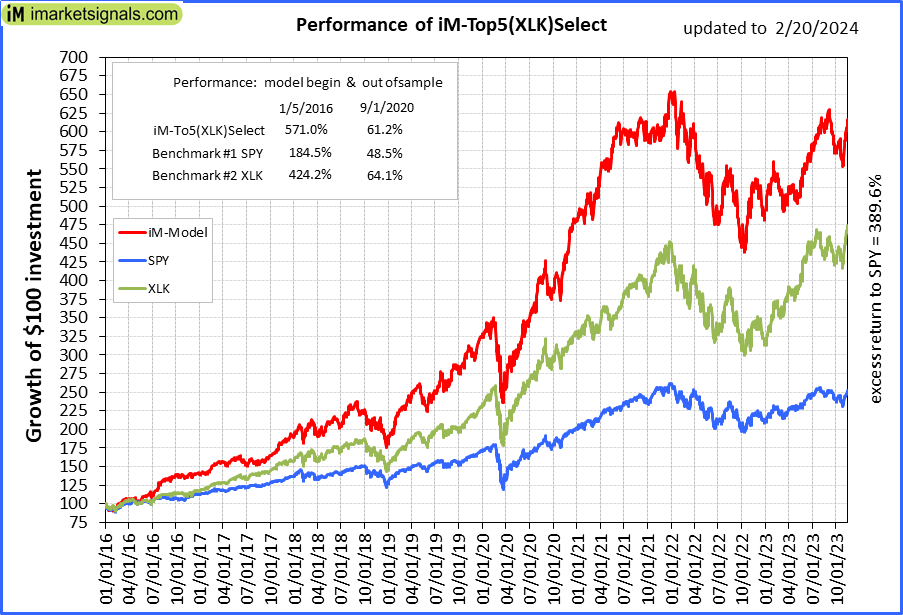 |
iM-Top5(XLK)Select: Since inception, on 1/5/2016, the model gained 570.11% while the benchmark SPY gained 180.56% over the same period. Over the previous week the market value of iM-Top5(XLK)Select gained -2.06% at a time when SPY gained -0.84%. A starting capital of $100,000 at inception on 1/5/2016 would have grown to $670,112 which includes $4,511 cash and excludes $2,085 spent on fees and slippage. |
 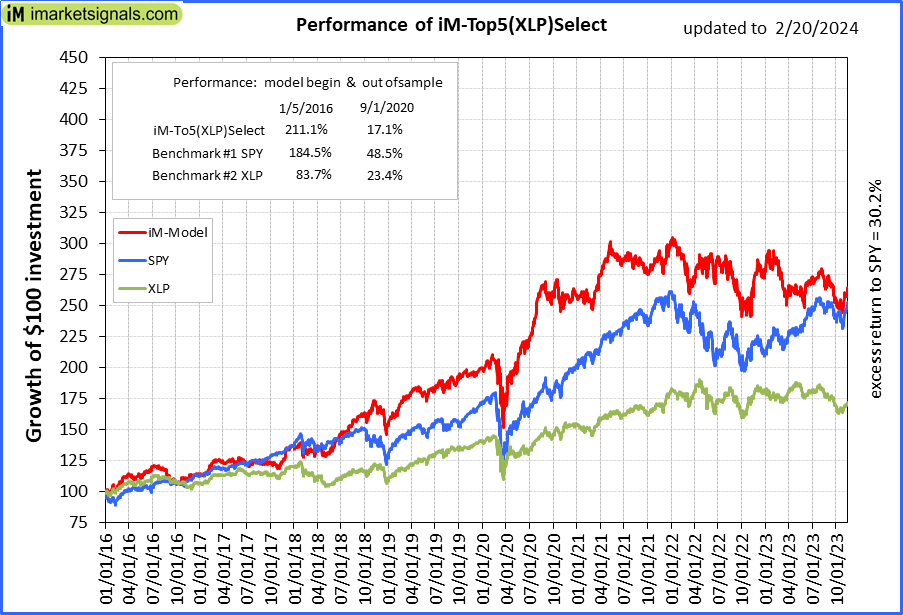 |
iM-Top5(XLP)Select: Since inception, on 1/5/2016, the model gained 210.72% while the benchmark SPY gained 180.56% over the same period. Over the previous week the market value of iM-Top5(XLP)Select gained 1.65% at a time when SPY gained -0.84%. A starting capital of $100,000 at inception on 1/5/2016 would have grown to $310,717 which includes $1,980 cash and excludes $2,179 spent on fees and slippage. |
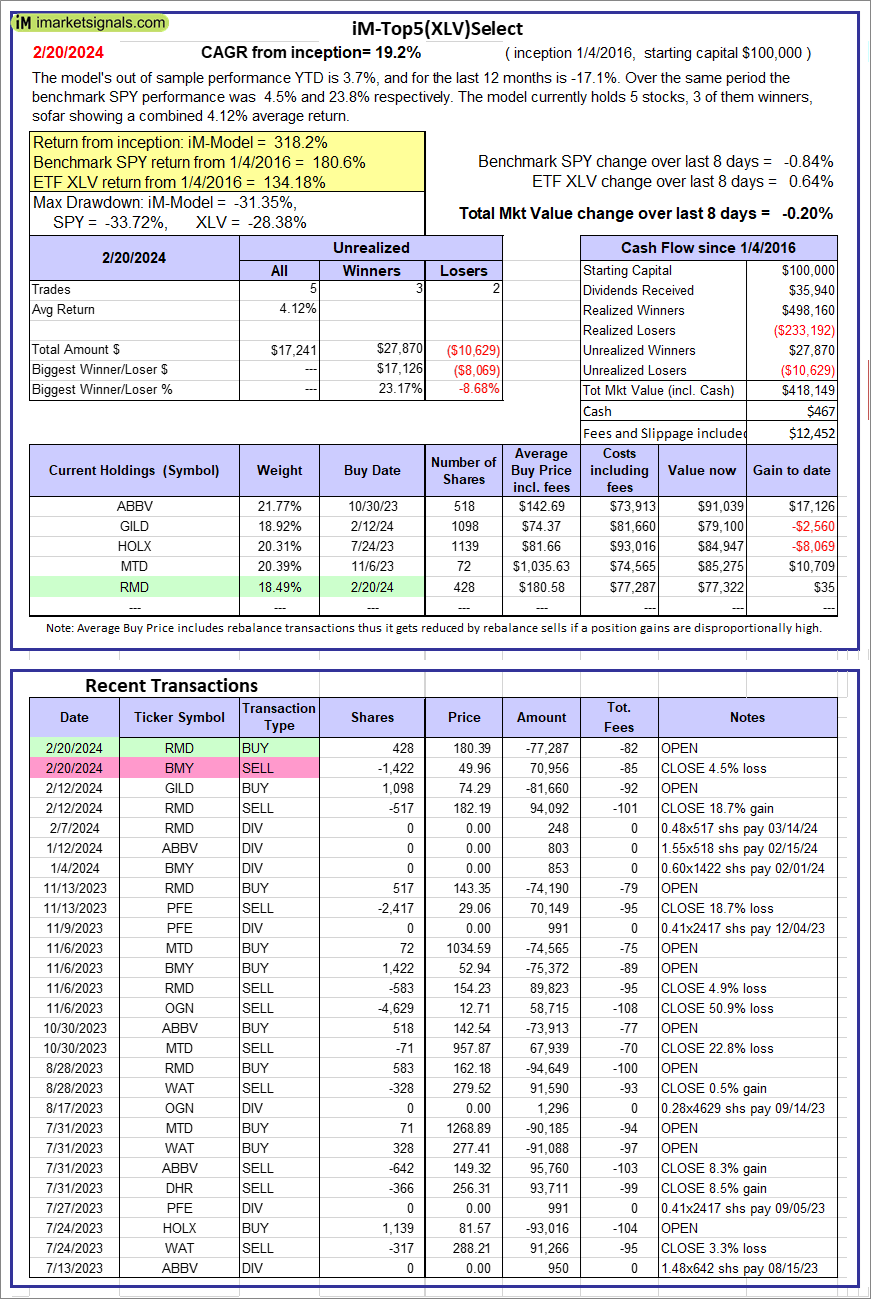 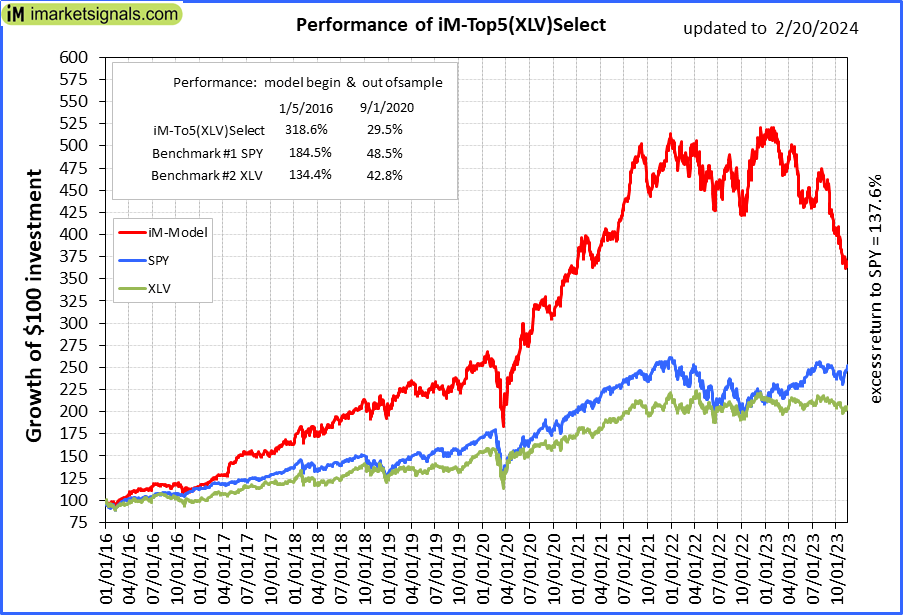 |
iM-Top5(XLV)Select: Since inception, on 1/5/2016, the model gained 318.15% while the benchmark SPY gained 180.56% over the same period. Over the previous week the market value of iM-Top5(XLV)Select gained -0.20% at a time when SPY gained -0.84%. A starting capital of $100,000 at inception on 1/5/2016 would have grown to $418,149 which includes $467 cash and excludes $12,452 spent on fees and slippage. |
 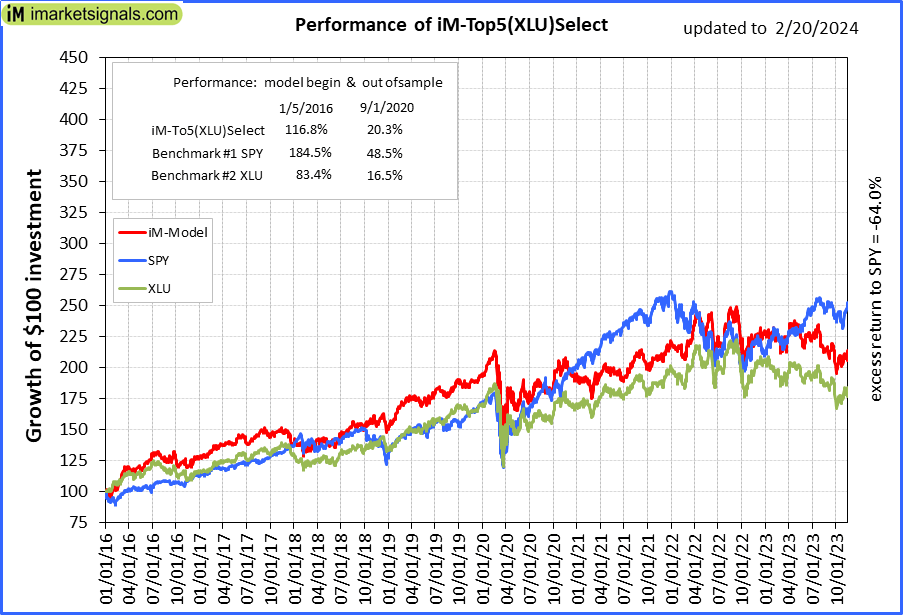 |
iM-Top5(XLU)Select: Since inception, on 1/5/2016, the model gained 116.56% while the benchmark SPY gained 180.56% over the same period. Over the previous week the market value of iM-Top5(XLU)Select gained 1.02% at a time when SPY gained -0.84%. A starting capital of $100,000 at inception on 1/5/2016 would have grown to $216,562 which includes $1,439 cash and excludes $13,127 spent on fees and slippage. |
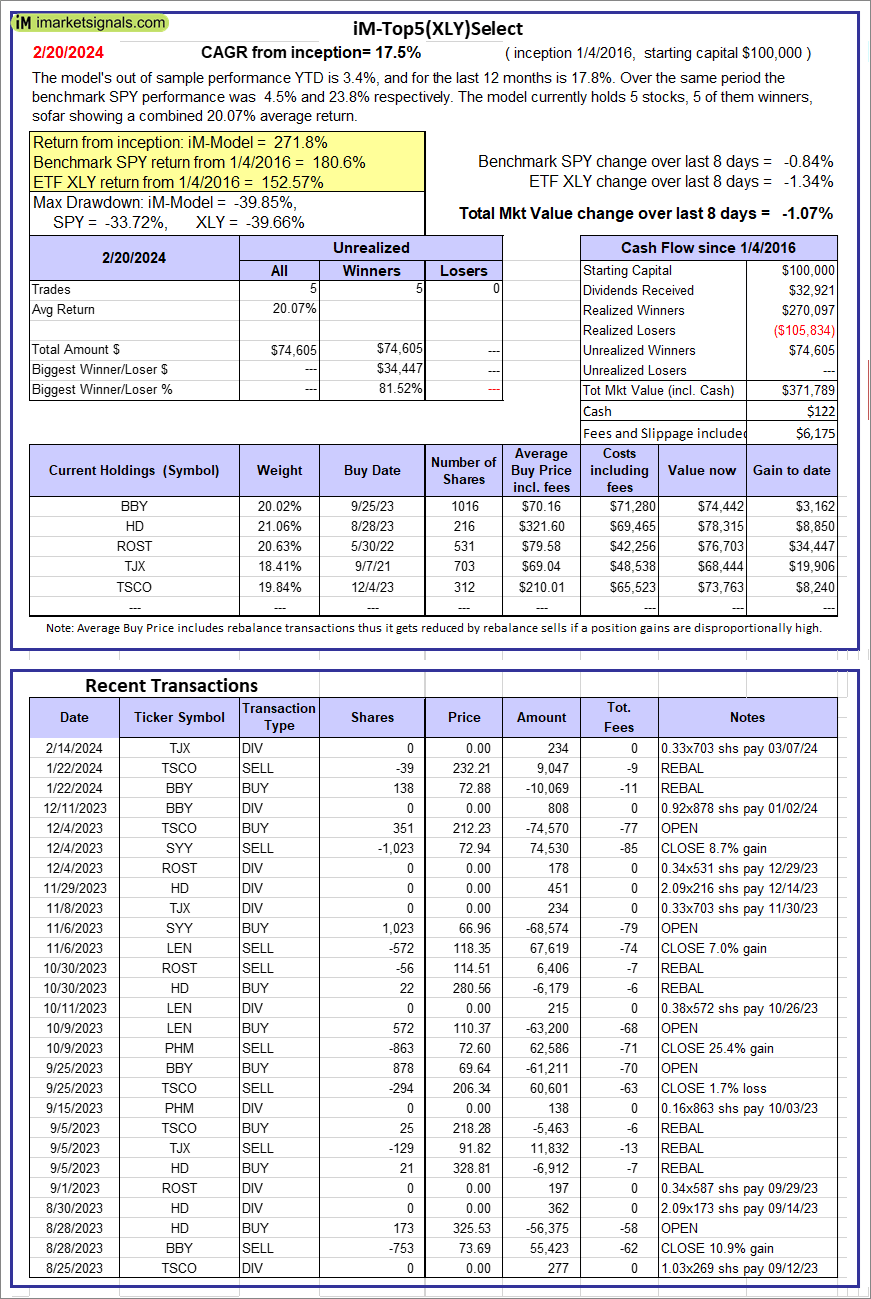 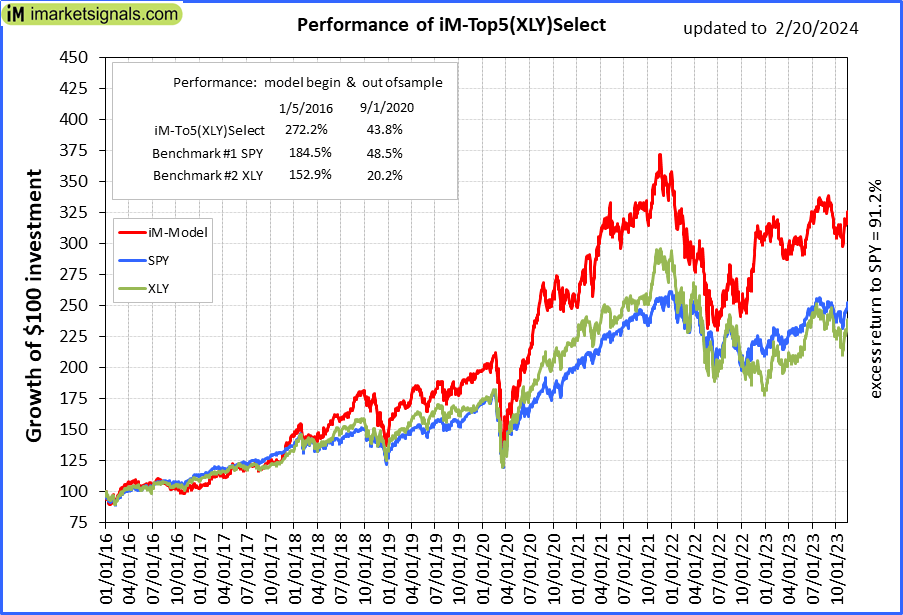 |
iM-Top5(XLY)Select: Since inception, on 1/5/2016, the model gained 271.79% while the benchmark SPY gained 180.56% over the same period. Over the previous week the market value of iM-Top5(XLY)Select gained -1.07% at a time when SPY gained -0.84%. A starting capital of $100,000 at inception on 1/5/2016 would have grown to $371,789 which includes $122 cash and excludes $6,175 spent on fees and slippage. |
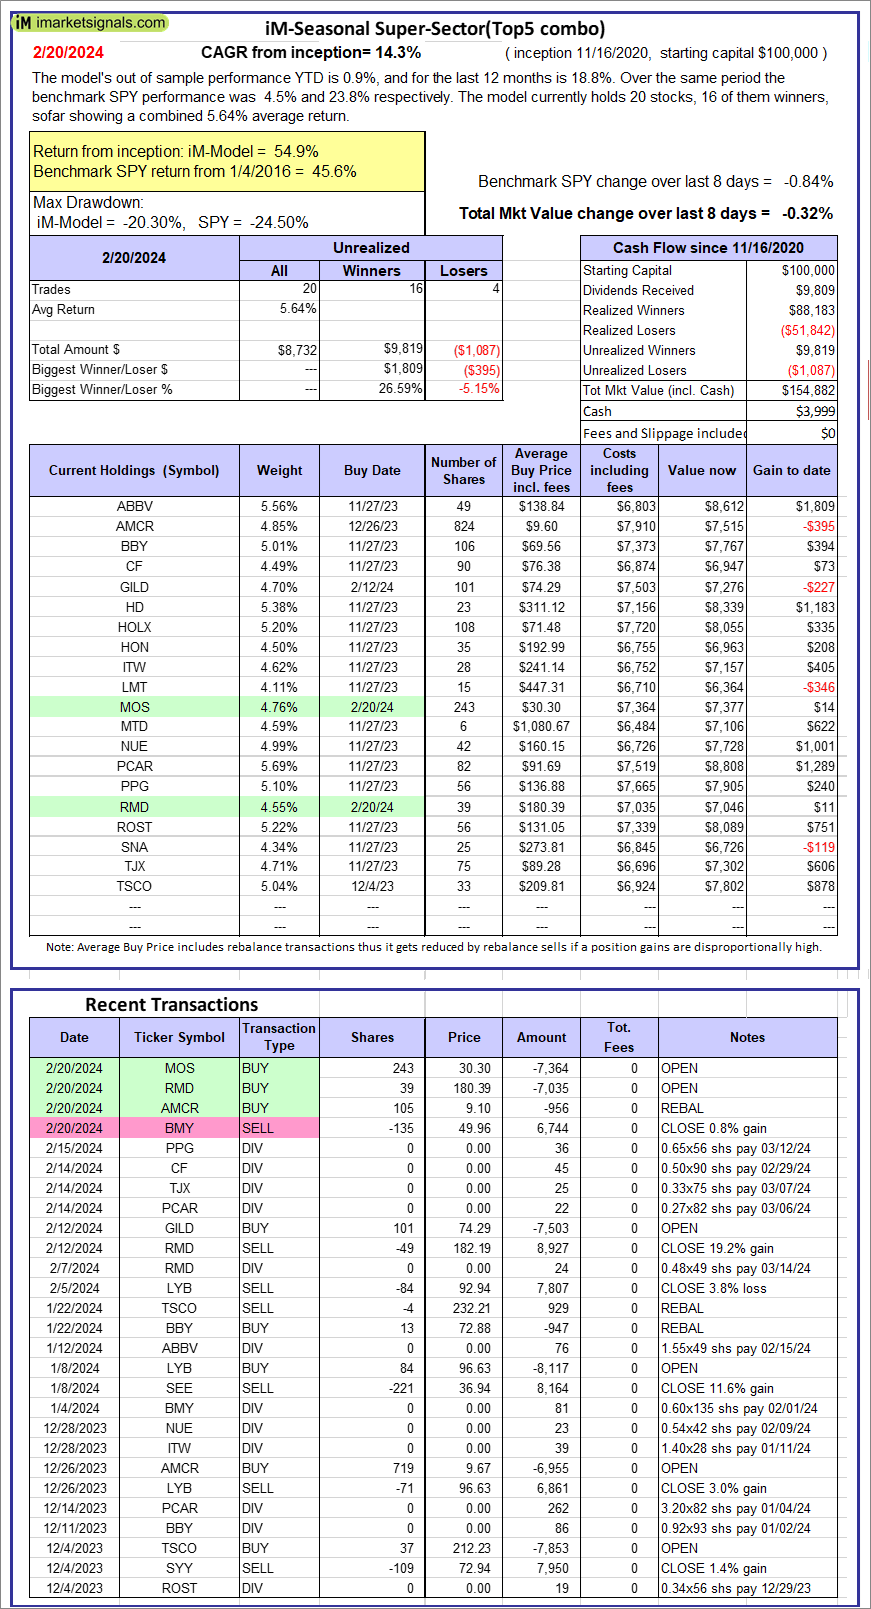 |
iM-Seasonal Super-Sectors (Top5 combo) : Since inception, on 11/17/2020, the model gained 54.88% while the benchmark SPY gained 45.64% over the same period. Over the previous week the market value of iM-Seasonal Super-Sectors (Top5 combo) gained -0.32% at a time when SPY gained -0.84%. A starting capital of $100,000 at inception on 11/17/2020 would have grown to $154,882 which includes $3,999 cash and excludes $00 spent on fees and slippage. |
 |
iM-Dividend Growth Portfolio: The model’s out of sample performance YTD is 1.2%, and for the last 12 months is 9.4%. Over the same period the benchmark SPY performance was 4.5% and 23.8% respectively. Over the previous week the market value of the iM-Dividend Growth Portfolio gained -0.09% at a time when SPY gained -0.84%. A starting capital of $100,000 at inception on 6/30/2016 would have grown to $444,267 which includes $3,167 cash and excludes $11,000 spent on fees and slippage. |
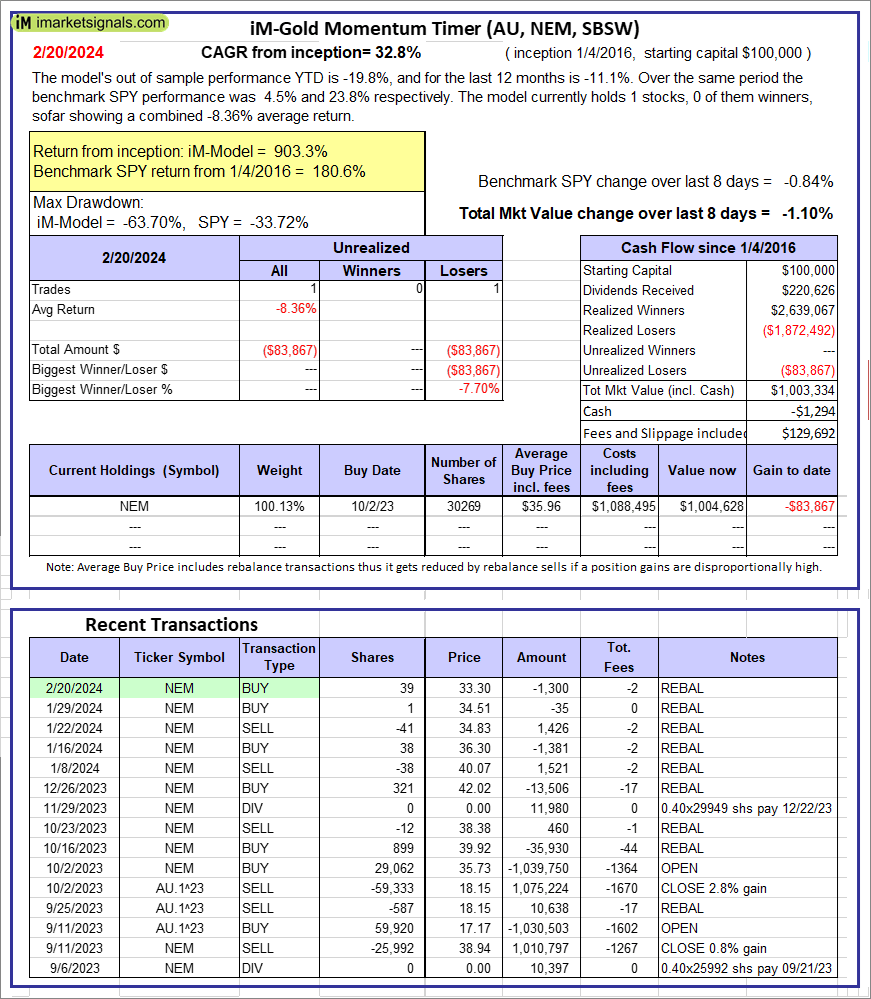 |
iM-Gold Momentum Timer (AU, NEM, SBSW): The model’s out of sample performance YTD is -19.8%, and for the last 12 months is -11.1%. Over the same period the benchmark SPY performance was 4.5% and 23.8% respectively. Over the previous week the market value of iM-Gold Momentum Timer (AU, NEM, SBSW) gained -1.10% at a time when SPY gained -0.84%. A starting capital of $100,000 at inception on 6/30/2016 would have grown to -$1,294 which includes $129,692 cash and excludes Gain to date spent on fees and slippage. |
 |
iM-ModSum/YieldCurve Timer: The model’s out of sample performance YTD is 4.5%, and for the last 12 months is 10.2%. Over the same period the benchmark SPY performance was 4.5% and 23.8% respectively. Over the previous week the market value of iM-PortSum/YieldCurve Timer gained -0.84% at a time when SPY gained -0.84%. A starting capital of $100,000 at inception on 1/1/2016 would have grown to $280,405 which includes $233 cash and excludes $1,452 spent on fees and slippage. |
 |
iM-Best(SPY-SH).R1: The model’s out of sample performance YTD is 4.5%, and for the last 12 months is -4.8%. Over the same period the benchmark SPY performance was 4.5% and 23.8% respectively. Over the previous week the market value of Best(SPY-SH) gained -0.85% at a time when SPY gained -0.84%. A starting capital of $100,000 at inception on 1/2/2009 would have grown to $60,259 which includes -$346 cash and excludes $2,553 spent on fees and slippage. |
 |
iM-Combo3.R1: The model’s out of sample performance YTD is 2.2%, and for the last 12 months is 3.7%. Over the same period the benchmark SPY performance was 4.5% and 23.8% respectively. Over the previous week the market value of iM-Combo3.R1 gained -1.46% at a time when SPY gained -0.84%. A starting capital of $100,000 at inception on 2/3/2014 would have grown to $186,537 which includes $1,892 cash and excludes $8,229 spent on fees and slippage. |
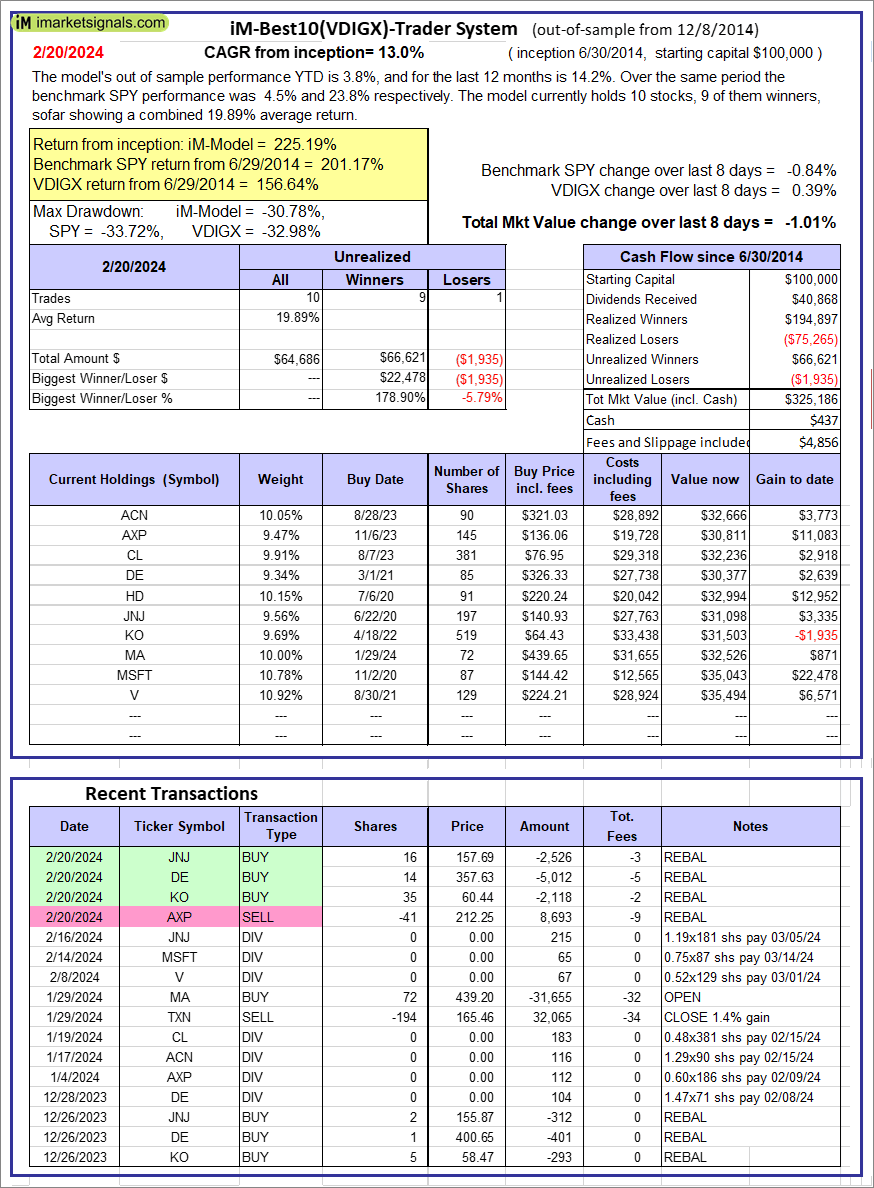  |
iM-Best10(VDIGX)-Trader: The model’s out of sample performance YTD is 3.8%, and for the last 12 months is 14.2%. Over the same period the benchmark SPY performance was 4.5% and 23.8% respectively. Since inception, on 7/1/2014, the model gained 225.19% while the benchmark SPY gained 201.17% and VDIGX gained 156.64% over the same period. Over the previous week the market value of iM-Best10(VDIGX) gained -1.01% at a time when SPY gained -0.84%. A starting capital of $100,000 at inception on 7/1/2014 would have grown to $325,186 which includes $437 cash and excludes $4,856 spent on fees and slippage. |
 |
iM 6-Stock Capital Strength Portfolio: The model’s out of sample performance YTD is -2.6%, and for the last 12 months is 8.1%. Over the same period the benchmark SPY performance was 4.5% and 23.8% respectively. Over the previous week the market value of the iM 6-Stock Capital Strength Portfolio gained 0.27% at a time when SPY gained -0.84%. A starting capital of $100,000 at inception on 10/28/2016 would have grown to $249,560 which includes $2,113 cash and excludes $3,128 spent on fees and slippage. |
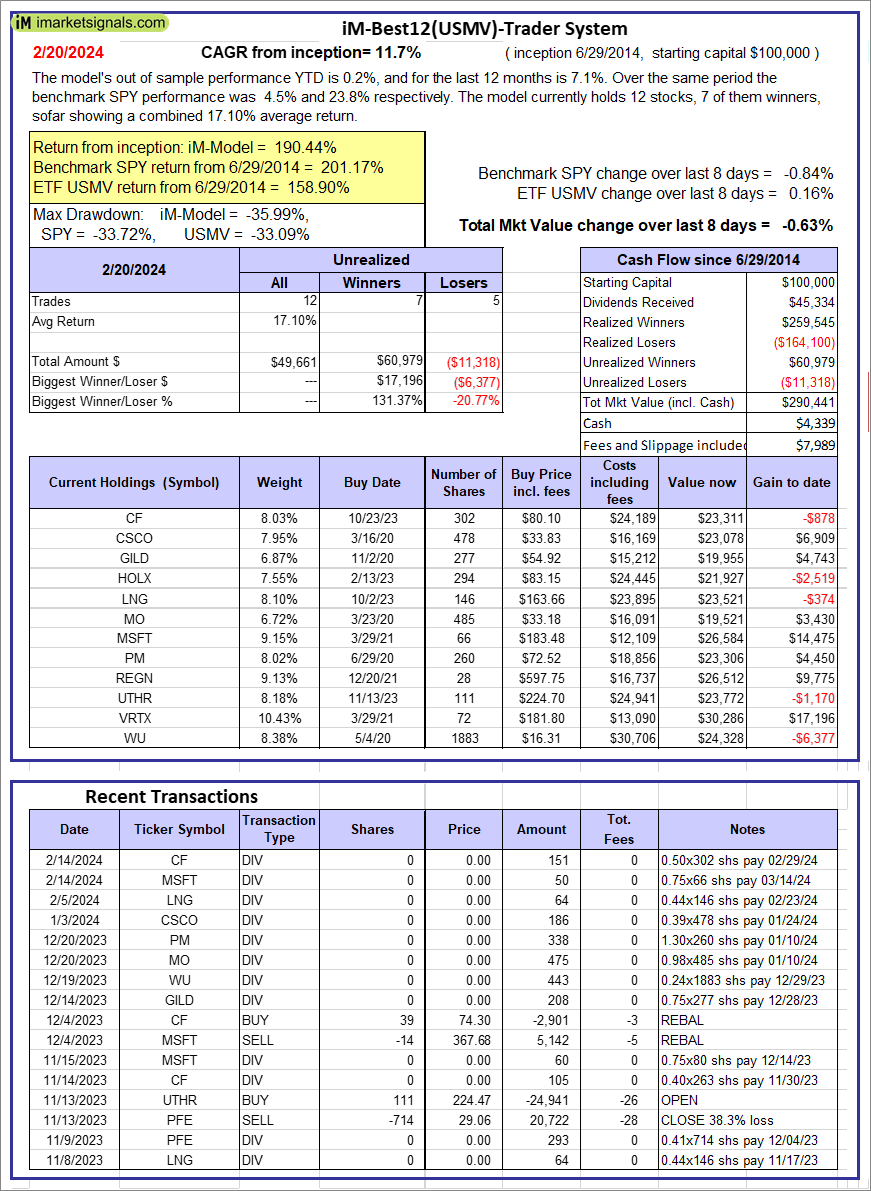 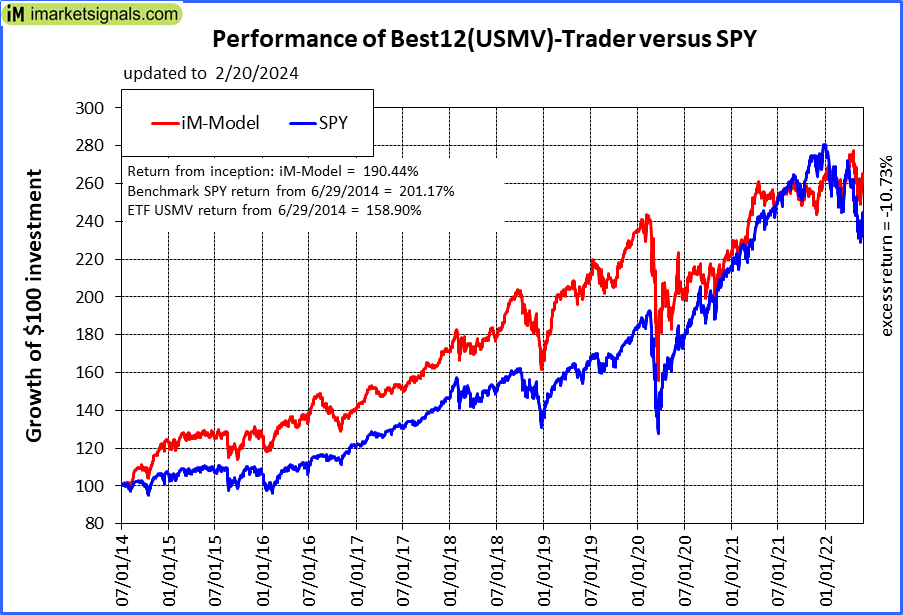 |
iM-Best12(USMV)-Trader: The model’s out of sample performance YTD is 0.2%, and for the last 12 months is 7.1%. Over the same period the benchmark SPY performance was 4.5% and 23.8% respectively. Since inception, on 6/30/2014, the model gained 190.44% while the benchmark SPY gained 201.17% and the ETF USMV gained 158.90% over the same period. Over the previous week the market value of iM-Best12(USMV)-Trader gained -0.63% at a time when SPY gained -0.84%. A starting capital of $100,000 at inception on 6/30/2014 would have grown to $290,441 which includes $4,339 cash and excludes $7,989 spent on fees and slippage. |
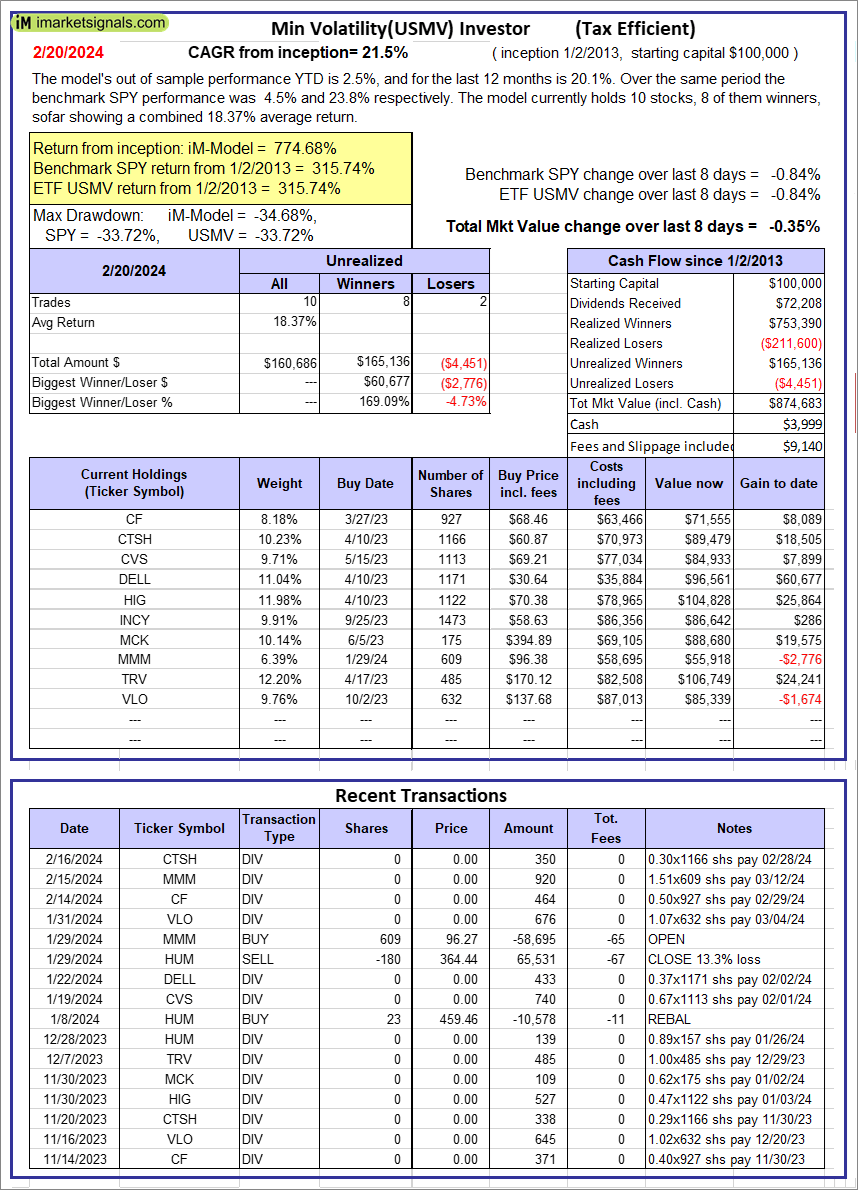  |
iM-Min Volatility(USMV) Investor (Tax Efficient): The model’s out of sample performance YTD is 2.5%, and for the last 12 months is 20.1%. Over the same period the benchmark SPY performance was 4.5% and 23.8% respectively. Since inception, on 1/3/2013, the model gained 774.68% while the benchmark SPY gained 315.74% and the ETF USMV gained 315.74% over the same period. Over the previous week the market value of iM-Best12(USMV)Q1 gained -0.35% at a time when SPY gained -0.84%. A starting capital of $100,000 at inception on 1/3/2013 would have grown to $874,683 which includes $3,999 cash and excludes $9,140 spent on fees and slippage. |
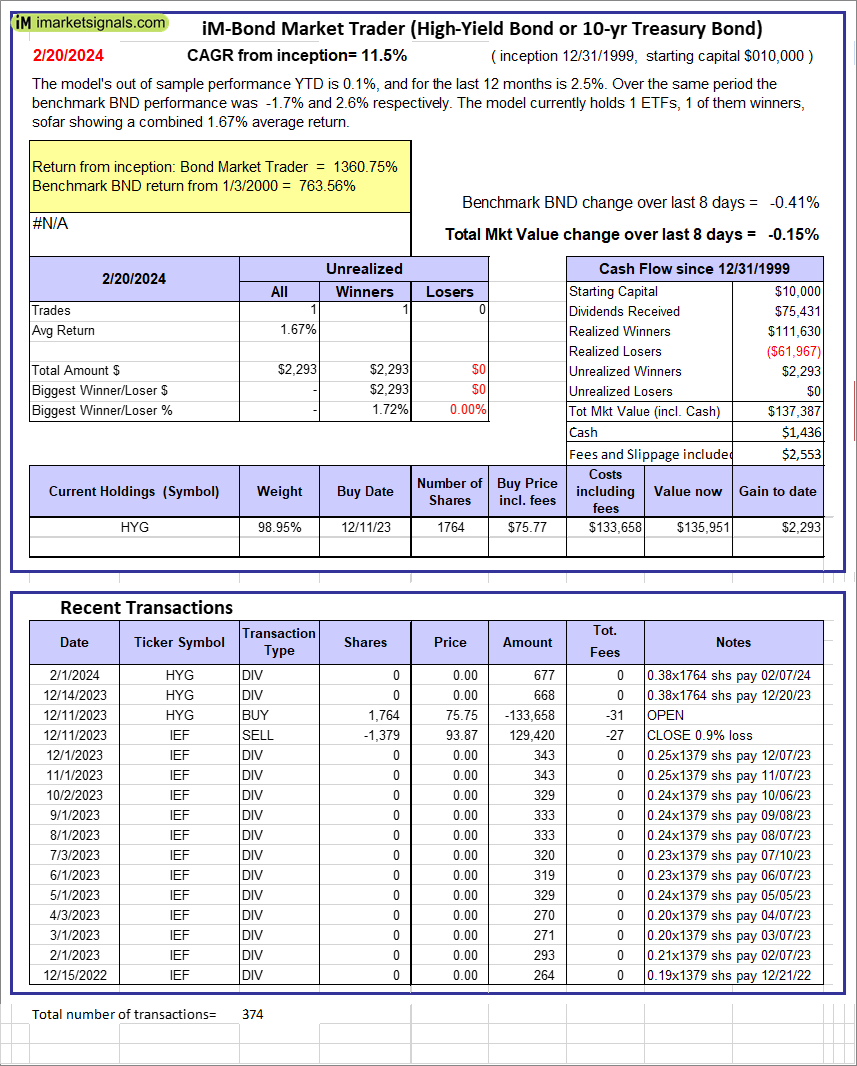 |
iM-Bond Market Trader (High-Yield Bond or 10-yr Treasury Bond): The model’s out of sample performance YTD is 0.1%, and for the last 12 months is 2.5%. Over the same period the benchmark BND performance was -1.7% and 2.6% respectively. Over the previous week the market value of the iM-Bond Market Trader (High-Yield Bond or 10-yr Treasury Bond) gained -0.15% at a time when BND gained -0.41%. A starting capital of $10,000 at inception on 1/3/2000 would have grown to $137,387 which includes $1,436 cash and excludes $2,553 spent on fees and slippage. |
|
|
iM-ModSum/YieldCurve Timer: The model’s out of sample performance YTD is 4.5%, and for the last 12 months is 10.2%. Over the same period the benchmark SPY performance was 4.5% and 23.8% respectively. Over the previous week the market value of iM-PortSum/YieldCurve Timer gained -0.84% at a time when SPY gained -0.84%. A starting capital of $100,000 at inception on 1/1/2016 would have grown to $280,405 which includes $233 cash and excludes $1,452 spent on fees and slippage. |
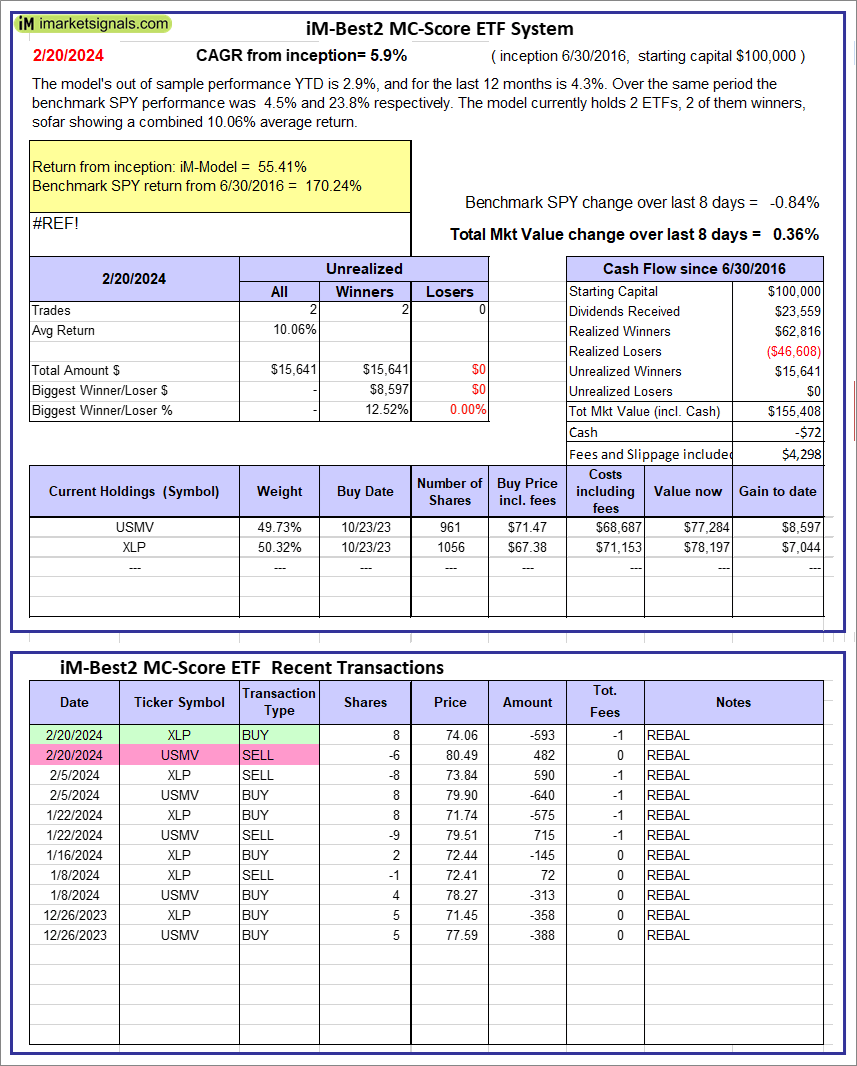 |
iM-Best2 MC-Score ETF System: The model’s out of sample performance YTD is 2.9%, and for the last 12 months is 4.3%. Over the same period the benchmark SPY performance was 4.5% and 23.8% respectively. Over the previous week the market value of the iM-Best2 MC-Score ETF System gained 0.36% at a time when SPY gained -0.84%. A starting capital of $100,000 at inception on 6/30/2016 would have grown to $155,408 which includes -$72 cash and excludes $4,298 spent on fees and slippage. |
 |
iM-Best4 MC-Score Vanguard System: The model’s out of sample performance YTD is -1.5%, and for the last 12 months is 3.7%. Over the same period the benchmark SPY performance was 4.5% and 23.8% respectively. Over the previous week the market value of the iM-Best4 MC-Score Vanguard System gained 0.24% at a time when SPY gained -0.84%. A starting capital of $100,000 at inception on 6/30/2016 would have grown to $159,640 which includes $249 cash and excludes $00 spent on fees and slippage. |
 |
iM-Composite (SPY-IEF) Timer: The model’s out of sample performance YTD is 4.5%, and for the last 12 months is 11.1%. Over the same period the benchmark SPY performance was 4.5% and 23.8% respectively. Over the previous week the market value of the iM-Composite (SPY-IEF) Timer gained -0.84% at a time when SPY gained -0.84%. A starting capital of $100,000 at inception on 6/30/2016 would have grown to $197,120 which includes $403 cash and excludes $6,127 spent on fees and slippage. |
 |
iM-Composite(Gold-Stocks-Bond) Timer: The model’s out of sample performance YTD is -1.9%, and for the last 12 months is 9.6%. Over the same period the benchmark SPY performance was 4.5% and 23.8% respectively. Over the previous week the market value of the iM-Composite(Gold-Stocks-Bond) Timer gained 0.20% at a time when SPY gained -0.84%. A starting capital of $100,000 at inception on 6/30/2016 would have grown to $190,816 which includes $36 cash and excludes $9,190 spent on fees and slippage. |
iM-Best Reports – 2/20/2024
Posted in pmp SPY-SH
Leave a Reply
You must be logged in to post a comment.