
  |
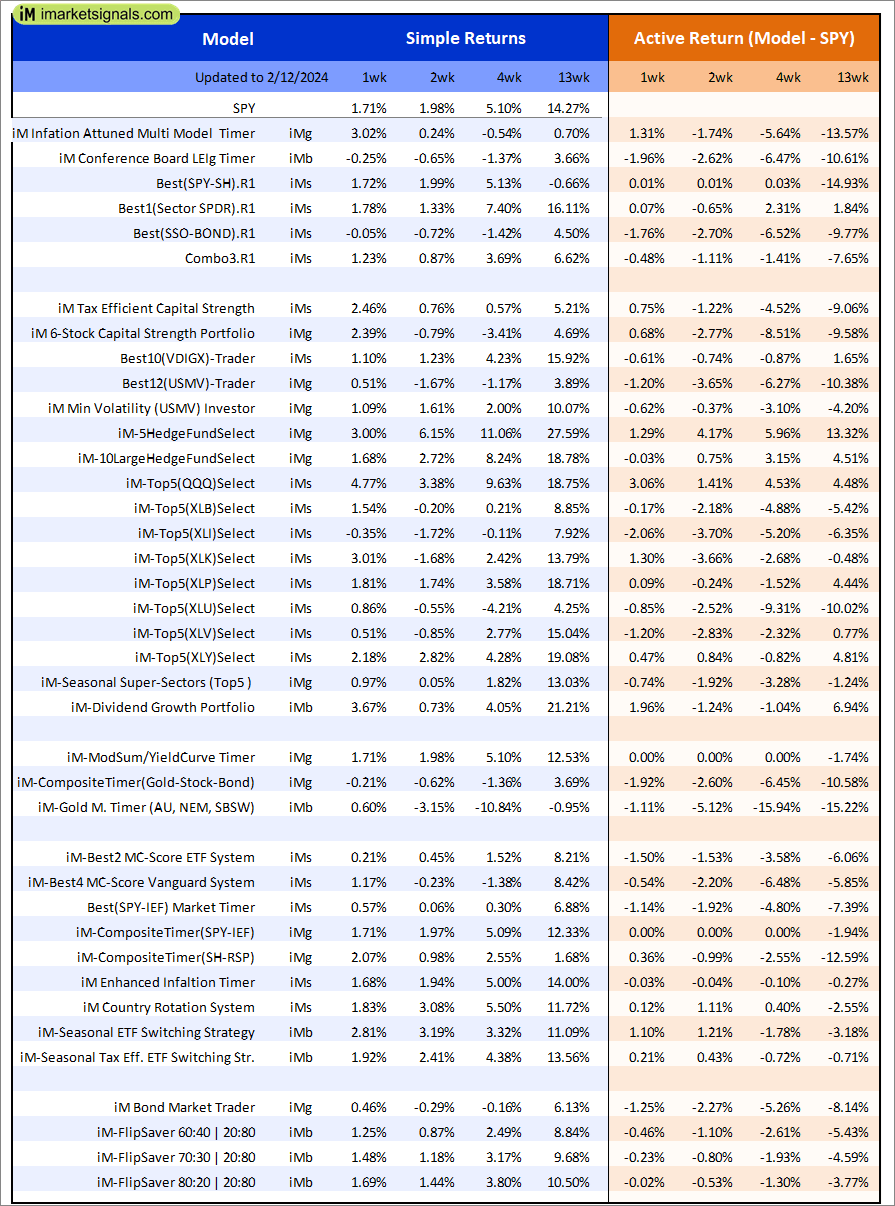
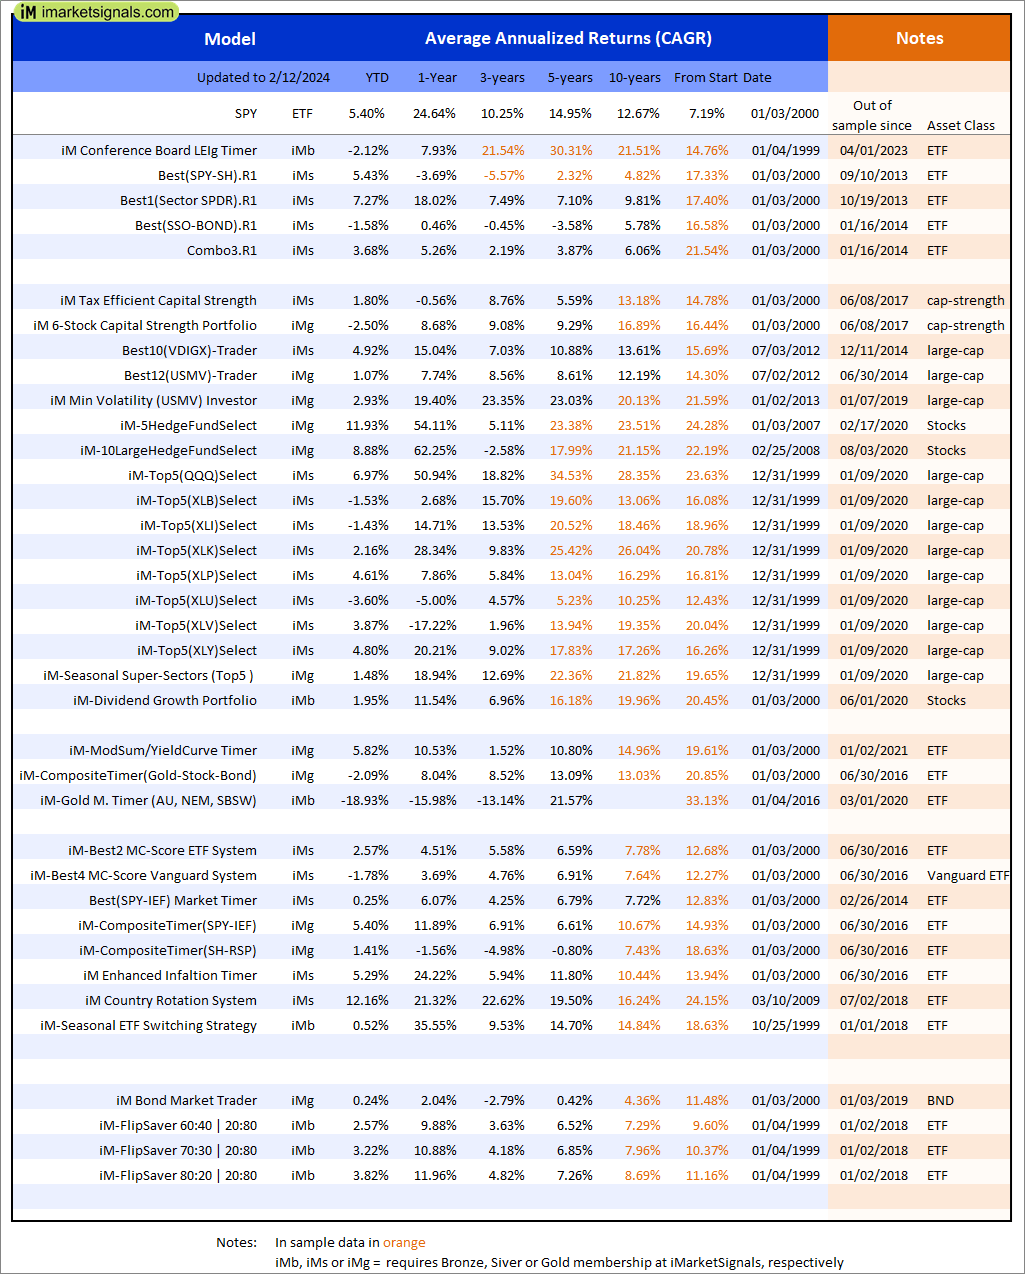
Out of sample performance summary of our models for the past 1, 2, 4 and 13 week periods. The active active return indicates how the models over- or underperformed the benchmark ETF SPY. Also the YTD, and the 1-, 3-, 5- and 10-year annualized returns are shown in the second table |
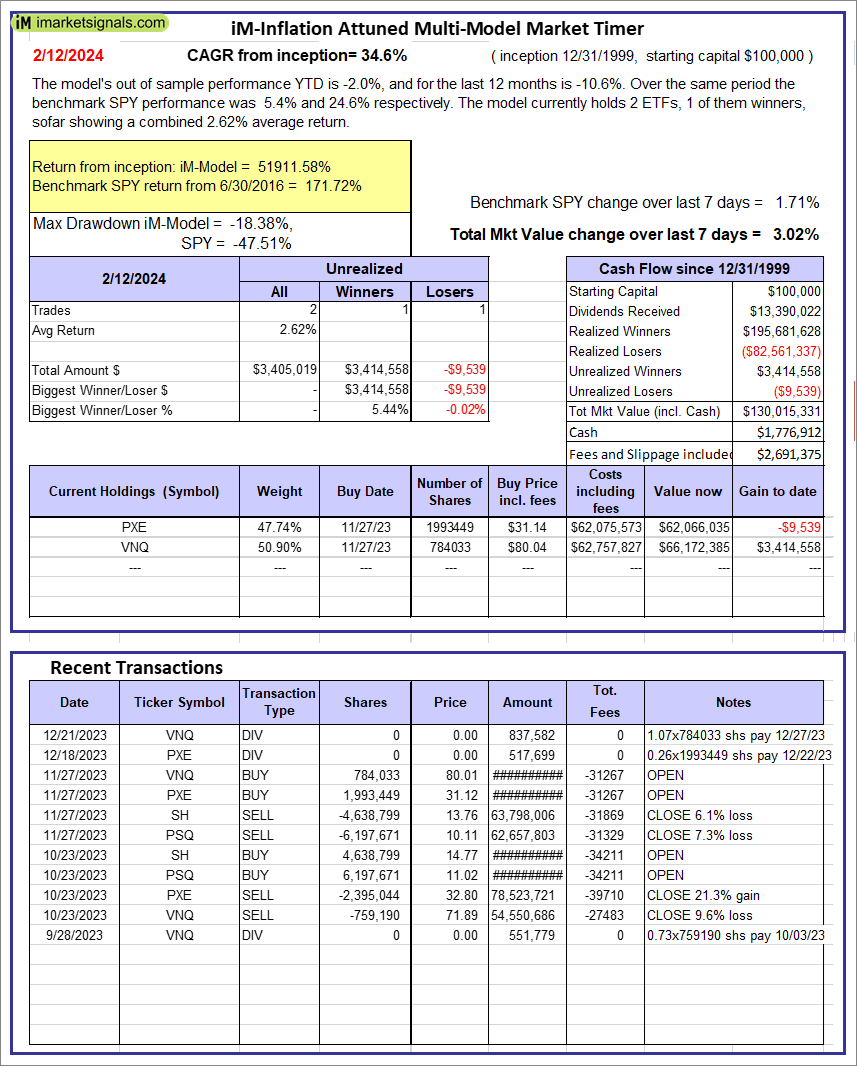 |
iM-Inflation Attuned Multi-Model Market Timer: The model’s out of sample performance YTD is -2.0%, and for the last 12 months is -10.6%. Over the same period the benchmark SPY performance was 5.4% and 24.6% respectively. Over the previous week the market value of the iM-Inflation Attuned Multi-Model Market Timer gained 3.02% at a time when SPY gained 1.71%. A starting capital of $100,000 at inception on 3/24/2017 would have grown to $130,015,331 which includes $1,776,912 cash and excludes $2,691,375 spent on fees and slippage. |
 |
iM-Conference Board LEIg Timer: The model’s performance YTD is 14.3%, and for the last 12 months is 7.3%. Over the same period the benchmark SPY performance was 20.1% and 9.4% respectively. Over the previous week the market value of the iM-Conference Board LEIg Timer gained 1.39% at a time when SPY gained 1.71%. A starting capital of $100,000 at inception on 4/5/2017 would have grown to $529,358 which includes $608 cash and excludes $763 spent on fees and slippage. |
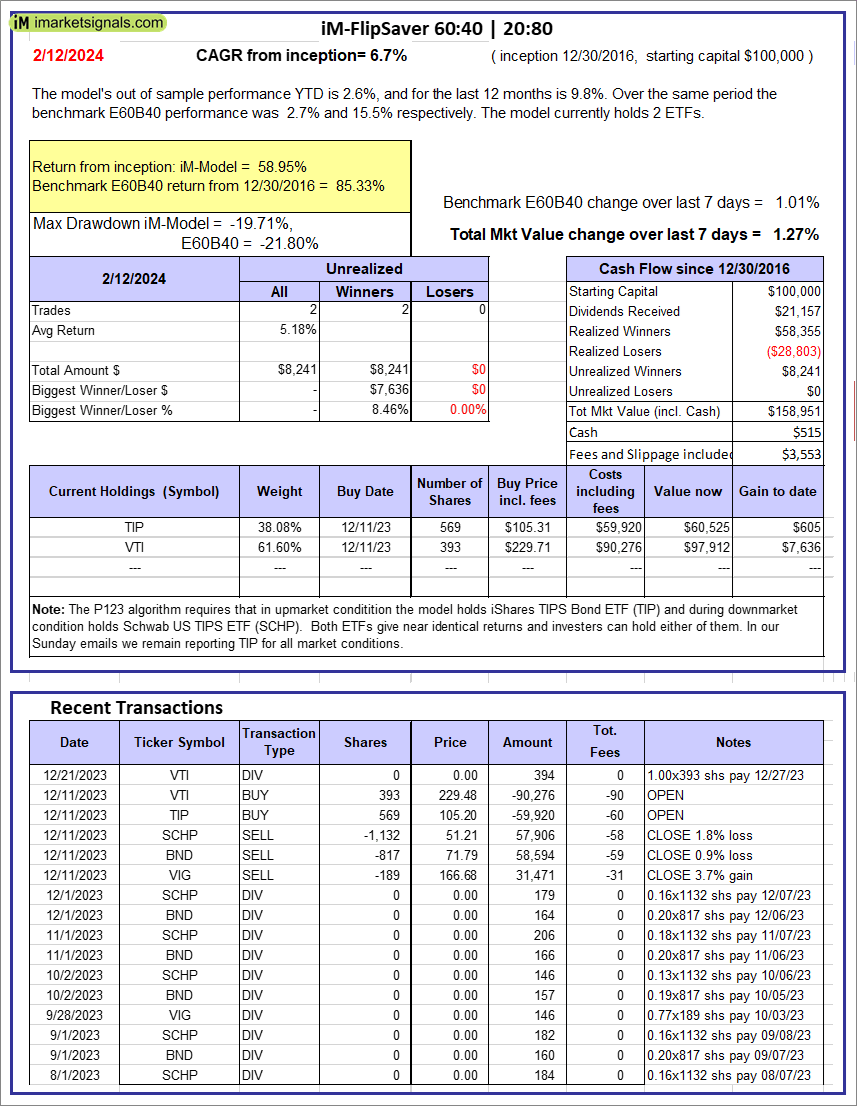 |
iM-FlipSaver 60:40 | 20:80 – 2017: The model’s out of sample performance YTD is 2.6%, and for the last 12 months is 9.8%. Over the same period the benchmark E60B40 performance was 2.7% and 15.5% respectively. Over the previous week the market value of iM-FlipSaver 80:20 | 20:80 gained 1.27% at a time when SPY gained 1.01%. A starting capital of $100,000 at inception on 7/16/2015 would have grown to $158,951 which includes $515 cash and excludes $3,553 spent on fees and slippage. |
 |
iM-FlipSaver 70:30 | 20:80 – 2017: The model’s out of sample performance YTD is 3.2%, and for the last 12 months is 10.9%. Over the same period the benchmark E60B40 performance was 2.7% and 15.5% respectively. Over the previous week the market value of iM-FlipSaver 70:30 | 20:80 gained 1.48% at a time when SPY gained 1.01%. A starting capital of $100,000 at inception on 7/15/2015 would have grown to $165,479 which includes $478 cash and excludes $3,740 spent on fees and slippage. |
 |
iM-FlipSaver 80:20 | 20:80 – 2017: The model’s out of sample performance YTD is 3.8%, and for the last 12 months is 12.0%. Over the same period the benchmark E60B40 performance was 2.7% and 15.5% respectively. Over the previous week the market value of iM-FlipSaver 80:20 | 20:80 gained 1.69% at a time when SPY gained 1.01%. A starting capital of $100,000 at inception on 1/2/2017 would have grown to $171,947 which includes $448 cash and excludes $3,918 spent on fees and slippage. |
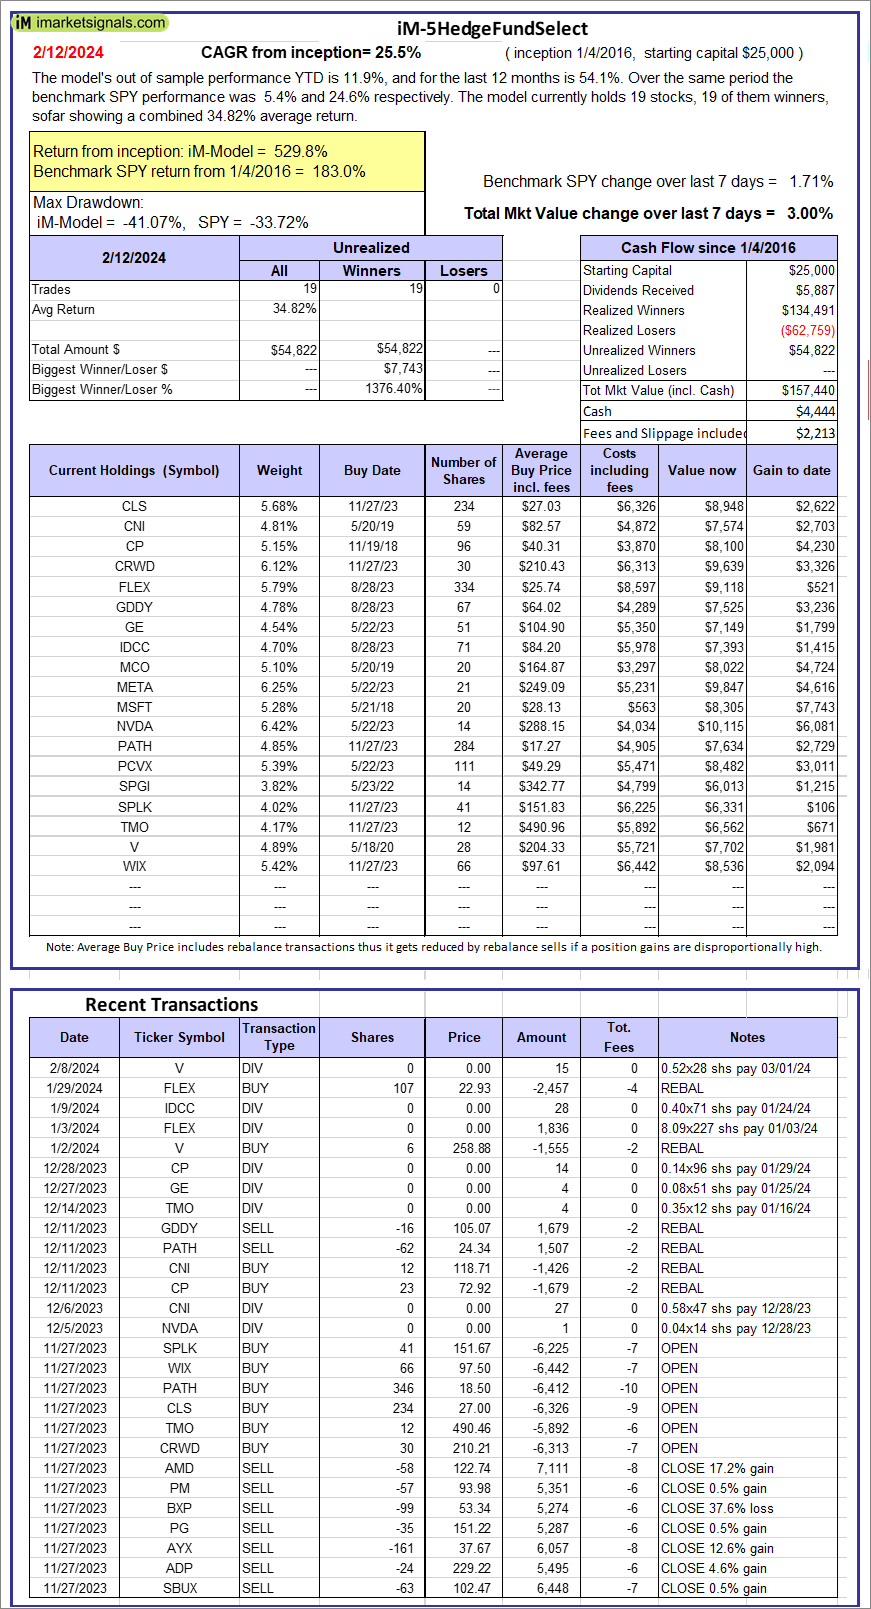 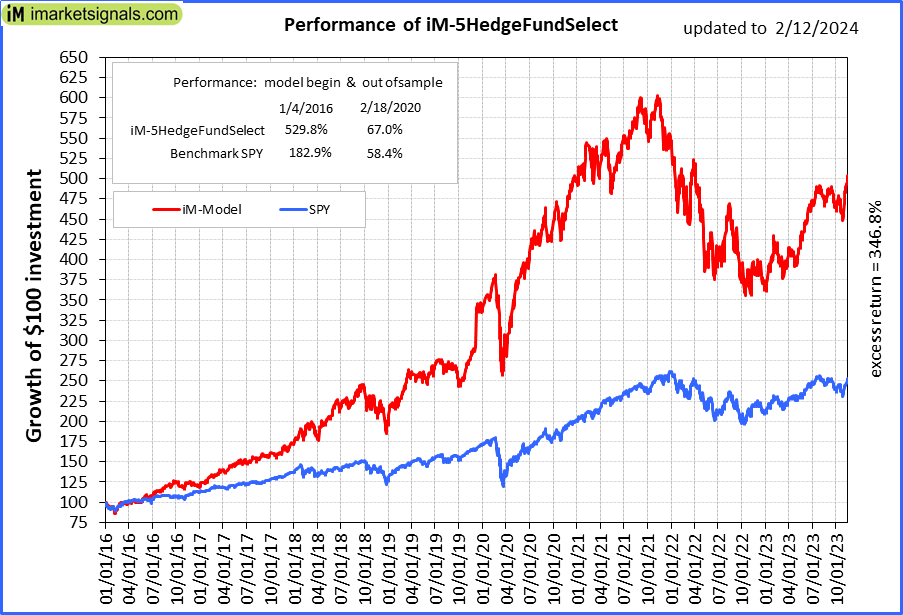 |
iM-5HedgeFundSelect: Since inception, on 1/5/2016, the model gained 529.76% while the benchmark SPY gained 182.95% over the same period. Over the previous week the market value of iM-5HedgeFundSelect gained 3.00% at a time when SPY gained 1.71%. A starting capital of $25,000 at inception on 1/5/2016 would have grown to $157,440 which includes $4,444 cash and excludes $2,213 spent on fees and slippage. |
 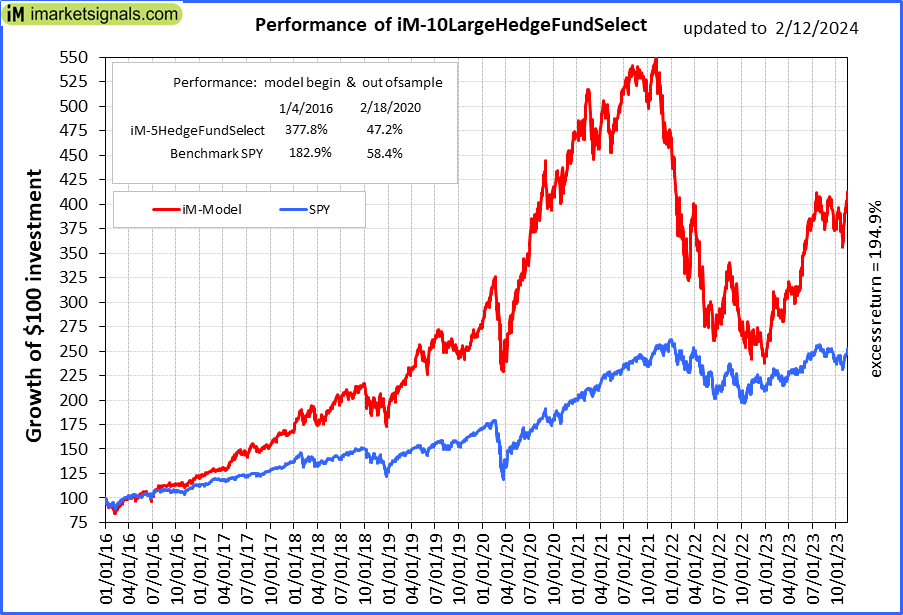 |
iM-10LargeHedgeFundSelect: Since inception, on 1/5/2016, the model gained 377.83% while the benchmark SPY gained 182.95% over the same period. Over the previous week the market value of iM-10LargeHedgeFundSelect gained 1.68% at a time when SPY gained 1.71%. A starting capital of $25,000 at inception on 1/5/2016 would have grown to $116,401 which includes -$3,067 cash and excludes $1,369 spent on fees and slippage. |
  |
iM-Top5(QQQ)Select: Since inception, on 1/5/2016, the model gained 834.94% while the benchmark SPY gained 182.95% over the same period. Over the previous week the market value of iM-Top5(QQQ)Select gained 4.77% at a time when SPY gained 1.71%. A starting capital of $100,000 at inception on 1/5/2016 would have grown to $934,941 which includes $1,481 cash and excludes $11,074 spent on fees and slippage. |
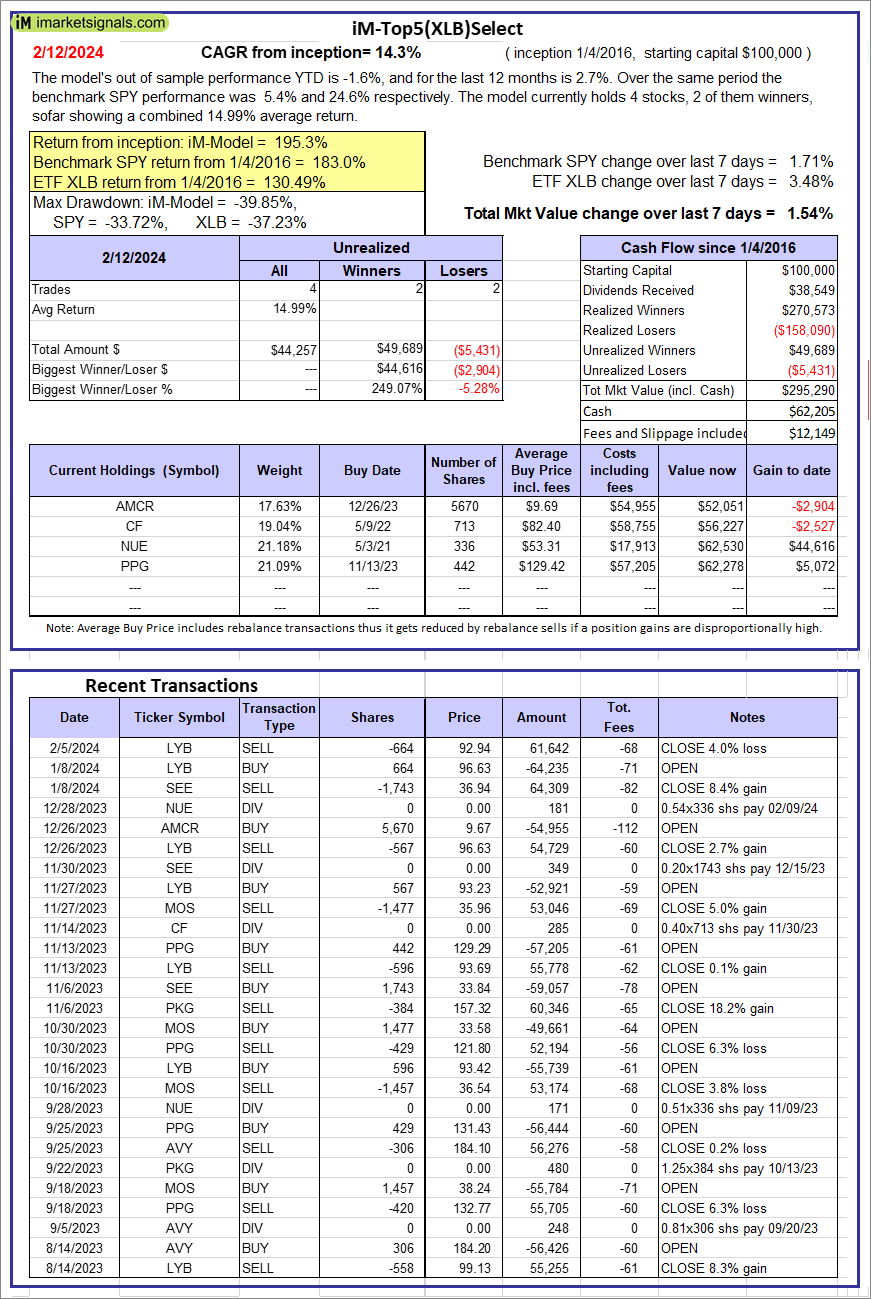 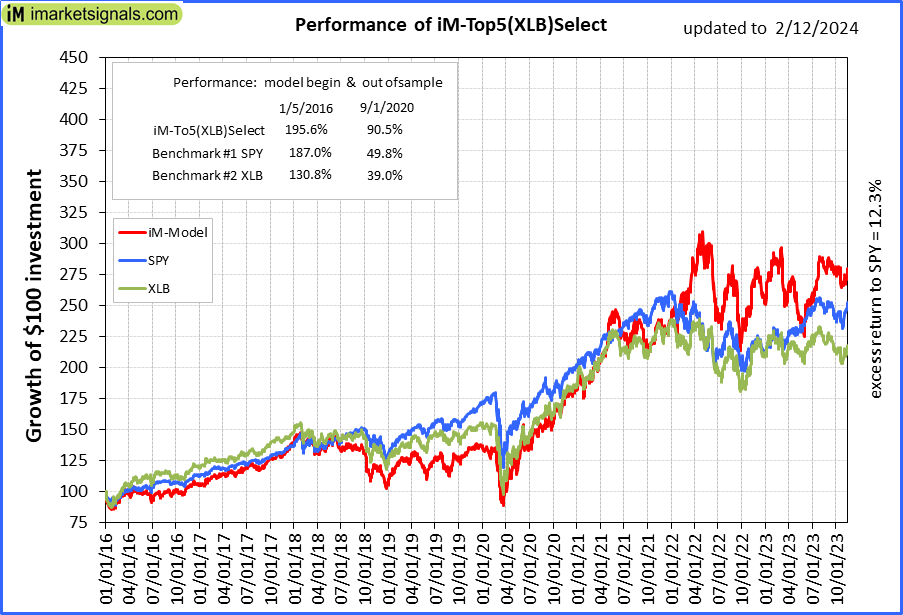 |
iM-Top5(XLB)Select: Since inception, on 1/5/2016, the model gained 195.29% while the benchmark SPY gained 182.95% over the same period. Over the previous week the market value of iM-Top5(XLB)Select gained 1.54% at a time when SPY gained 1.71%. A starting capital of $100,000 at inception on 1/5/2016 would have grown to $295,290 which includes $62,205 cash and excludes $12,149 spent on fees and slippage. |
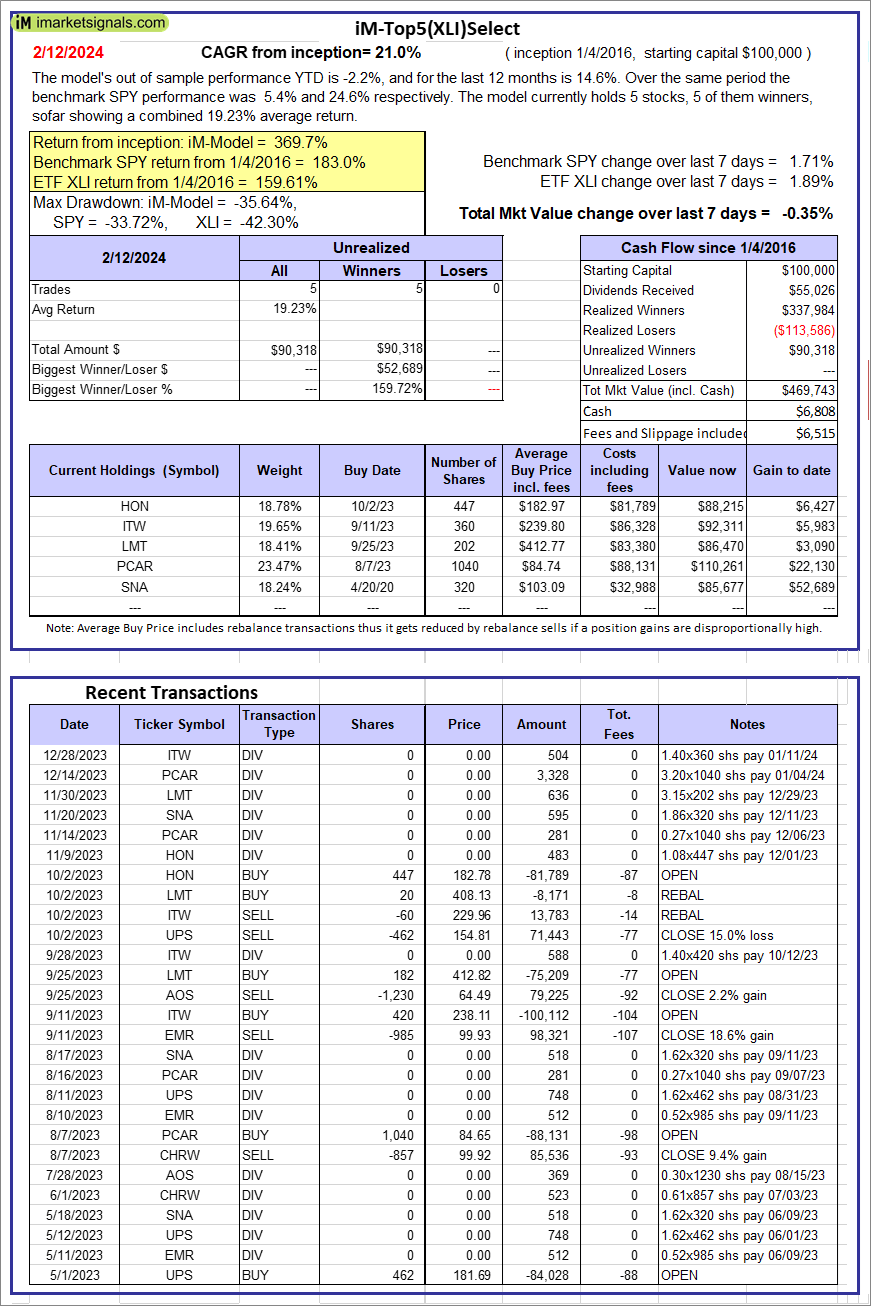 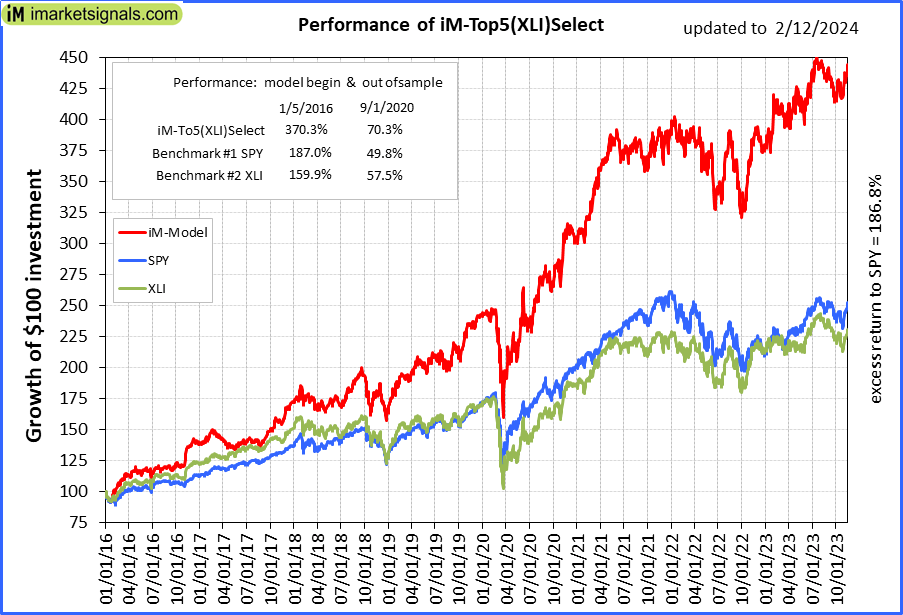 |
iM-Top5(XLI)Select: Since inception, on 1/5/2016, the model gained 369.74% while the benchmark SPY gained 182.95% over the same period. Over the previous week the market value of iM-Top5(XLI)Select gained -0.35% at a time when SPY gained 1.71%. A starting capital of $100,000 at inception on 1/5/2016 would have grown to $469,743 which includes $6,808 cash and excludes $6,515 spent on fees and slippage. |
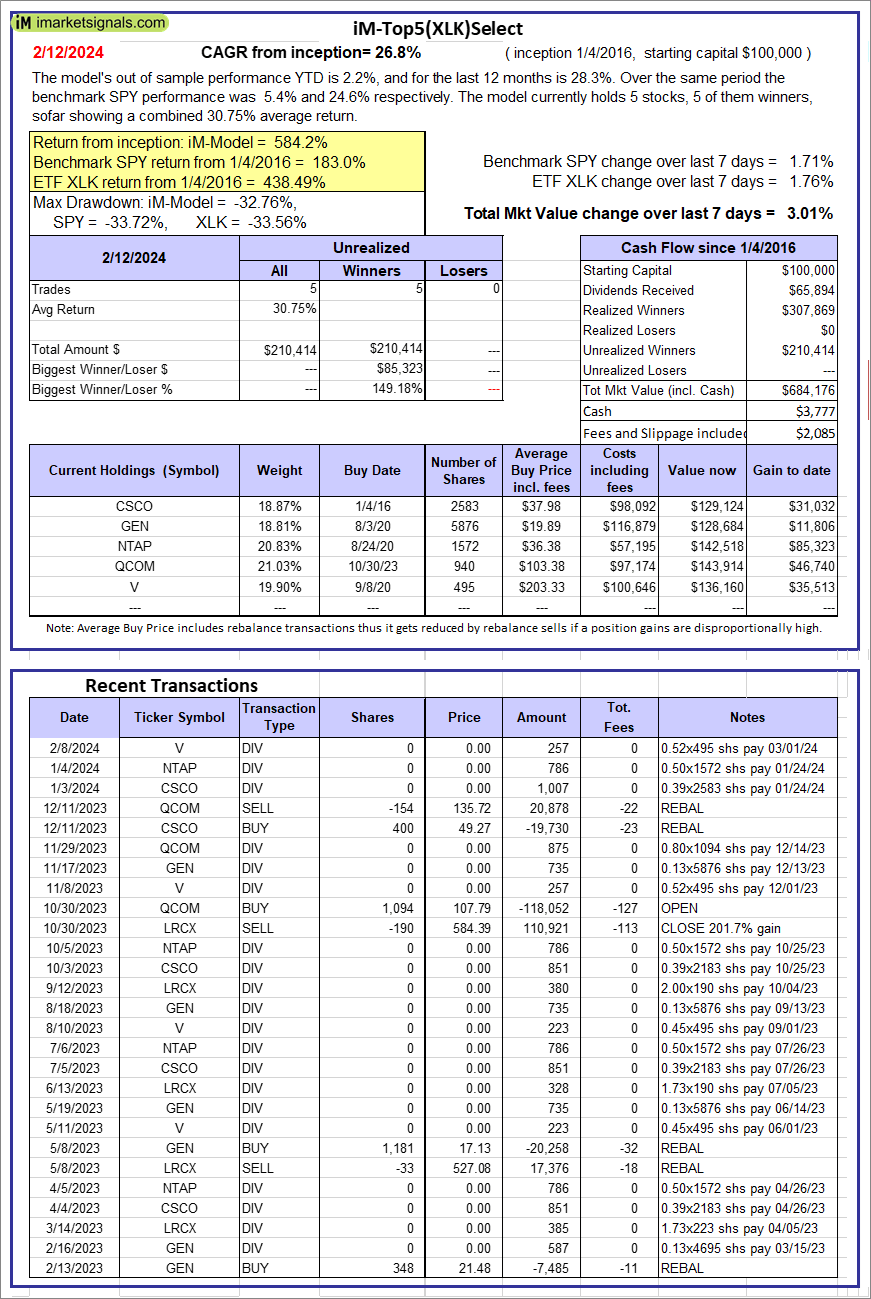 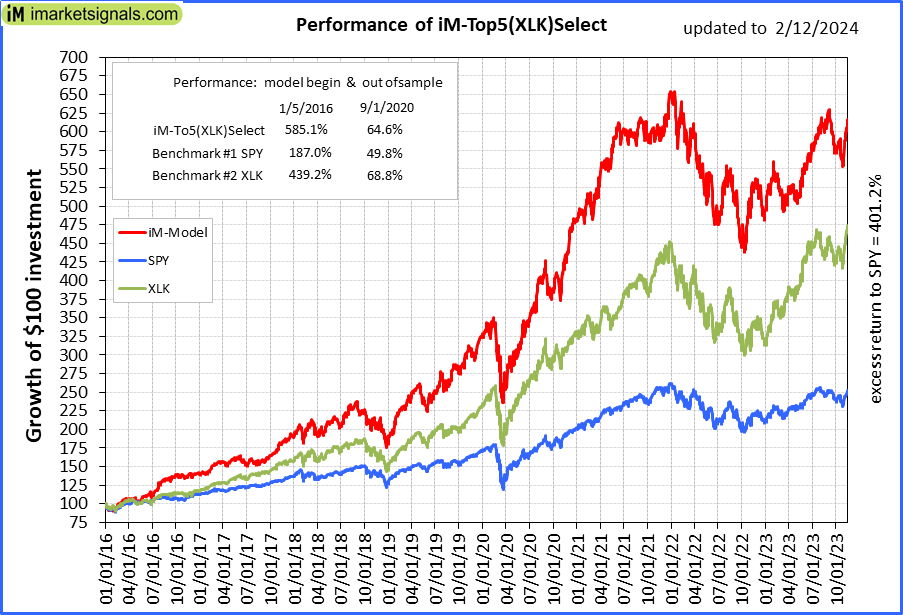 |
iM-Top5(XLK)Select: Since inception, on 1/5/2016, the model gained 584.18% while the benchmark SPY gained 182.95% over the same period. Over the previous week the market value of iM-Top5(XLK)Select gained 3.01% at a time when SPY gained 1.71%. A starting capital of $100,000 at inception on 1/5/2016 would have grown to $684,176 which includes $3,777 cash and excludes $2,085 spent on fees and slippage. |
 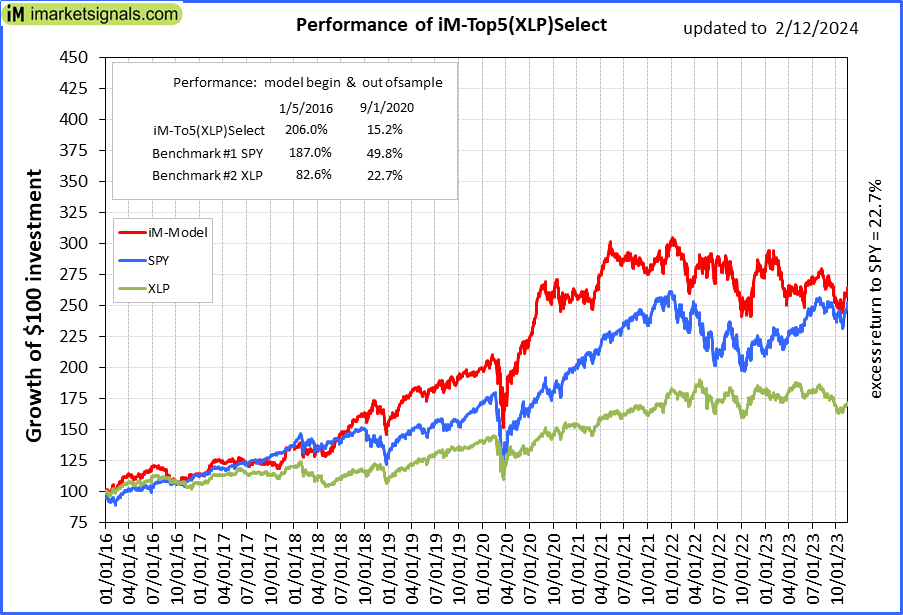 |
iM-Top5(XLP)Select: Since inception, on 1/5/2016, the model gained 205.68% while the benchmark SPY gained 182.95% over the same period. Over the previous week the market value of iM-Top5(XLP)Select gained 1.80% at a time when SPY gained 1.71%. A starting capital of $100,000 at inception on 1/5/2016 would have grown to $305,677 which includes $1,345 cash and excludes $2,046 spent on fees and slippage. |
 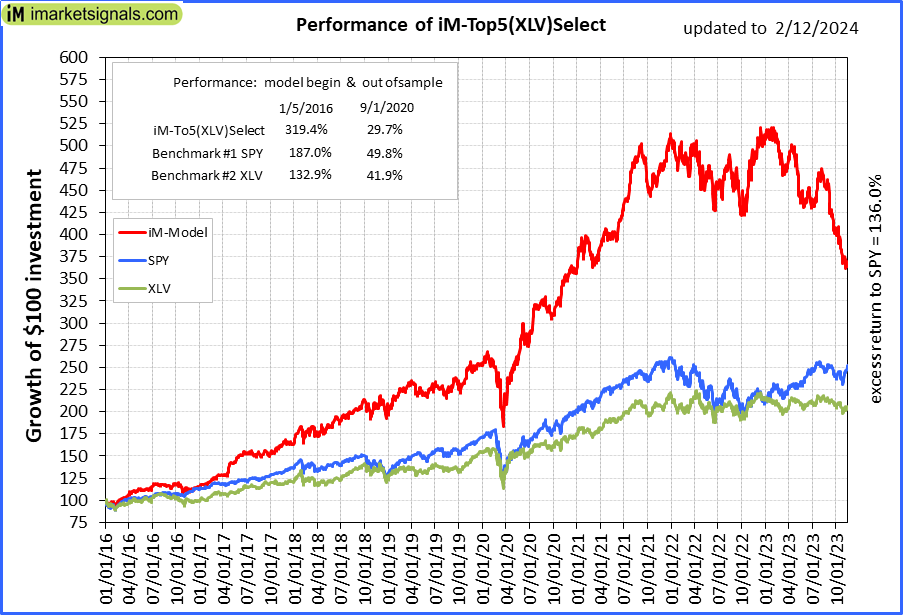 |
iM-Top5(XLV)Select: Since inception, on 1/5/2016, the model gained 318.98% while the benchmark SPY gained 182.95% over the same period. Over the previous week the market value of iM-Top5(XLV)Select gained 0.51% at a time when SPY gained 1.71%. A starting capital of $100,000 at inception on 1/5/2016 would have grown to $418,976 which includes $6,798 cash and excludes $12,285 spent on fees and slippage. |
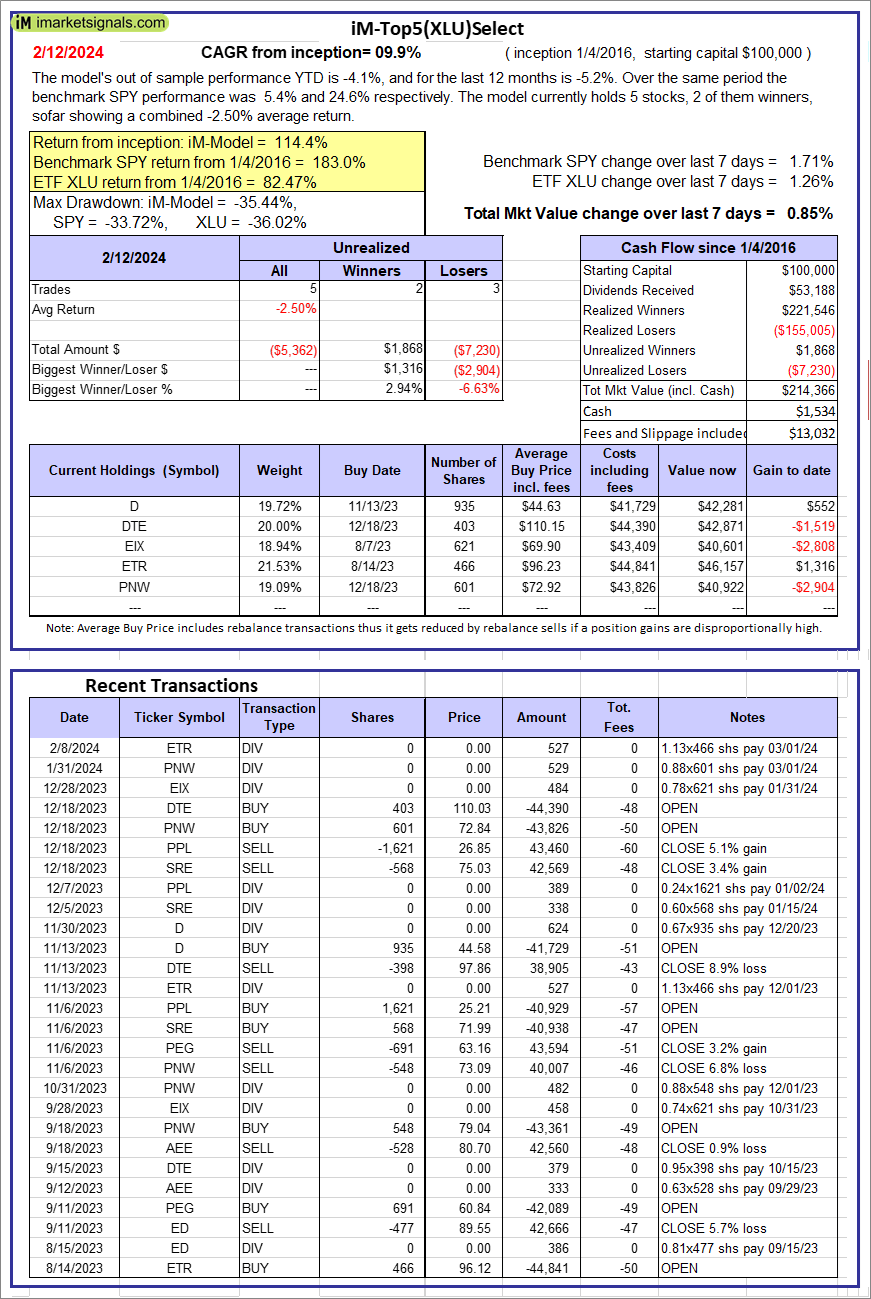  |
iM-Top5(XLU)Select: Since inception, on 1/5/2016, the model gained 114.37% while the benchmark SPY gained 182.95% over the same period. Over the previous week the market value of iM-Top5(XLU)Select gained 0.85% at a time when SPY gained 1.71%. A starting capital of $100,000 at inception on 1/5/2016 would have grown to $214,366 which includes $1,534 cash and excludes $13,032 spent on fees and slippage. |
  |
iM-Top5(XLY)Select: Since inception, on 1/5/2016, the model gained 275.82% while the benchmark SPY gained 182.95% over the same period. Over the previous week the market value of iM-Top5(XLY)Select gained 2.18% at a time when SPY gained 1.71%. A starting capital of $100,000 at inception on 1/5/2016 would have grown to $375,820 which includes -$112 cash and excludes $6,175 spent on fees and slippage. |
 |
iM-Seasonal Super-Sectors (Top5 combo) : Since inception, on 11/17/2020, the model gained 55.38% while the benchmark SPY gained 46.88% over the same period. Over the previous week the market value of iM-Seasonal Super-Sectors (Top5 combo) gained 0.97% at a time when SPY gained 1.71%. A starting capital of $100,000 at inception on 11/17/2020 would have grown to $155,382 which includes $12,481 cash and excludes $00 spent on fees and slippage. |
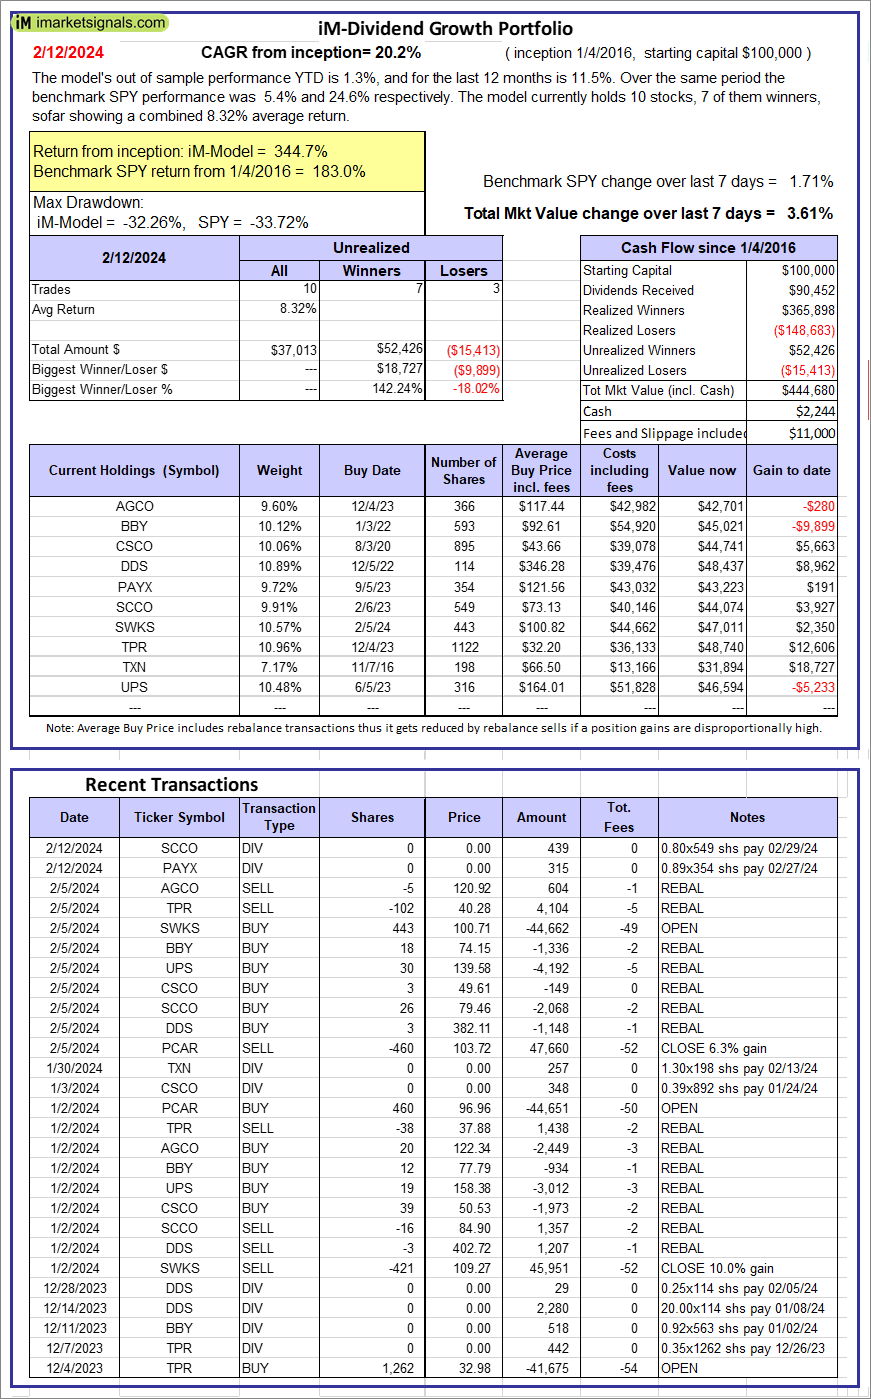 |
iM-Dividend Growth Portfolio: The model’s out of sample performance YTD is 1.3%, and for the last 12 months is 11.5%. Over the same period the benchmark SPY performance was 5.4% and 24.6% respectively. Over the previous week the market value of the iM-Dividend Growth Portfolio gained 3.61% at a time when SPY gained 1.71%. A starting capital of $100,000 at inception on 6/30/2016 would have grown to $444,680 which includes $2,244 cash and excludes $11,000 spent on fees and slippage. |
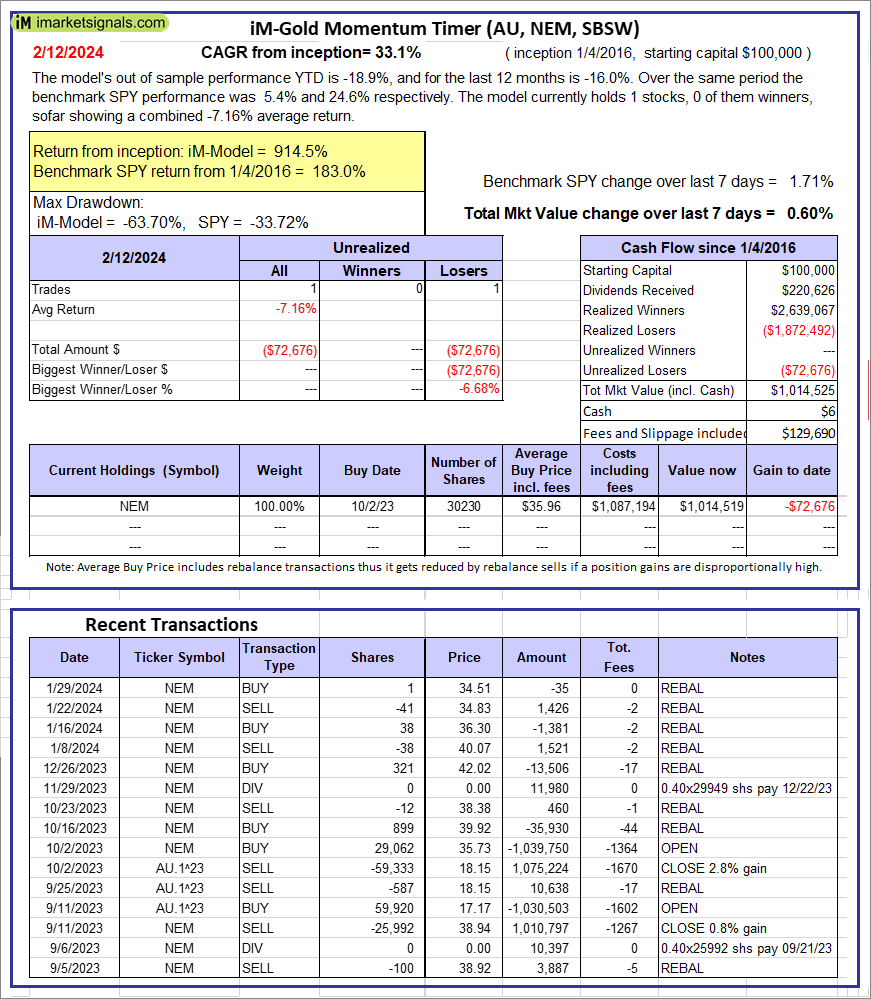 |
iM-Gold Momentum Timer (AU, NEM, SBSW): The model’s out of sample performance YTD is -18.9%, and for the last 12 months is -16.0%. Over the same period the benchmark SPY performance was 5.4% and 24.6% respectively. Over the previous week the market value of iM-Gold Momentum Timer (AU, NEM, SBSW) gained 0.60% at a time when SPY gained 1.71%. A starting capital of $100,000 at inception on 6/30/2016 would have grown to $06 which includes $129,690 cash and excludes Gain to date spent on fees and slippage. |
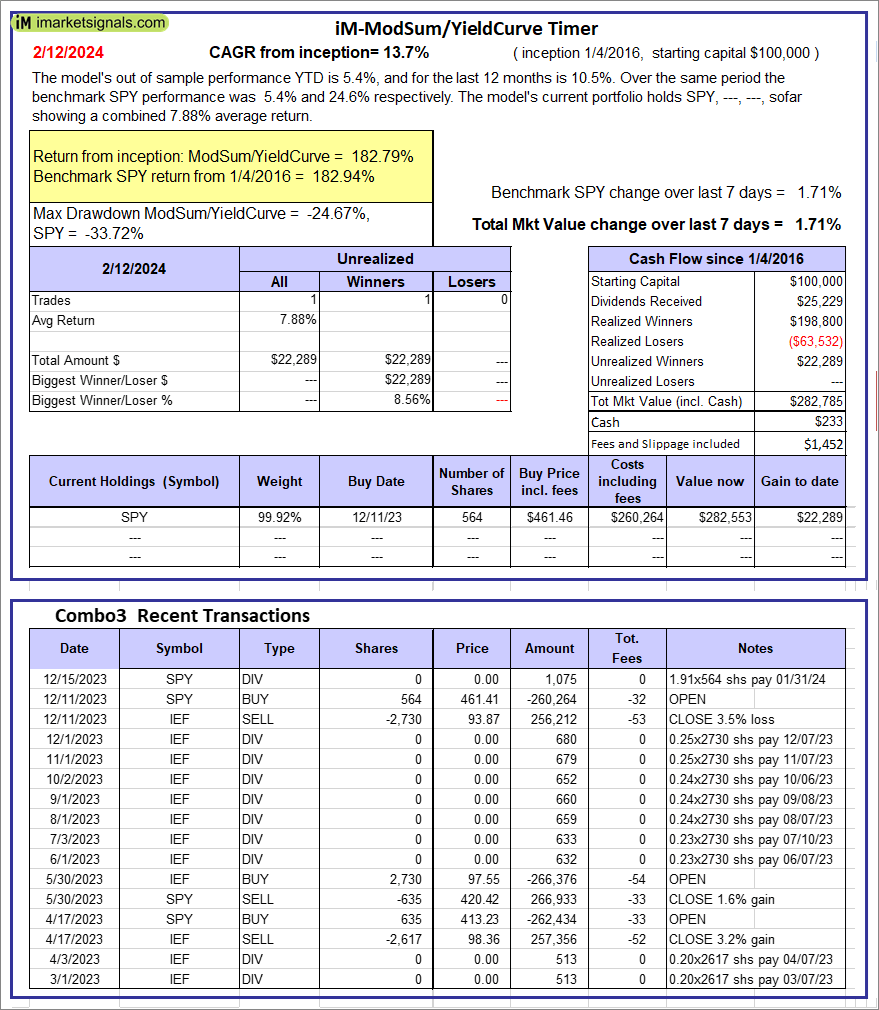 |
iM-ModSum/YieldCurve Timer: The model’s out of sample performance YTD is 5.4%, and for the last 12 months is 10.5%. Over the same period the benchmark SPY performance was 5.4% and 24.6% respectively. Over the previous week the market value of iM-PortSum/YieldCurve Timer gained 1.71% at a time when SPY gained 1.71%. A starting capital of $100,000 at inception on 1/1/2016 would have grown to $282,785 which includes $233 cash and excludes $1,452 spent on fees and slippage. |
 |
iM-Best(SPY-SH).R1: The model’s out of sample performance YTD is 5.4%, and for the last 12 months is -3.7%. Over the same period the benchmark SPY performance was 5.4% and 24.6% respectively. Over the previous week the market value of Best(SPY-SH) gained 1.72% at a time when SPY gained 1.71%. A starting capital of $100,000 at inception on 1/2/2009 would have grown to $60,774 which includes -$346 cash and excludes $2,553 spent on fees and slippage. |
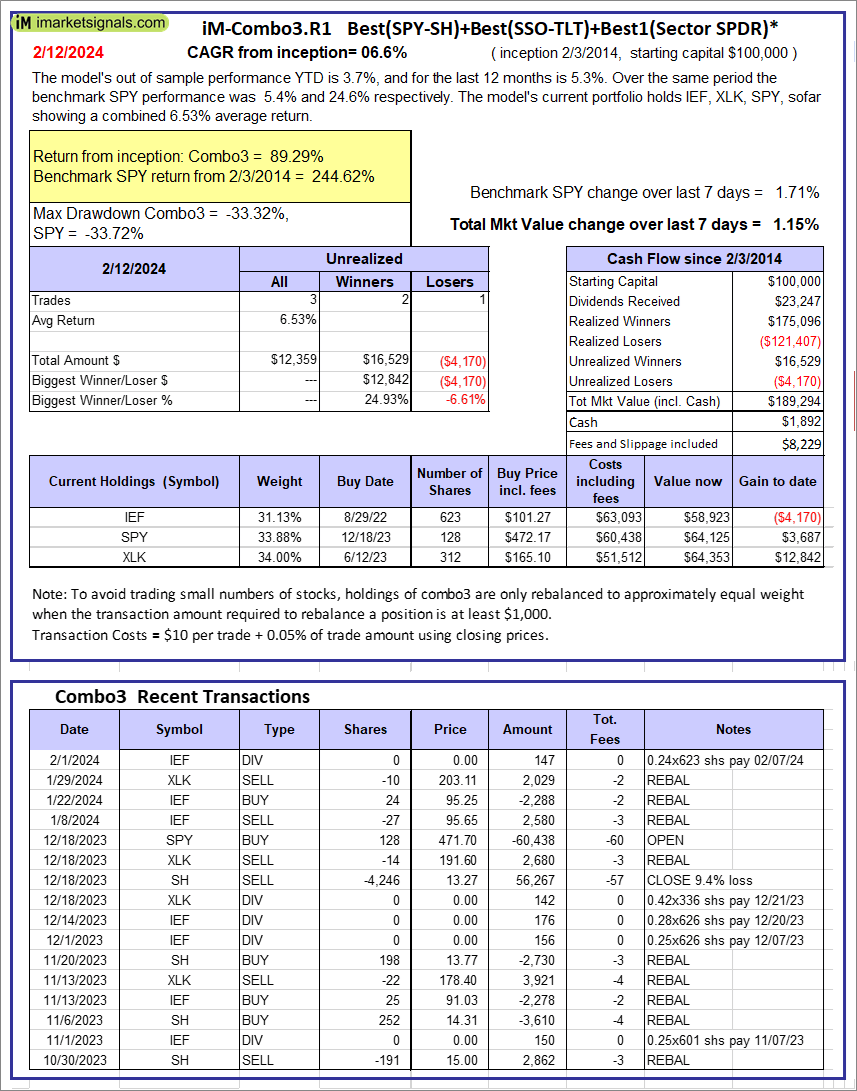 |
iM-Combo3.R1: The model’s out of sample performance YTD is 3.7%, and for the last 12 months is 5.3%. Over the same period the benchmark SPY performance was 5.4% and 24.6% respectively. Over the previous week the market value of iM-Combo3.R1 gained 1.15% at a time when SPY gained 1.71%. A starting capital of $100,000 at inception on 2/3/2014 would have grown to $189,294 which includes $1,892 cash and excludes $8,229 spent on fees and slippage. |
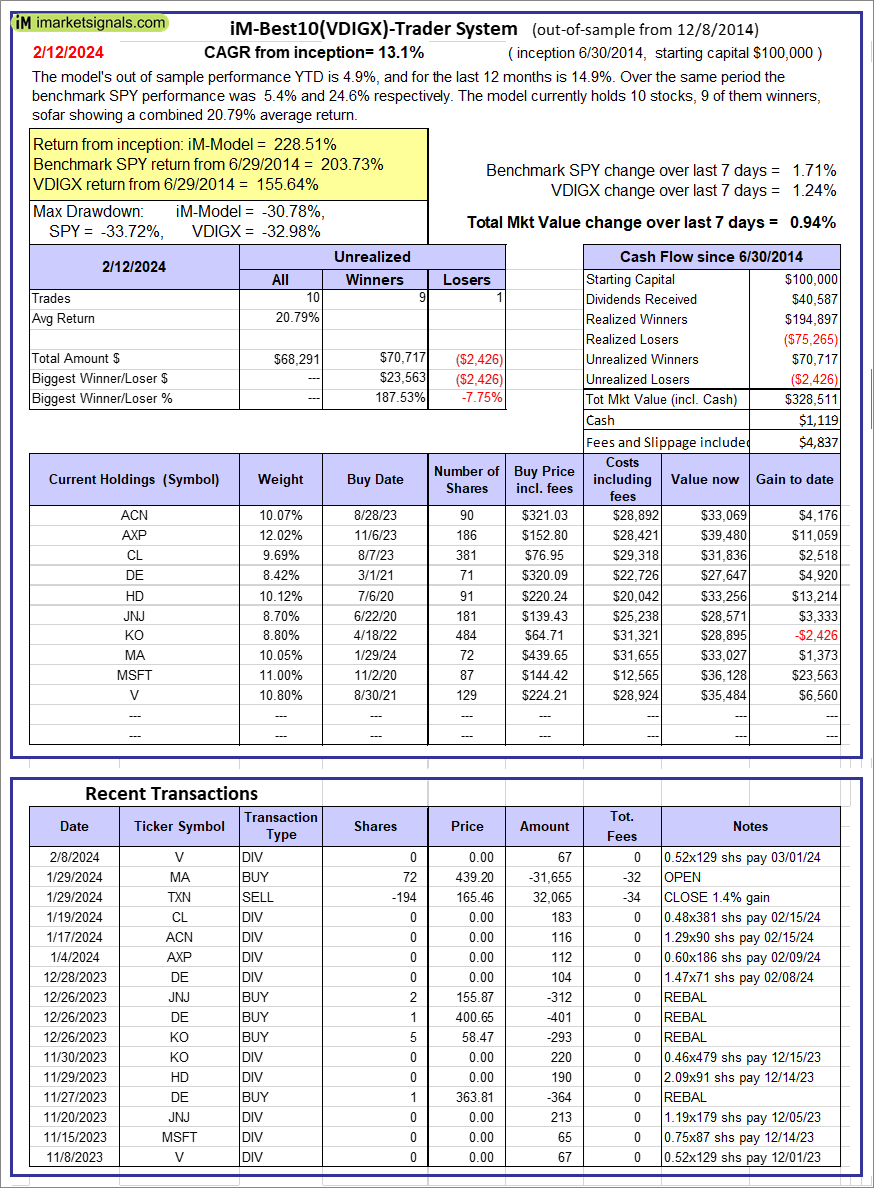 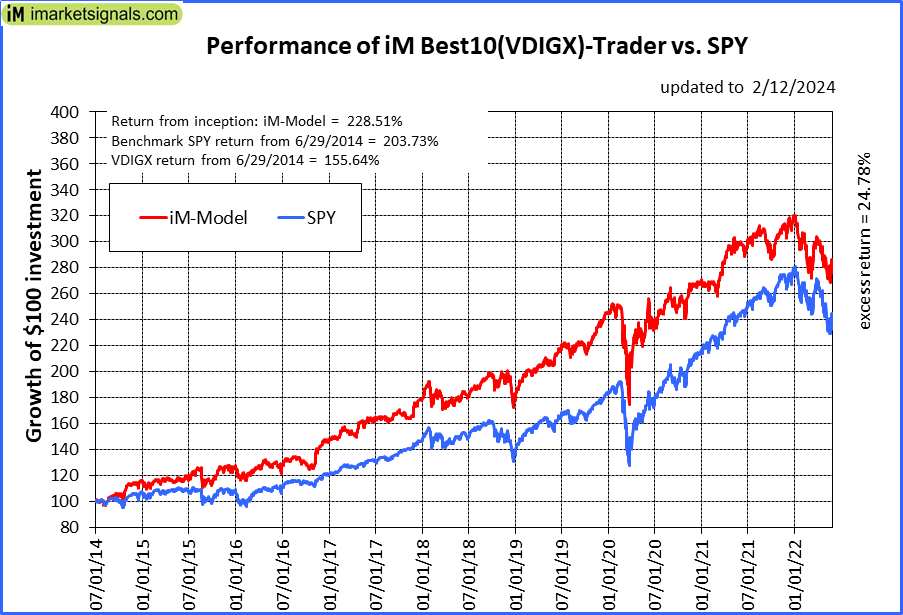 |
iM-Best10(VDIGX)-Trader: The model’s out of sample performance YTD is 4.9%, and for the last 12 months is 14.9%. Over the same period the benchmark SPY performance was 5.4% and 24.6% respectively. Since inception, on 7/1/2014, the model gained 228.51% while the benchmark SPY gained 203.73% and VDIGX gained 155.64% over the same period. Over the previous week the market value of iM-Best10(VDIGX) gained 0.94% at a time when SPY gained 1.71%. A starting capital of $100,000 at inception on 7/1/2014 would have grown to $328,511 which includes $1,119 cash and excludes $4,837 spent on fees and slippage. |
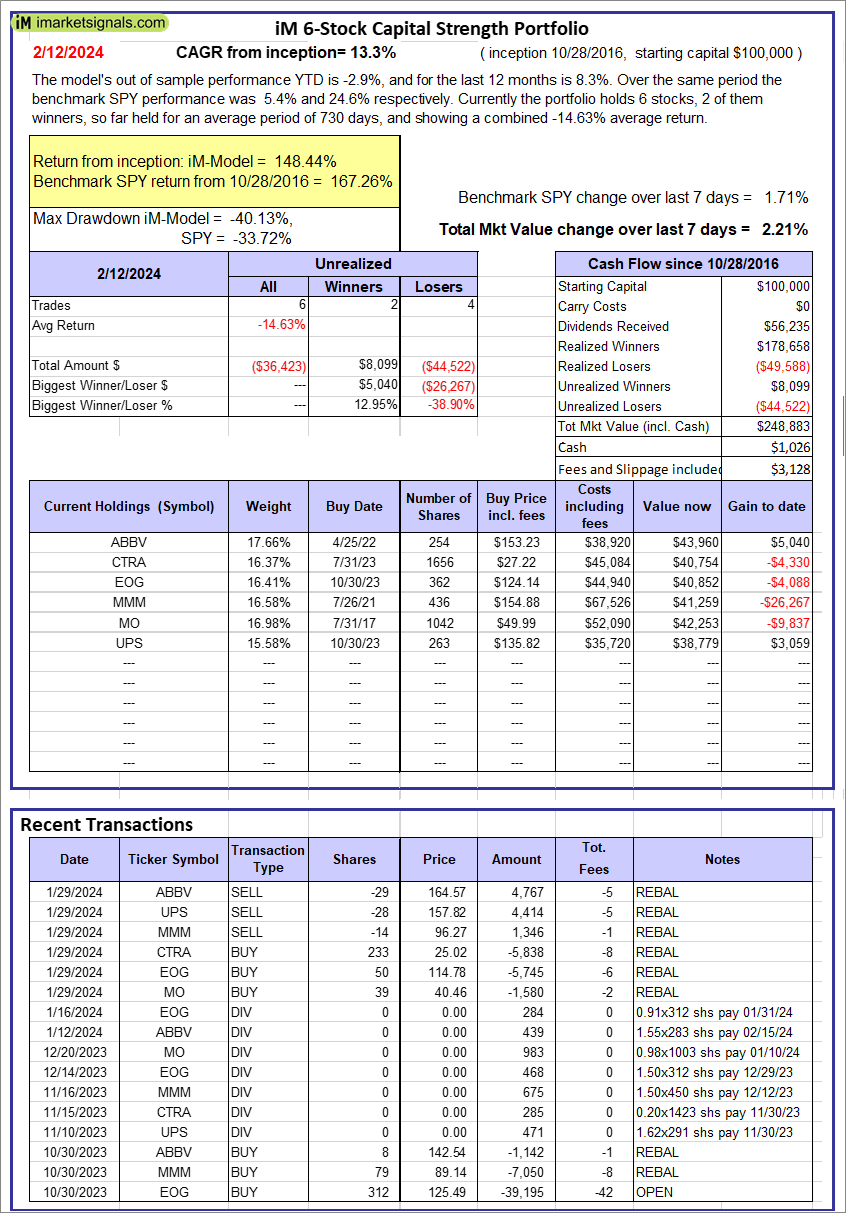 |
iM 6-Stock Capital Strength Portfolio: The model’s out of sample performance YTD is -2.9%, and for the last 12 months is 8.3%. Over the same period the benchmark SPY performance was 5.4% and 24.6% respectively. Over the previous week the market value of the iM 6-Stock Capital Strength Portfolio gained 2.21% at a time when SPY gained 1.71%. A starting capital of $100,000 at inception on 10/28/2016 would have grown to $248,883 which includes $1,026 cash and excludes $3,128 spent on fees and slippage. |
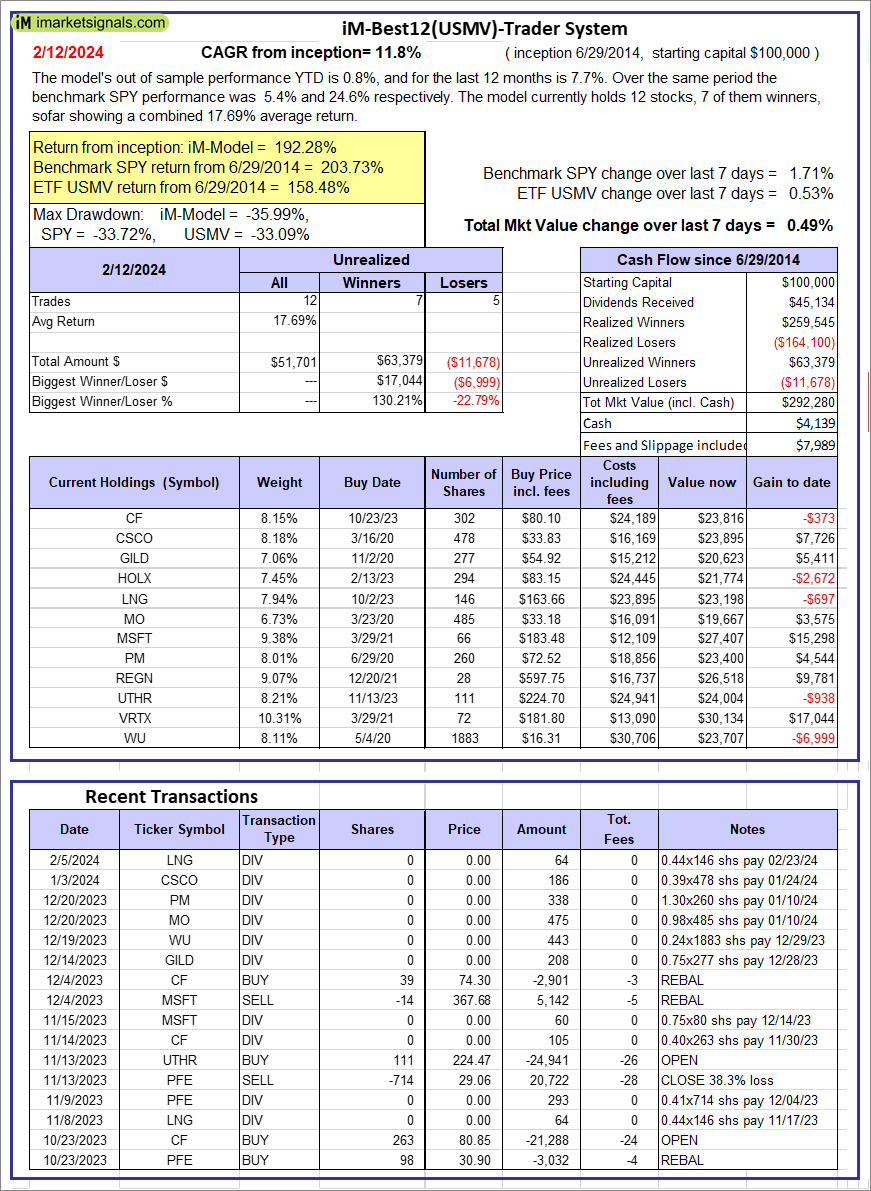 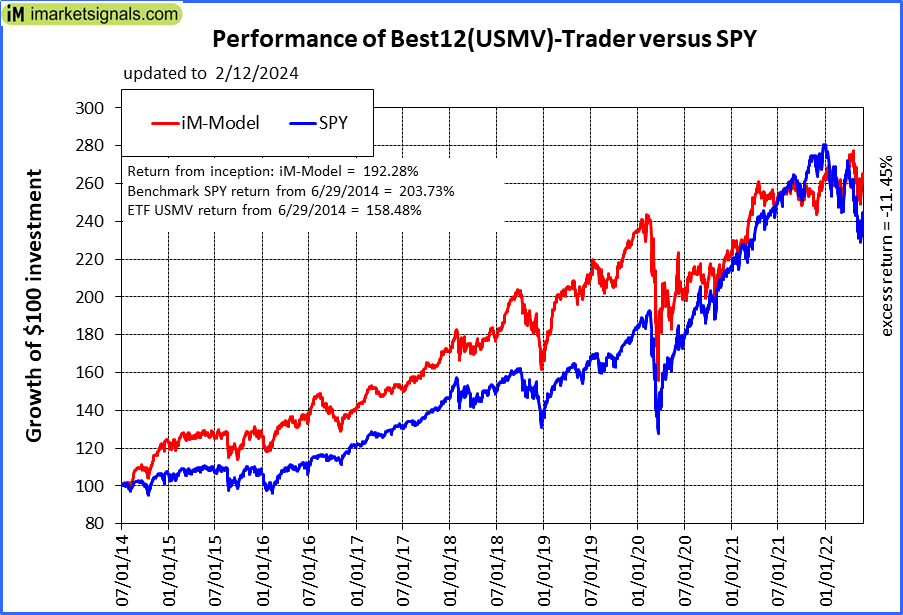 |
iM-Best12(USMV)-Trader: The model’s out of sample performance YTD is 0.8%, and for the last 12 months is 7.7%. Over the same period the benchmark SPY performance was 5.4% and 24.6% respectively. Since inception, on 6/30/2014, the model gained 192.28% while the benchmark SPY gained 203.73% and the ETF USMV gained 158.48% over the same period. Over the previous week the market value of iM-Best12(USMV)-Trader gained 0.49% at a time when SPY gained 1.71%. A starting capital of $100,000 at inception on 6/30/2014 would have grown to $292,280 which includes $4,139 cash and excludes $7,989 spent on fees and slippage. |
 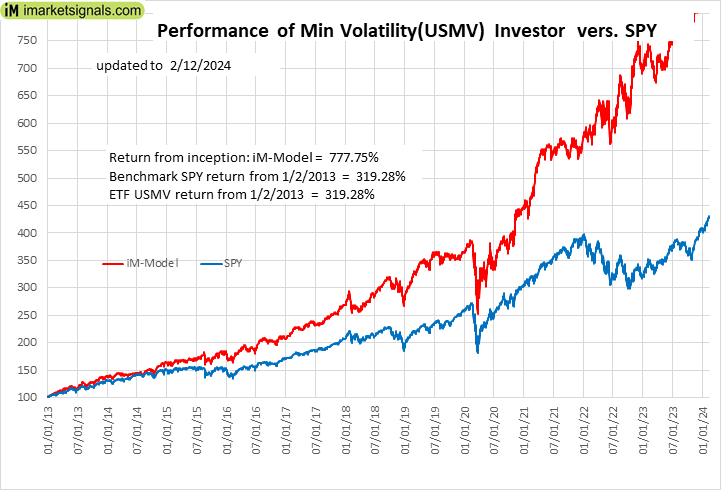 |
iM-Min Volatility(USMV) Investor (Tax Efficient): The model’s out of sample performance YTD is 2.8%, and for the last 12 months is 19.2%. Over the same period the benchmark SPY performance was 5.4% and 24.6% respectively. Since inception, on 1/3/2013, the model gained 777.75% while the benchmark SPY gained 319.28% and the ETF USMV gained 319.28% over the same period. Over the previous week the market value of iM-Best12(USMV)Q1 gained 1.09% at a time when SPY gained 1.71%. A starting capital of $100,000 at inception on 1/3/2013 would have grown to $877,749 which includes $2,266 cash and excludes $9,140 spent on fees and slippage. |
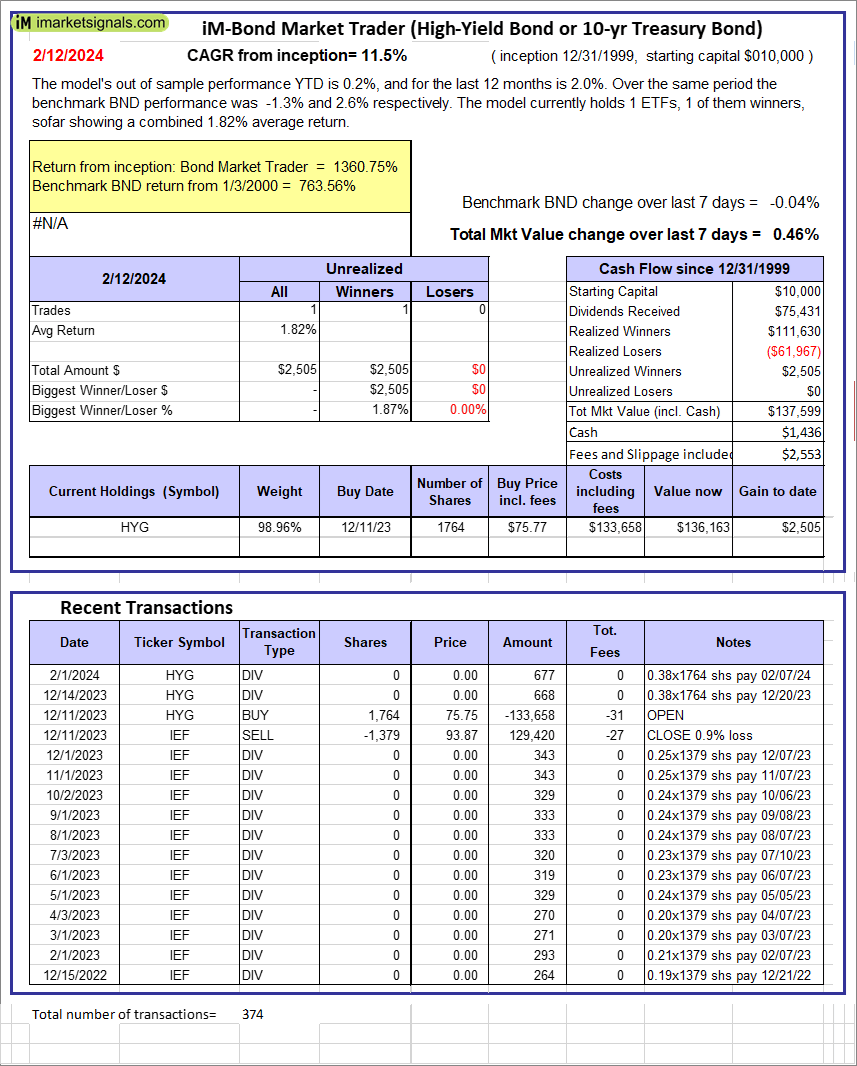 |
iM-Bond Market Trader (High-Yield Bond or 10-yr Treasury Bond): The model’s out of sample performance YTD is 0.2%, and for the last 12 months is 2.0%. Over the same period the benchmark BND performance was -1.3% and 2.6% respectively. Over the previous week the market value of the iM-Bond Market Trader (High-Yield Bond or 10-yr Treasury Bond) gained 0.46% at a time when BND gained -0.04%. A starting capital of $10,000 at inception on 1/3/2000 would have grown to $137,599 which includes $1,436 cash and excludes $2,553 spent on fees and slippage. |
|
|
iM-ModSum/YieldCurve Timer: The model’s out of sample performance YTD is 5.4%, and for the last 12 months is 10.5%. Over the same period the benchmark SPY performance was 5.4% and 24.6% respectively. Over the previous week the market value of iM-PortSum/YieldCurve Timer gained 1.71% at a time when SPY gained 1.71%. A starting capital of $100,000 at inception on 1/1/2016 would have grown to $282,785 which includes $233 cash and excludes $1,452 spent on fees and slippage. |
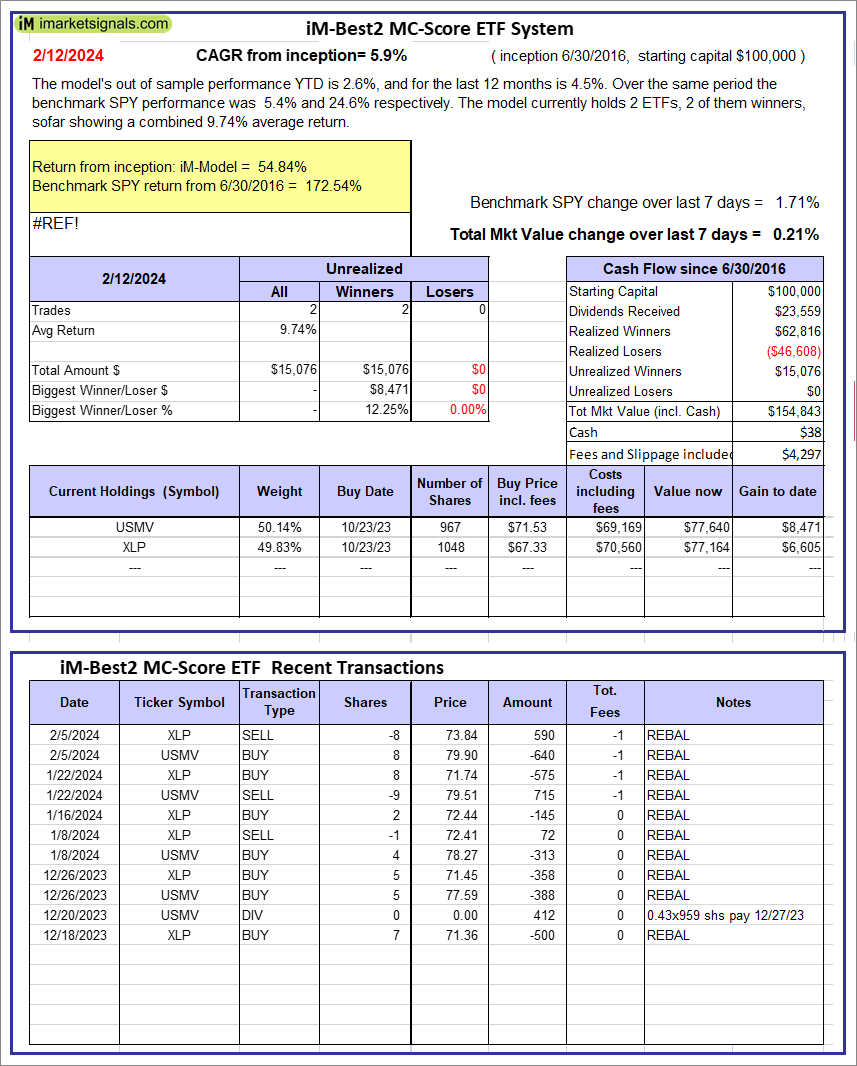 |
iM-Best2 MC-Score ETF System: The model’s out of sample performance YTD is 2.6%, and for the last 12 months is 4.5%. Over the same period the benchmark SPY performance was 5.4% and 24.6% respectively. Over the previous week the market value of the iM-Best2 MC-Score ETF System gained 0.21% at a time when SPY gained 1.71%. A starting capital of $100,000 at inception on 6/30/2016 would have grown to $154,843 which includes $38 cash and excludes $4,297 spent on fees and slippage. |
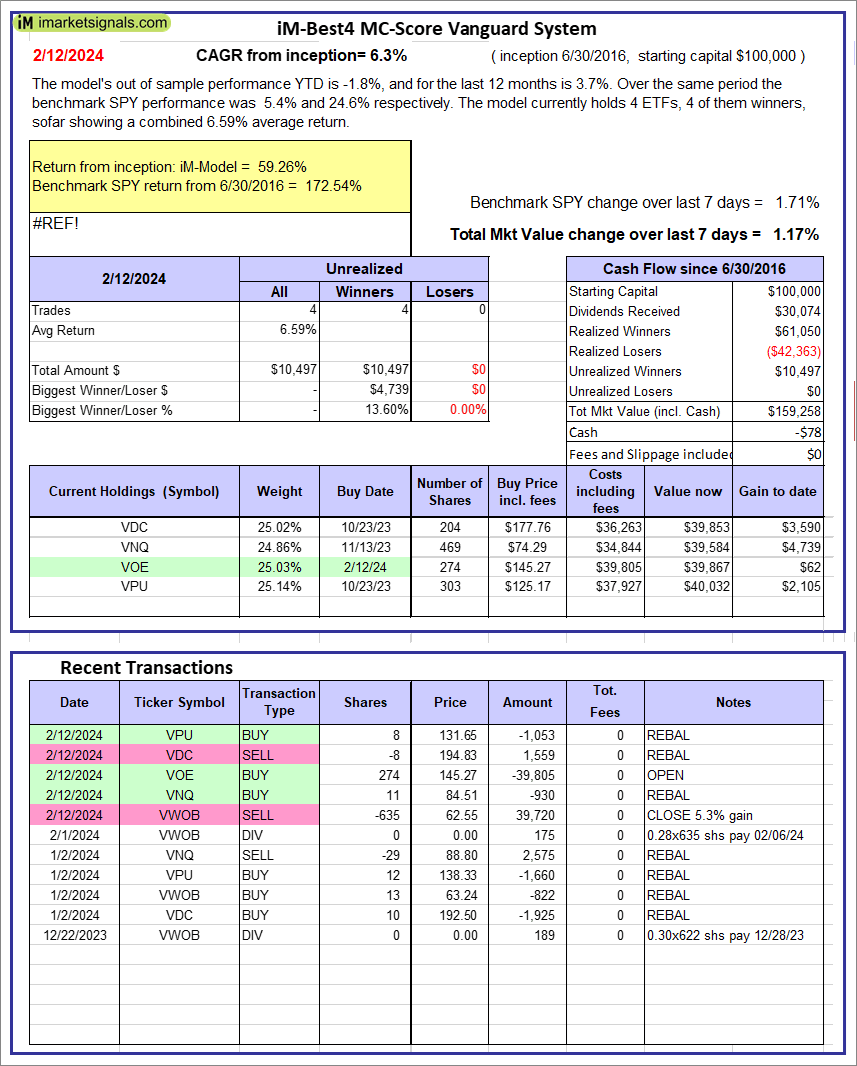 |
iM-Best4 MC-Score Vanguard System: The model’s out of sample performance YTD is -1.8%, and for the last 12 months is 3.7%. Over the same period the benchmark SPY performance was 5.4% and 24.6% respectively. Over the previous week the market value of the iM-Best4 MC-Score Vanguard System gained 1.17% at a time when SPY gained 1.71%. A starting capital of $100,000 at inception on 6/30/2016 would have grown to $159,258 which includes -$78 cash and excludes $00 spent on fees and slippage. |
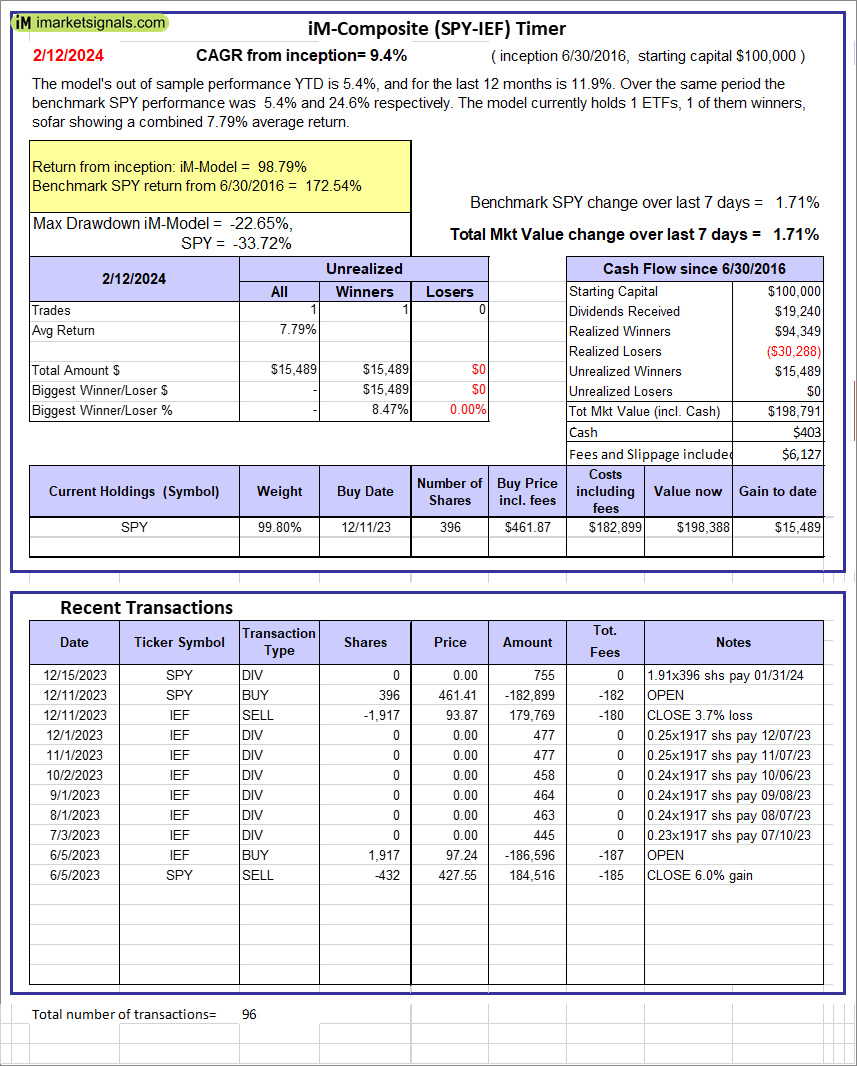 |
iM-Composite (SPY-IEF) Timer: The model’s out of sample performance YTD is 5.4%, and for the last 12 months is 11.9%. Over the same period the benchmark SPY performance was 5.4% and 24.6% respectively. Over the previous week the market value of the iM-Composite (SPY-IEF) Timer gained 1.71% at a time when SPY gained 1.71%. A starting capital of $100,000 at inception on 6/30/2016 would have grown to $198,791 which includes $403 cash and excludes $6,127 spent on fees and slippage. |
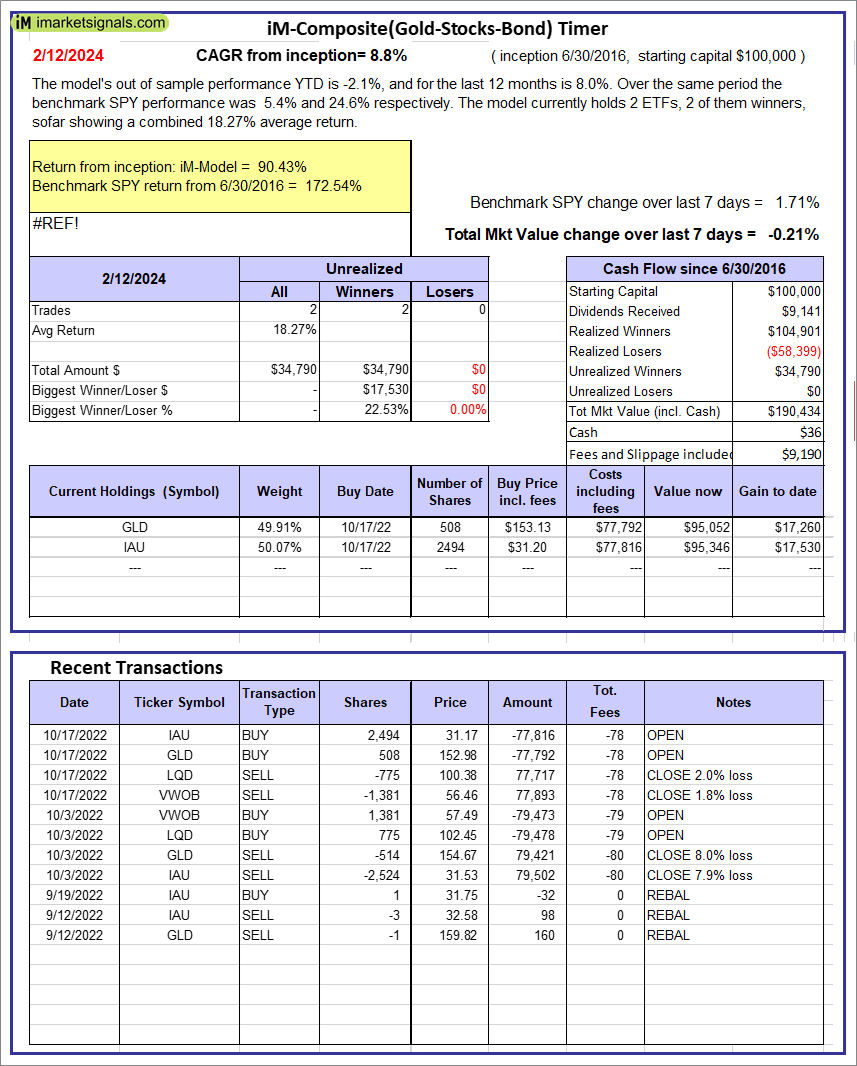 |
iM-Composite(Gold-Stocks-Bond) Timer: The model’s out of sample performance YTD is -2.1%, and for the last 12 months is 8.0%. Over the same period the benchmark SPY performance was 5.4% and 24.6% respectively. Over the previous week the market value of the iM-Composite(Gold-Stocks-Bond) Timer gained -0.21% at a time when SPY gained 1.71%. A starting capital of $100,000 at inception on 6/30/2016 would have grown to $190,434 which includes $36 cash and excludes $9,190 spent on fees and slippage. |
iM-Best Reports – 2/12/2024
Posted in pmp SPY-SH
Leave a Reply
You must be logged in to post a comment.