
  |
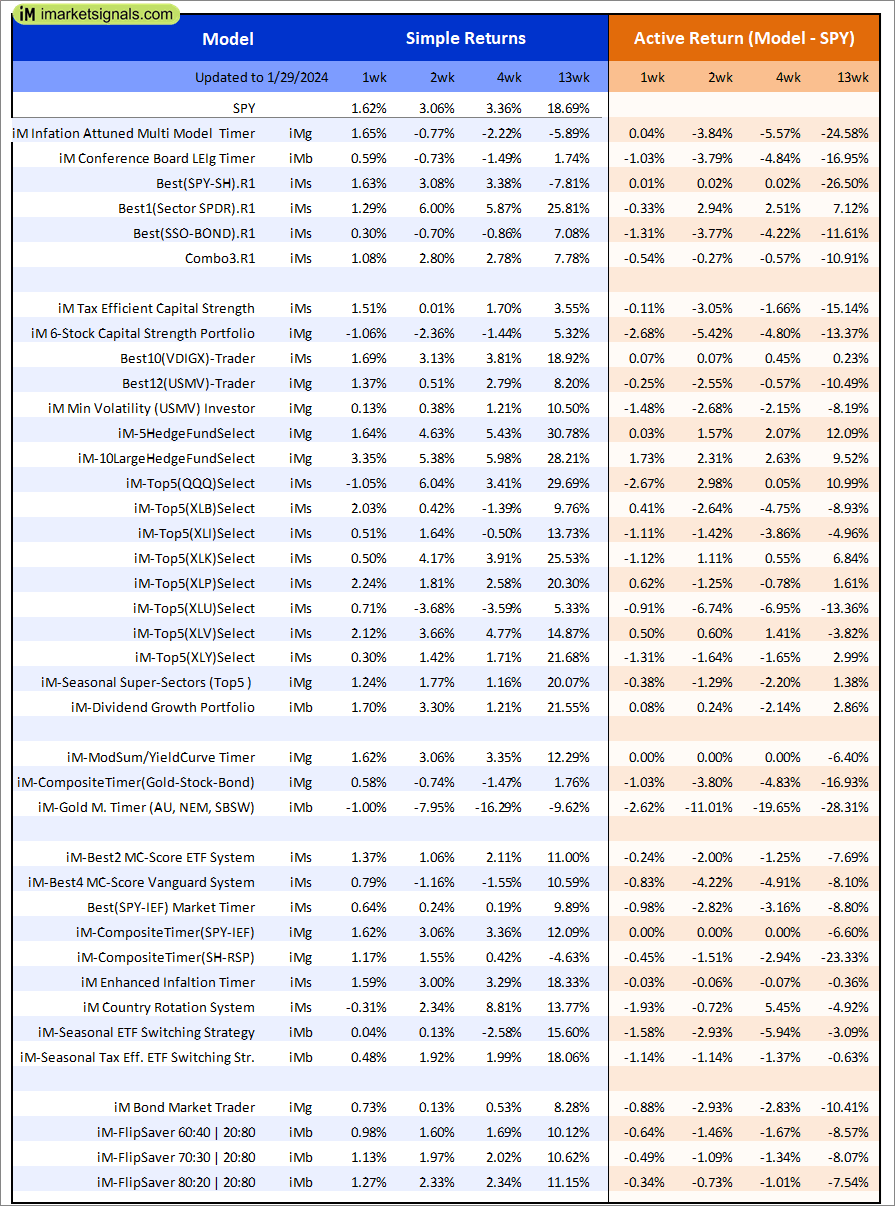
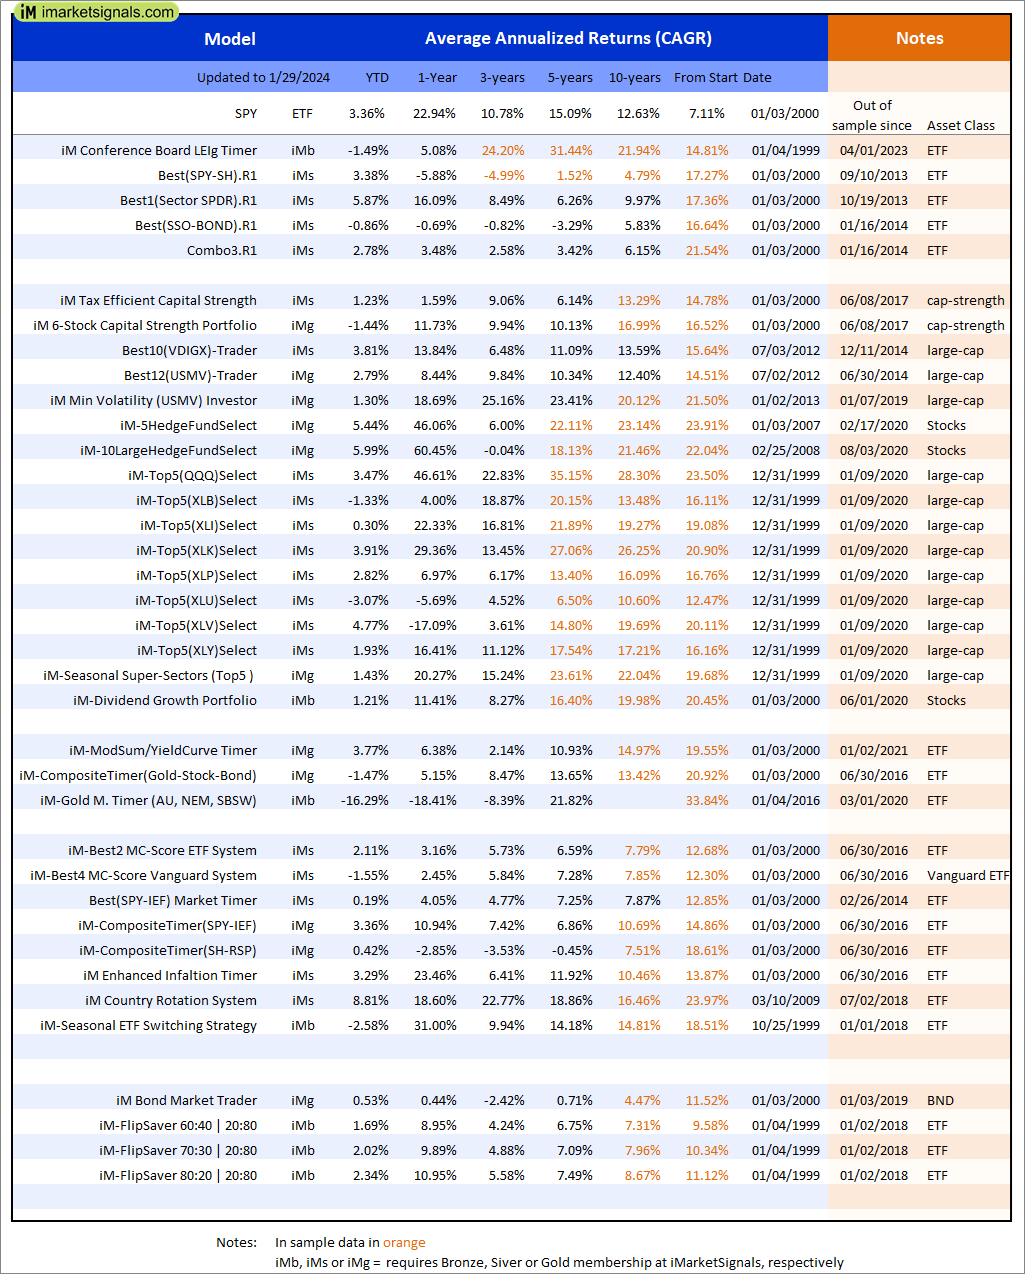
Out of sample performance summary of our models for the past 1, 2, 4 and 13 week periods. The active active return indicates how the models over- or underperformed the benchmark ETF SPY. Also the YTD, and the 1-, 3-, 5- and 10-year annualized returns are shown in the second table |
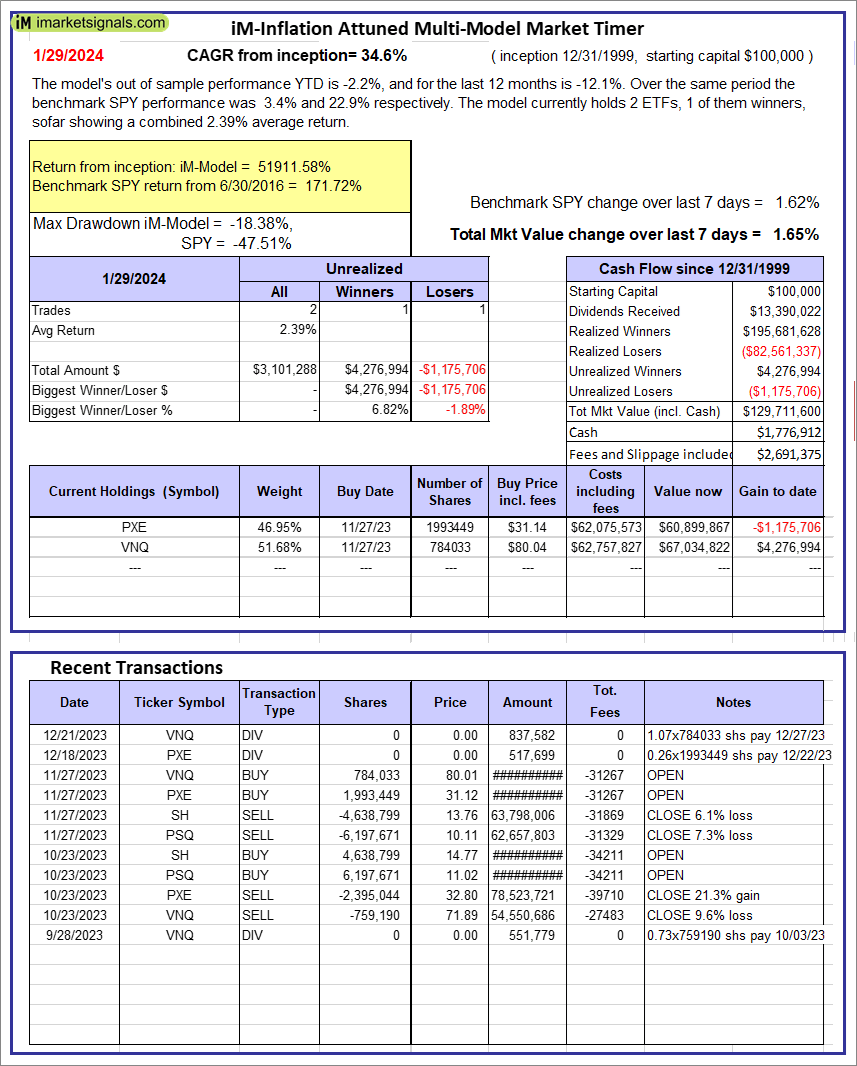 |
iM-Inflation Attuned Multi-Model Market Timer: The model’s out of sample performance YTD is -2.2%, and for the last 12 months is -12.1%. Over the same period the benchmark SPY performance was 3.4% and 22.9% respectively. Over the previous week the market value of the iM-Inflation Attuned Multi-Model Market Timer gained 1.65% at a time when SPY gained 1.62%. A starting capital of $100,000 at inception on 3/24/2017 would have grown to $129,711,600 which includes $1,776,912 cash and excludes $2,691,375 spent on fees and slippage. |
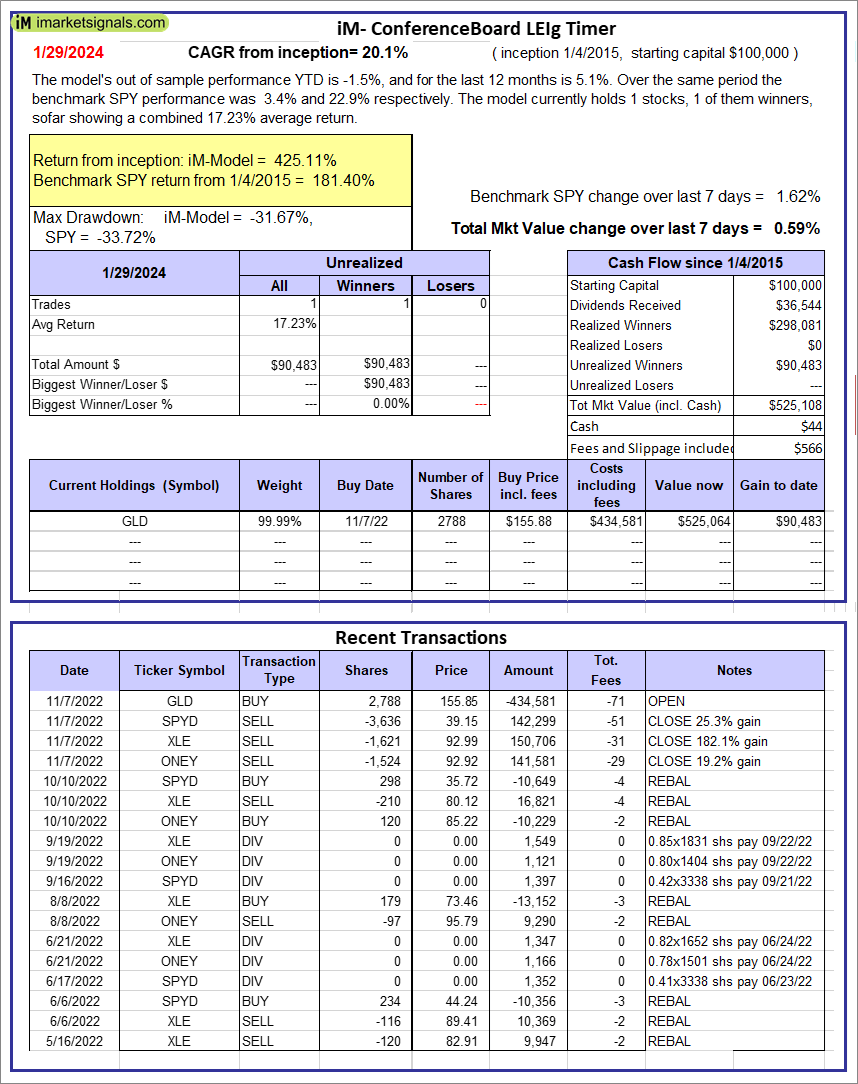 |
iM-Conference Board LEIg Timer: The model’s performance YTD is 14.3%, and for the last 12 months is 7.3%. Over the same period the benchmark SPY performance was 20.1% and 9.4% respectively. Over the previous week the market value of the iM-Conference Board LEIg Timer gained 0.59% at a time when SPY gained 1.62%. A starting capital of $100,000 at inception on 4/5/2017 would have grown to $525,108 which includes $44 cash and excludes $566 spent on fees and slippage. |
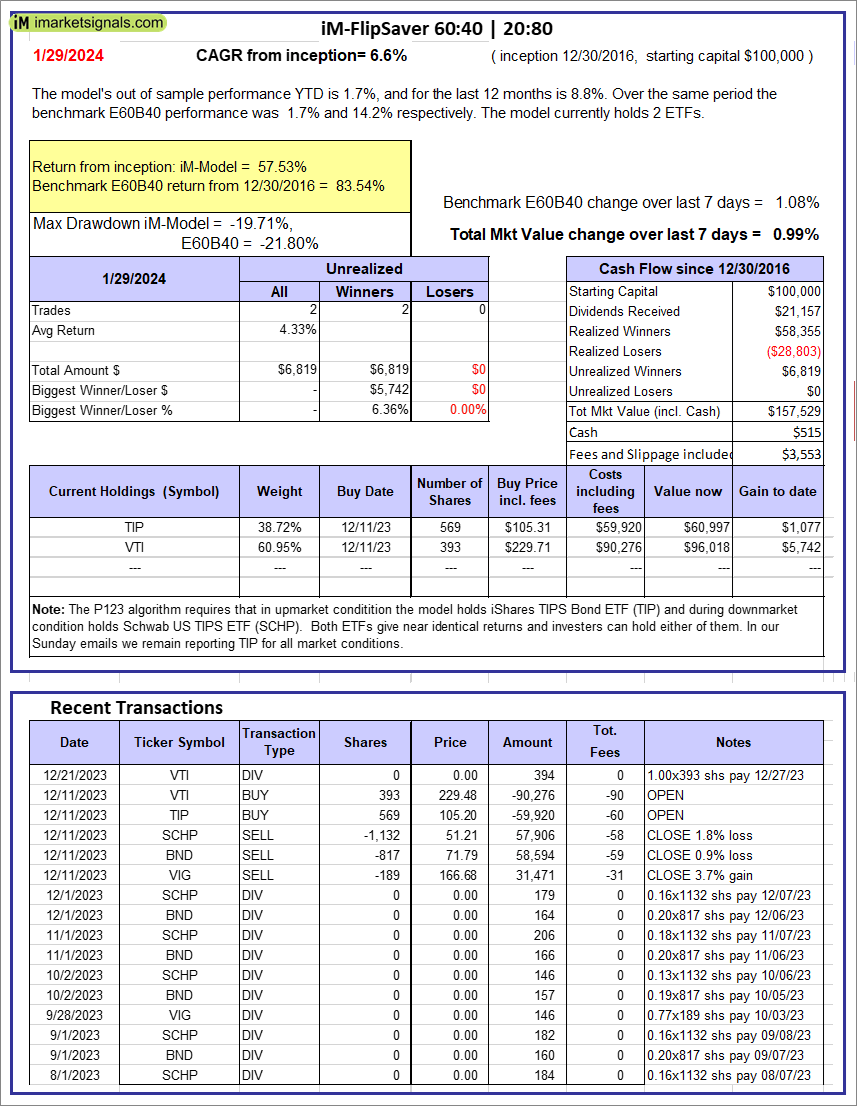 |
iM-FlipSaver 60:40 | 20:80 – 2017: The model’s out of sample performance YTD is 1.7%, and for the last 12 months is 8.8%. Over the same period the benchmark E60B40 performance was 1.7% and 14.2% respectively. Over the previous week the market value of iM-FlipSaver 80:20 | 20:80 gained 0.99% at a time when SPY gained 1.08%. A starting capital of $100,000 at inception on 7/16/2015 would have grown to $157,529 which includes $515 cash and excludes $3,553 spent on fees and slippage. |
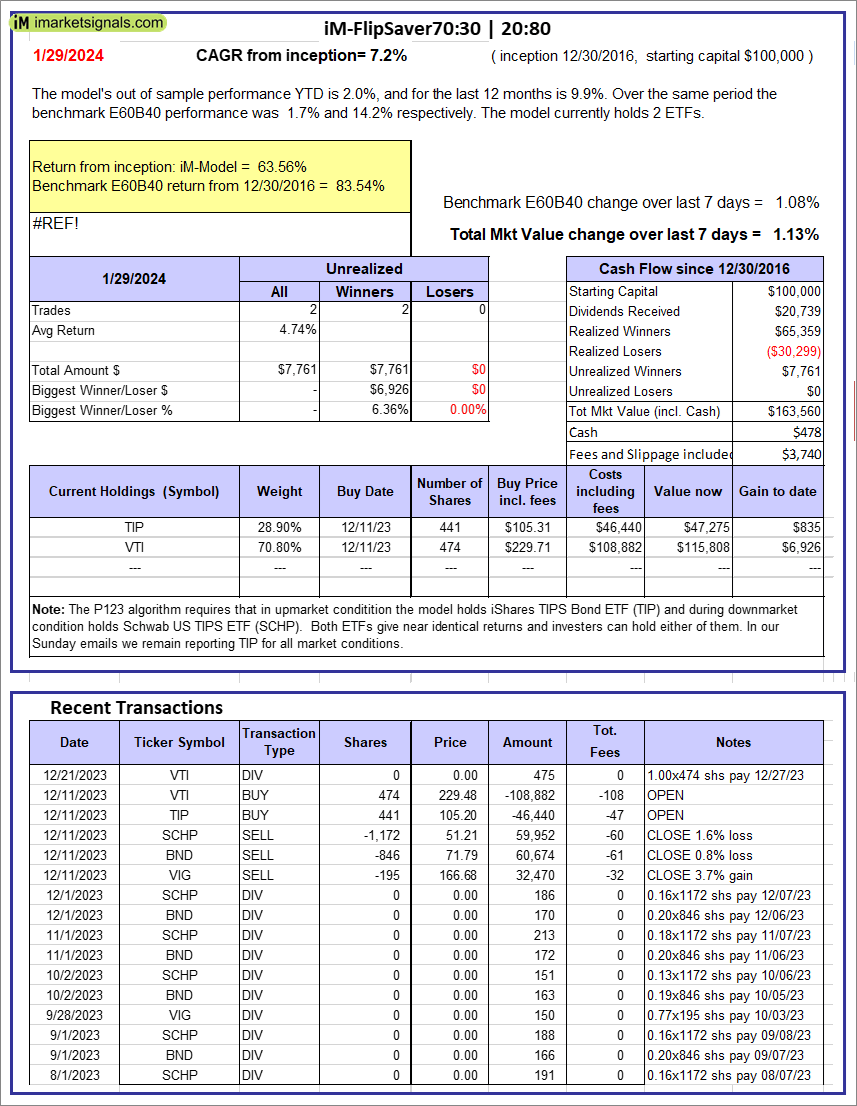 |
iM-FlipSaver 70:30 | 20:80 – 2017: The model’s out of sample performance YTD is 2.0%, and for the last 12 months is 9.9%. Over the same period the benchmark E60B40 performance was 1.7% and 14.2% respectively. Over the previous week the market value of iM-FlipSaver 70:30 | 20:80 gained 1.13% at a time when SPY gained 1.08%. A starting capital of $100,000 at inception on 7/15/2015 would have grown to $163,560 which includes $478 cash and excludes $3,740 spent on fees and slippage. |
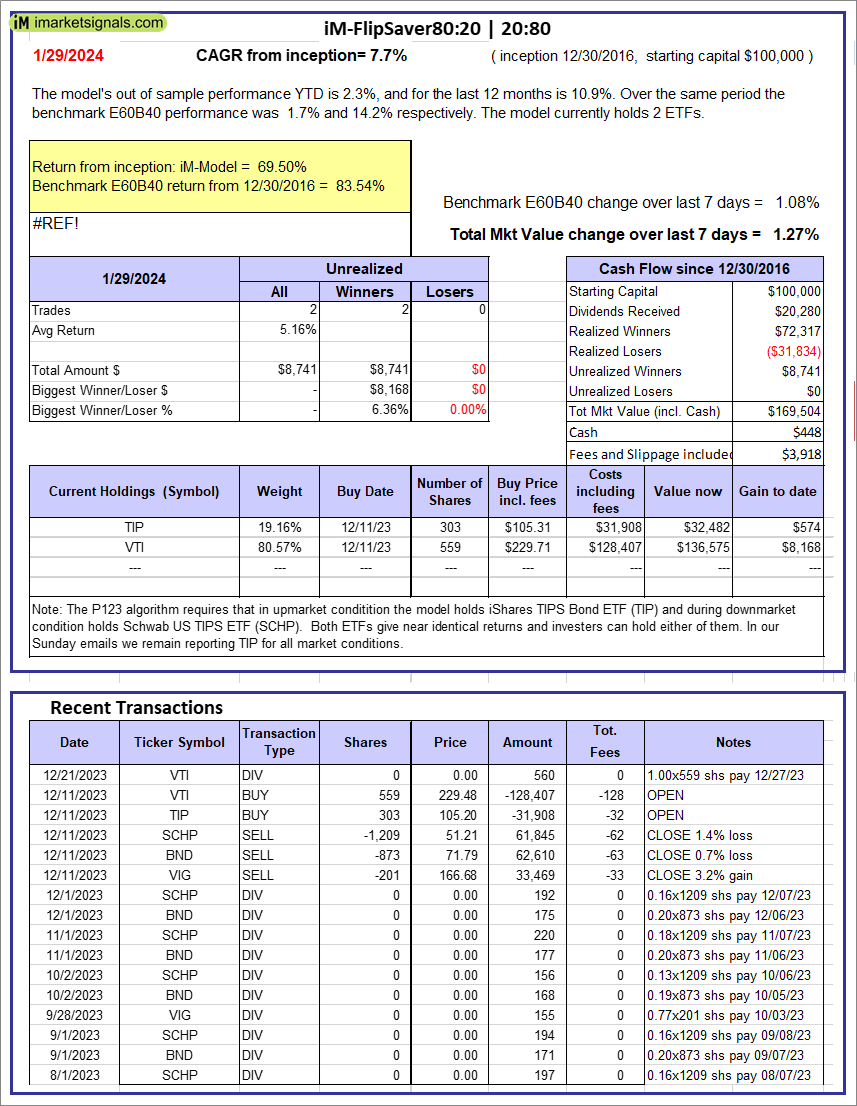 |
iM-FlipSaver 80:20 | 20:80 – 2017: The model’s out of sample performance YTD is 2.3%, and for the last 12 months is 10.9%. Over the same period the benchmark E60B40 performance was 1.7% and 14.2% respectively. Over the previous week the market value of iM-FlipSaver 80:20 | 20:80 gained 1.27% at a time when SPY gained 1.08%. A starting capital of $100,000 at inception on 1/2/2017 would have grown to $169,504 which includes $448 cash and excludes $3,918 spent on fees and slippage. |
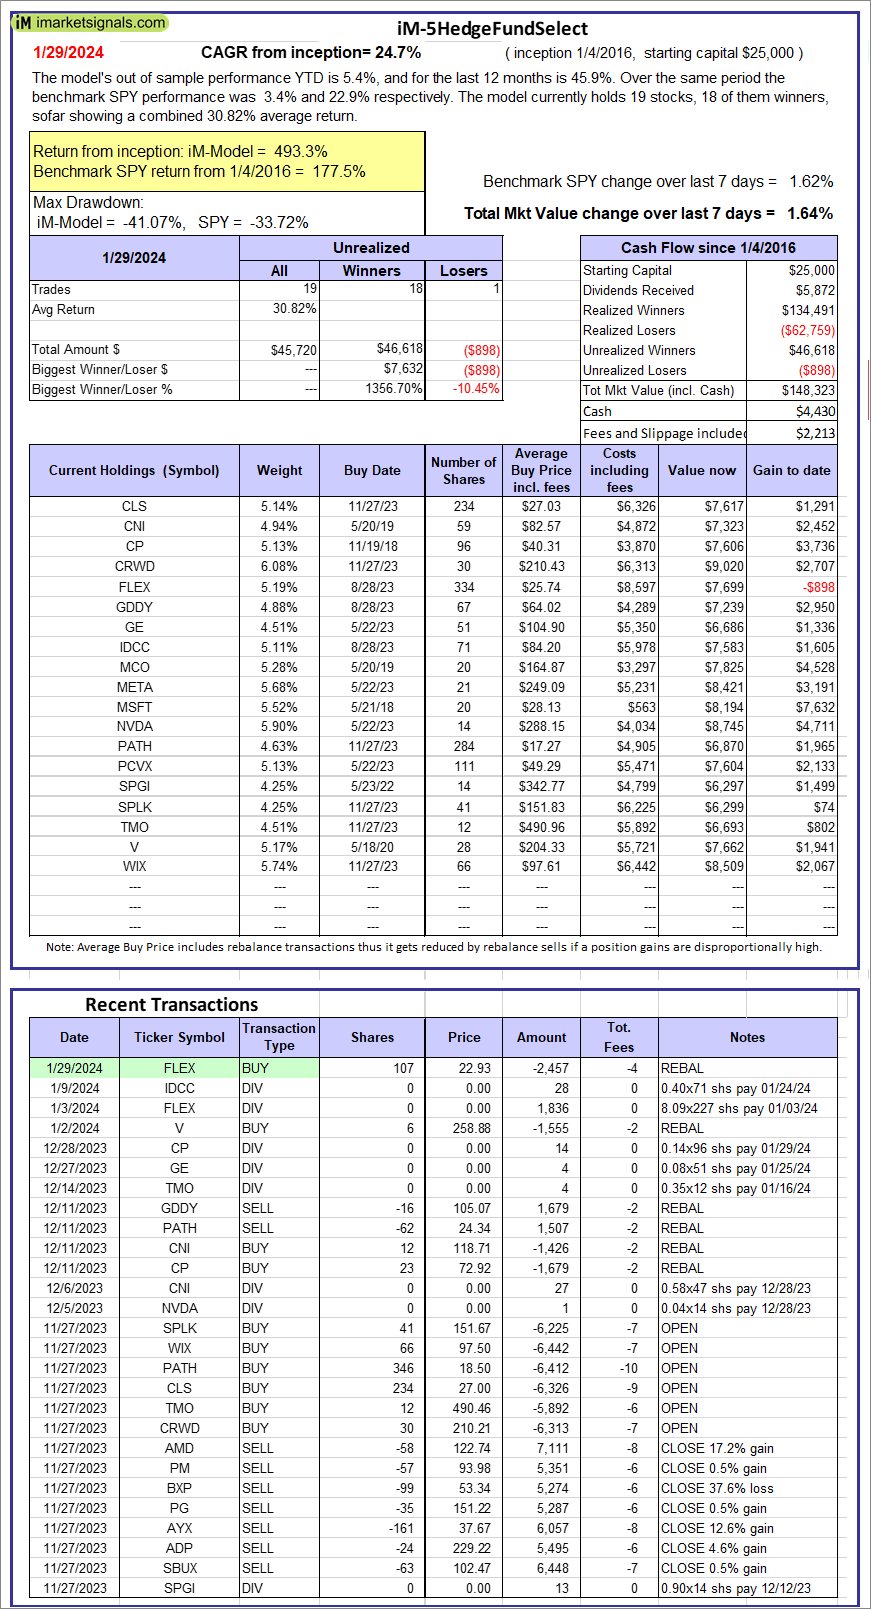 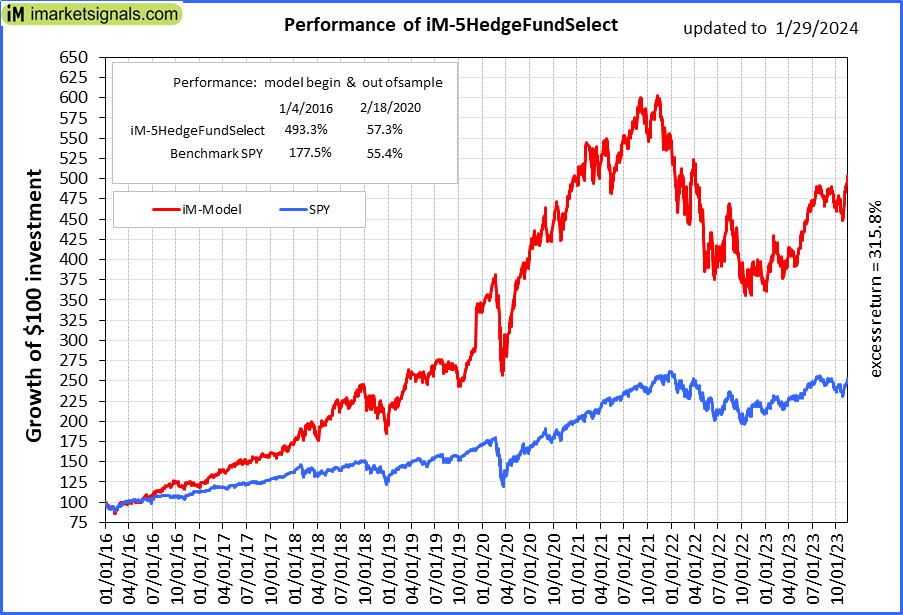 |
iM-5HedgeFundSelect: Since inception, on 1/5/2016, the model gained 493.29% while the benchmark SPY gained 177.46% over the same period. Over the previous week the market value of iM-5HedgeFundSelect gained 1.64% at a time when SPY gained 1.62%. A starting capital of $25,000 at inception on 1/5/2016 would have grown to $148,323 which includes $4,430 cash and excludes $2,213 spent on fees and slippage. |
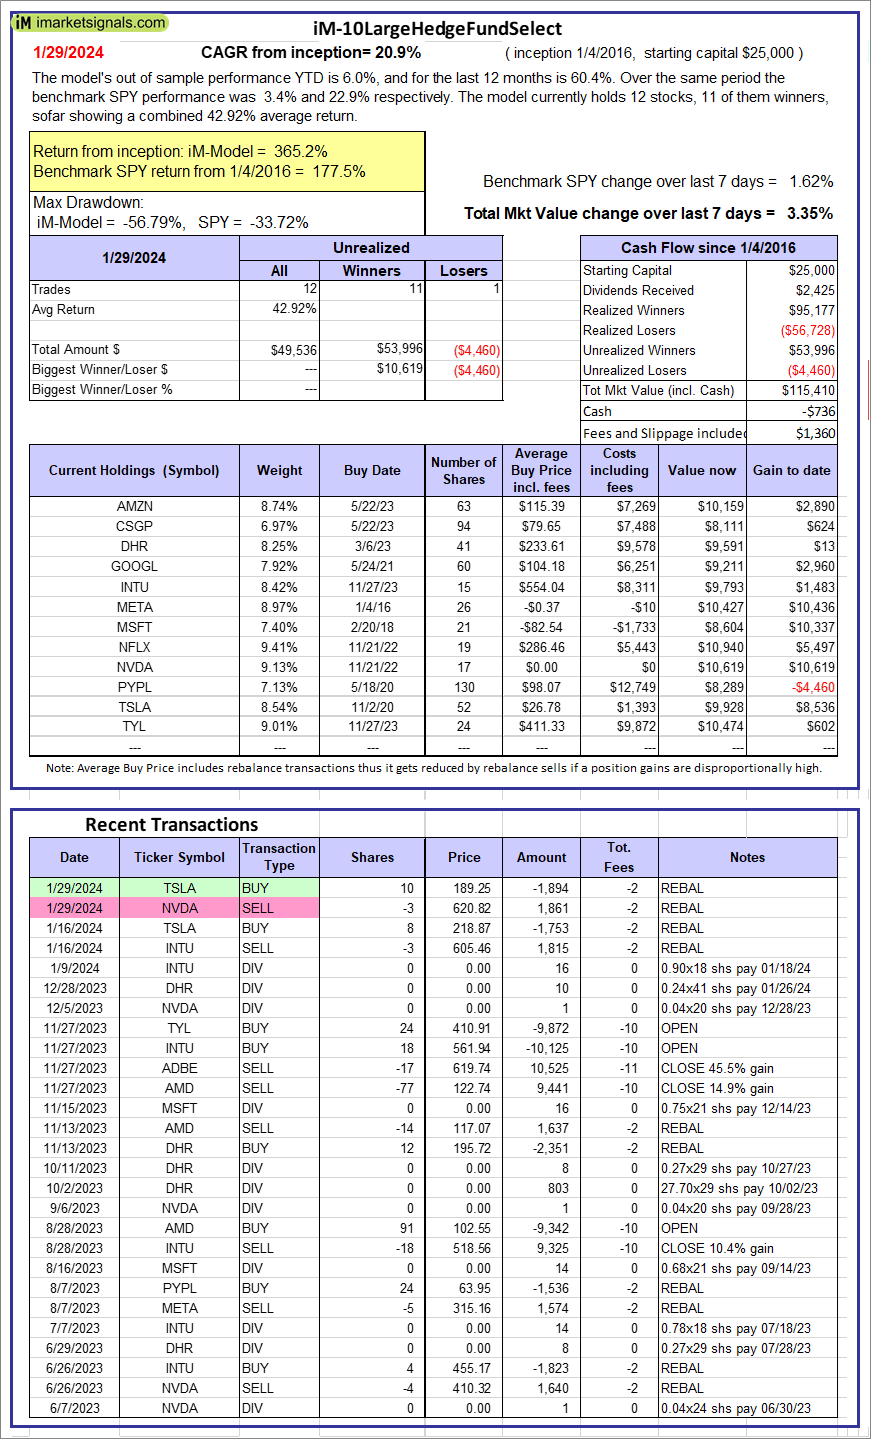 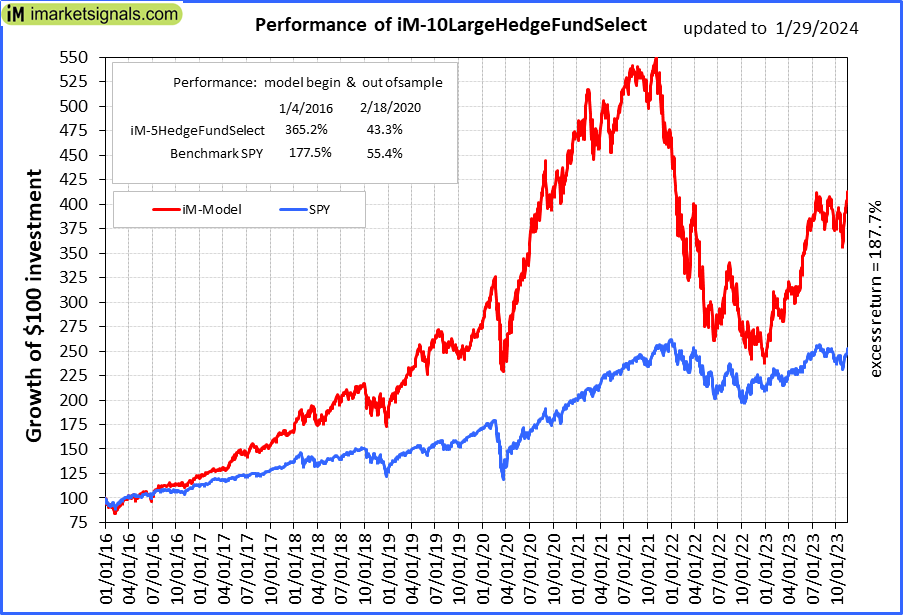 |
iM-10LargeHedgeFundSelect: Since inception, on 1/5/2016, the model gained 365.17% while the benchmark SPY gained 177.46% over the same period. Over the previous week the market value of iM-10LargeHedgeFundSelect gained 3.35% at a time when SPY gained 1.62%. A starting capital of $25,000 at inception on 1/5/2016 would have grown to $115,410 which includes -$736 cash and excludes $1,360 spent on fees and slippage. |
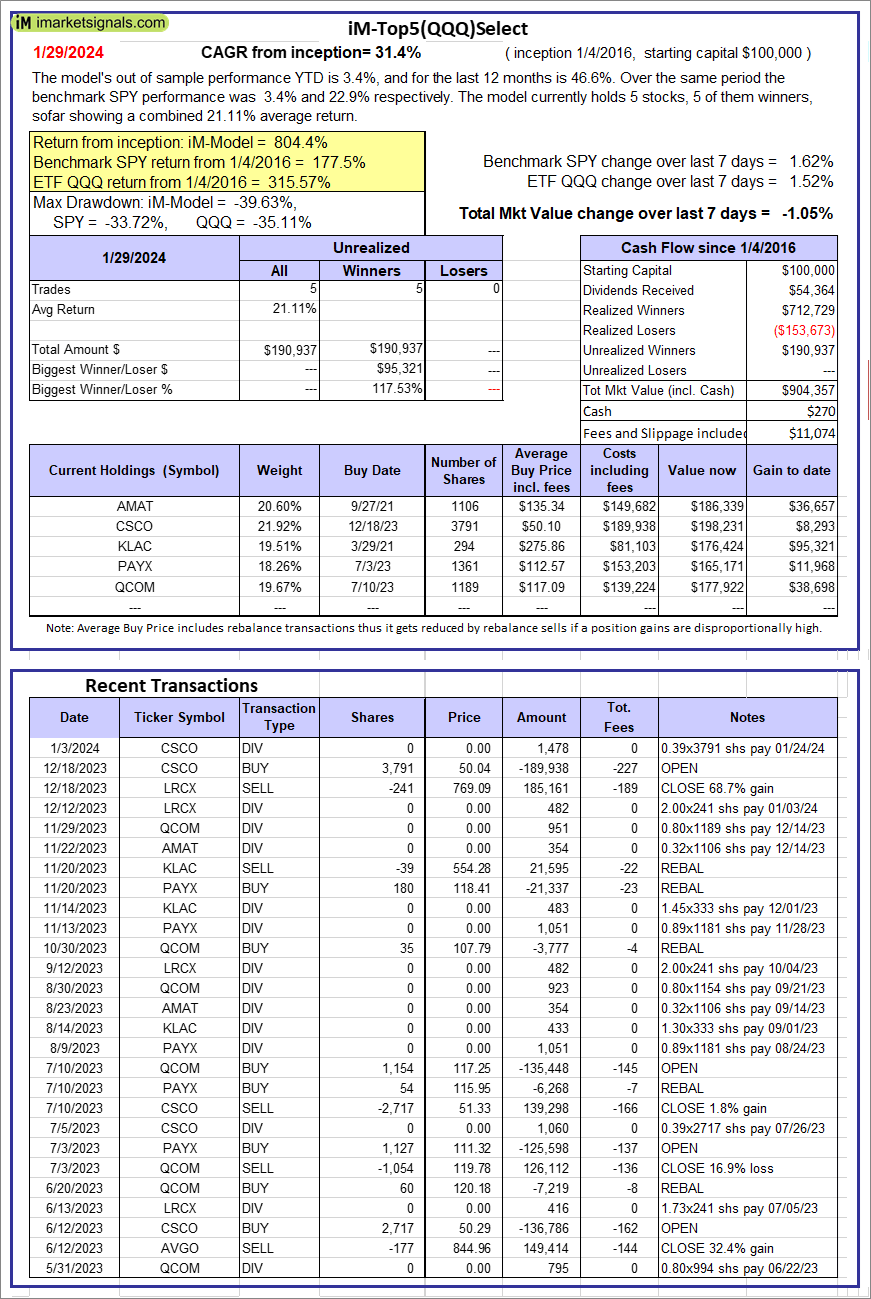 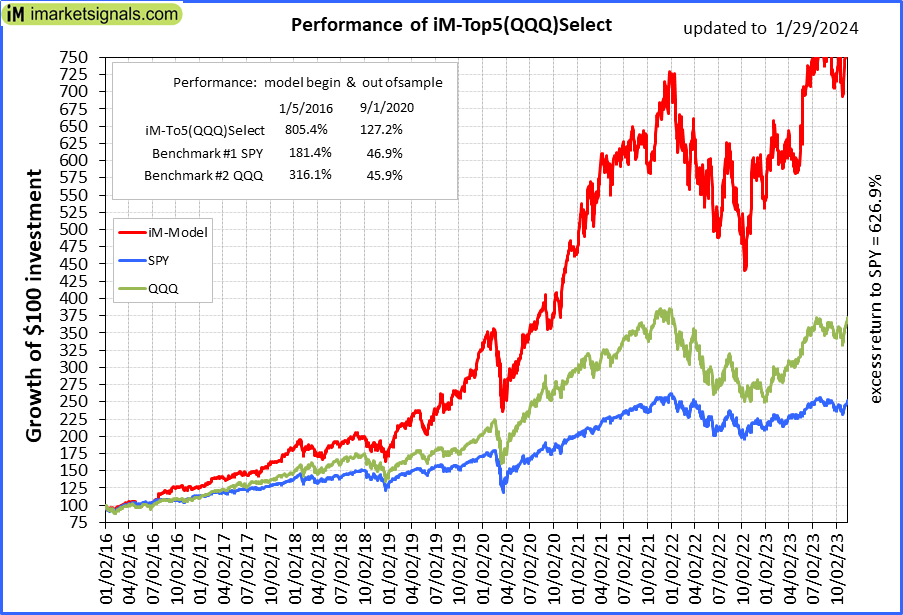 |
iM-Top5(QQQ)Select: Since inception, on 1/5/2016, the model gained 804.36% while the benchmark SPY gained 177.46% over the same period. Over the previous week the market value of iM-Top5(QQQ)Select gained -1.05% at a time when SPY gained 1.62%. A starting capital of $100,000 at inception on 1/5/2016 would have grown to $904,357 which includes $270 cash and excludes $11,074 spent on fees and slippage. |
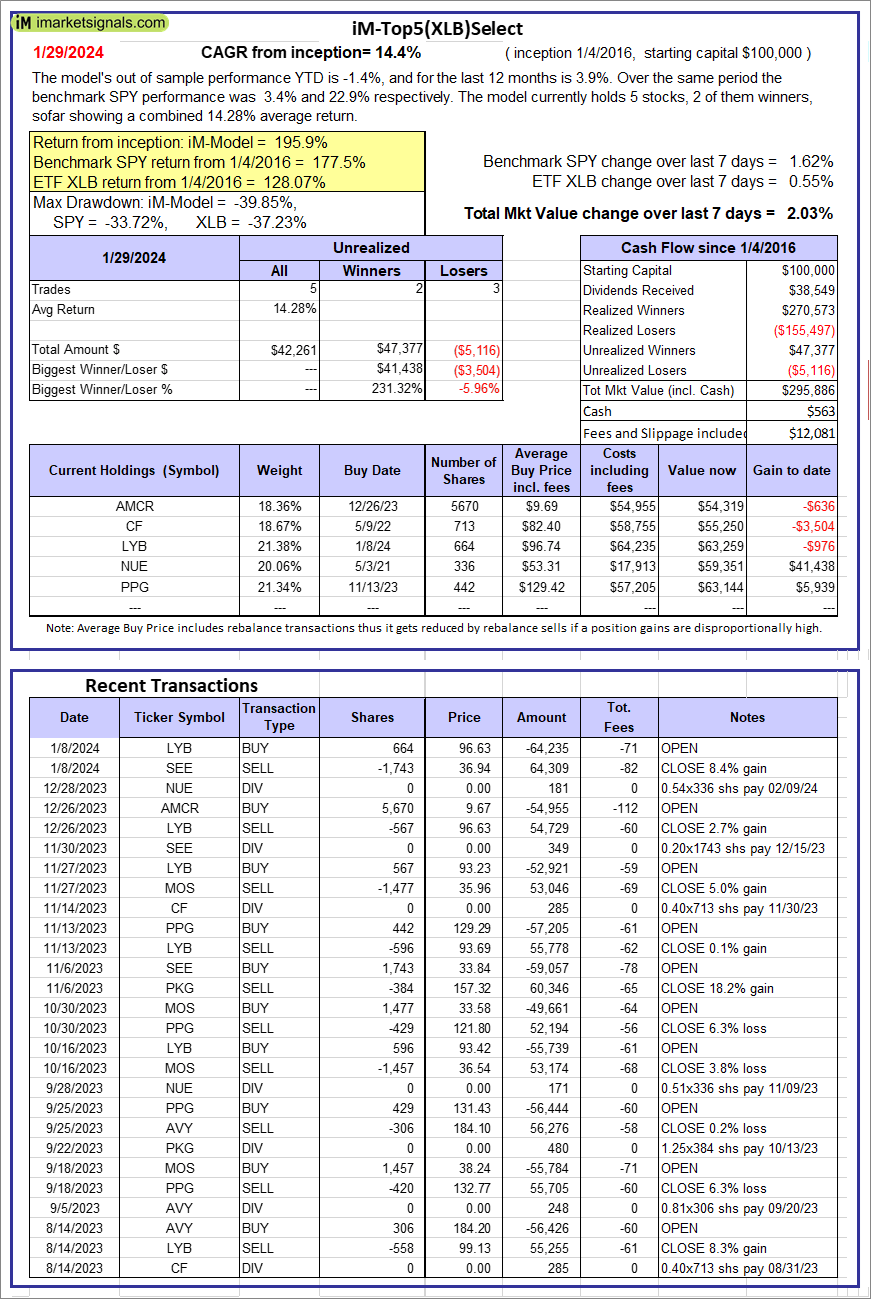 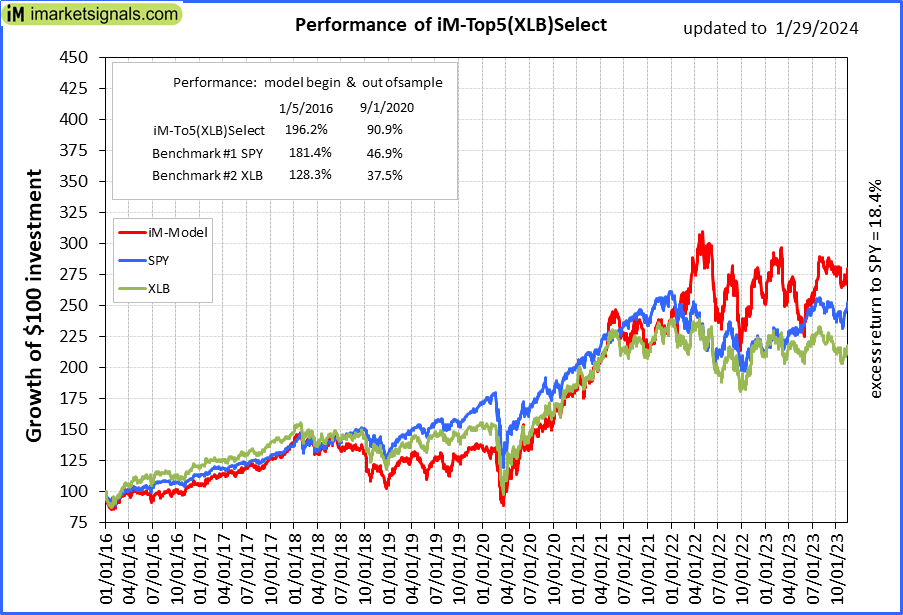 |
iM-Top5(XLB)Select: Since inception, on 1/5/2016, the model gained 195.89% while the benchmark SPY gained 177.46% over the same period. Over the previous week the market value of iM-Top5(XLB)Select gained 2.03% at a time when SPY gained 1.62%. A starting capital of $100,000 at inception on 1/5/2016 would have grown to $295,886 which includes $563 cash and excludes $12,081 spent on fees and slippage. |
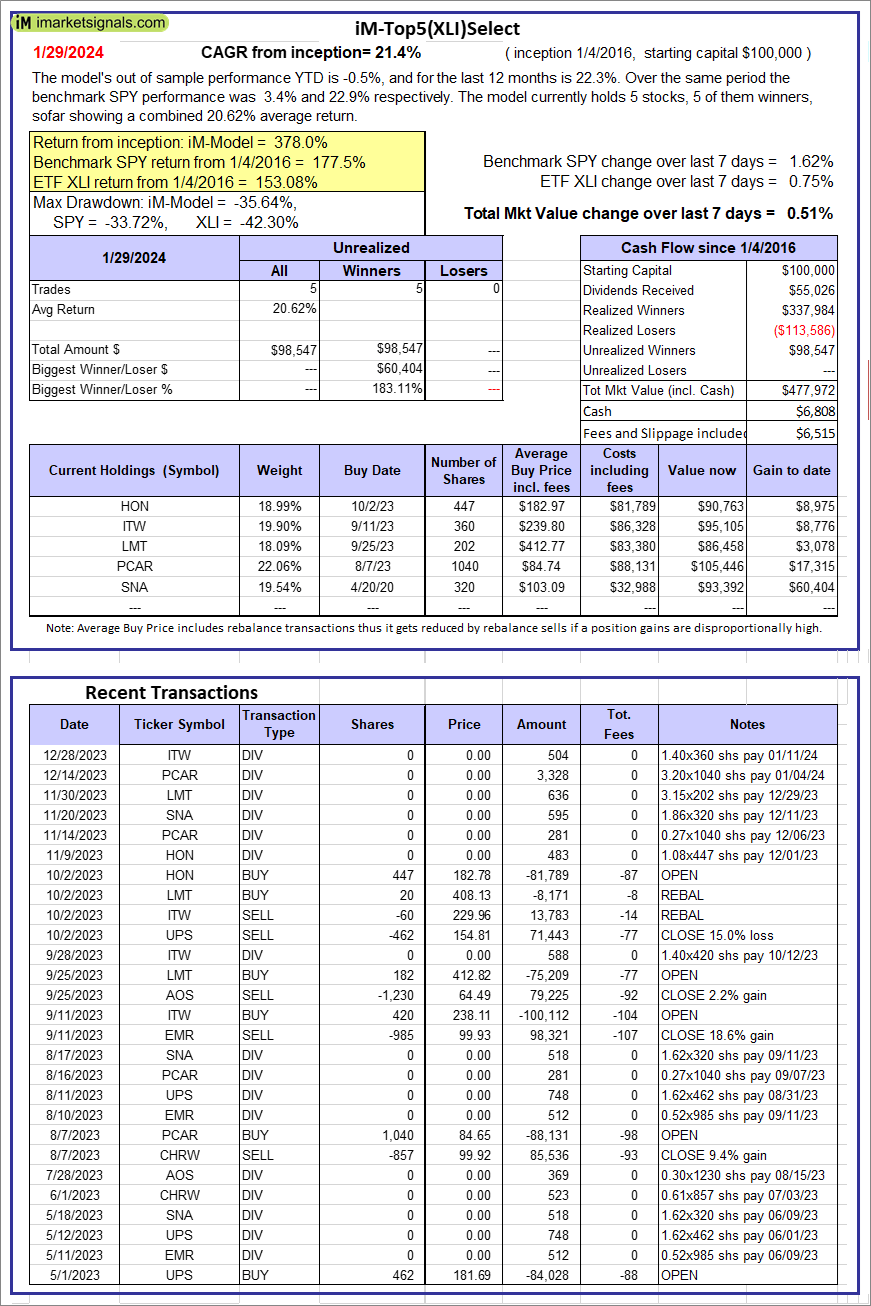 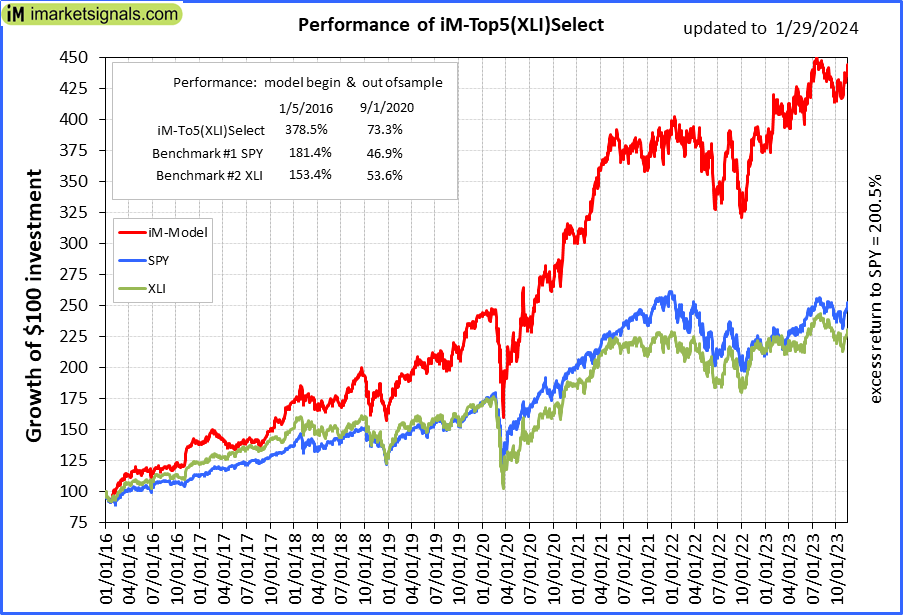 |
iM-Top5(XLI)Select: Since inception, on 1/5/2016, the model gained 377.97% while the benchmark SPY gained 177.46% over the same period. Over the previous week the market value of iM-Top5(XLI)Select gained 0.51% at a time when SPY gained 1.62%. A starting capital of $100,000 at inception on 1/5/2016 would have grown to $477,972 which includes $6,808 cash and excludes $6,515 spent on fees and slippage. |
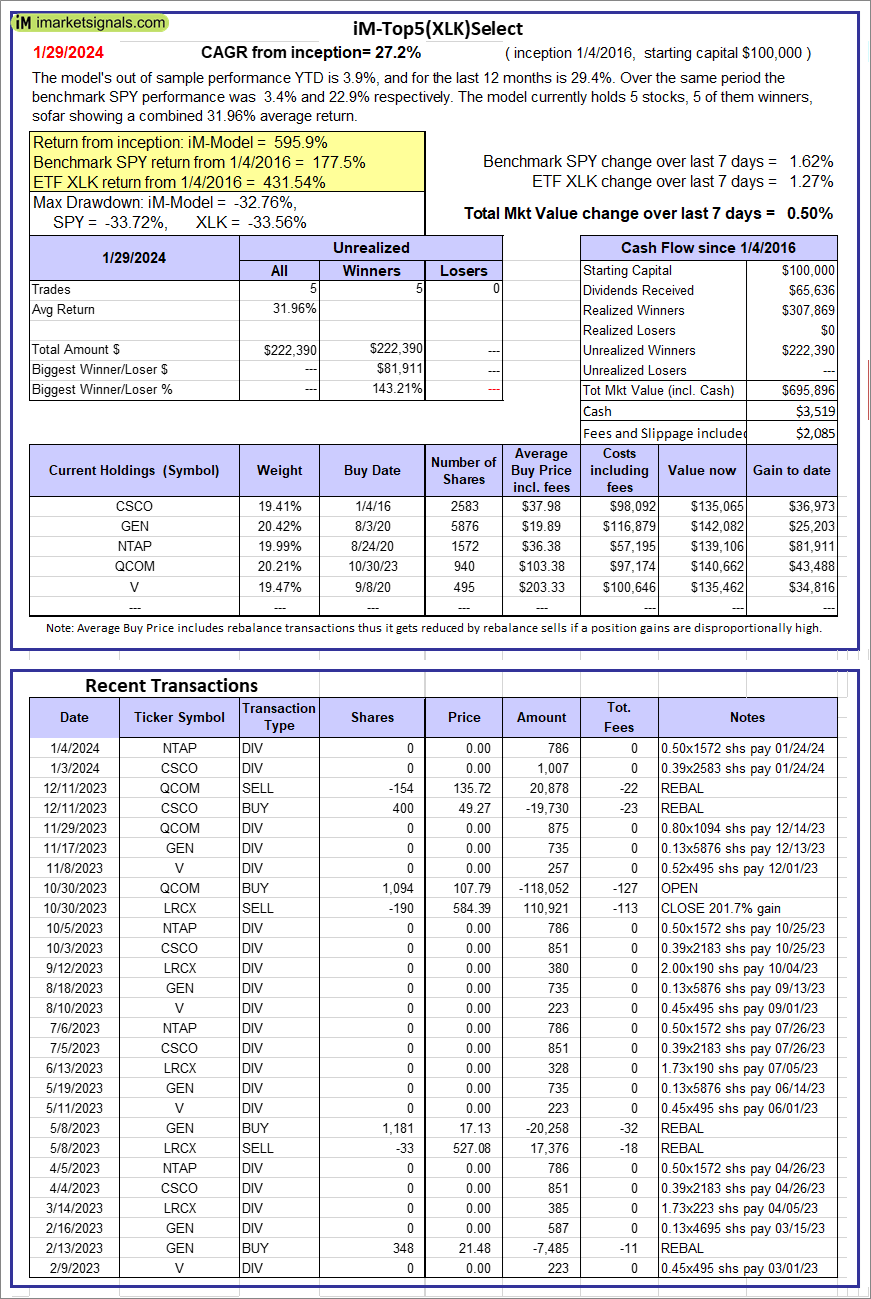 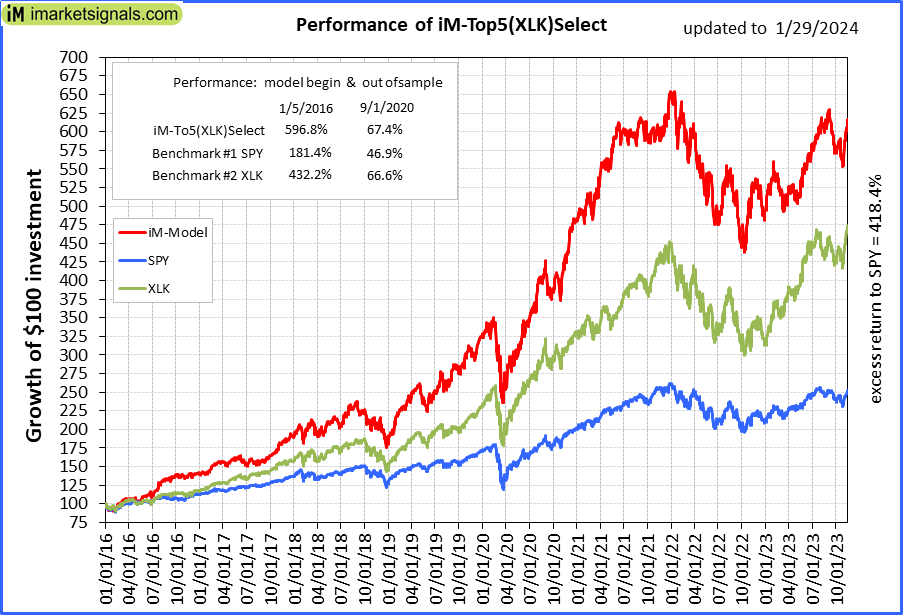 |
iM-Top5(XLK)Select: Since inception, on 1/5/2016, the model gained 595.90% while the benchmark SPY gained 177.46% over the same period. Over the previous week the market value of iM-Top5(XLK)Select gained 0.50% at a time when SPY gained 1.62%. A starting capital of $100,000 at inception on 1/5/2016 would have grown to $695,896 which includes $3,519 cash and excludes $2,085 spent on fees and slippage. |
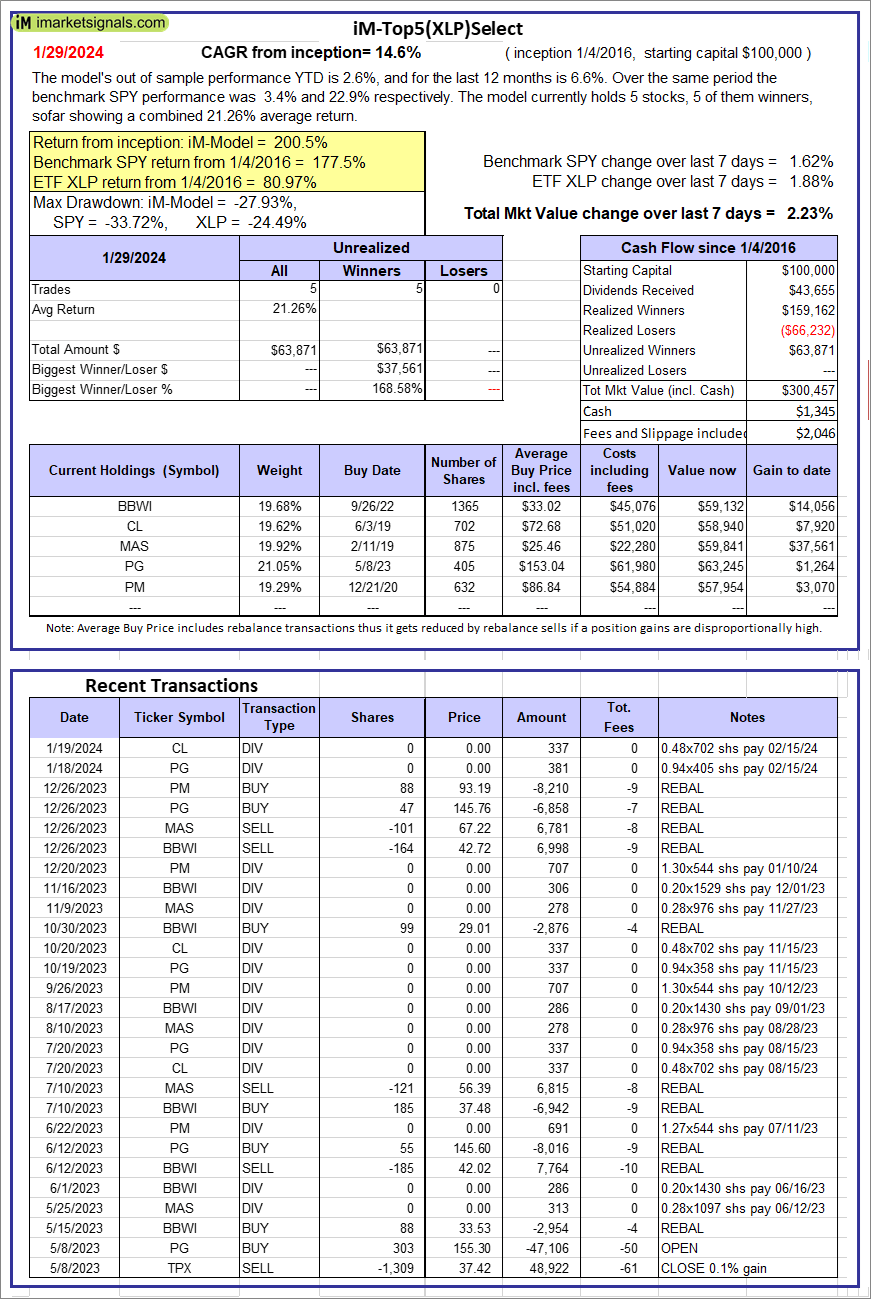 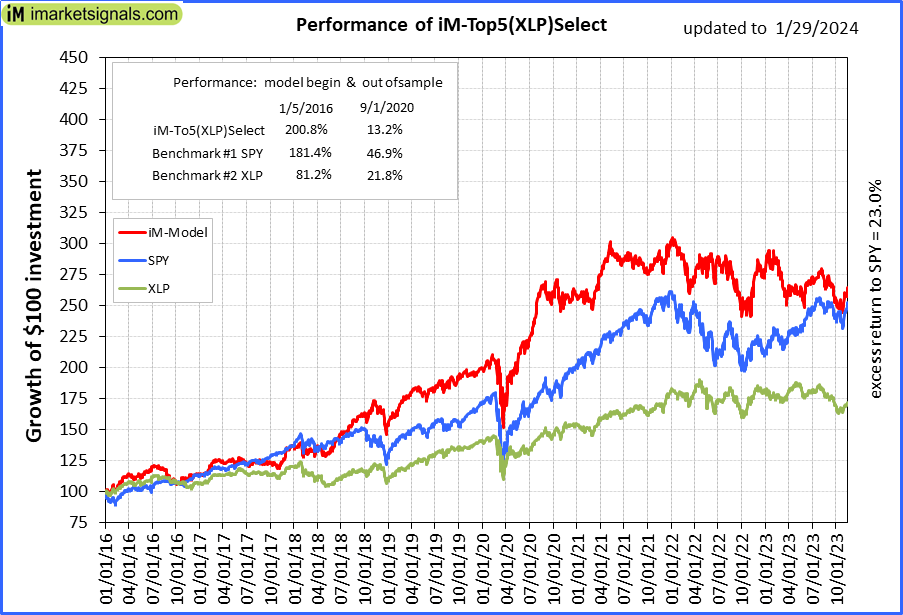 |
iM-Top5(XLP)Select: Since inception, on 1/5/2016, the model gained 200.46% while the benchmark SPY gained 177.46% over the same period. Over the previous week the market value of iM-Top5(XLP)Select gained 2.23% at a time when SPY gained 1.62%. A starting capital of $100,000 at inception on 1/5/2016 would have grown to $300,457 which includes $1,345 cash and excludes $2,046 spent on fees and slippage. |
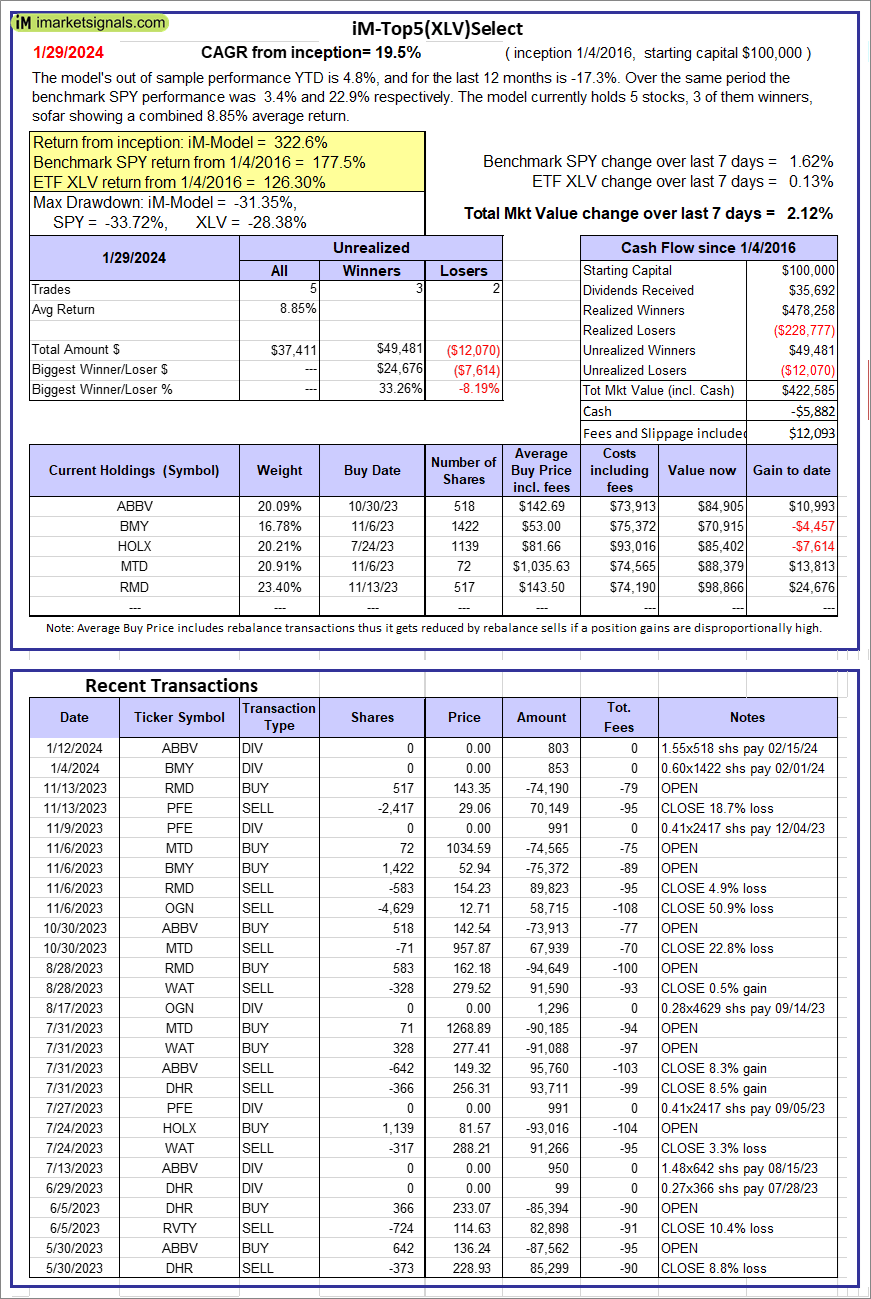 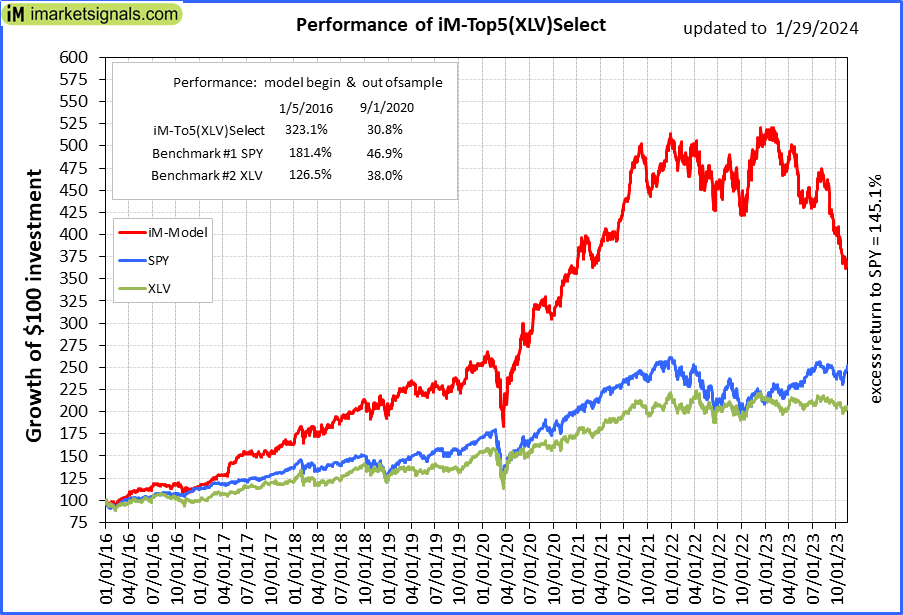 |
iM-Top5(XLV)Select: Since inception, on 1/5/2016, the model gained 322.58% while the benchmark SPY gained 177.46% over the same period. Over the previous week the market value of iM-Top5(XLV)Select gained 2.12% at a time when SPY gained 1.62%. A starting capital of $100,000 at inception on 1/5/2016 would have grown to $422,585 which includes -$5,882 cash and excludes $12,093 spent on fees and slippage. |
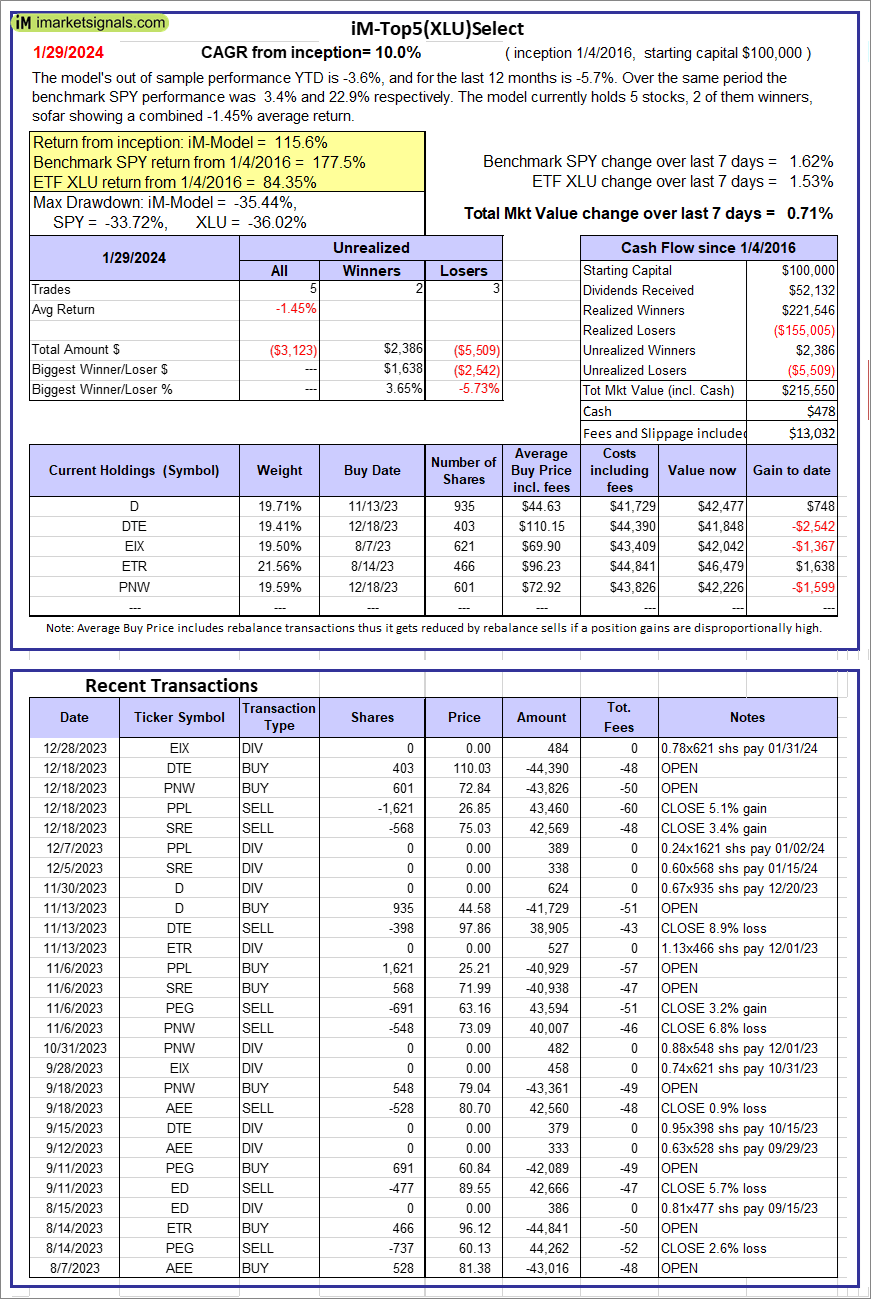 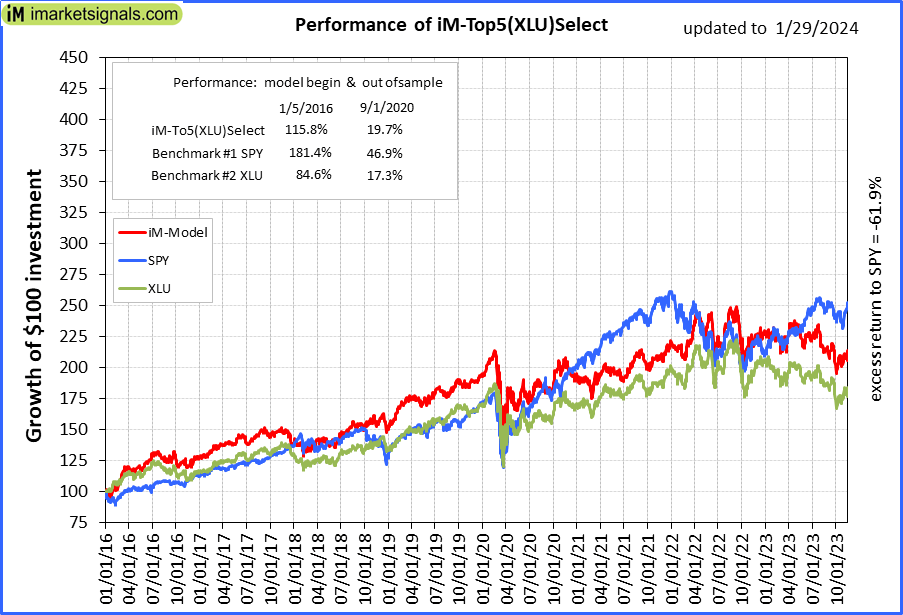 |
iM-Top5(XLU)Select: Since inception, on 1/5/2016, the model gained 115.55% while the benchmark SPY gained 177.46% over the same period. Over the previous week the market value of iM-Top5(XLU)Select gained 0.71% at a time when SPY gained 1.62%. A starting capital of $100,000 at inception on 1/5/2016 would have grown to $215,550 which includes $478 cash and excludes $13,032 spent on fees and slippage. |
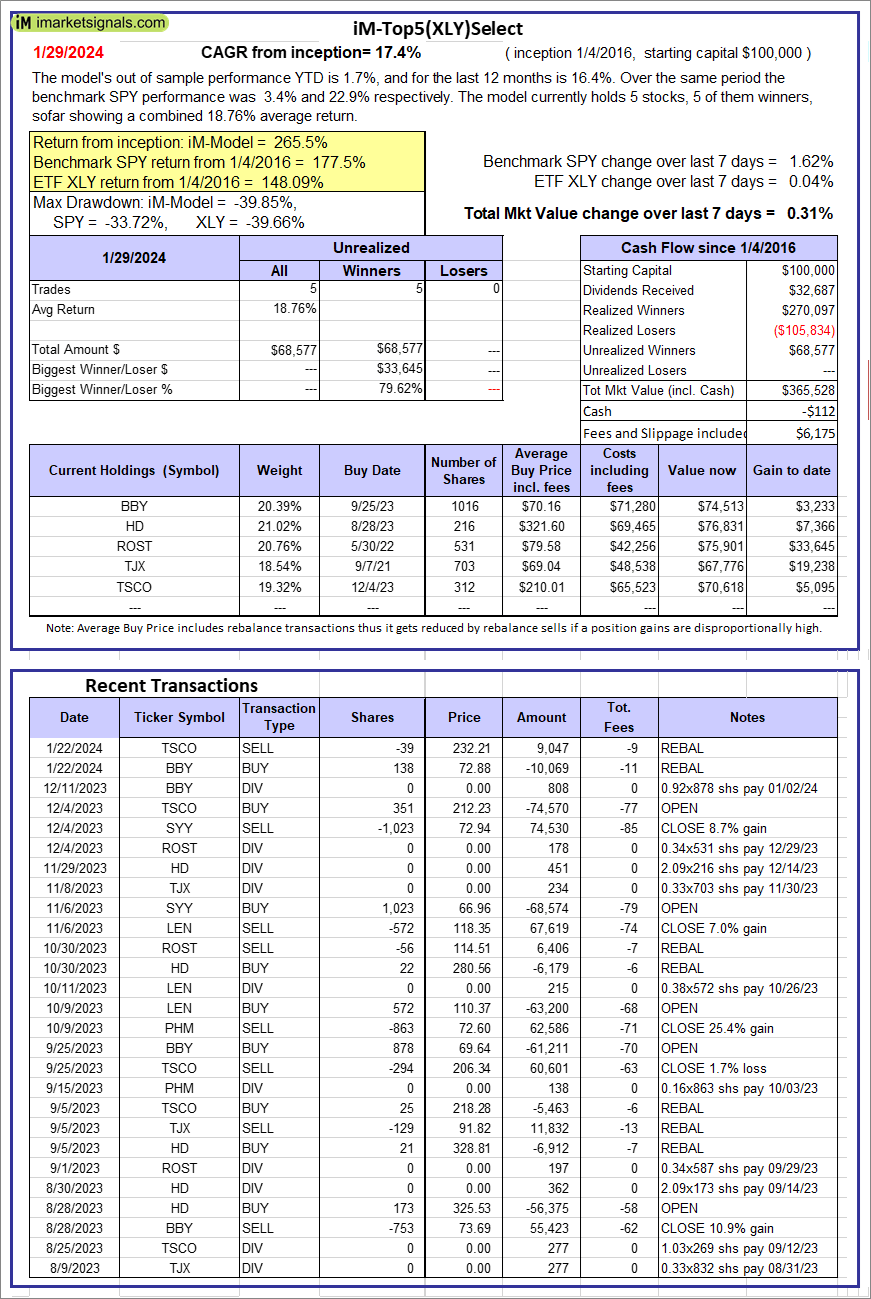 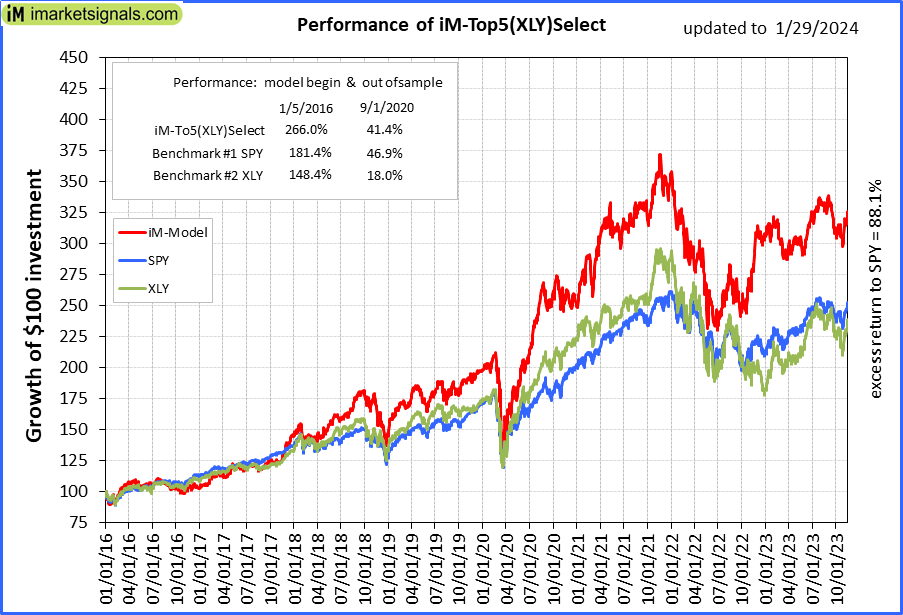 |
iM-Top5(XLY)Select: Since inception, on 1/5/2016, the model gained 265.53% while the benchmark SPY gained 177.46% over the same period. Over the previous week the market value of iM-Top5(XLY)Select gained 0.31% at a time when SPY gained 1.62%. A starting capital of $100,000 at inception on 1/5/2016 would have grown to $365,528 which includes -$112 cash and excludes $6,175 spent on fees and slippage. |
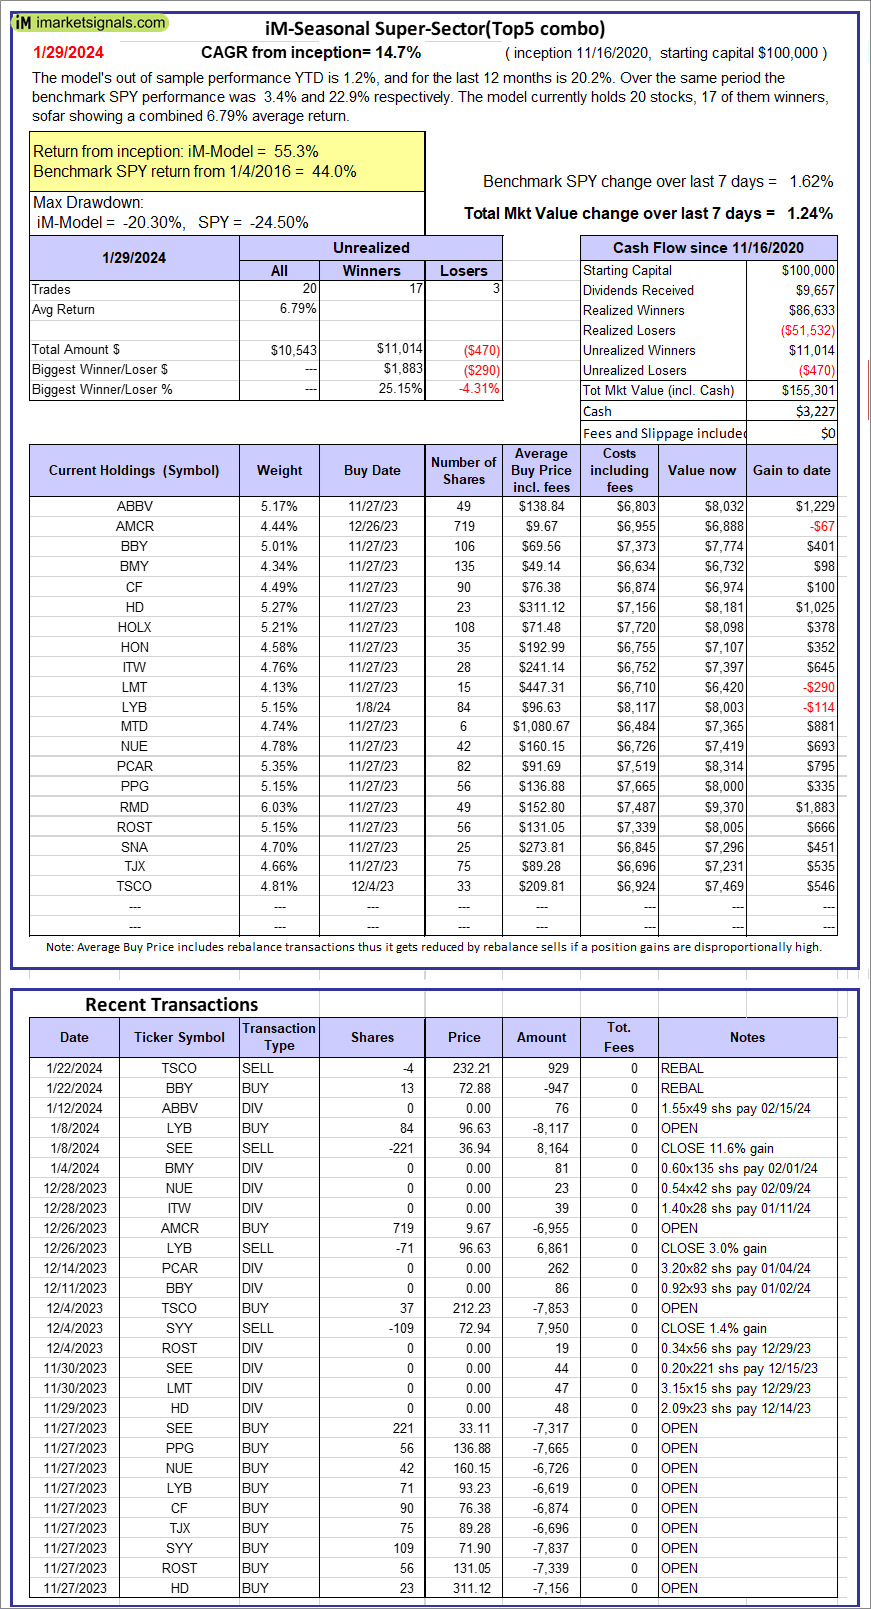 |
iM-Seasonal Super-Sectors (Top5 combo) : Since inception, on 11/17/2020, the model gained 55.30% while the benchmark SPY gained 44.03% over the same period. Over the previous week the market value of iM-Seasonal Super-Sectors (Top5 combo) gained 1.24% at a time when SPY gained 1.62%. A starting capital of $100,000 at inception on 11/17/2020 would have grown to $155,301 which includes $3,227 cash and excludes $00 spent on fees and slippage. |
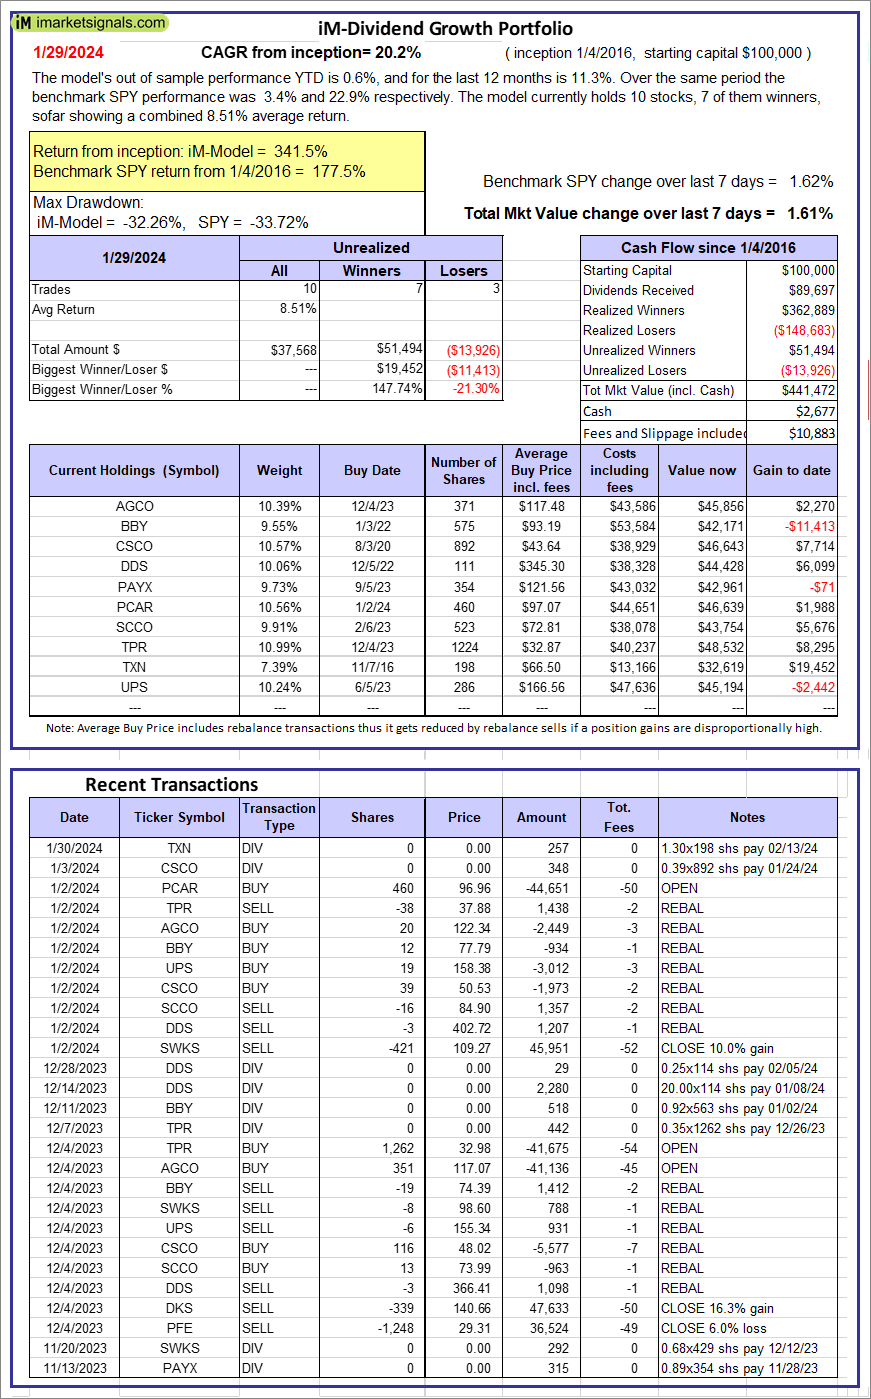 |
iM-Dividend Growth Portfolio: The model’s out of sample performance YTD is 0.6%, and for the last 12 months is 11.3%. Over the same period the benchmark SPY performance was 3.4% and 22.9% respectively. Over the previous week the market value of the iM-Dividend Growth Portfolio gained 1.61% at a time when SPY gained 1.62%. A starting capital of $100,000 at inception on 6/30/2016 would have grown to $441,472 which includes $2,677 cash and excludes $10,883 spent on fees and slippage. |
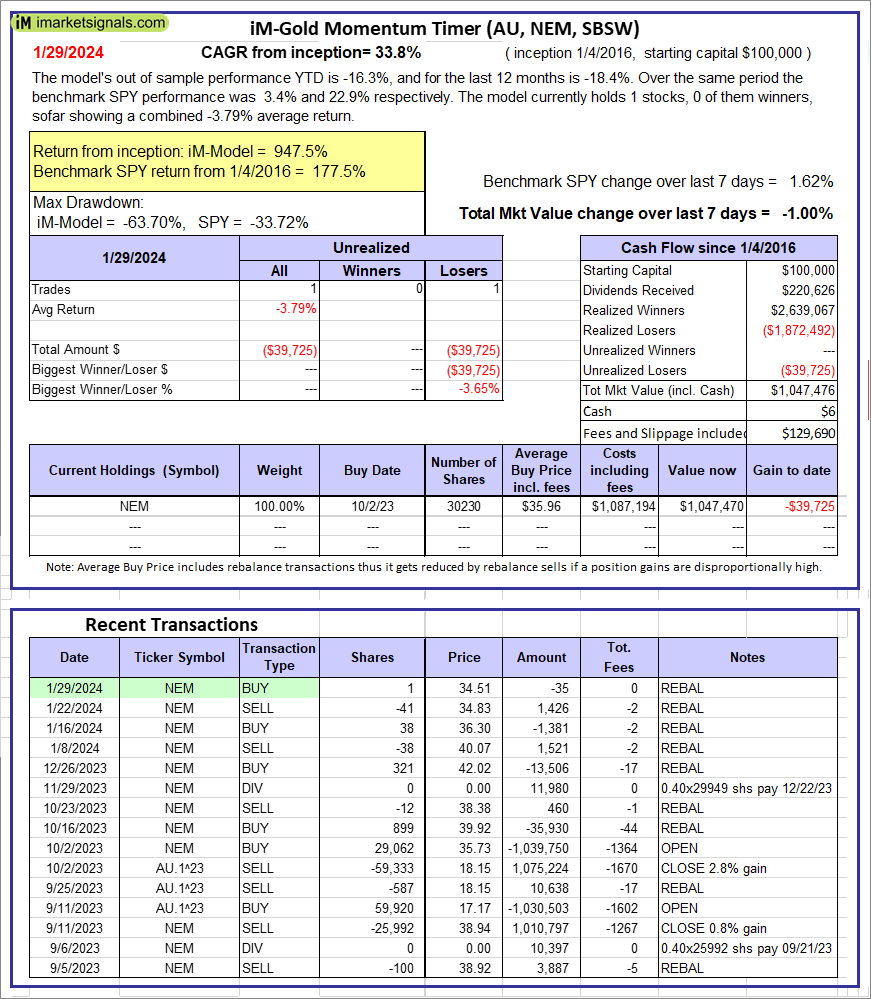 |
iM-Gold Momentum Timer (AU, NEM, SBSW): The model’s out of sample performance YTD is -16.3%, and for the last 12 months is -18.4%. Over the same period the benchmark SPY performance was 3.4% and 22.9% respectively. Over the previous week the market value of iM-Gold Momentum Timer (AU, NEM, SBSW) gained -1.00% at a time when SPY gained 1.62%. A starting capital of $100,000 at inception on 6/30/2016 would have grown to $06 which includes $129,690 cash and excludes Gain to date spent on fees and slippage. |
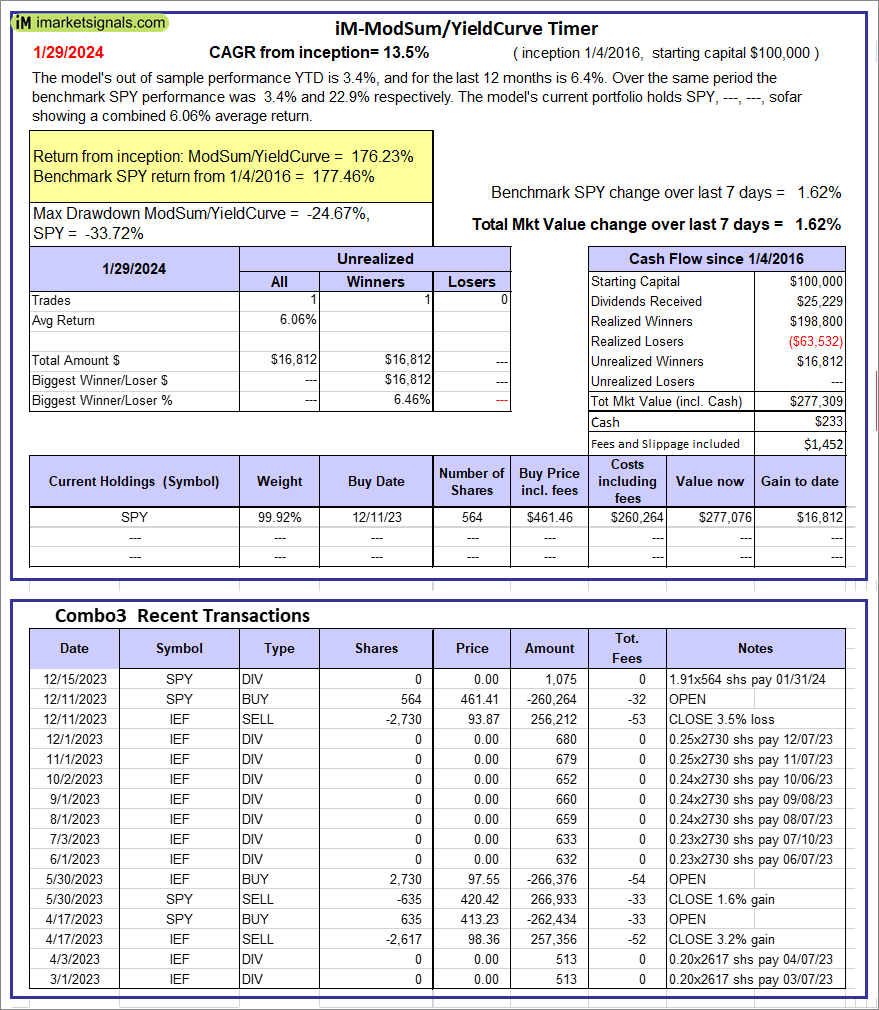 |
iM-ModSum/YieldCurve Timer: The model’s out of sample performance YTD is 3.4%, and for the last 12 months is 6.4%. Over the same period the benchmark SPY performance was 3.4% and 22.9% respectively. Over the previous week the market value of iM-PortSum/YieldCurve Timer gained 1.62% at a time when SPY gained 1.62%. A starting capital of $100,000 at inception on 1/1/2016 would have grown to $277,309 which includes $233 cash and excludes $1,452 spent on fees and slippage. |
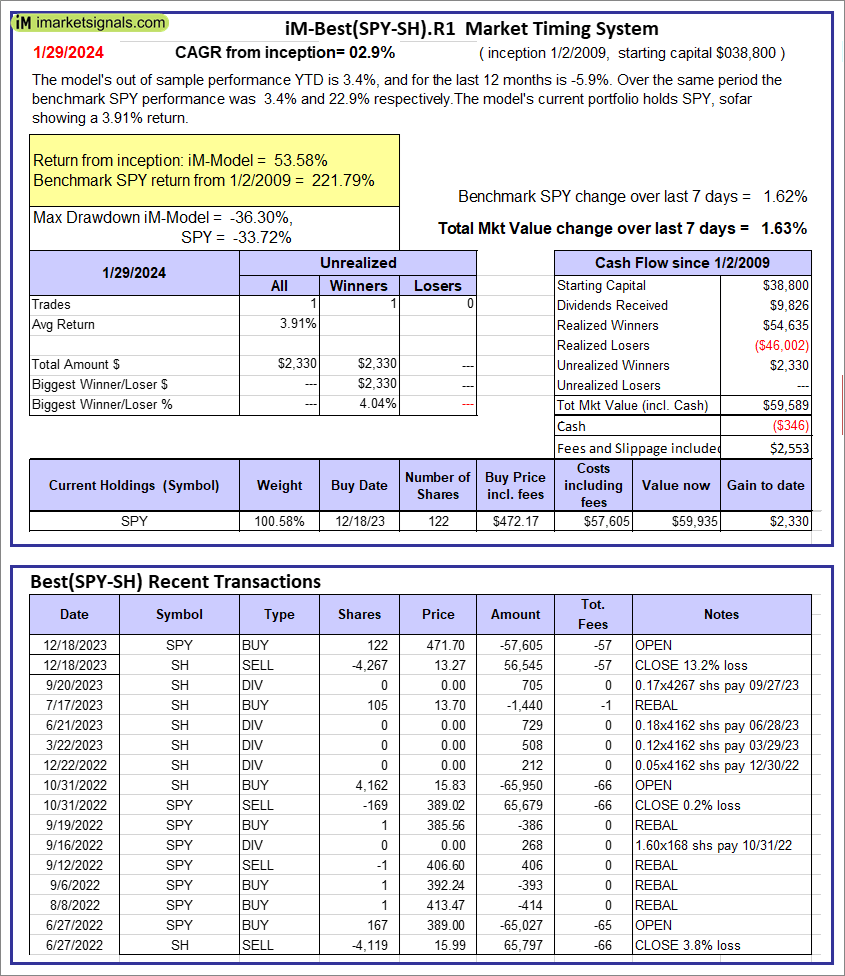 |
iM-Best(SPY-SH).R1: The model’s out of sample performance YTD is 3.4%, and for the last 12 months is -5.9%. Over the same period the benchmark SPY performance was 3.4% and 22.9% respectively. Over the previous week the market value of Best(SPY-SH) gained 1.63% at a time when SPY gained 1.62%. A starting capital of $100,000 at inception on 1/2/2009 would have grown to $59,589 which includes -$346 cash and excludes $2,553 spent on fees and slippage. |
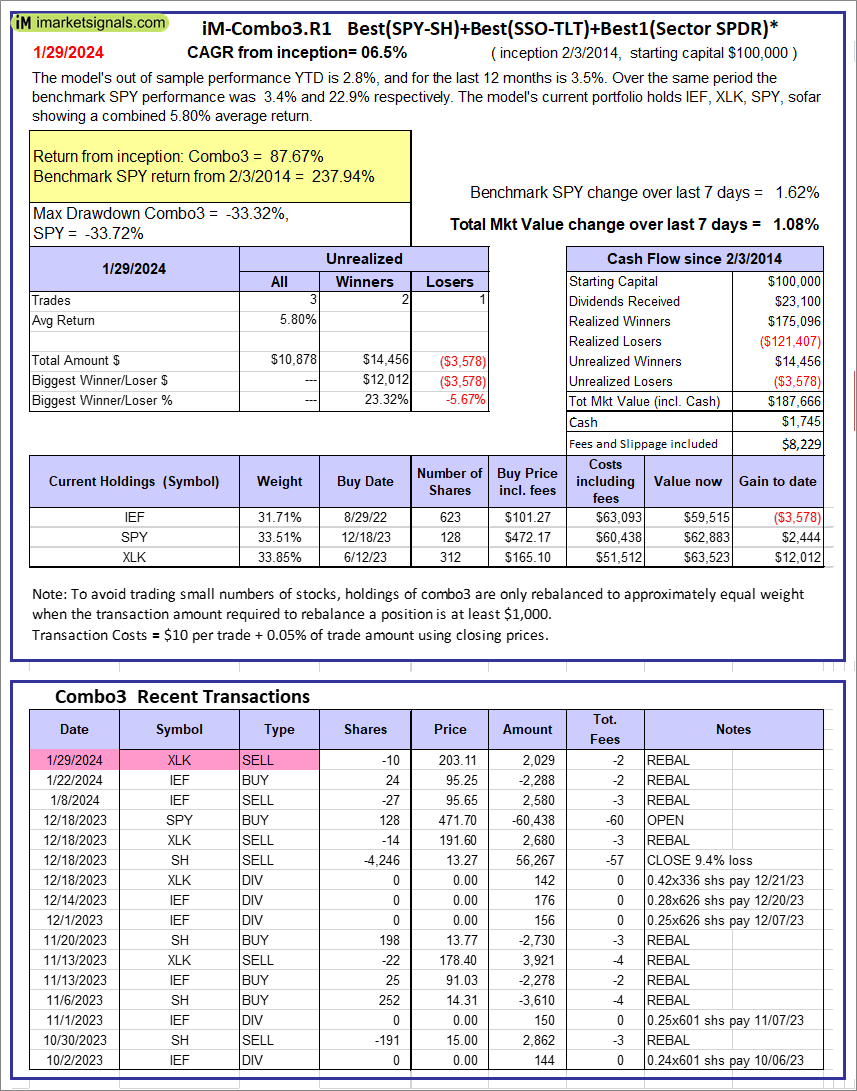 |
iM-Combo3.R1: The model’s out of sample performance YTD is 2.8%, and for the last 12 months is 3.5%. Over the same period the benchmark SPY performance was 3.4% and 22.9% respectively. Over the previous week the market value of iM-Combo3.R1 gained 1.08% at a time when SPY gained 1.62%. A starting capital of $100,000 at inception on 2/3/2014 would have grown to $187,666 which includes $1,745 cash and excludes $8,229 spent on fees and slippage. |
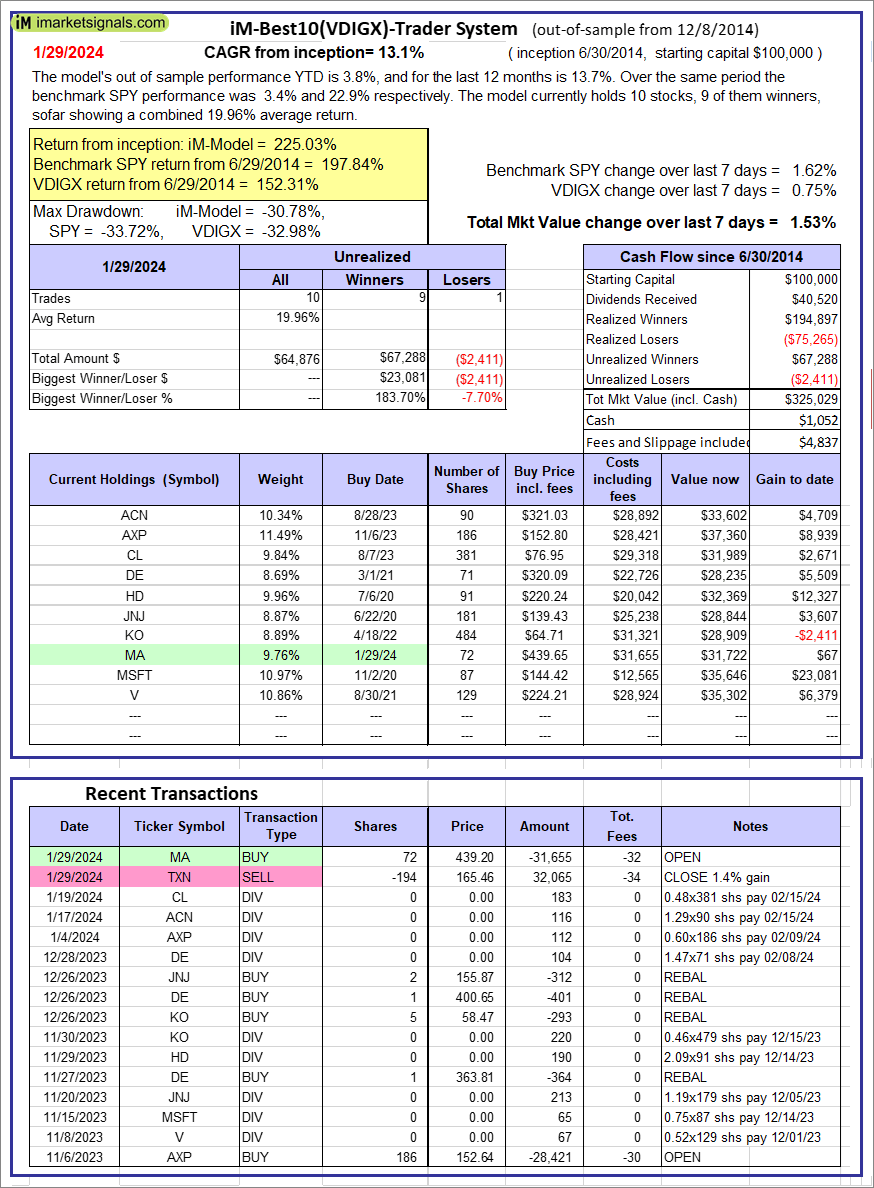 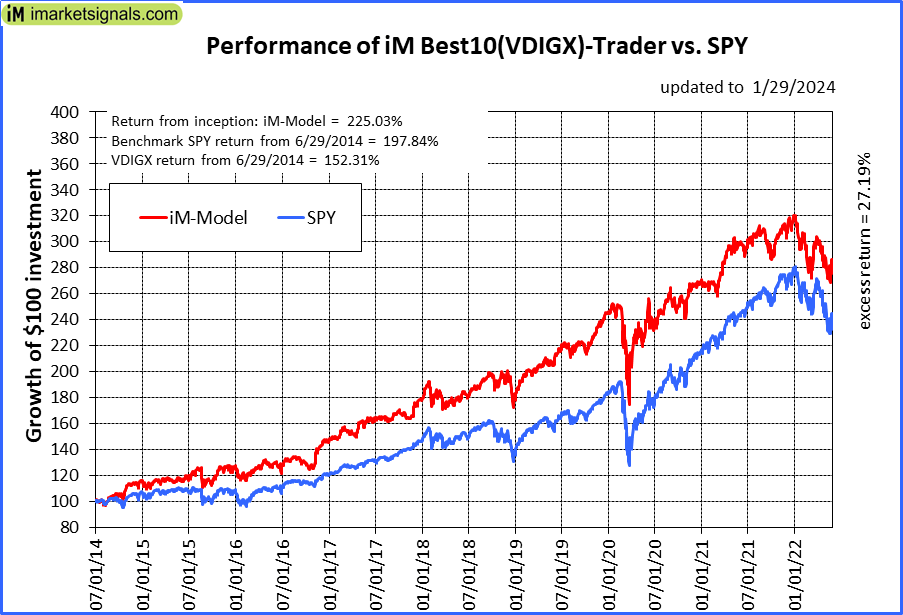 |
iM-Best10(VDIGX)-Trader: The model’s out of sample performance YTD is 3.8%, and for the last 12 months is 13.7%. Over the same period the benchmark SPY performance was 3.4% and 22.9% respectively. Since inception, on 7/1/2014, the model gained 225.03% while the benchmark SPY gained 197.84% and VDIGX gained 152.31% over the same period. Over the previous week the market value of iM-Best10(VDIGX) gained 1.53% at a time when SPY gained 1.62%. A starting capital of $100,000 at inception on 7/1/2014 would have grown to $325,029 which includes $1,052 cash and excludes $4,837 spent on fees and slippage. |
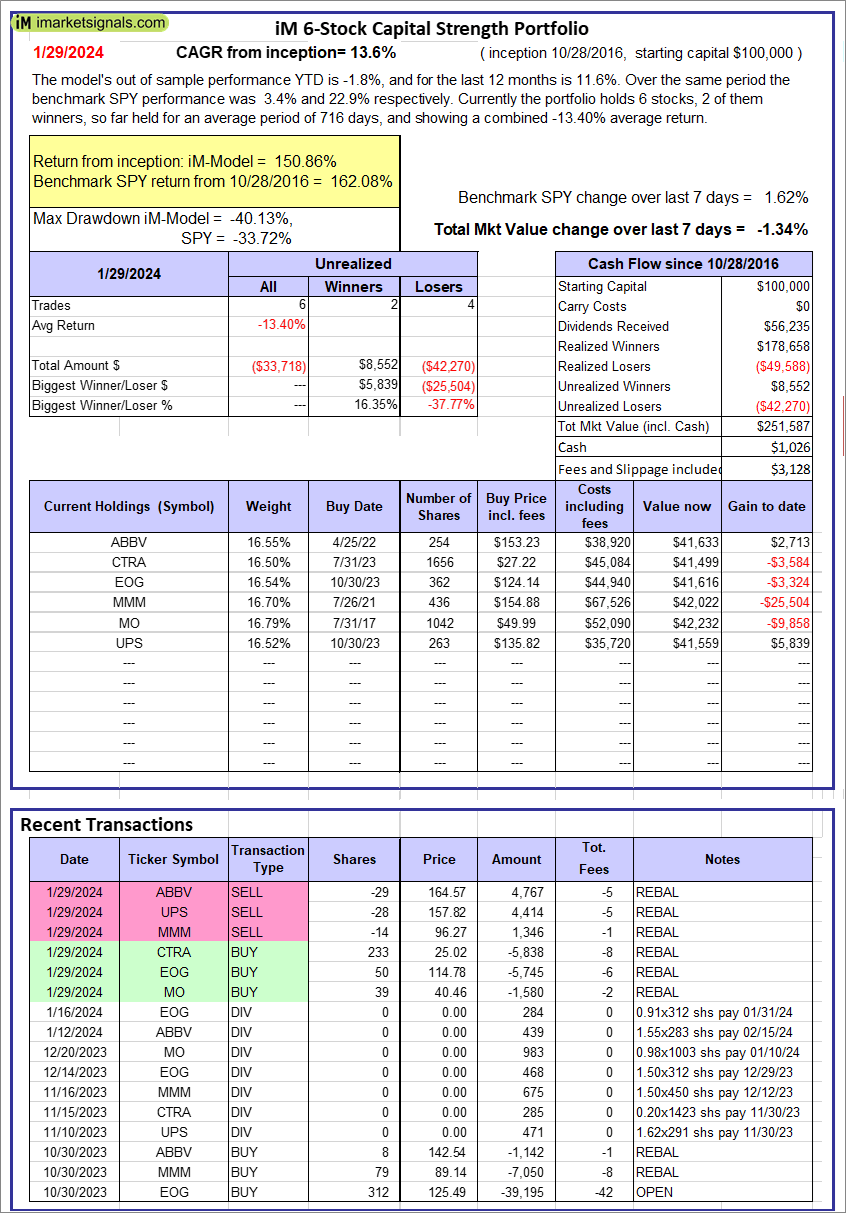 |
iM 6-Stock Capital Strength Portfolio: The model’s out of sample performance YTD is -1.8%, and for the last 12 months is 11.6%. Over the same period the benchmark SPY performance was 3.4% and 22.9% respectively. Over the previous week the market value of the iM 6-Stock Capital Strength Portfolio gained -1.34% at a time when SPY gained 1.62%. A starting capital of $100,000 at inception on 10/28/2016 would have grown to $251,587 which includes $1,026 cash and excludes $3,128 spent on fees and slippage. |
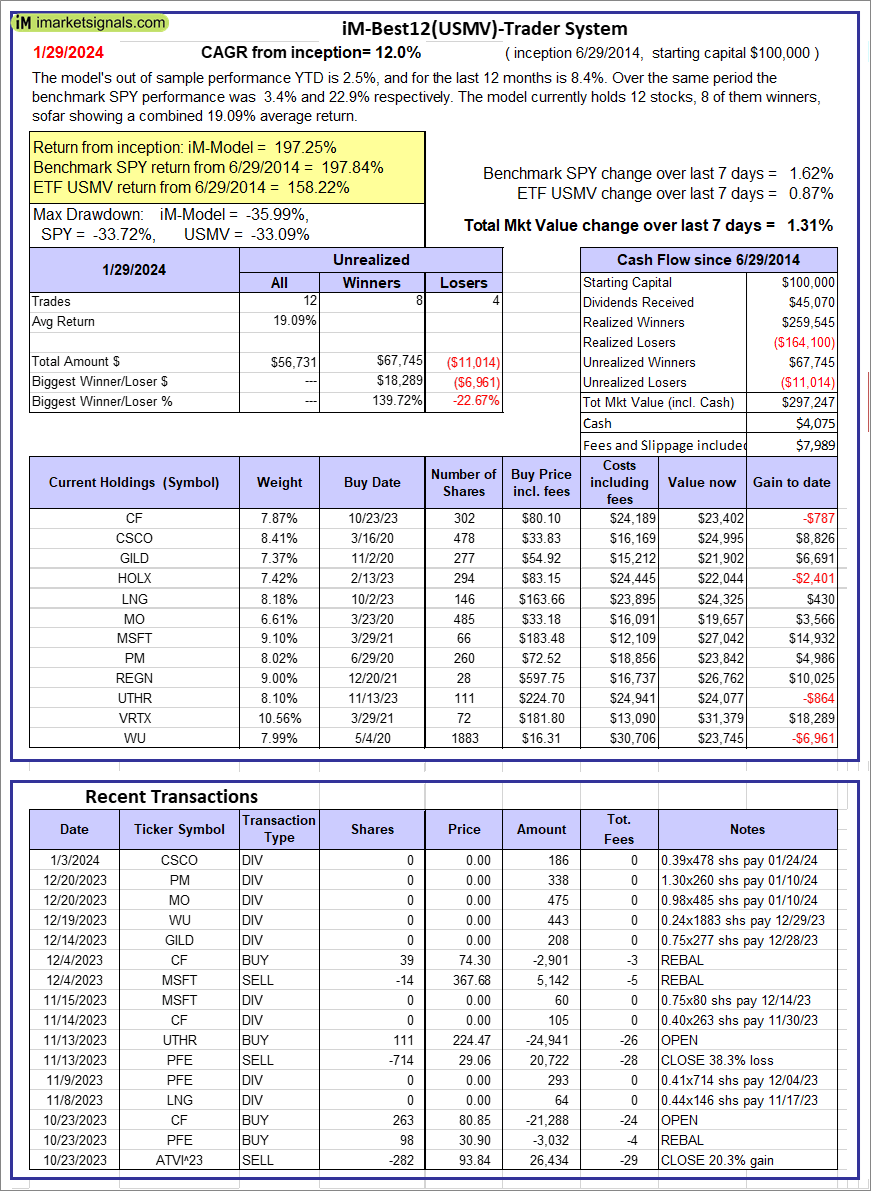 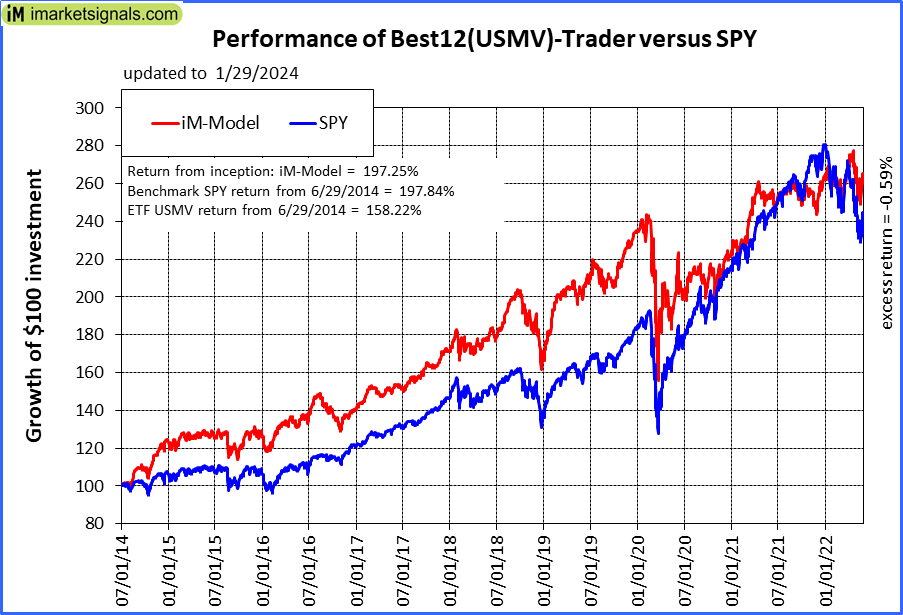 |
iM-Best12(USMV)-Trader: The model’s out of sample performance YTD is 2.5%, and for the last 12 months is 8.4%. Over the same period the benchmark SPY performance was 3.4% and 22.9% respectively. Since inception, on 6/30/2014, the model gained 197.25% while the benchmark SPY gained 197.84% and the ETF USMV gained 158.22% over the same period. Over the previous week the market value of iM-Best12(USMV)-Trader gained 1.31% at a time when SPY gained 1.62%. A starting capital of $100,000 at inception on 6/30/2014 would have grown to $297,247 which includes $4,075 cash and excludes $7,989 spent on fees and slippage. |
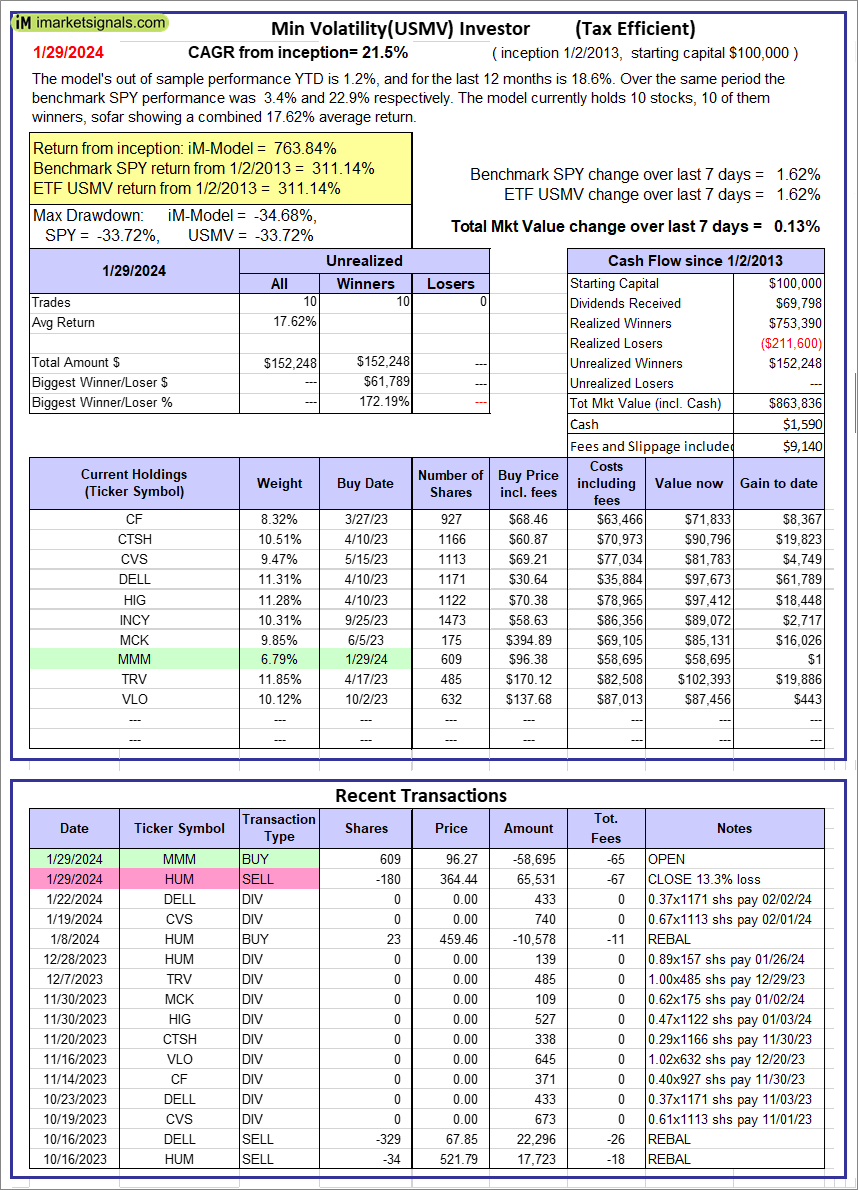 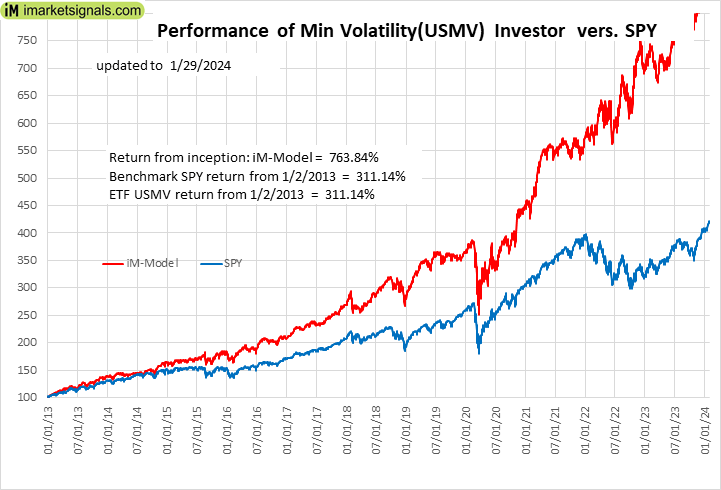 |
iM-Min Volatility(USMV) Investor (Tax Efficient): The model’s out of sample performance YTD is 1.2%, and for the last 12 months is 18.6%. Over the same period the benchmark SPY performance was 3.4% and 22.9% respectively. Since inception, on 1/3/2013, the model gained 763.84% while the benchmark SPY gained 311.14% and the ETF USMV gained 311.14% over the same period. Over the previous week the market value of iM-Best12(USMV)Q1 gained 0.13% at a time when SPY gained 1.62%. A starting capital of $100,000 at inception on 1/3/2013 would have grown to $863,836 which includes $1,590 cash and excludes $9,140 spent on fees and slippage. |
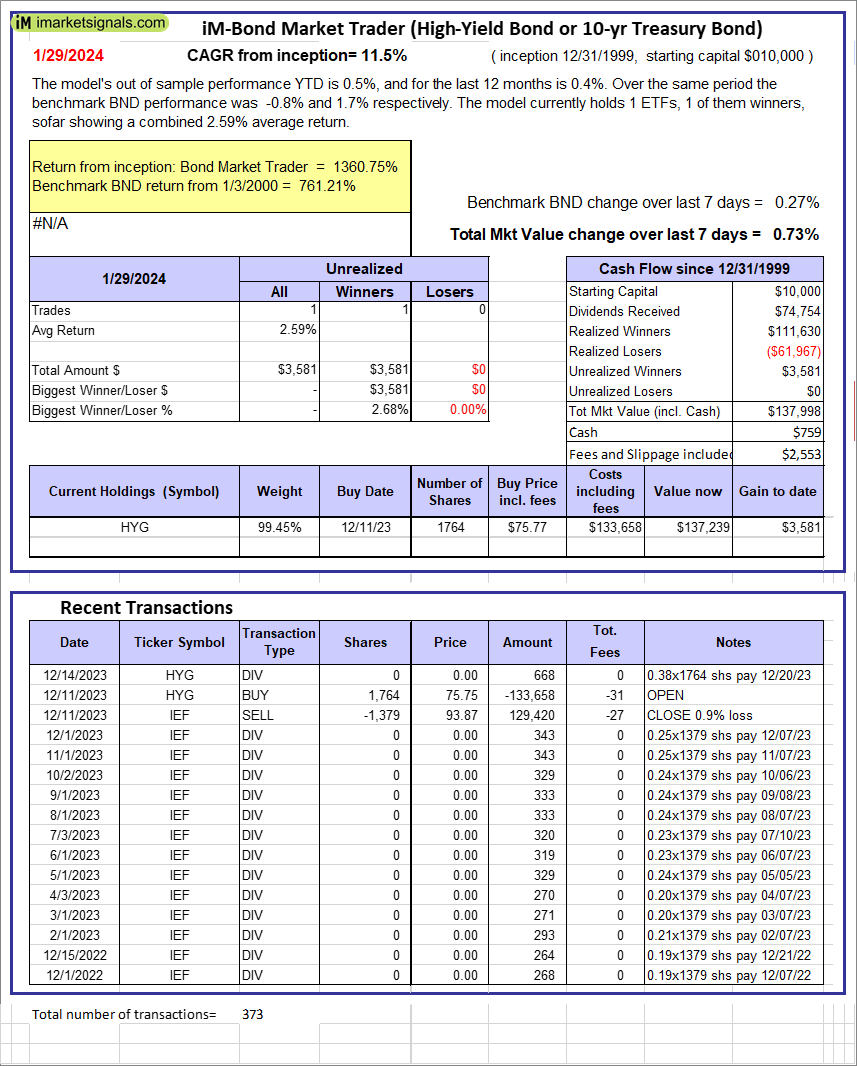 |
iM-Bond Market Trader (High-Yield Bond or 10-yr Treasury Bond): The model’s out of sample performance YTD is 0.5%, and for the last 12 months is 0.4%. Over the same period the benchmark BND performance was -0.8% and 1.7% respectively. Over the previous week the market value of the iM-Bond Market Trader (High-Yield Bond or 10-yr Treasury Bond) gained 0.73% at a time when BND gained 0.27%. A starting capital of $10,000 at inception on 1/3/2000 would have grown to $137,998 which includes $759 cash and excludes $2,553 spent on fees and slippage. |
|
|
iM-ModSum/YieldCurve Timer: The model’s out of sample performance YTD is 3.4%, and for the last 12 months is 6.4%. Over the same period the benchmark SPY performance was 3.4% and 22.9% respectively. Over the previous week the market value of iM-PortSum/YieldCurve Timer gained 1.62% at a time when SPY gained 1.62%. A starting capital of $100,000 at inception on 1/1/2016 would have grown to $277,309 which includes $233 cash and excludes $1,452 spent on fees and slippage. |
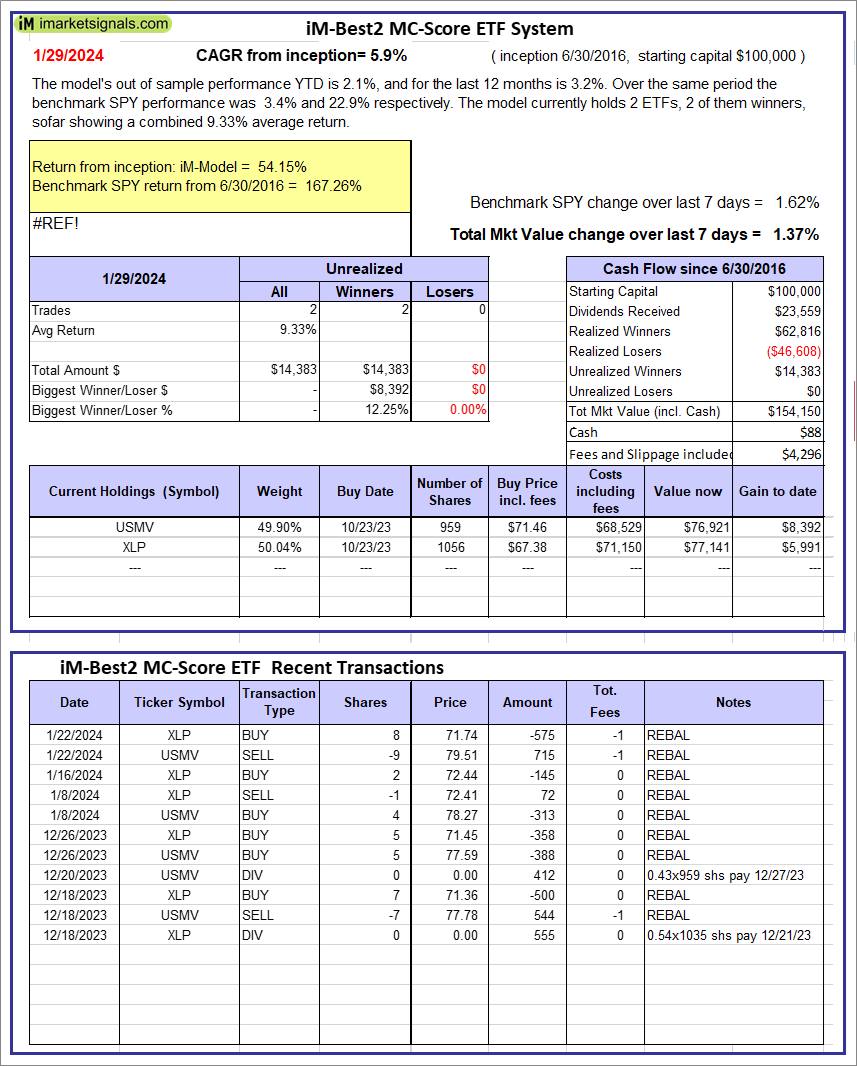 |
iM-Best2 MC-Score ETF System: The model’s out of sample performance YTD is 2.1%, and for the last 12 months is 3.2%. Over the same period the benchmark SPY performance was 3.4% and 22.9% respectively. Over the previous week the market value of the iM-Best2 MC-Score ETF System gained 1.37% at a time when SPY gained 1.62%. A starting capital of $100,000 at inception on 6/30/2016 would have grown to $154,150 which includes $88 cash and excludes $4,296 spent on fees and slippage. |
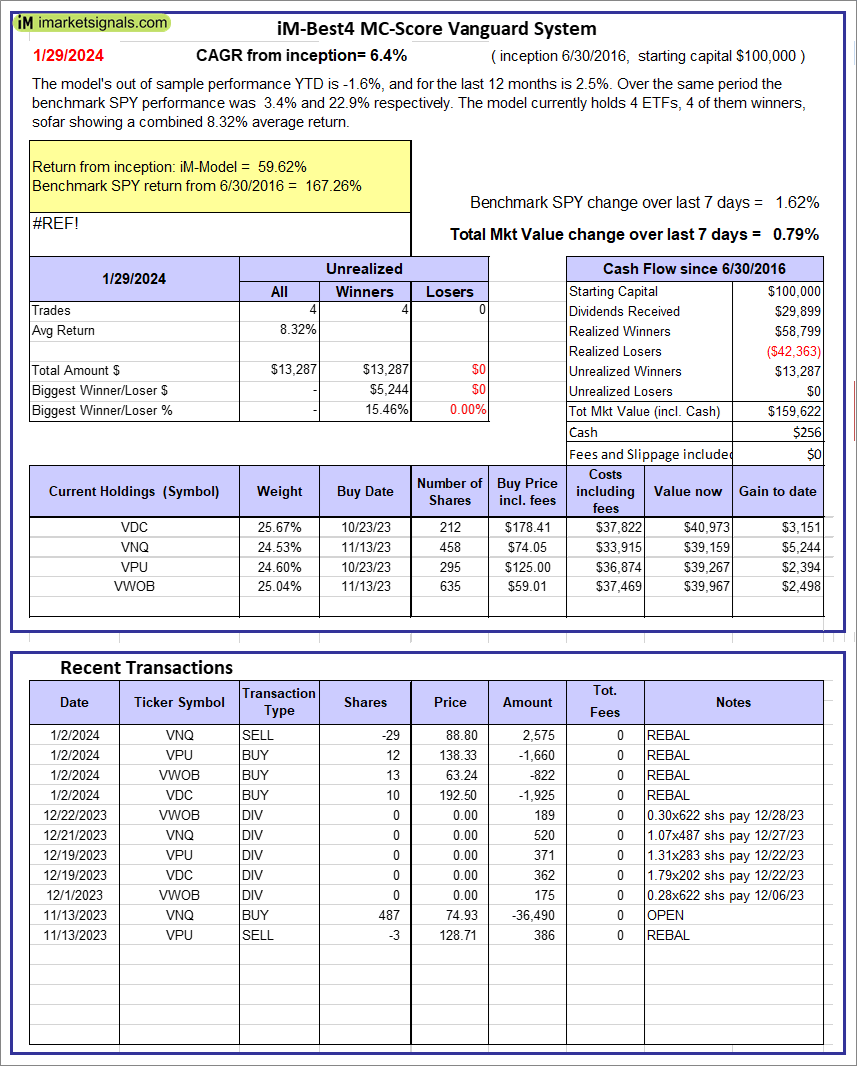 |
iM-Best4 MC-Score Vanguard System: The model’s out of sample performance YTD is -1.6%, and for the last 12 months is 2.5%. Over the same period the benchmark SPY performance was 3.4% and 22.9% respectively. Over the previous week the market value of the iM-Best4 MC-Score Vanguard System gained 0.79% at a time when SPY gained 1.62%. A starting capital of $100,000 at inception on 6/30/2016 would have grown to $159,622 which includes $256 cash and excludes $00 spent on fees and slippage. |
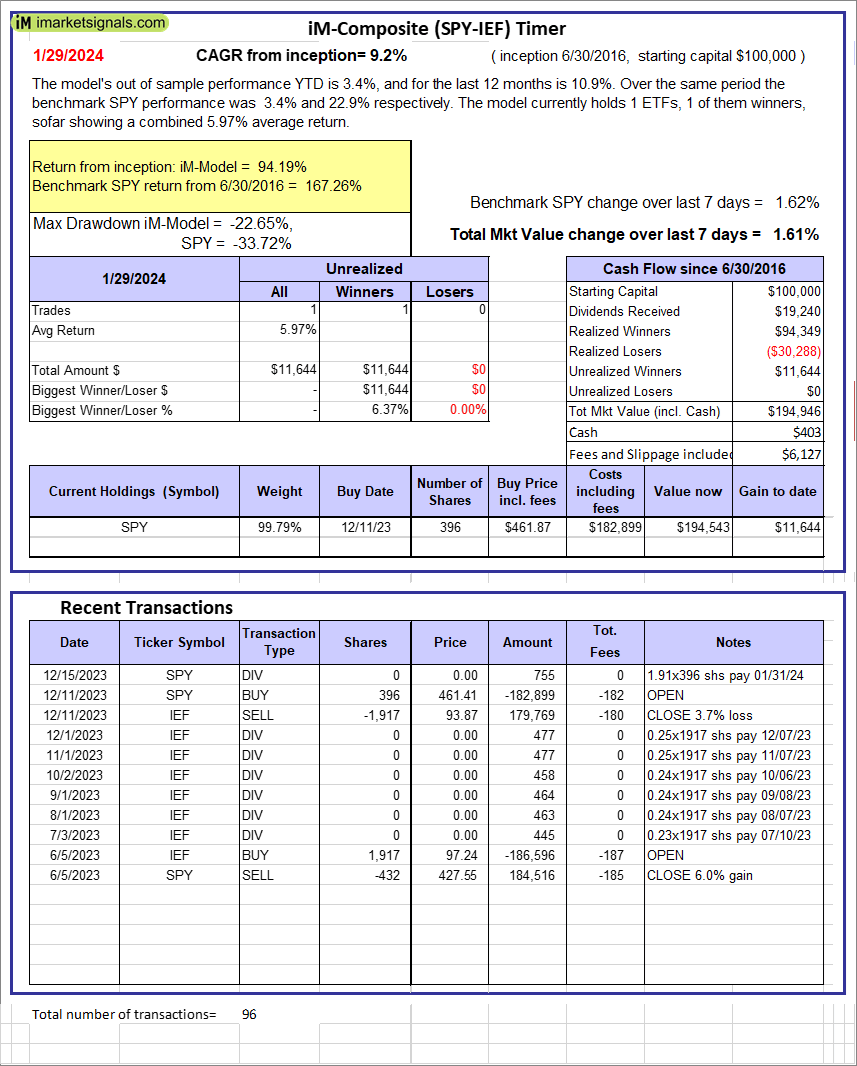 |
iM-Composite (SPY-IEF) Timer: The model’s out of sample performance YTD is 3.4%, and for the last 12 months is 10.9%. Over the same period the benchmark SPY performance was 3.4% and 22.9% respectively. Over the previous week the market value of the iM-Composite (SPY-IEF) Timer gained 1.61% at a time when SPY gained 1.62%. A starting capital of $100,000 at inception on 6/30/2016 would have grown to $194,946 which includes $403 cash and excludes $6,127 spent on fees and slippage. |
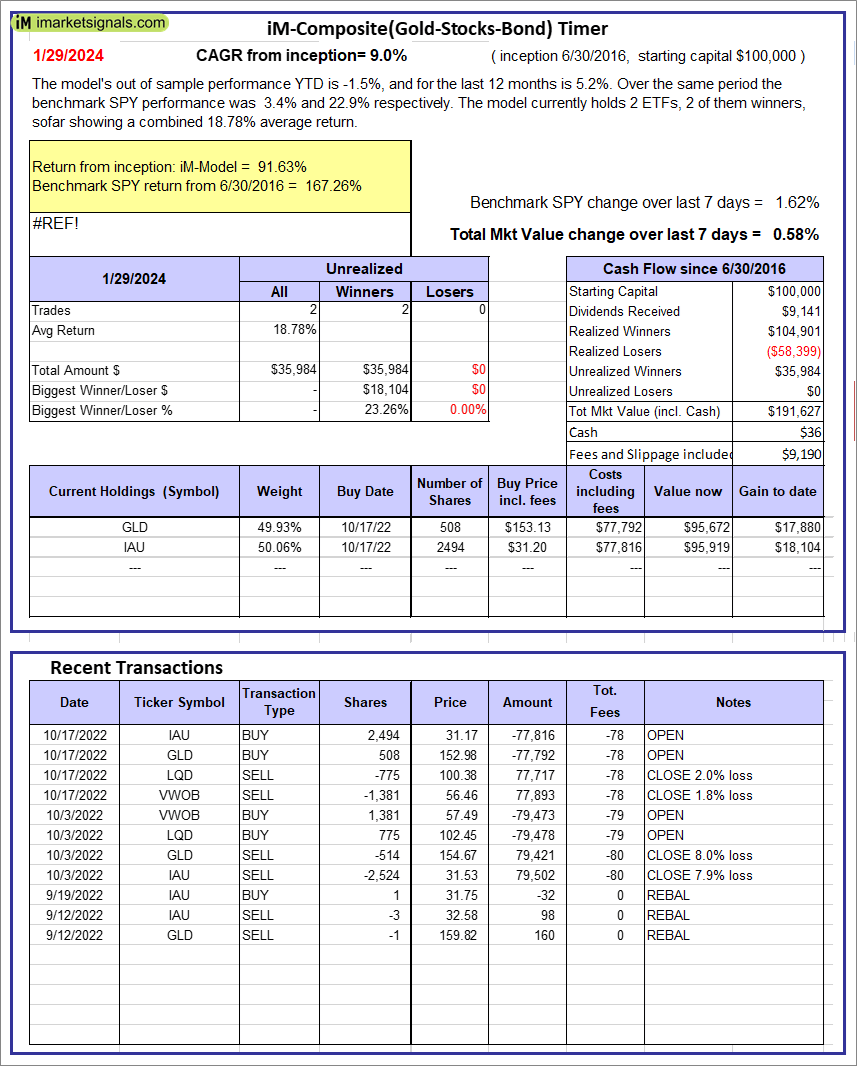 |
iM-Composite(Gold-Stocks-Bond) Timer: The model’s out of sample performance YTD is -1.5%, and for the last 12 months is 5.2%. Over the same period the benchmark SPY performance was 3.4% and 22.9% respectively. Over the previous week the market value of the iM-Composite(Gold-Stocks-Bond) Timer gained 0.58% at a time when SPY gained 1.62%. A starting capital of $100,000 at inception on 6/30/2016 would have grown to $191,627 which includes $36 cash and excludes $9,190 spent on fees and slippage. |
iM-Best Reports – 1/29/2024
Posted in pmp SPY-SH
Leave a Reply
You must be logged in to post a comment.