
  |
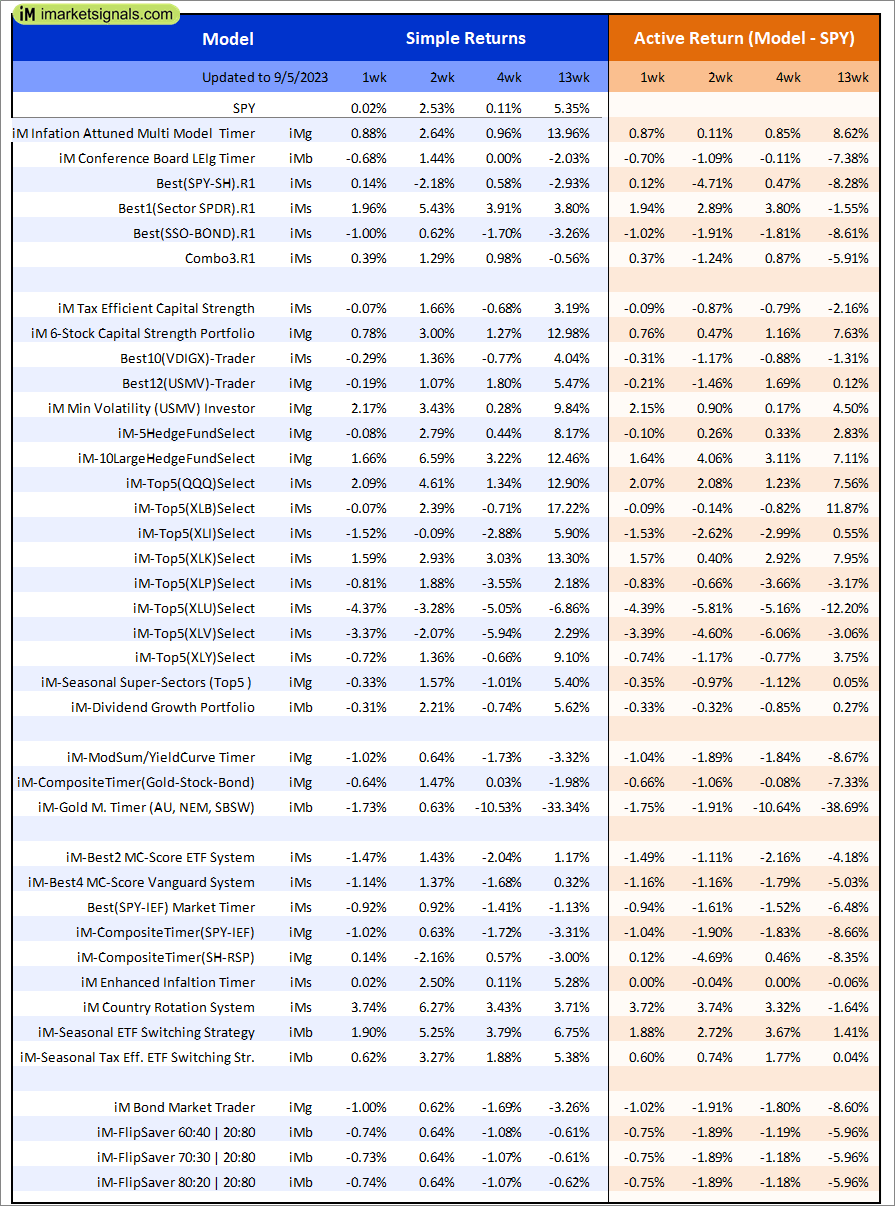
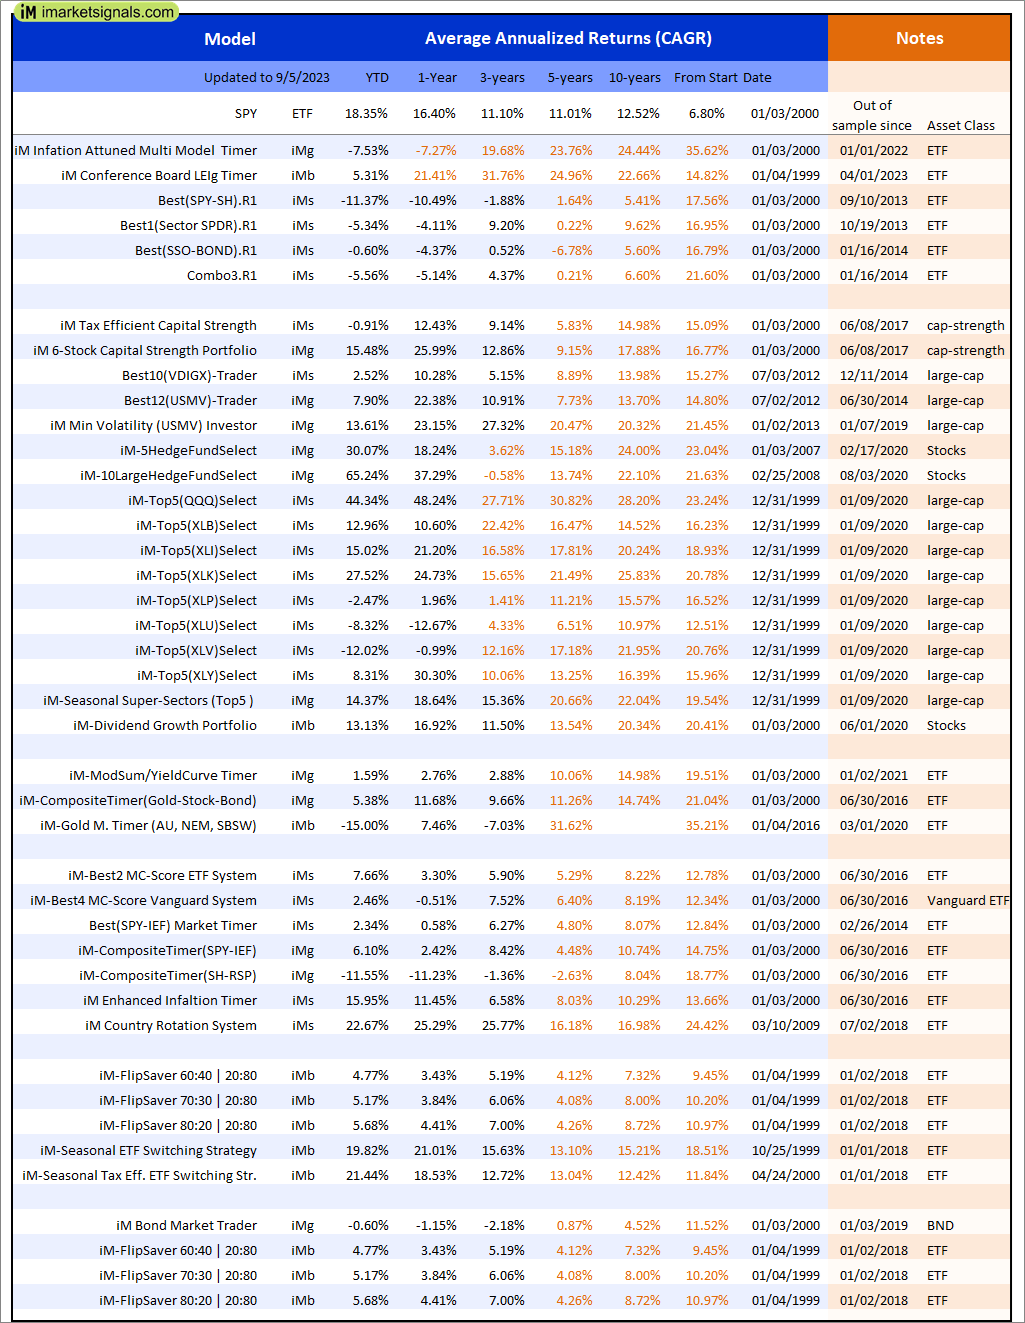
Out of sample performance summary of our models for the past 1, 2, 4 and 13 week periods. The active active return indicates how the models over- or underperformed the benchmark ETF SPY. Also the YTD, and the 1-, 3-, 5- and 10-year annualized returns are shown in the second table |
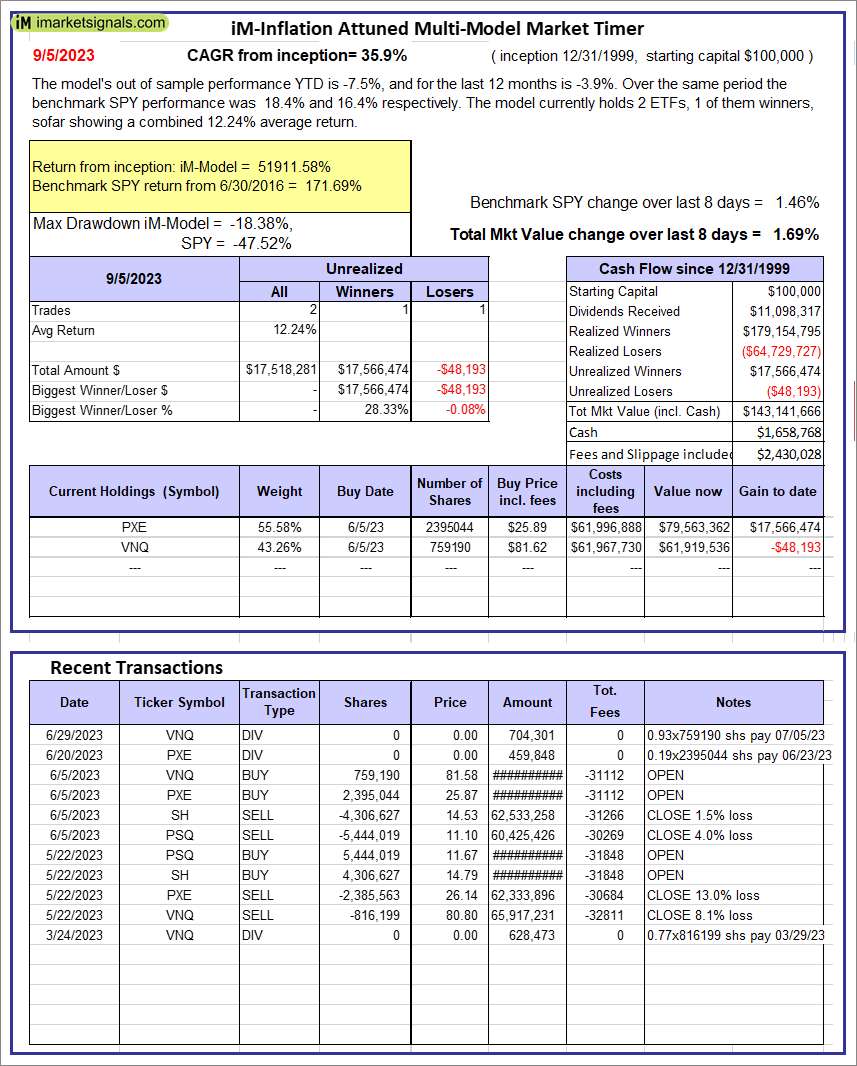 |
iM-Inflation Attuned Multi-Model Market Timer: The model’s out of sample performance YTD is -7.5%, and for the last 12 months is -3.9%. Over the same period the benchmark SPY performance was 18.4% and 16.4% respectively. Over the previous week the market value of the iM-Inflation Attuned Multi-Model Market Timer gained 1.69% at a time when SPY gained 1.46%. A starting capital of $100,000 at inception on 3/24/2017 would have grown to $143,141,666 which includes $1,658,768 cash and excludes $2,430,028 spent on fees and slippage. |
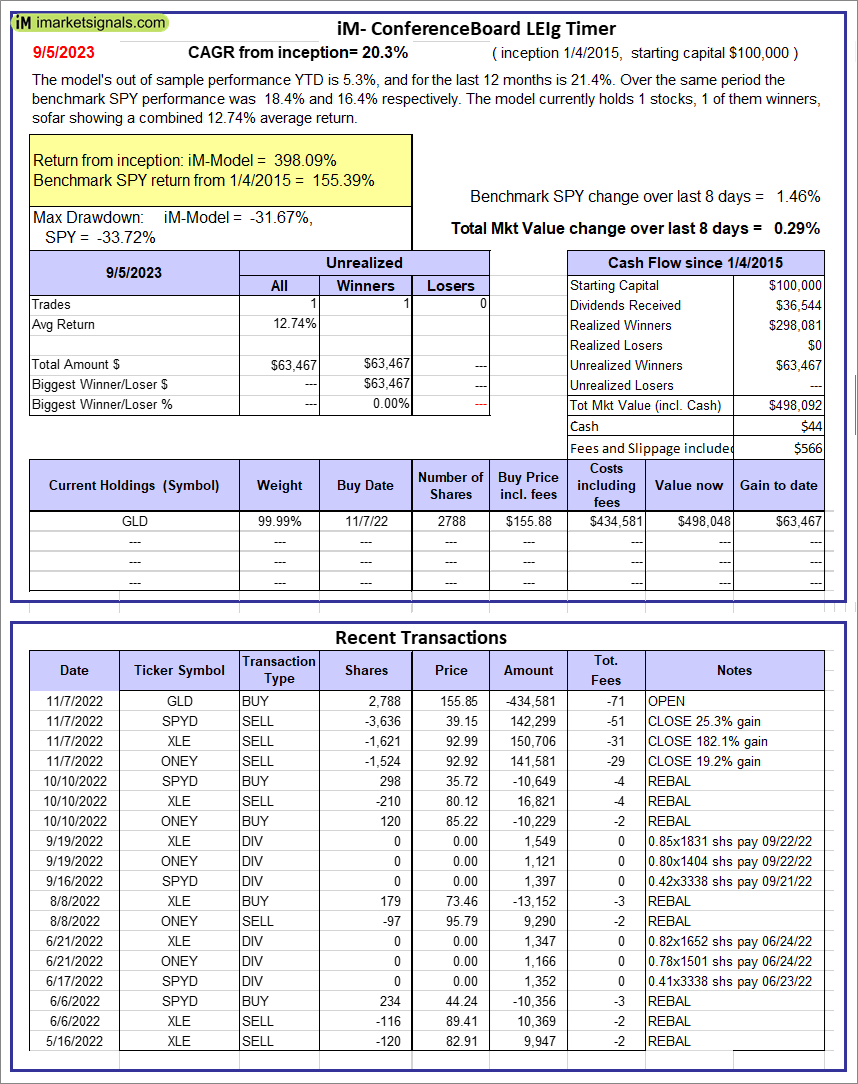 |
iM-Conference Board LEIg Timer: The model’s performance YTD is 14.3%, and for the last 12 months is 7.3%. Over the same period the benchmark SPY performance was 20.1% and 9.4% respectively. Over the previous week the market value of the iM-Conference Board LEIg Timer gained 0.29% at a time when SPY gained 1.46%. A starting capital of $100,000 at inception on 4/5/2017 would have grown to $498,092 which includes $44 cash and excludes $566 spent on fees and slippage. |
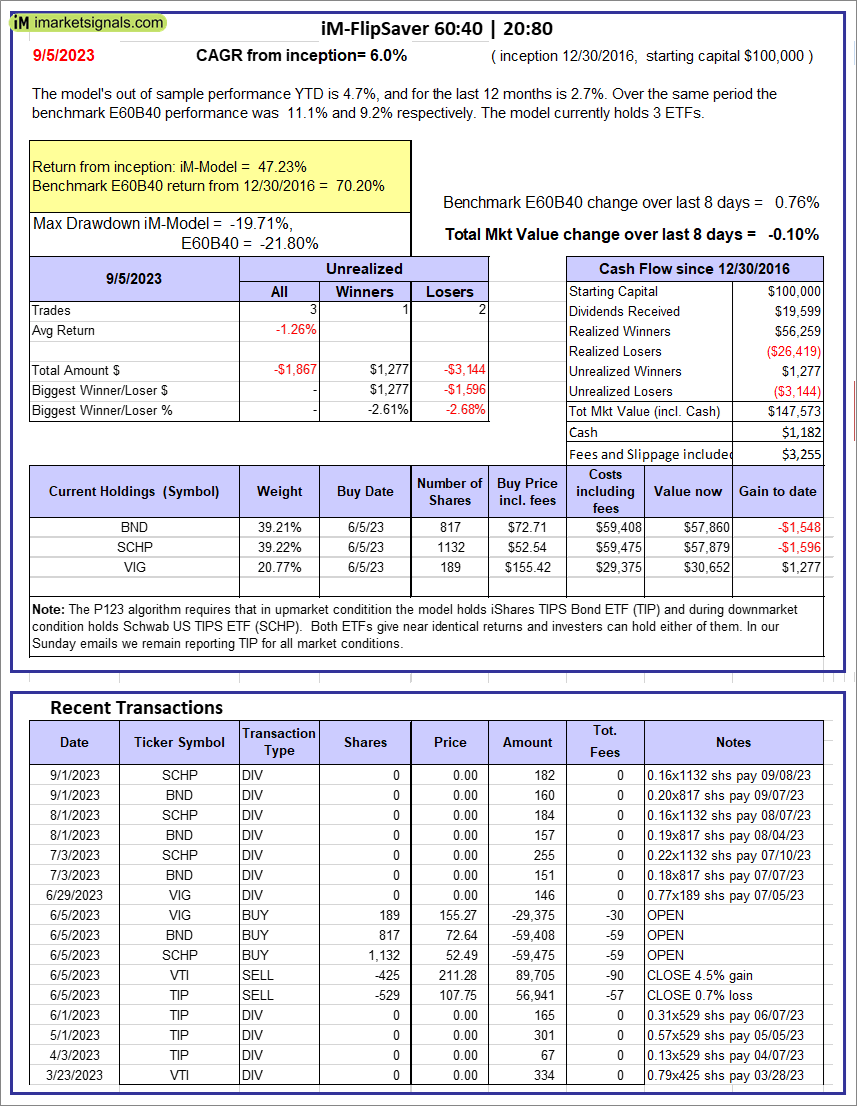 |
iM-FlipSaver 60:40 | 20:80 – 2017: The model’s out of sample performance YTD is 4.7%, and for the last 12 months is 2.7%. Over the same period the benchmark E60B40 performance was 11.1% and 9.2% respectively. Over the previous week the market value of iM-FlipSaver 80:20 | 20:80 gained -0.10% at a time when SPY gained 0.76%. A starting capital of $100,000 at inception on 7/16/2015 would have grown to $147,573 which includes $1,182 cash and excludes $3,255 spent on fees and slippage. |
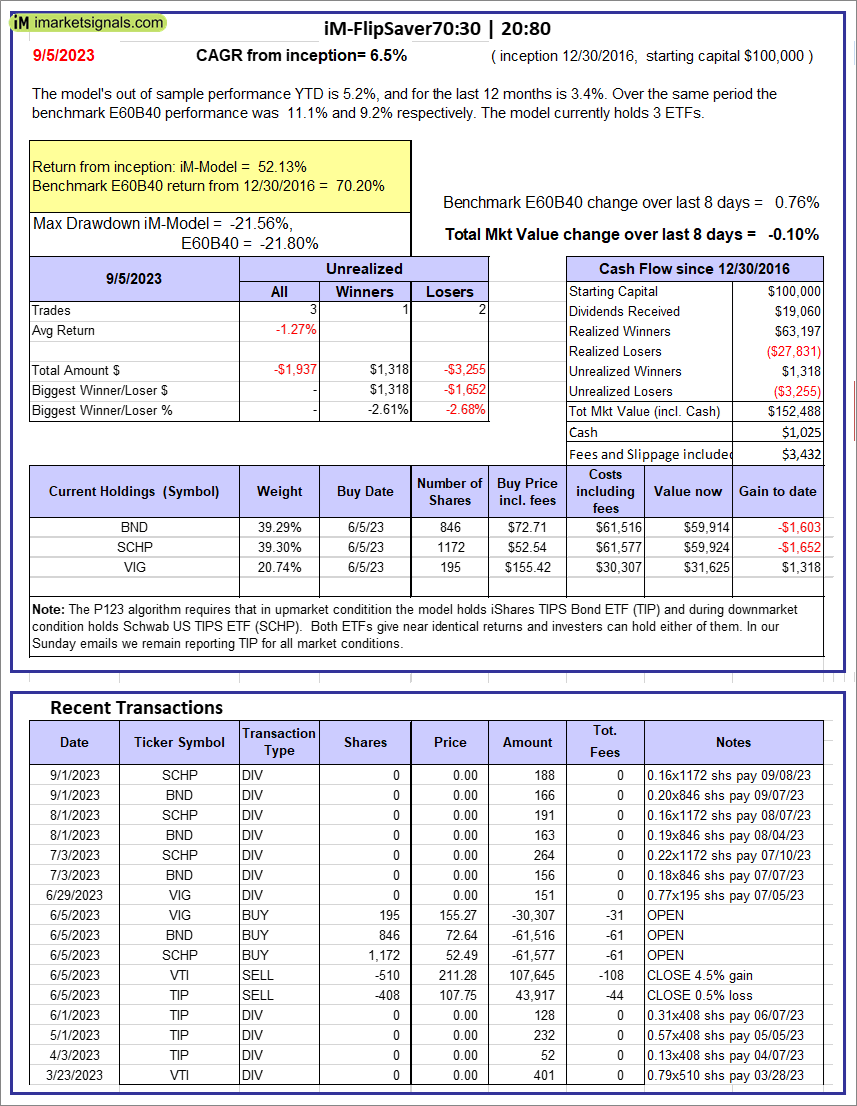 |
iM-FlipSaver 70:30 | 20:80 – 2017: The model’s out of sample performance YTD is 5.2%, and for the last 12 months is 3.4%. Over the same period the benchmark E60B40 performance was 11.1% and 9.2% respectively. Over the previous week the market value of iM-FlipSaver 70:30 | 20:80 gained -0.10% at a time when SPY gained 0.76%. A starting capital of $100,000 at inception on 7/15/2015 would have grown to $152,488 which includes $1,025 cash and excludes $3,432 spent on fees and slippage. |
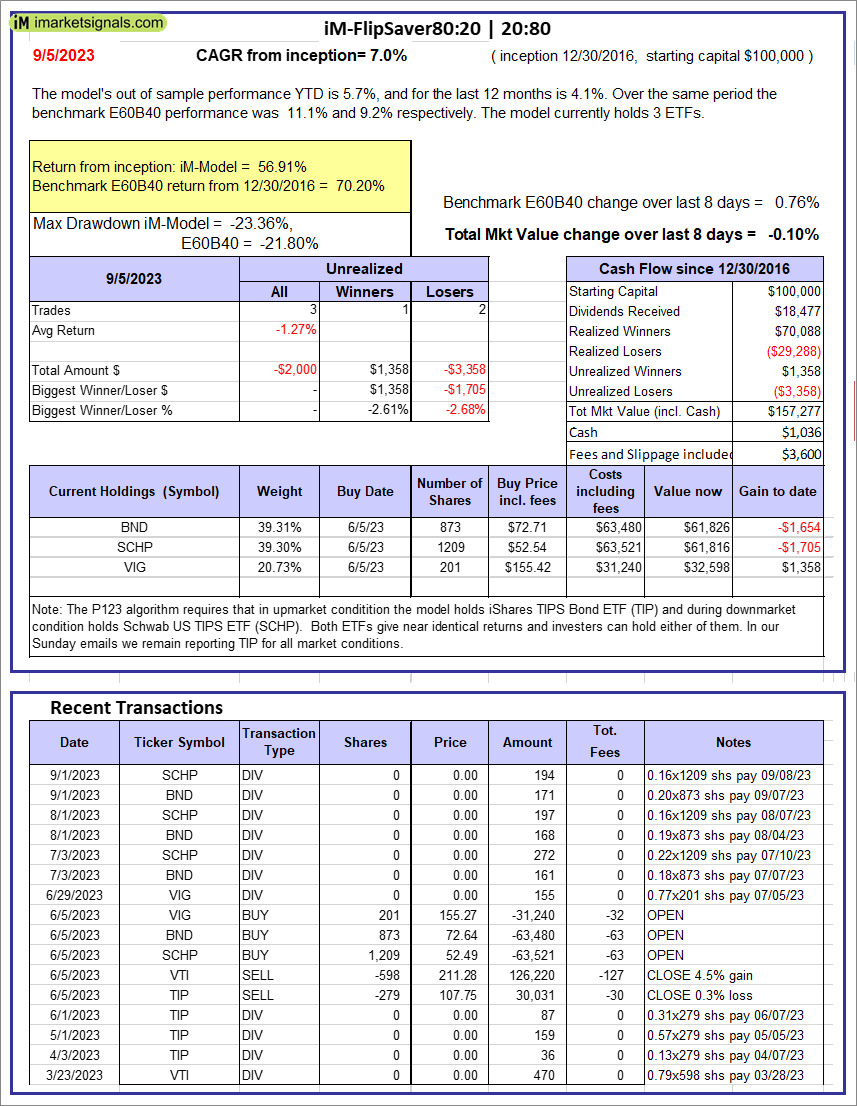 |
iM-FlipSaver 80:20 | 20:80 – 2017: The model’s out of sample performance YTD is 5.7%, and for the last 12 months is 4.1%. Over the same period the benchmark E60B40 performance was 11.1% and 9.2% respectively. Over the previous week the market value of iM-FlipSaver 80:20 | 20:80 gained -0.10% at a time when SPY gained 0.76%. A starting capital of $100,000 at inception on 1/2/2017 would have grown to $157,277 which includes $1,036 cash and excludes $3,600 spent on fees and slippage. |
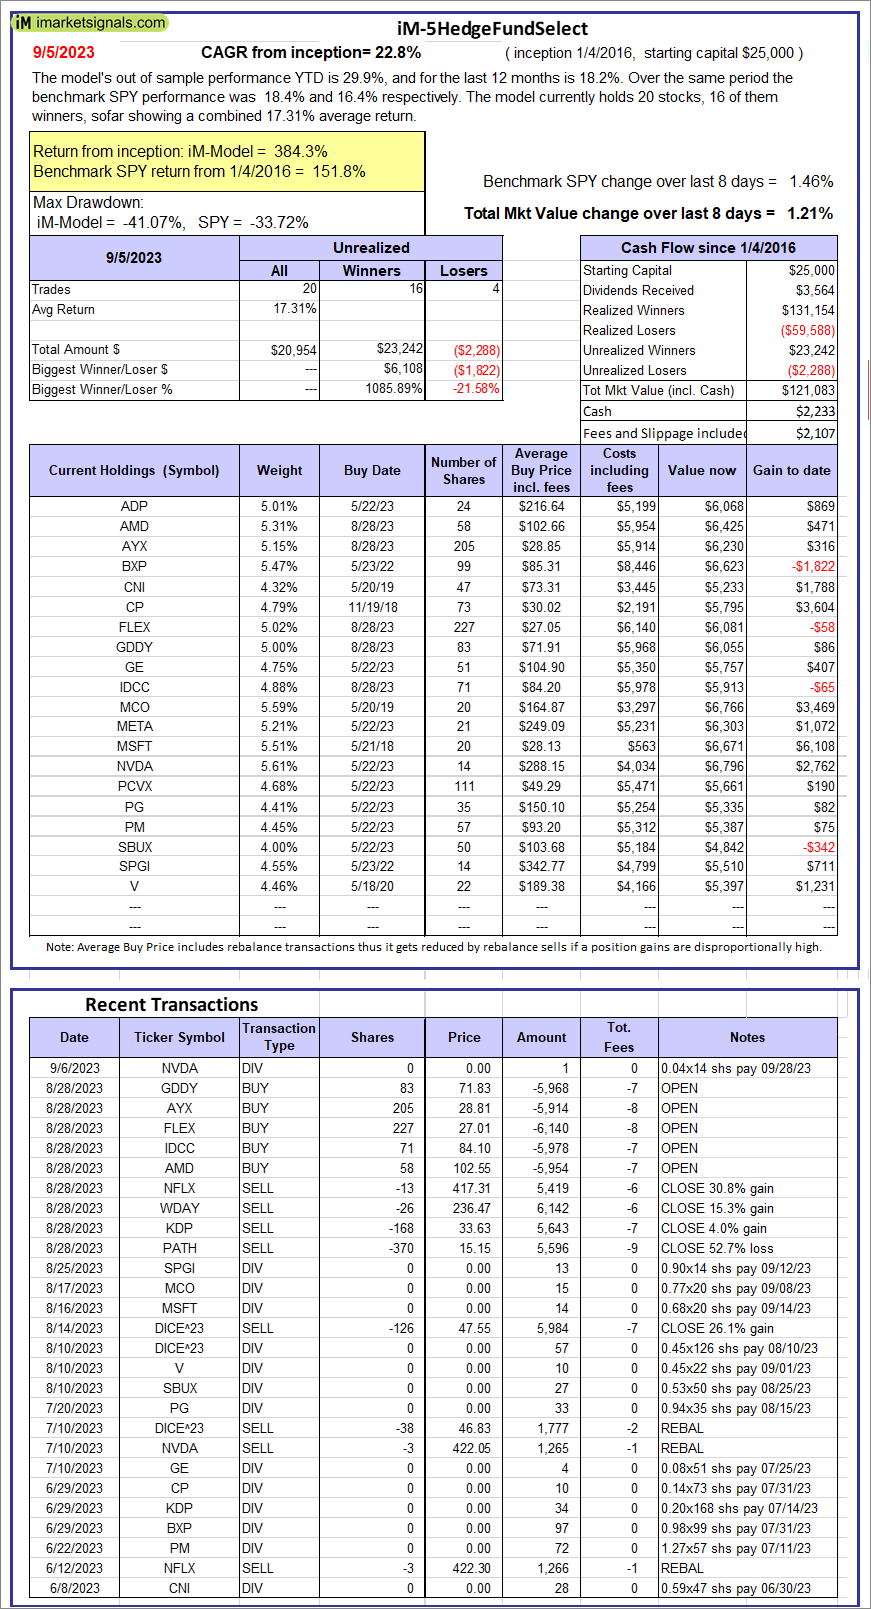 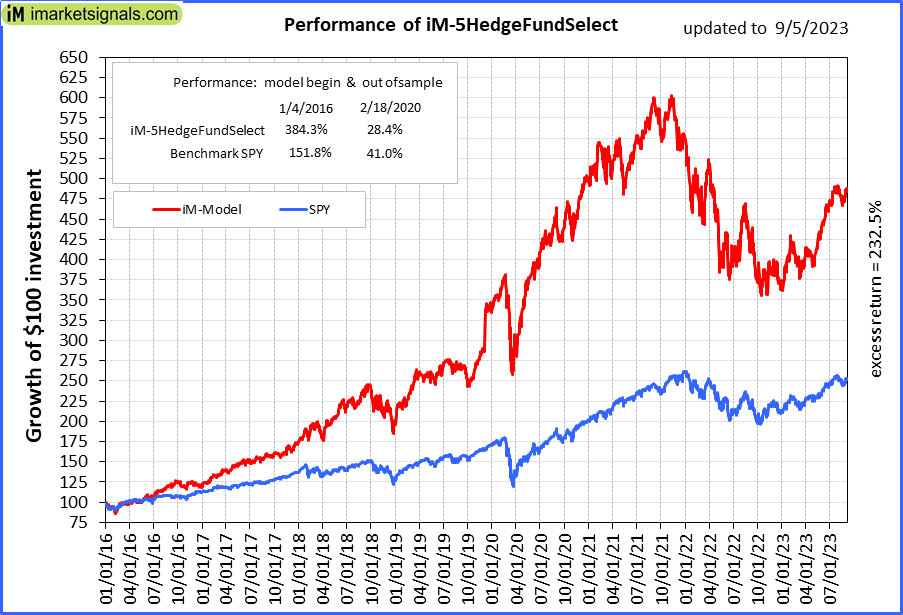 |
iM-5HedgeFundSelect: Since inception, on 1/5/2016, the model gained 384.33% while the benchmark SPY gained 151.81% over the same period. Over the previous week the market value of iM-5HedgeFundSelect gained 1.21% at a time when SPY gained 1.46%. A starting capital of $25,000 at inception on 1/5/2016 would have grown to $121,083 which includes $2,233 cash and excludes $2,107 spent on fees and slippage. |
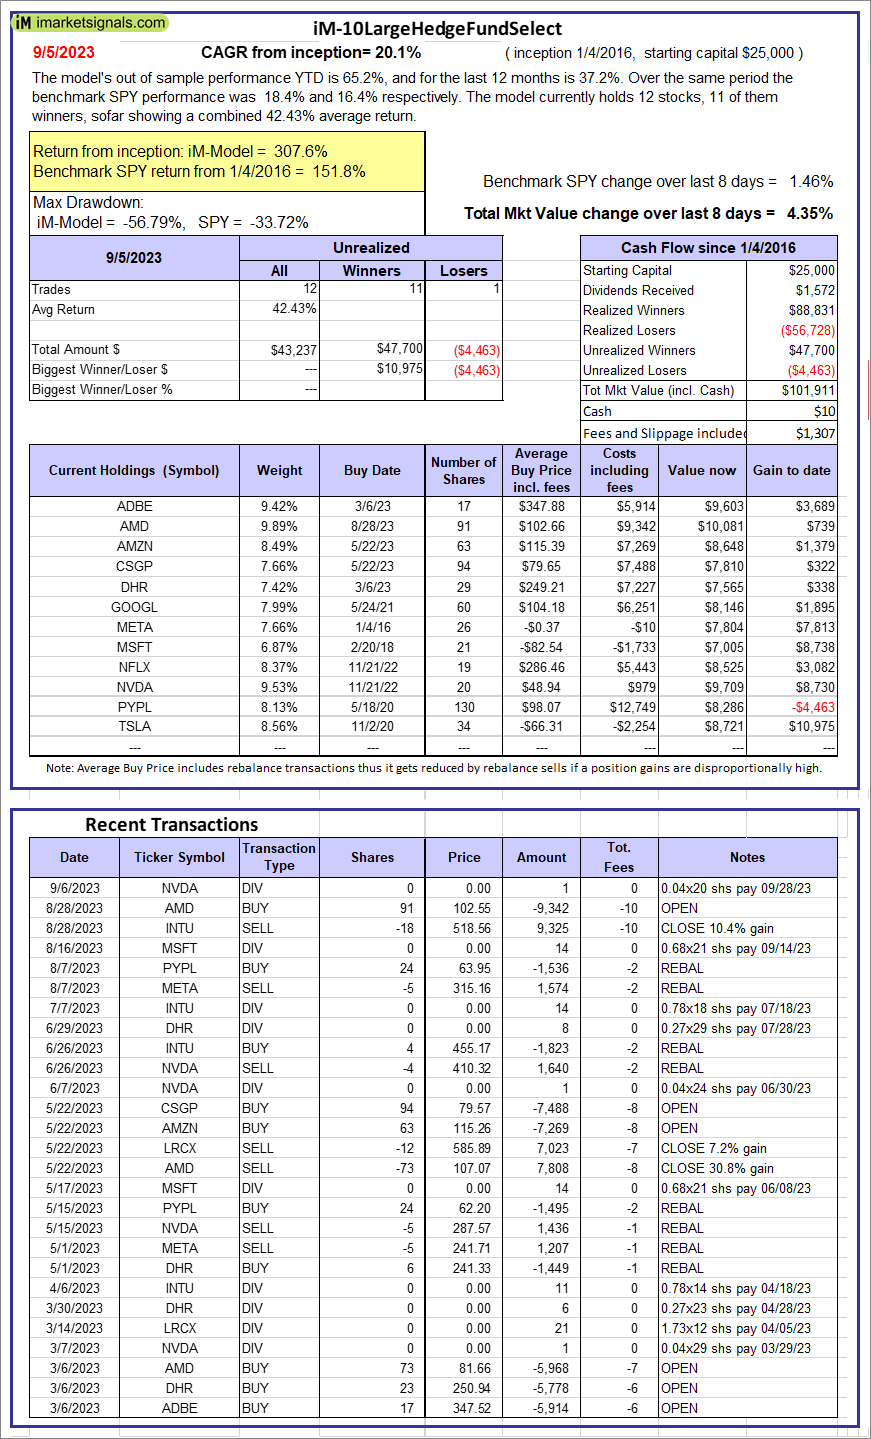  |
iM-10LargeHedgeFundSelect: Since inception, on 1/5/2016, the model gained 307.64% while the benchmark SPY gained 151.81% over the same period. Over the previous week the market value of iM-10LargeHedgeFundSelect gained 4.35% at a time when SPY gained 1.46%. A starting capital of $25,000 at inception on 1/5/2016 would have grown to $101,911 which includes $10 cash and excludes $1,307 spent on fees and slippage. |
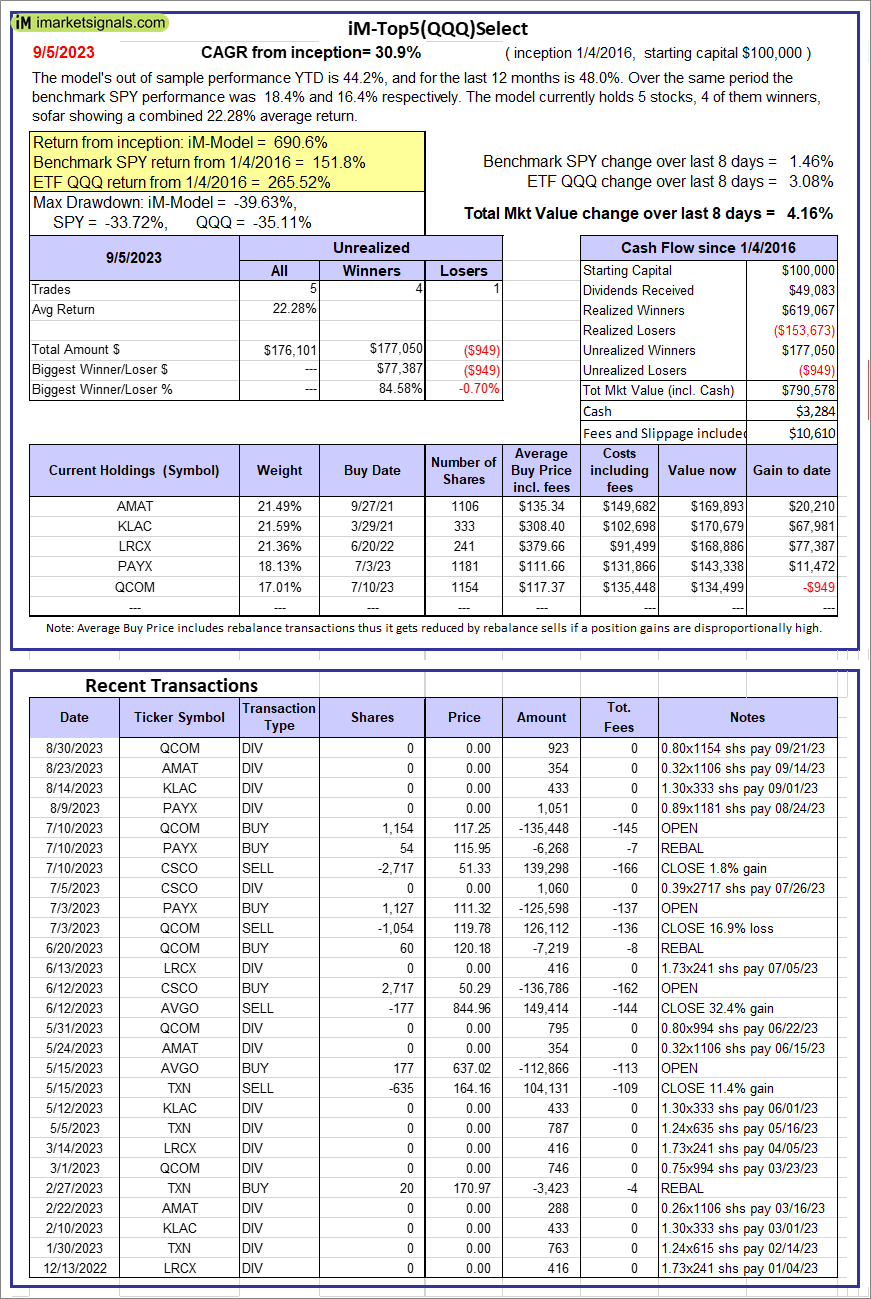 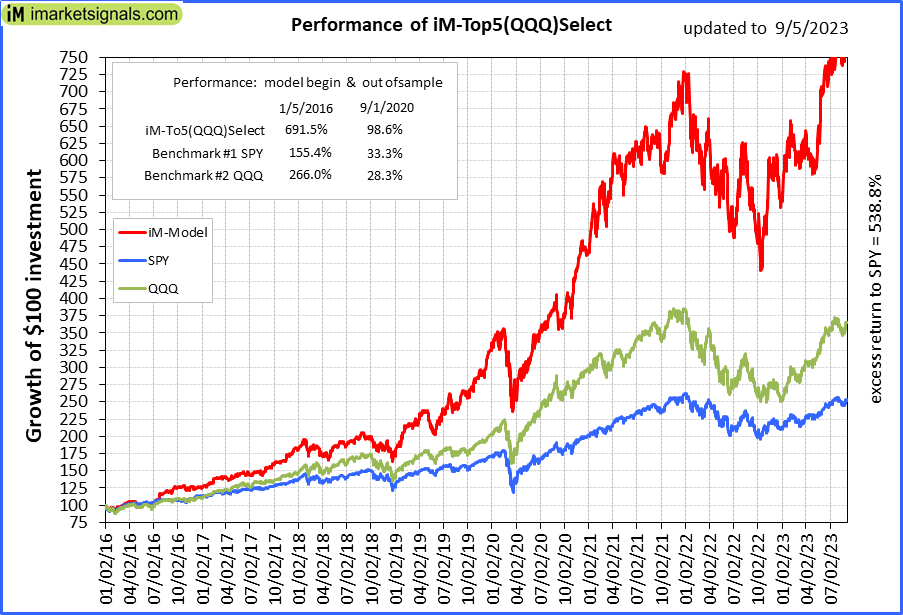 |
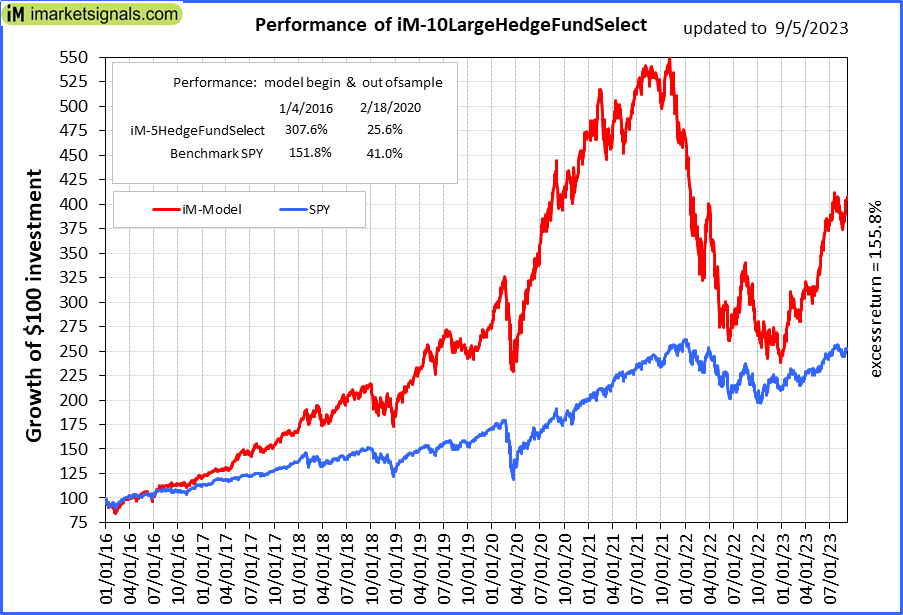
iM-Top5(QQQ)Select: Since inception, on 1/5/2016, the model gained 690.58% while the benchmark SPY gained 151.81% over the same period. Over the previous week the market value of iM-Top5(QQQ)Select gained 4.16% at a time when SPY gained 1.46%. A starting capital of $100,000 at inception on 1/5/2016 would have grown to $790,578 which includes $3,284 cash and excludes $10,610 spent on fees and slippage. |
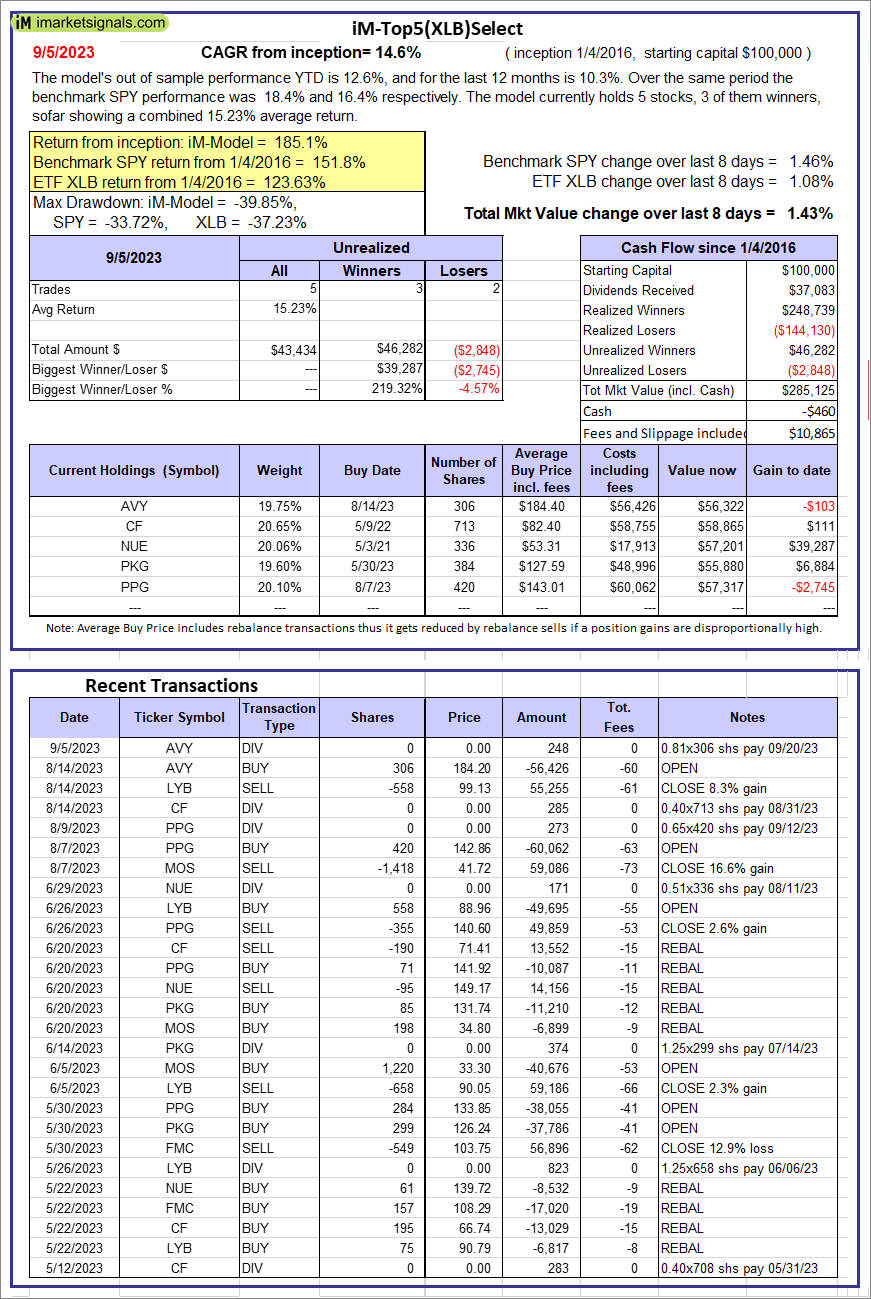 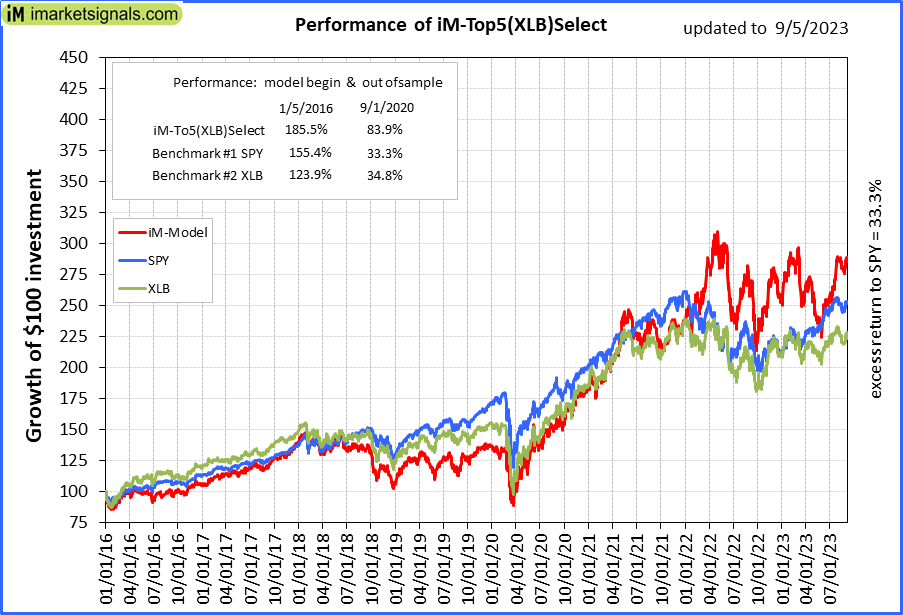 |
iM-Top5(XLB)Select: Since inception, on 1/5/2016, the model gained 185.13% while the benchmark SPY gained 151.81% over the same period. Over the previous week the market value of iM-Top5(XLB)Select gained 1.43% at a time when SPY gained 1.46%. A starting capital of $100,000 at inception on 1/5/2016 would have grown to $285,125 which includes -$460 cash and excludes $10,865 spent on fees and slippage. |
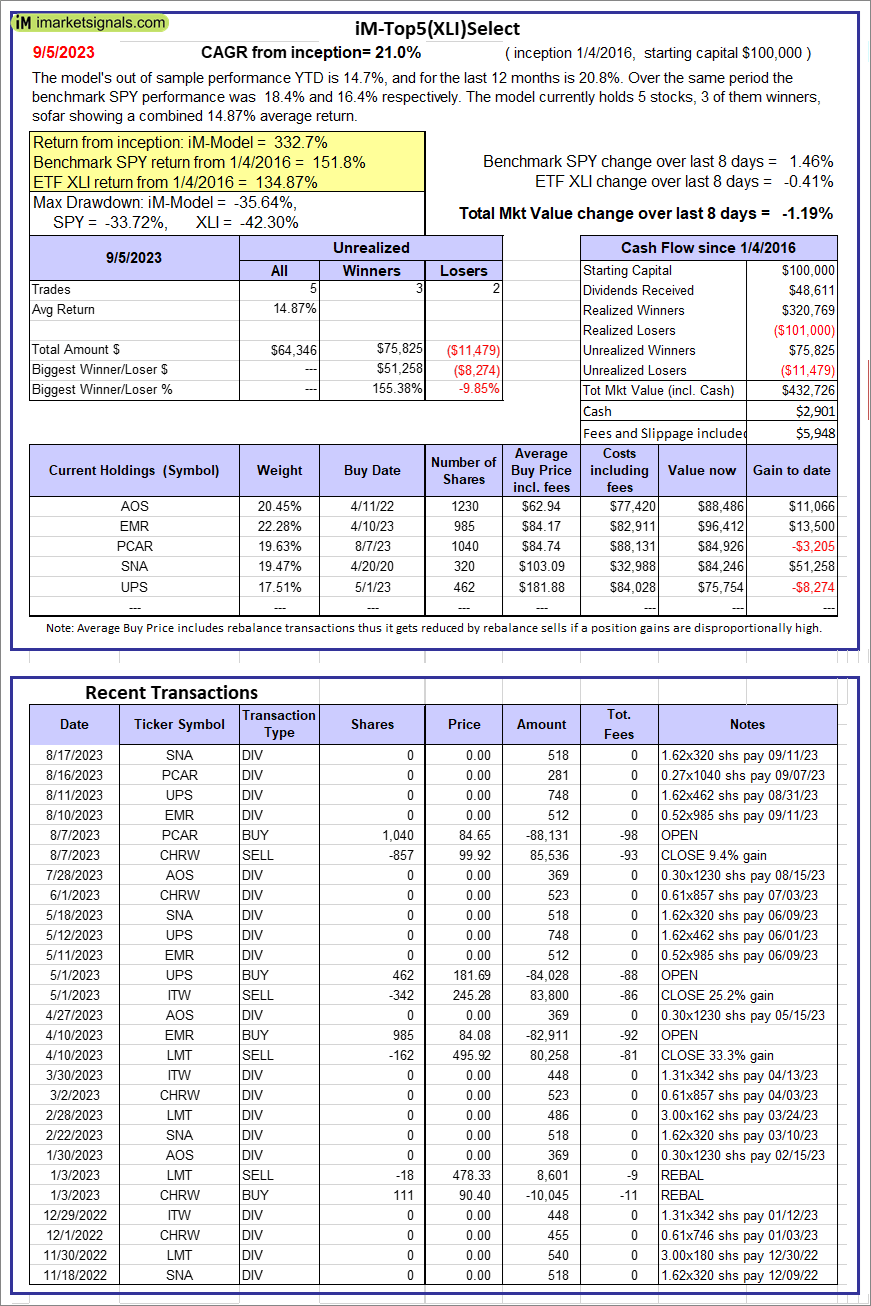 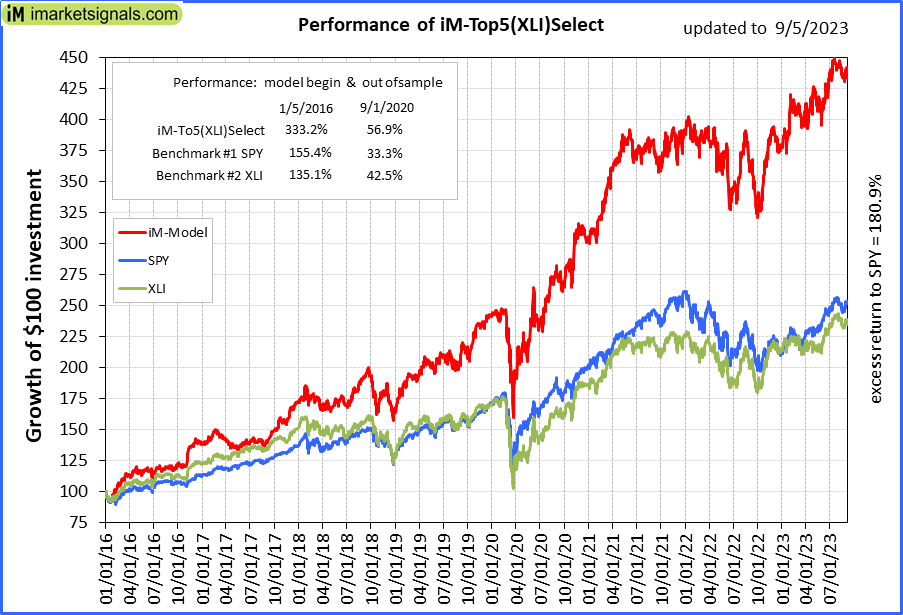 |
iM-Top5(XLI)Select: Since inception, on 1/5/2016, the model gained 332.73% while the benchmark SPY gained 151.81% over the same period. Over the previous week the market value of iM-Top5(XLI)Select gained -1.19% at a time when SPY gained 1.46%. A starting capital of $100,000 at inception on 1/5/2016 would have grown to $432,726 which includes $2,901 cash and excludes $5,948 spent on fees and slippage. |
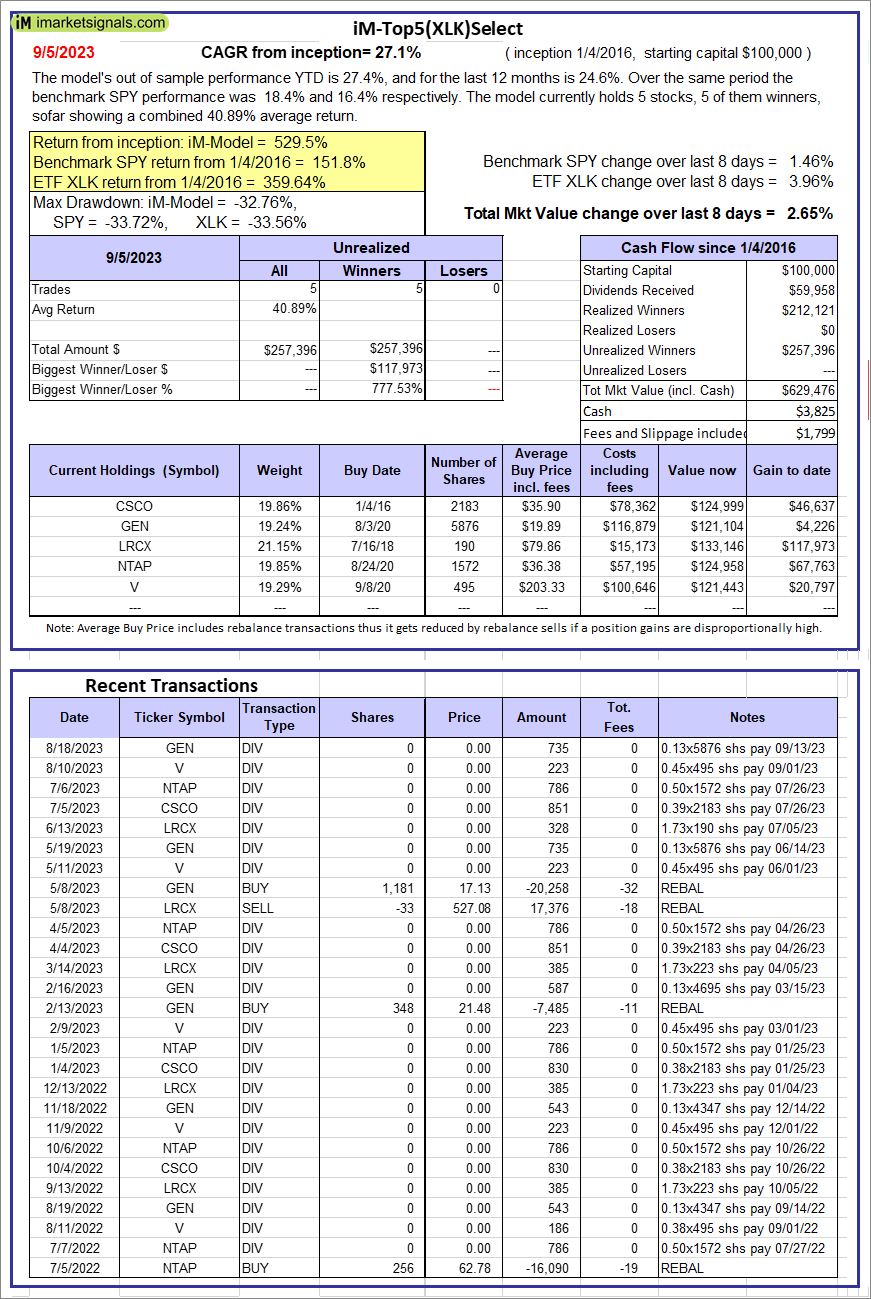 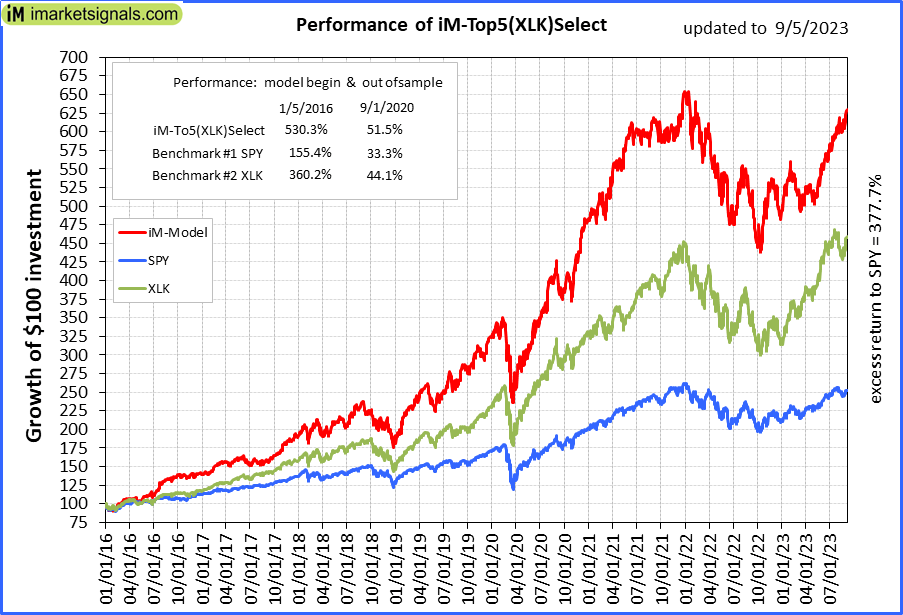 |
iM-Top5(XLK)Select: Since inception, on 1/5/2016, the model gained 529.48% while the benchmark SPY gained 151.81% over the same period. Over the previous week the market value of iM-Top5(XLK)Select gained 2.65% at a time when SPY gained 1.46%. A starting capital of $100,000 at inception on 1/5/2016 would have grown to $629,476 which includes $3,825 cash and excludes $1,799 spent on fees and slippage. |
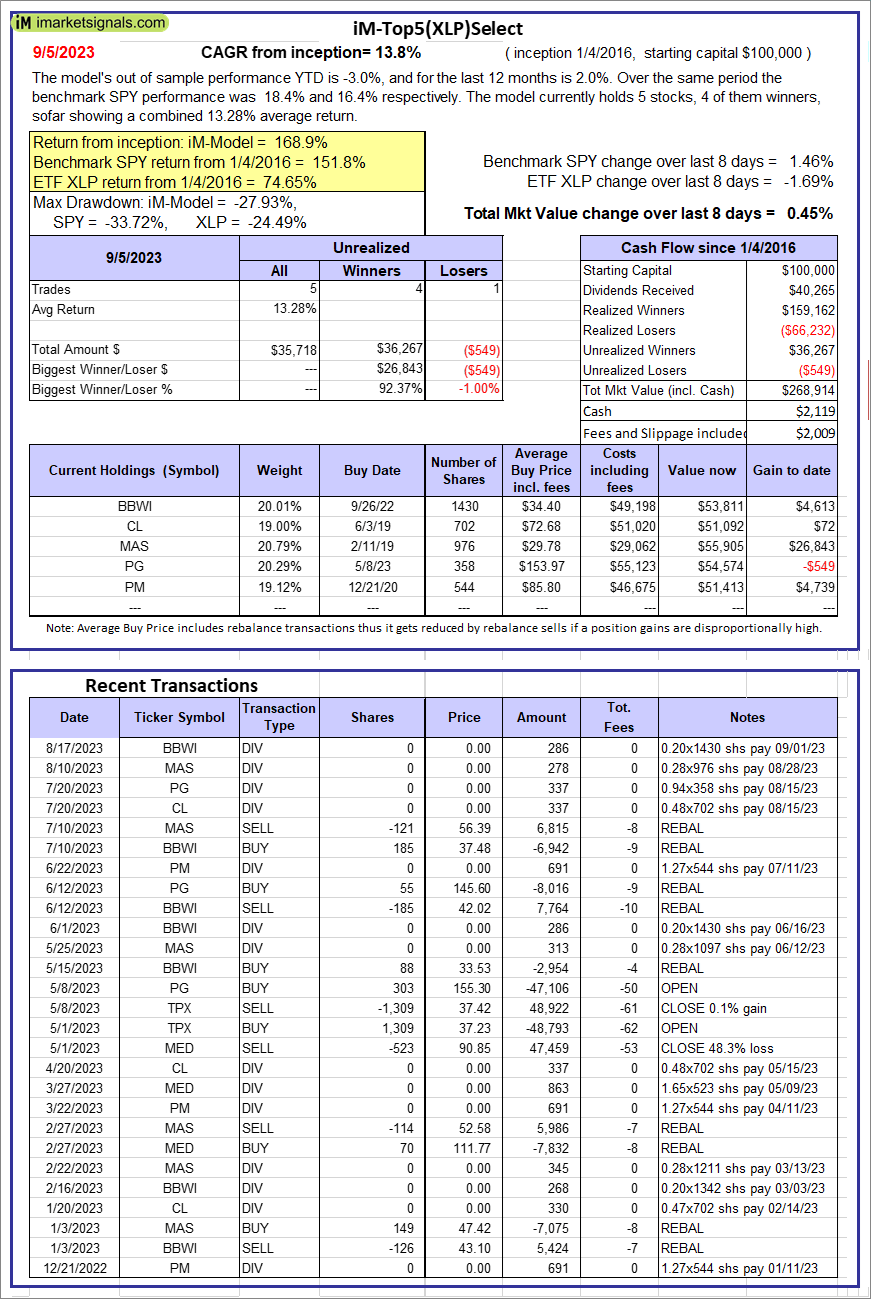 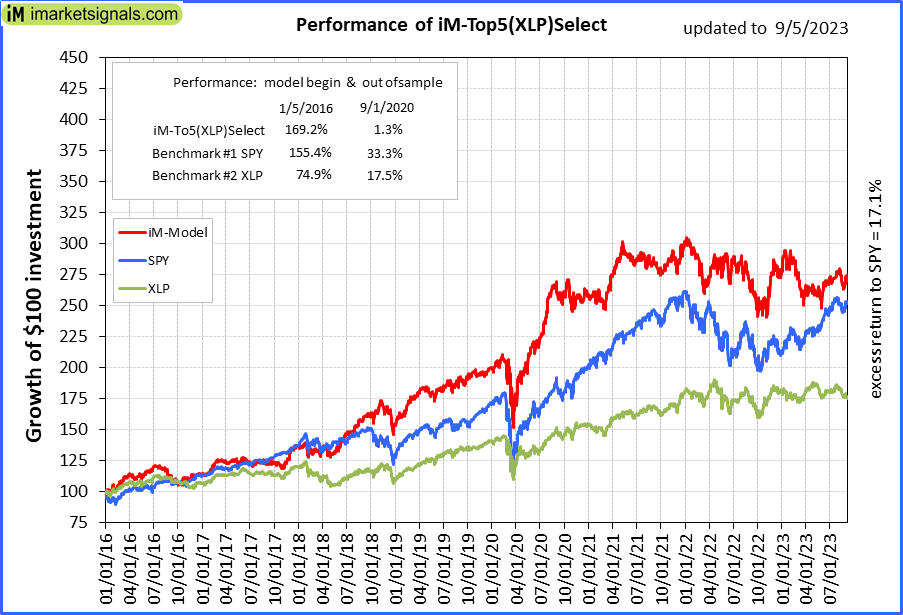 |
iM-Top5(XLP)Select: Since inception, on 1/5/2016, the model gained 168.91% while the benchmark SPY gained 151.81% over the same period. Over the previous week the market value of iM-Top5(XLP)Select gained 0.45% at a time when SPY gained 1.46%. A starting capital of $100,000 at inception on 1/5/2016 would have grown to $268,914 which includes $2,119 cash and excludes $2,009 spent on fees and slippage. |
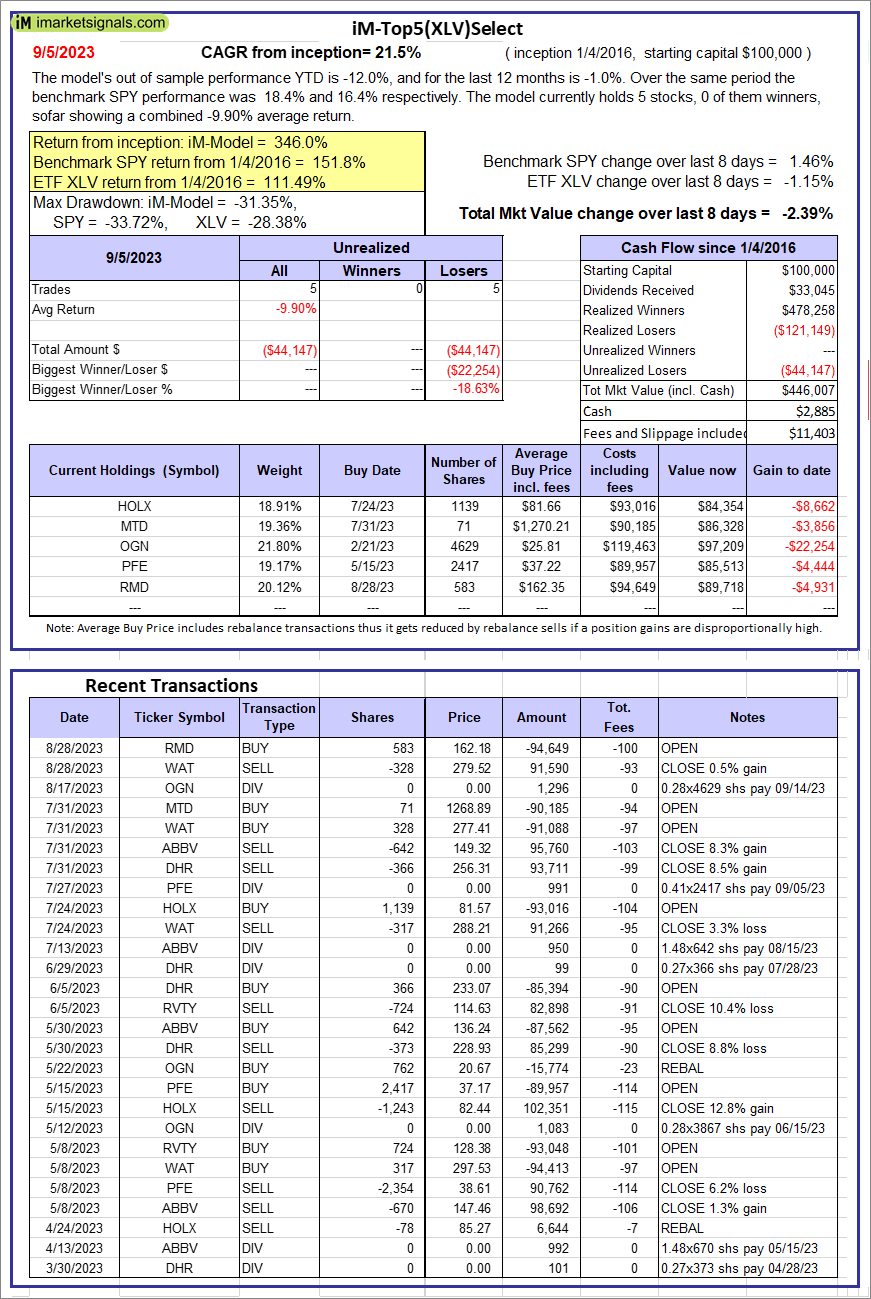 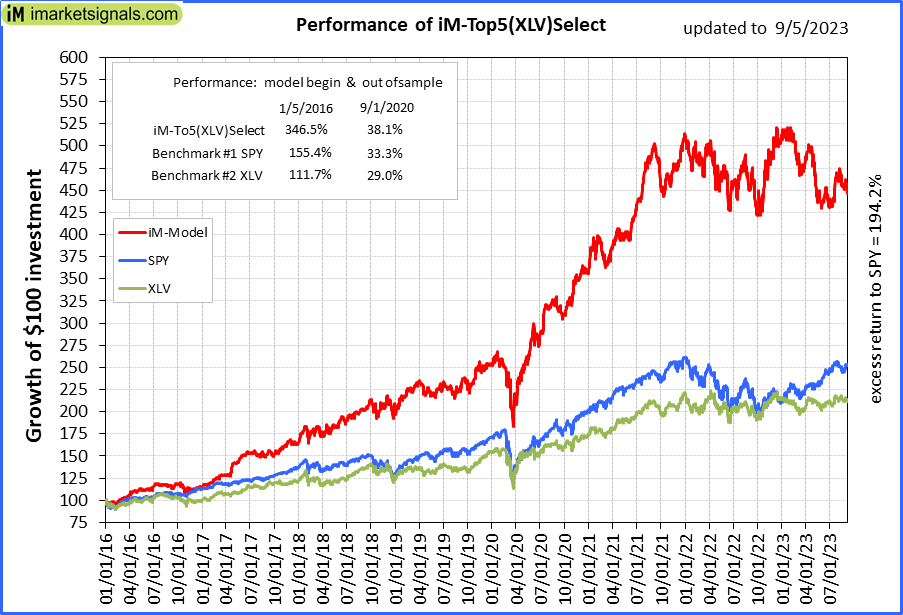 |
iM-Top5(XLV)Select: Since inception, on 1/5/2016, the model gained 346.01% while the benchmark SPY gained 151.81% over the same period. Over the previous week the market value of iM-Top5(XLV)Select gained -2.39% at a time when SPY gained 1.46%. A starting capital of $100,000 at inception on 1/5/2016 would have grown to $446,007 which includes $2,885 cash and excludes $11,403 spent on fees and slippage. |
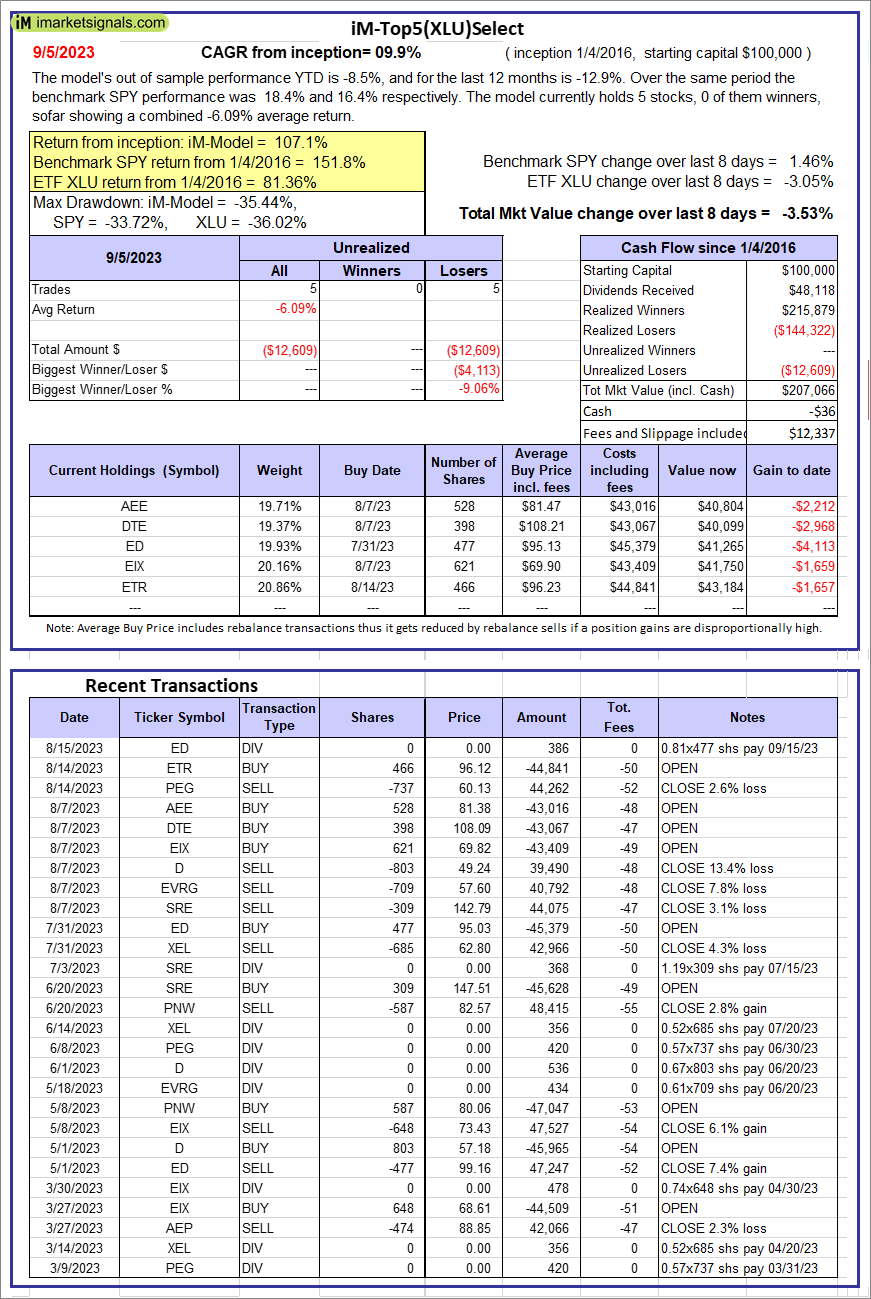 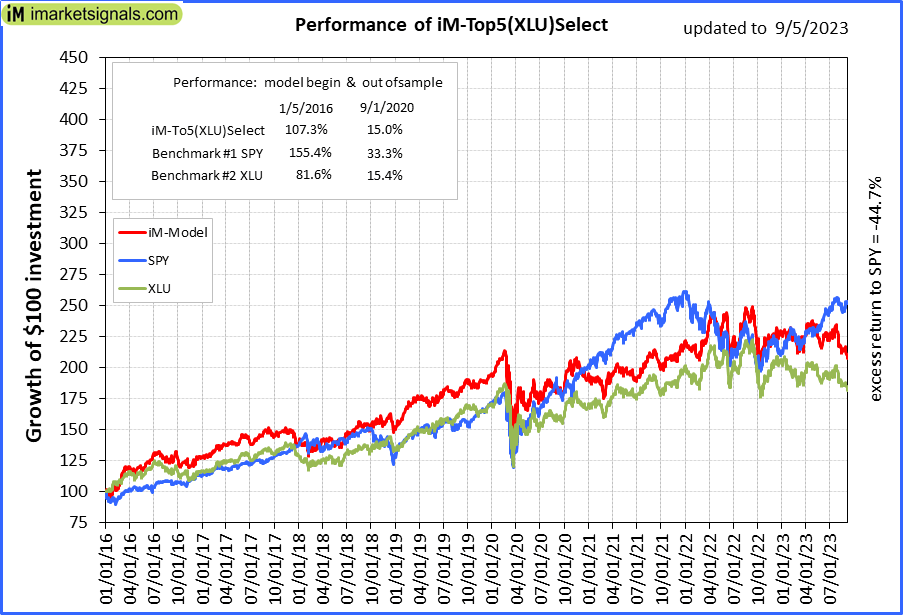 |
iM-Top5(XLU)Select: Since inception, on 1/5/2016, the model gained 107.07% while the benchmark SPY gained 151.81% over the same period. Over the previous week the market value of iM-Top5(XLU)Select gained -3.53% at a time when SPY gained 1.46%. A starting capital of $100,000 at inception on 1/5/2016 would have grown to $207,066 which includes -$36 cash and excludes $12,337 spent on fees and slippage. |
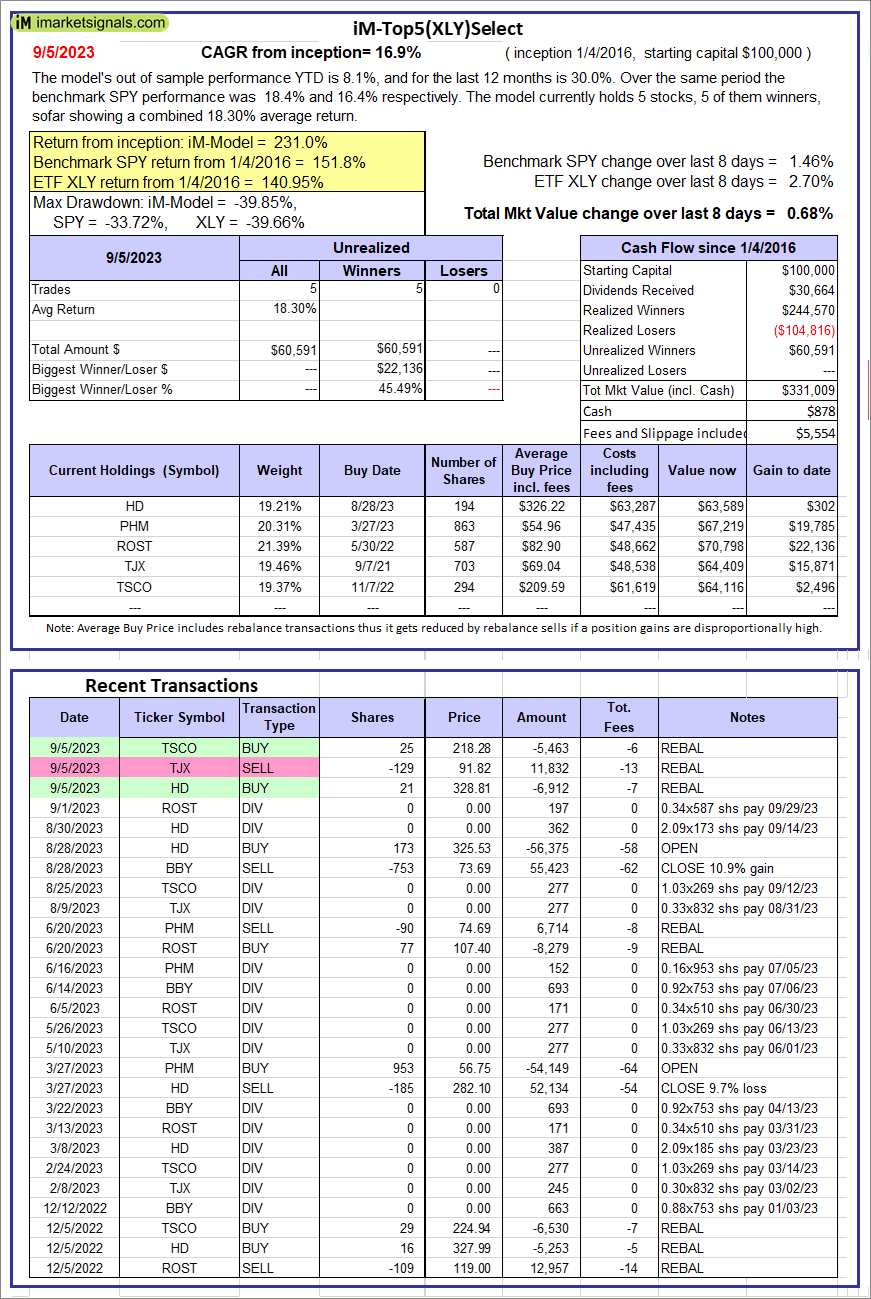 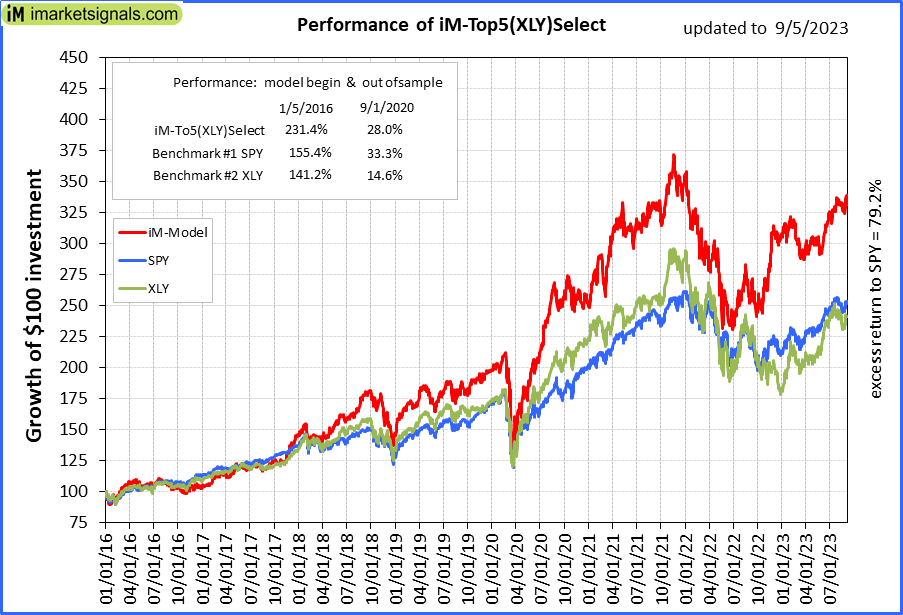 |
iM-Top5(XLY)Select: Since inception, on 1/5/2016, the model gained 231.01% while the benchmark SPY gained 151.81% over the same period. Over the previous week the market value of iM-Top5(XLY)Select gained 0.68% at a time when SPY gained 1.46%. A starting capital of $100,000 at inception on 1/5/2016 would have grown to $331,009 which includes $878 cash and excludes $5,554 spent on fees and slippage. |
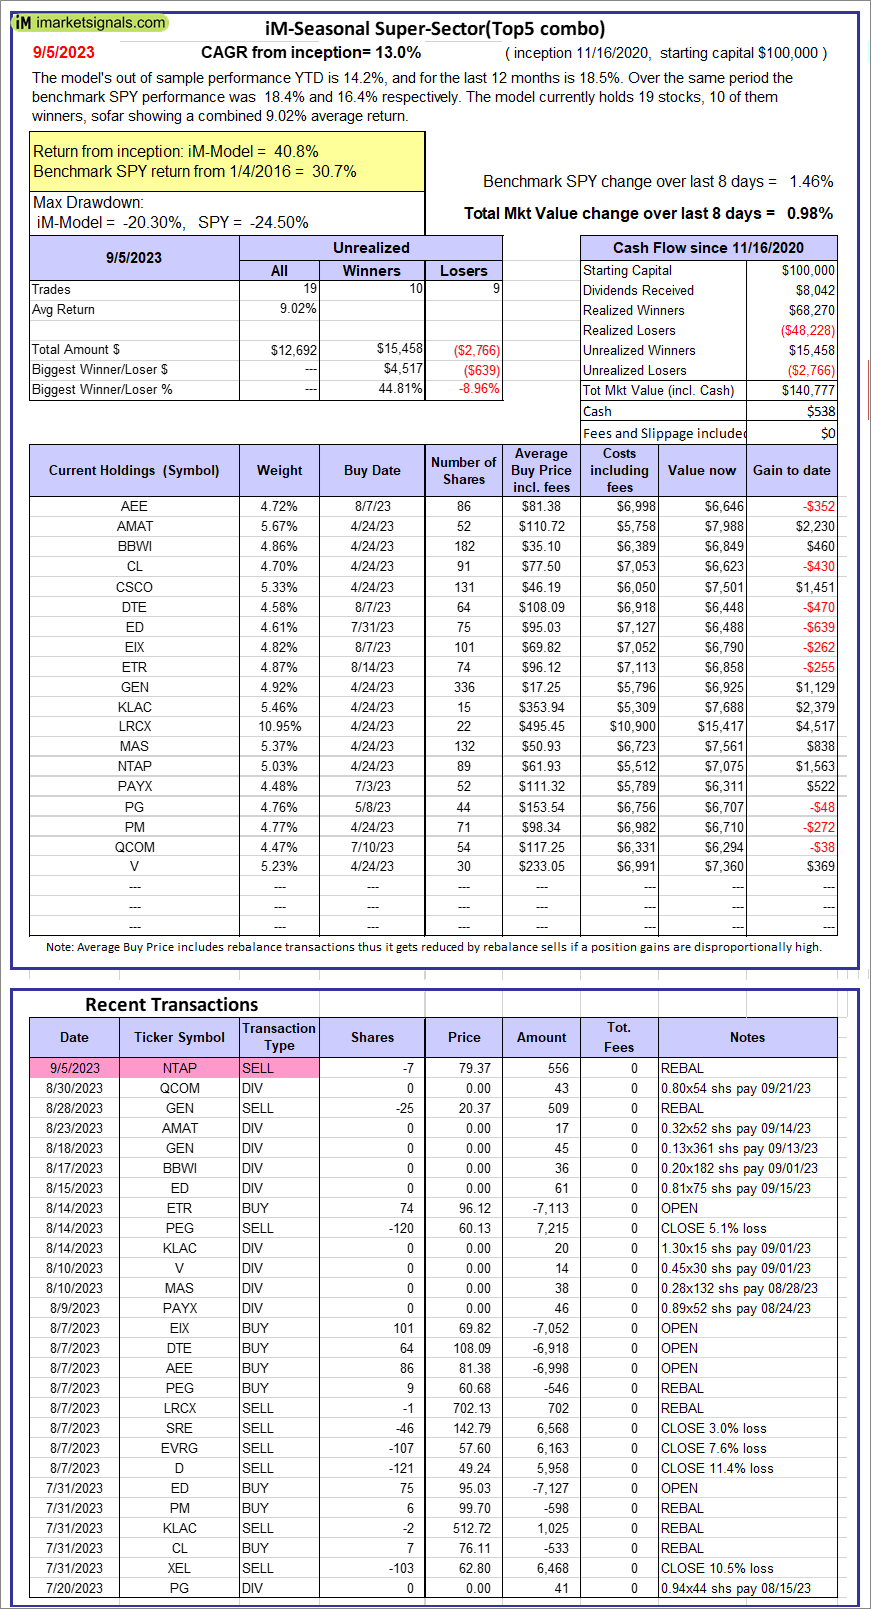 |
iM-Seasonal Super-Sectors (Top5 combo) : Since inception, on 11/17/2020, the model gained 40.78% while the benchmark SPY gained 30.72% over the same period. Over the previous week the market value of iM-Seasonal Super-Sectors (Top5 combo) gained 0.98% at a time when SPY gained 1.46%. A starting capital of $100,000 at inception on 11/17/2020 would have grown to $140,777 which includes $538 cash and excludes $00 spent on fees and slippage. |
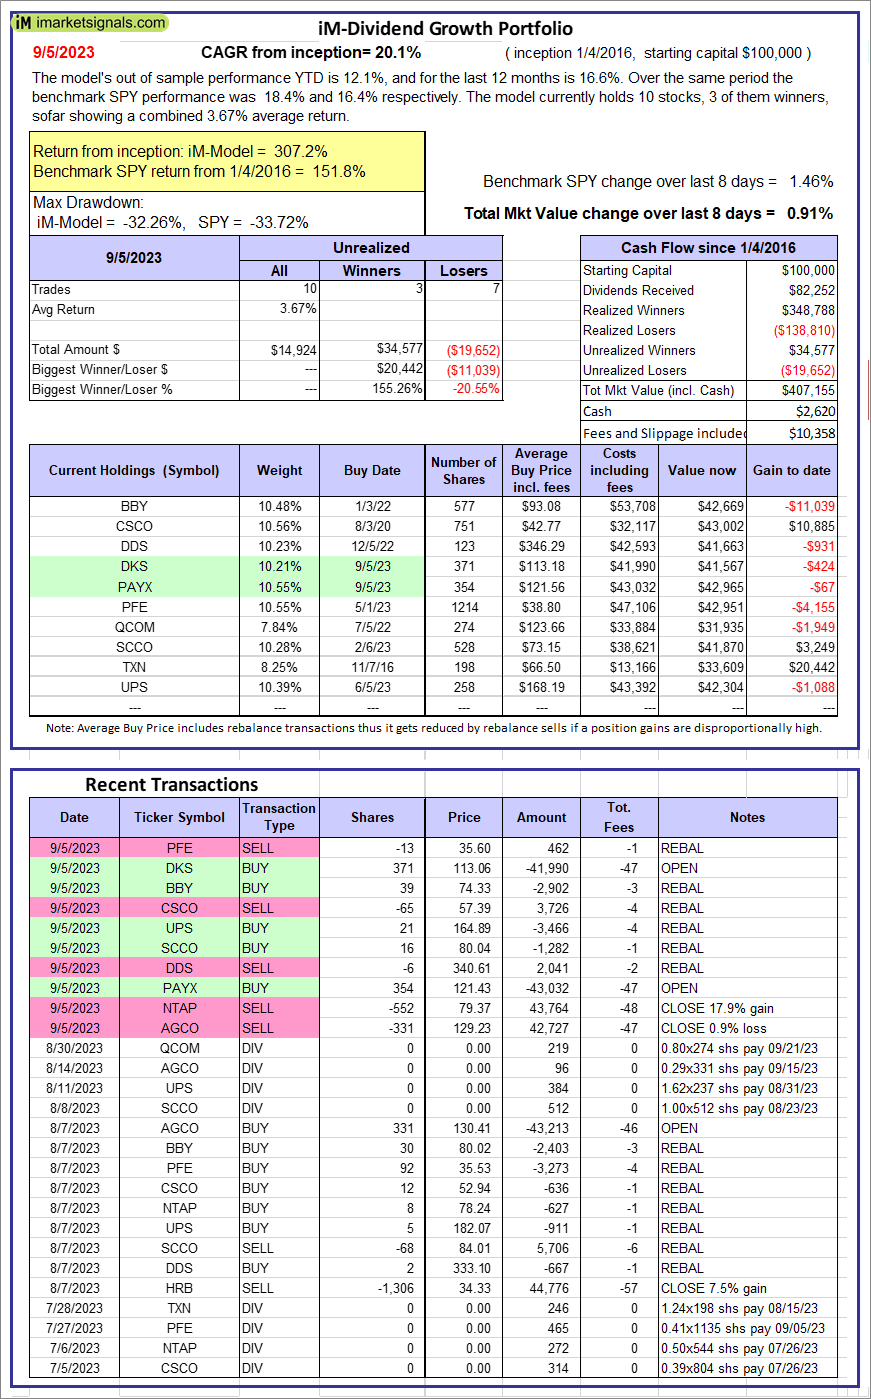 |
iM-Dividend Growth Portfolio: The model’s out of sample performance YTD is 12.1%, and for the last 12 months is 16.6%. Over the same period the benchmark SPY performance was 18.4% and 16.4% respectively. Over the previous week the market value of the iM-Dividend Growth Portfolio gained 0.91% at a time when SPY gained 1.46%. A starting capital of $100,000 at inception on 6/30/2016 would have grown to $407,155 which includes $2,620 cash and excludes $10,358 spent on fees and slippage. |
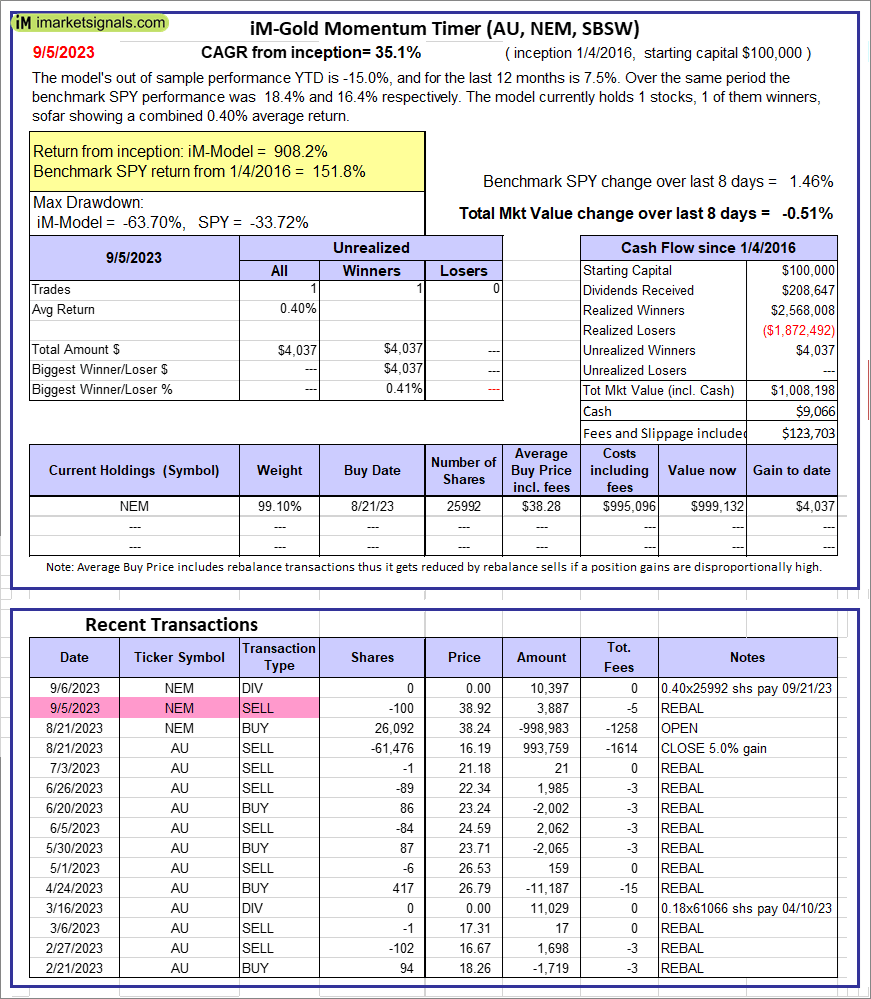 |
iM-Gold Momentum Timer (AU, NEM, SBSW): The model’s out of sample performance YTD is -15.0%, and for the last 12 months is 7.5%. Over the same period the benchmark SPY performance was 18.4% and 16.4% respectively. Over the previous week the market value of iM-Gold Momentum Timer (AU, NEM, SBSW) gained -0.51% at a time when SPY gained 1.46%. A starting capital of $100,000 at inception on 6/30/2016 would have grown to $9,066 which includes $123,703 cash and excludes Gain to date spent on fees and slippage. |
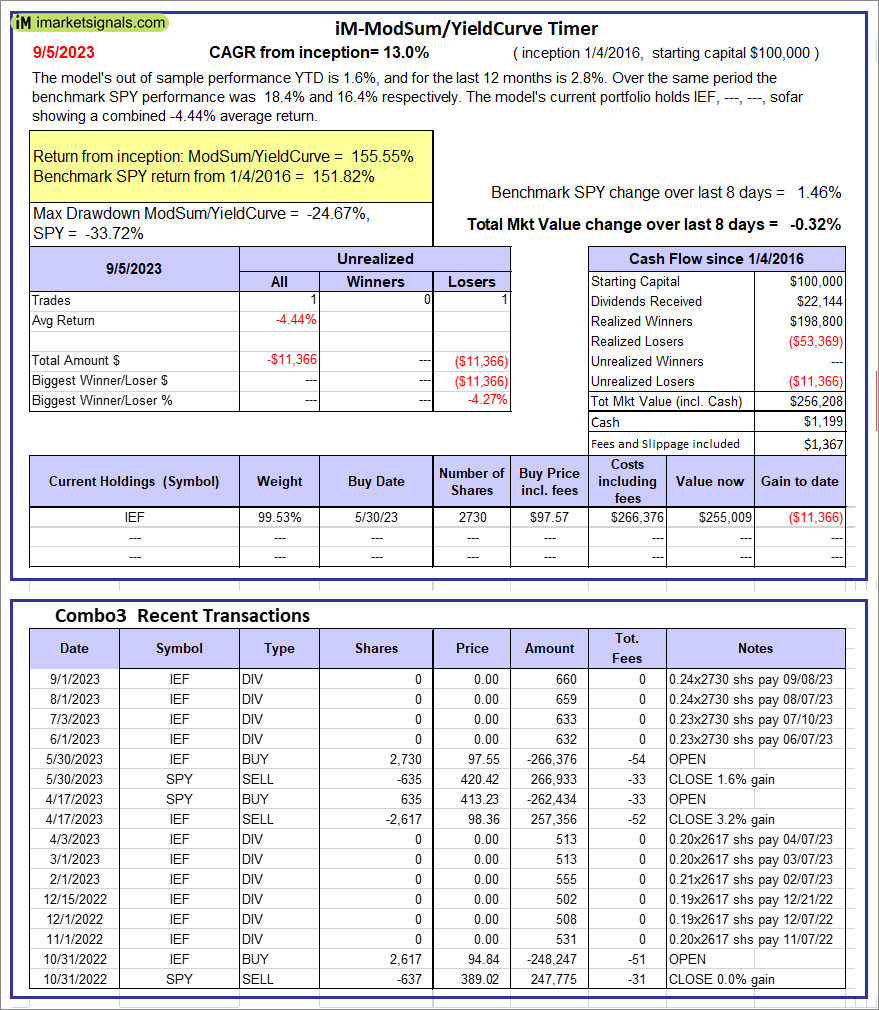 |
iM-ModSum/YieldCurve Timer: The model’s out of sample performance YTD is 1.6%, and for the last 12 months is 2.8%. Over the same period the benchmark SPY performance was 18.4% and 16.4% respectively. Over the previous week the market value of iM-PortSum/YieldCurve Timer gained -0.32% at a time when SPY gained 1.46%. A starting capital of $100,000 at inception on 1/1/2016 would have grown to $256,208 which includes $1,199 cash and excludes $1,367 spent on fees and slippage. |
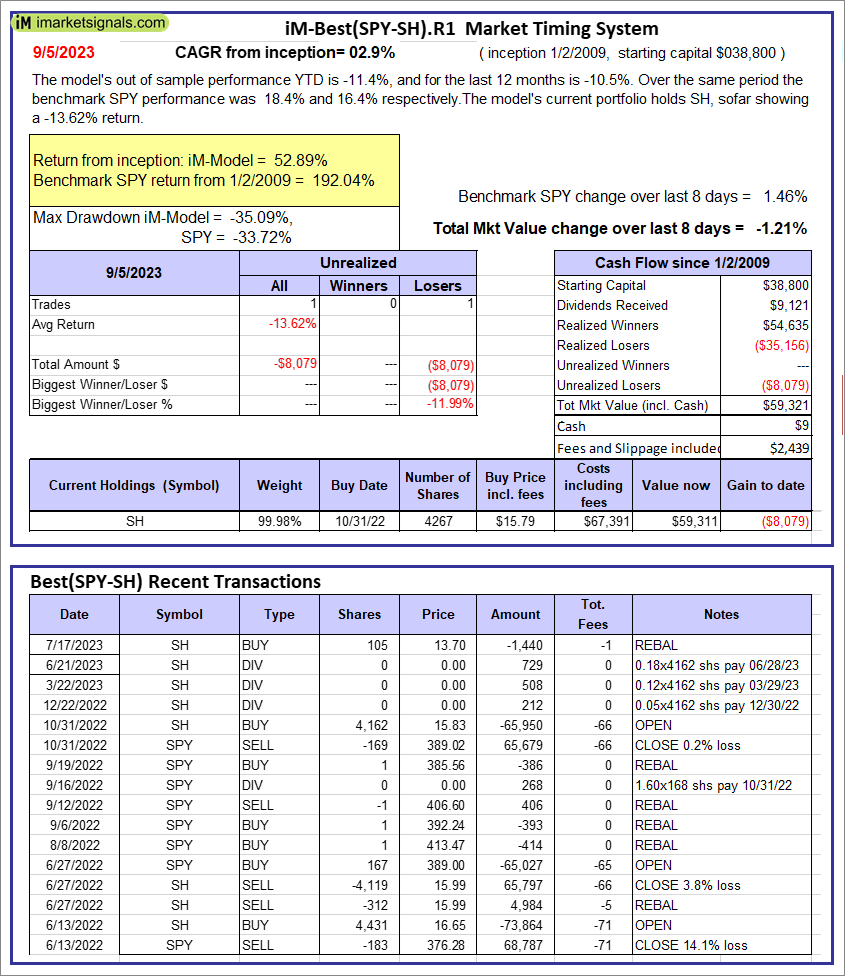 |
iM-Best(SPY-SH).R1: The model’s out of sample performance YTD is -11.4%, and for the last 12 months is -10.5%. Over the same period the benchmark SPY performance was 18.4% and 16.4% respectively. Over the previous week the market value of Best(SPY-SH) gained -1.21% at a time when SPY gained 1.46%. A starting capital of $100,000 at inception on 1/2/2009 would have grown to $59,321 which includes $9 cash and excludes $2,439 spent on fees and slippage. |
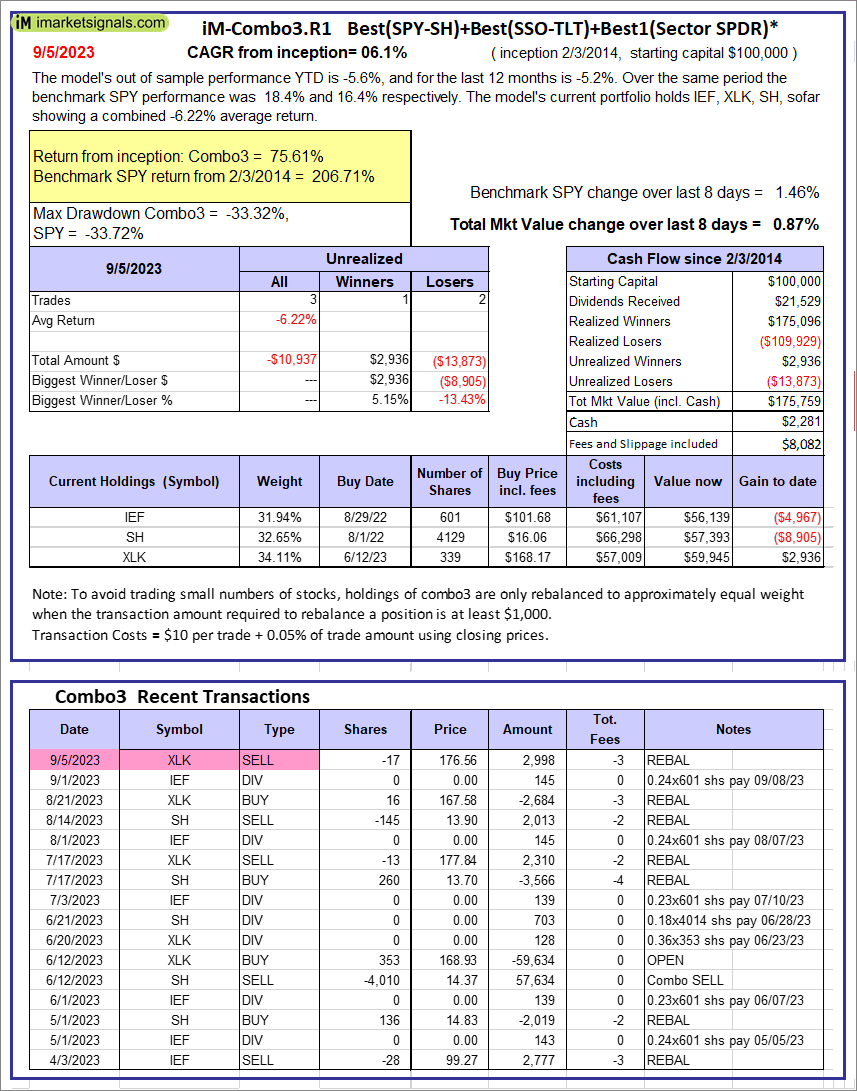 |
iM-Combo3.R1: The model’s out of sample performance YTD is -5.6%, and for the last 12 months is -5.2%. Over the same period the benchmark SPY performance was 18.4% and 16.4% respectively. Over the previous week the market value of iM-Combo3.R1 gained 0.87% at a time when SPY gained 1.46%. A starting capital of $100,000 at inception on 2/3/2014 would have grown to $175,759 which includes $2,281 cash and excludes $8,082 spent on fees and slippage. |
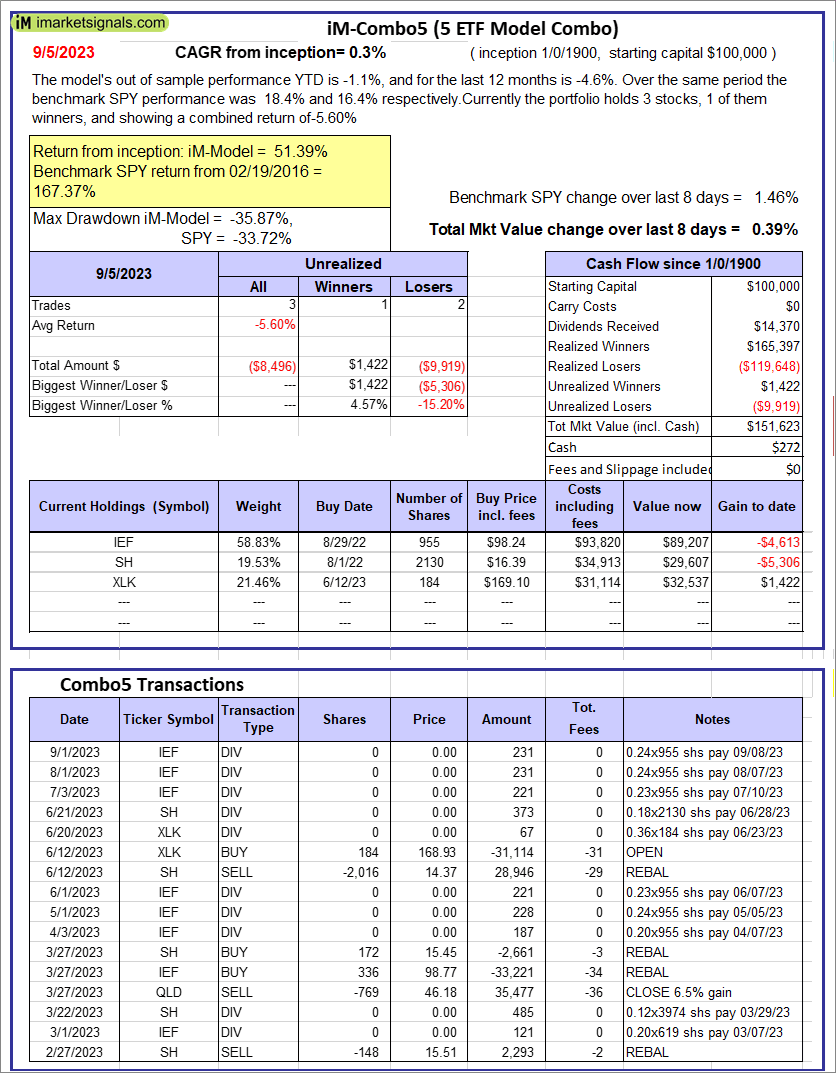 |
iM-Combo5: The model’s out of sample performance YTD is -1.1%, and for the last 12 months is -4.6%. Over the same period the benchmark SPY performance was 18.4% and 16.4% respectively. Over the previous week the market value of iM-Combo5 gained 0.39% at a time when SPY gained 1.46%. A starting capital of $100,000 at inception on 2/22/2016 would have grown to $151,623 which includes $272 cash and excludes $0 spent on fees and slippage. |
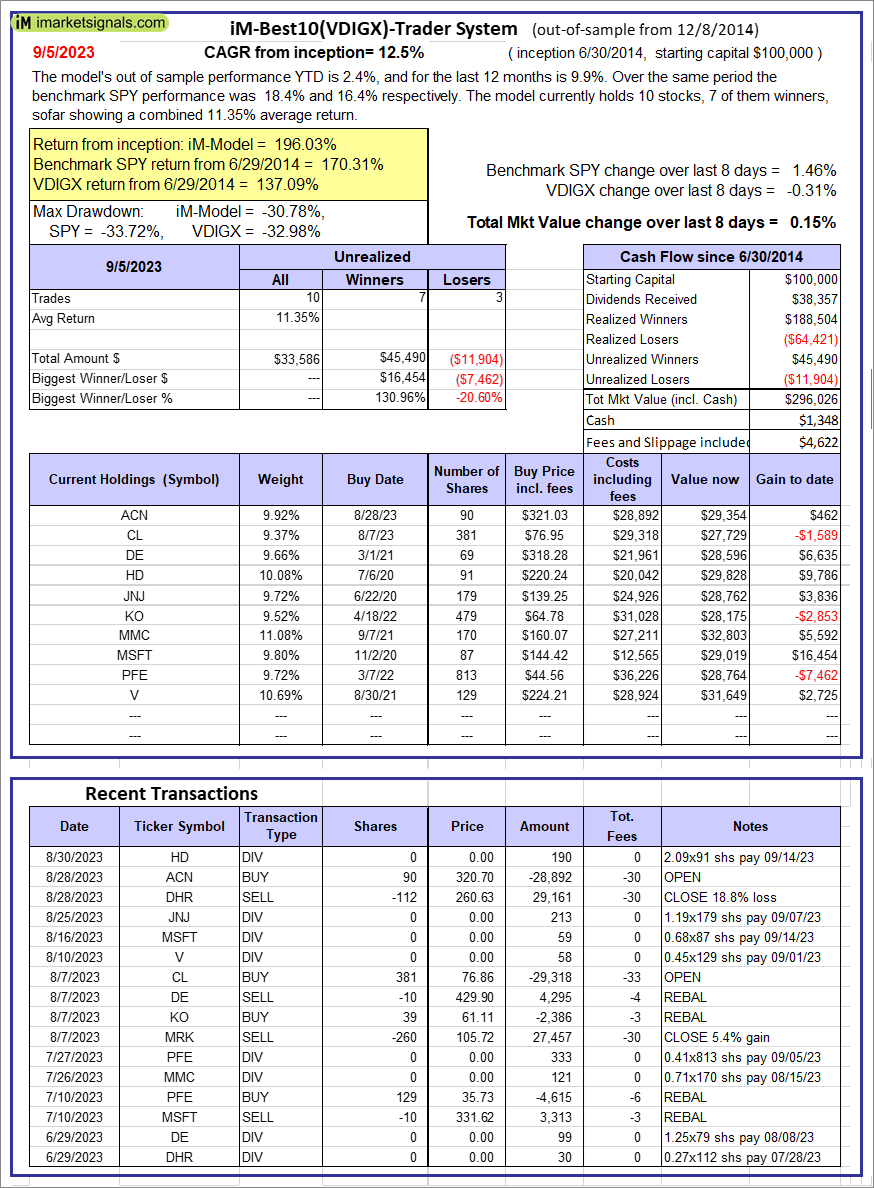 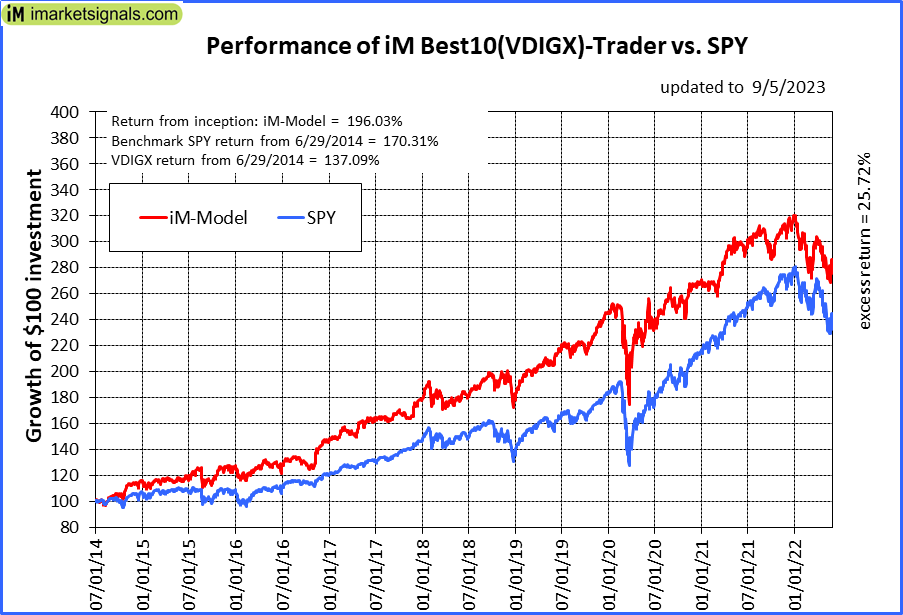 |
iM-Best10(VDIGX)-Trader: The model’s out of sample performance YTD is 2.4%, and for the last 12 months is 9.9%. Over the same period the benchmark SPY performance was 18.4% and 16.4% respectively. Since inception, on 7/1/2014, the model gained 196.03% while the benchmark SPY gained 170.31% and VDIGX gained 137.09% over the same period. Over the previous week the market value of iM-Best10(VDIGX) gained 0.15% at a time when SPY gained 1.46%. A starting capital of $100,000 at inception on 7/1/2014 would have grown to $296,026 which includes $1,348 cash and excludes $4,622 spent on fees and slippage. |
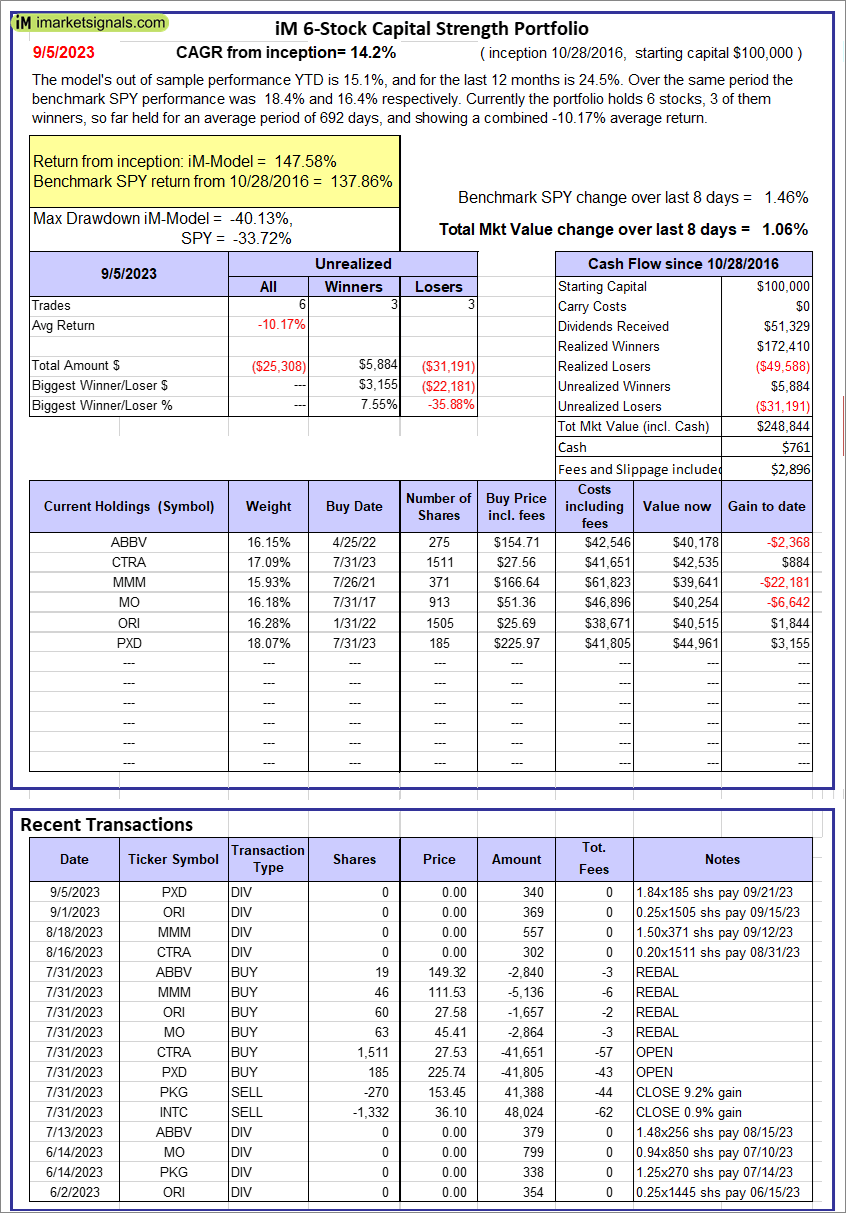 |
iM 6-Stock Capital Strength Portfolio: The model’s out of sample performance YTD is 15.1%, and for the last 12 months is 24.5%. Over the same period the benchmark SPY performance was 18.4% and 16.4% respectively. Over the previous week the market value of the iM 6-Stock Capital Strength Portfolio gained 1.06% at a time when SPY gained 1.46%. A starting capital of $100,000 at inception on 10/28/2016 would have grown to $248,844 which includes $761 cash and excludes $2,896 spent on fees and slippage. |
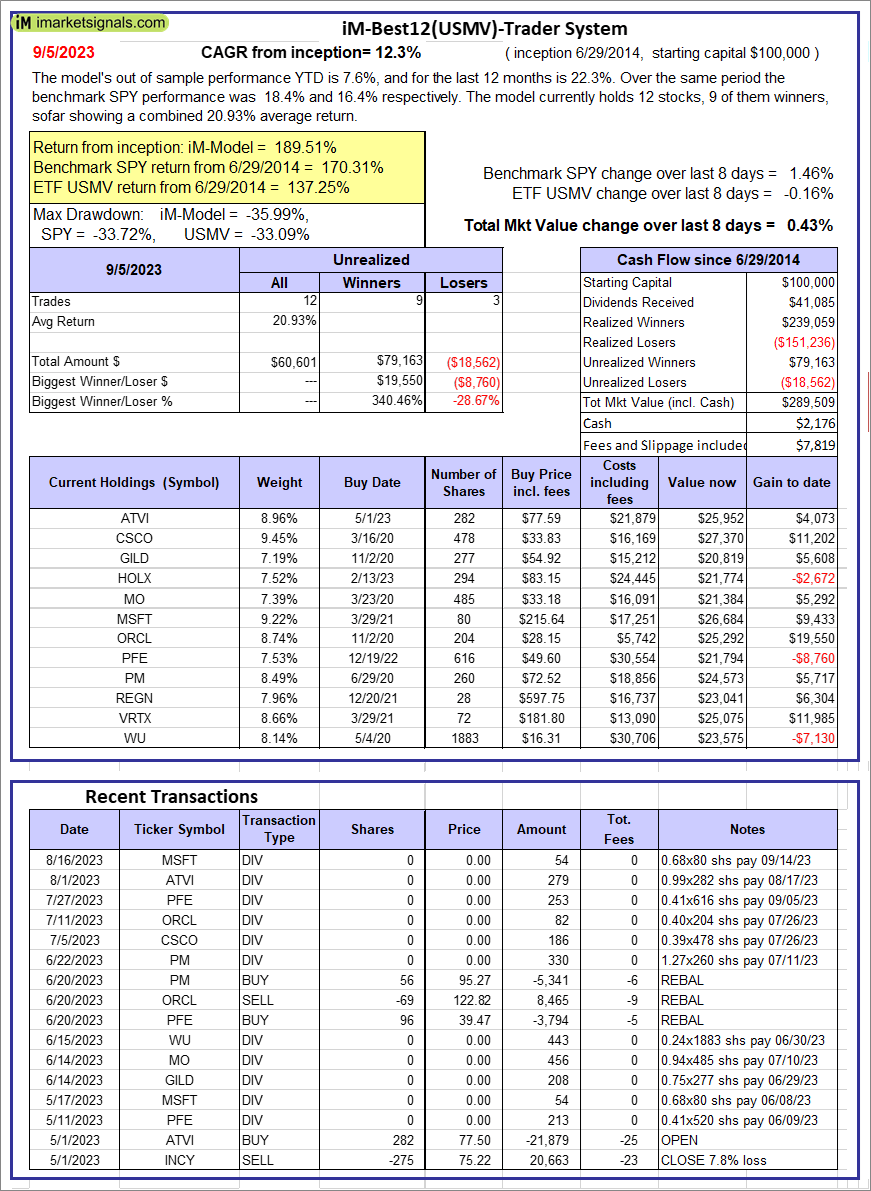 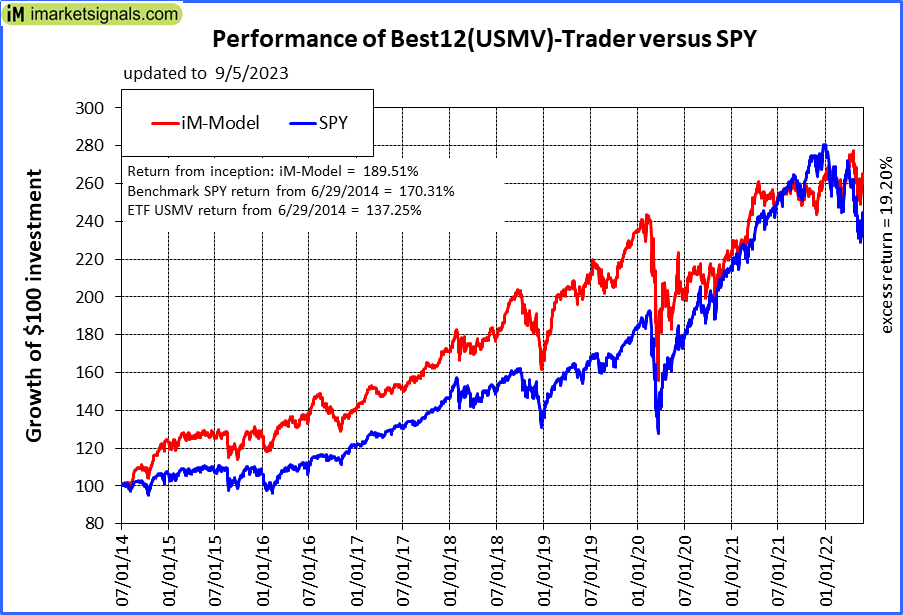 |
iM-Best12(USMV)-Trader: The model’s out of sample performance YTD is 7.6%, and for the last 12 months is 22.3%. Over the same period the benchmark SPY performance was 18.4% and 16.4% respectively. Since inception, on 6/30/2014, the model gained 189.51% while the benchmark SPY gained 170.31% and the ETF USMV gained 137.25% over the same period. Over the previous week the market value of iM-Best12(USMV)-Trader gained 0.43% at a time when SPY gained 1.46%. A starting capital of $100,000 at inception on 6/30/2014 would have grown to $289,509 which includes $2,176 cash and excludes $7,819 spent on fees and slippage. |
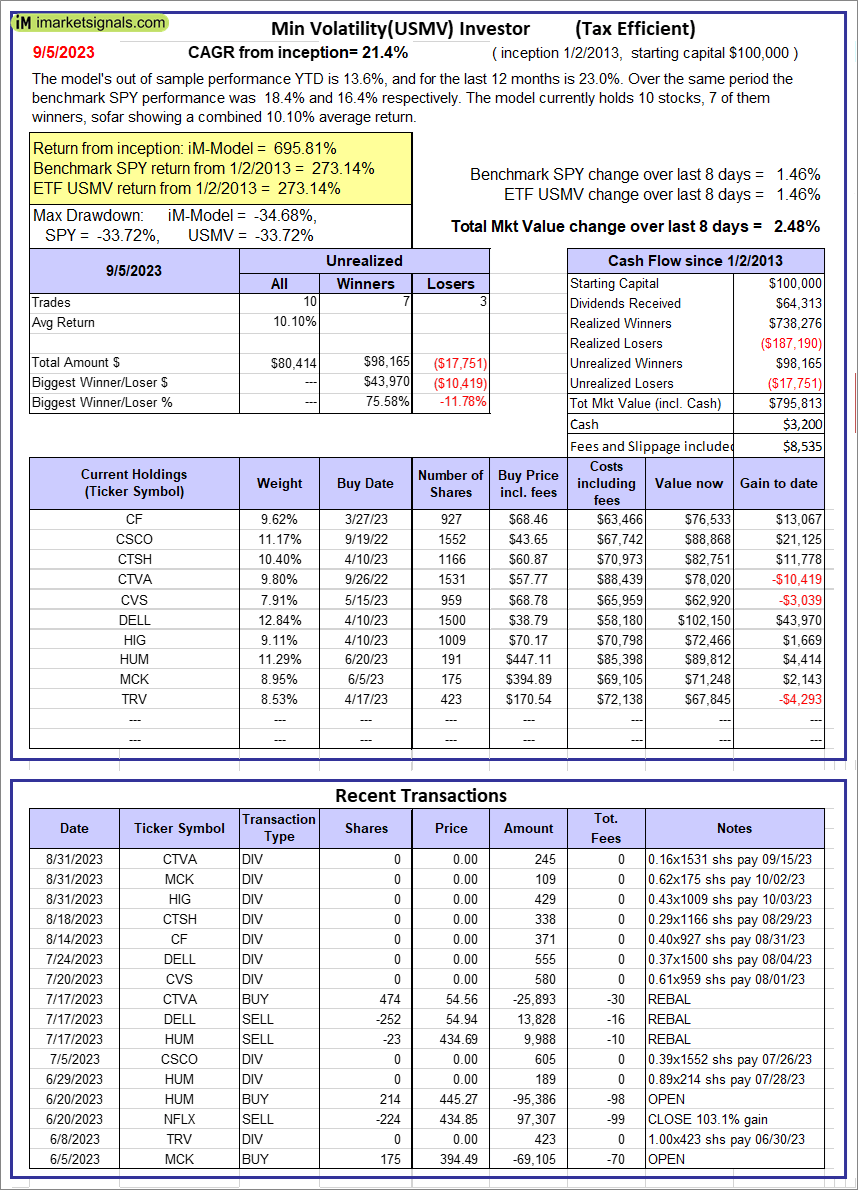 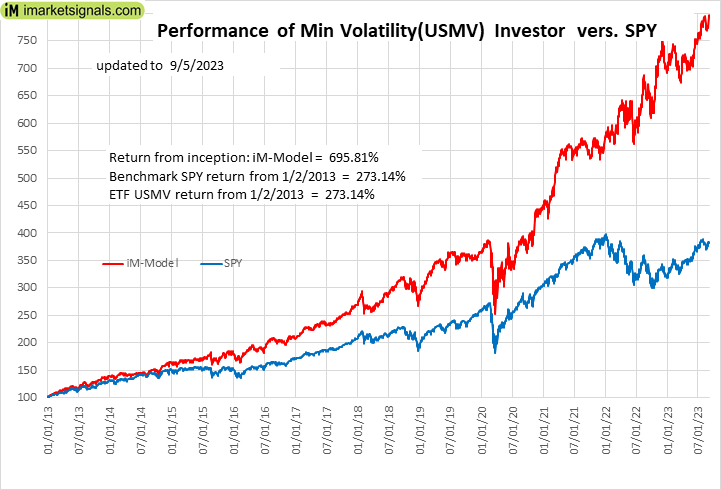 |
iM-Min Volatility(USMV) Investor (Tax Efficient): The model’s out of sample performance YTD is 13.6%, and for the last 12 months is 23.0%. Over the same period the benchmark SPY performance was 18.4% and 16.4% respectively. Since inception, on 1/3/2013, the model gained 695.81% while the benchmark SPY gained 273.14% and the ETF USMV gained 273.14% over the same period. Over the previous week the market value of iM-Best12(USMV)Q1 gained 2.48% at a time when SPY gained 1.46%. A starting capital of $100,000 at inception on 1/3/2013 would have grown to $795,813 which includes $3,200 cash and excludes $8,535 spent on fees and slippage. |
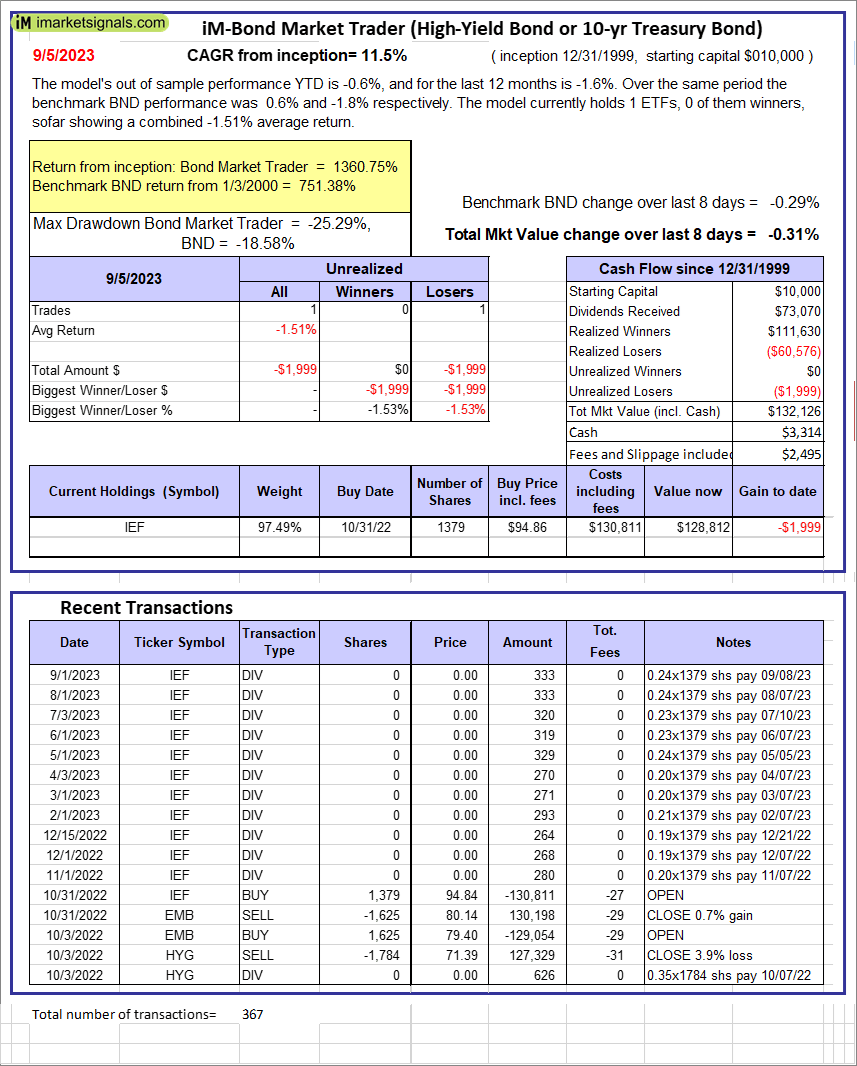 |
iM-Bond Market Trader (High-Yield Bond or 10-yr Treasury Bond): The model’s out of sample performance YTD is -0.6%, and for the last 12 months is -1.6%. Over the same period the benchmark BND performance was 0.6% and -1.8% respectively. Over the previous week the market value of the iM-Bond Market Trader (High-Yield Bond or 10-yr Treasury Bond) gained -0.31% at a time when BND gained -0.29%. A starting capital of $10,000 at inception on 1/3/2000 would have grown to $132,126 which includes $3,314 cash and excludes $2,495 spent on fees and slippage. |
|
|
iM-ModSum/YieldCurve Timer: The model’s out of sample performance YTD is 1.6%, and for the last 12 months is 2.8%. Over the same period the benchmark SPY performance was 18.4% and 16.4% respectively. Over the previous week the market value of iM-PortSum/YieldCurve Timer gained -0.32% at a time when SPY gained 1.46%. A starting capital of $100,000 at inception on 1/1/2016 would have grown to $256,208 which includes $1,199 cash and excludes $1,367 spent on fees and slippage. |
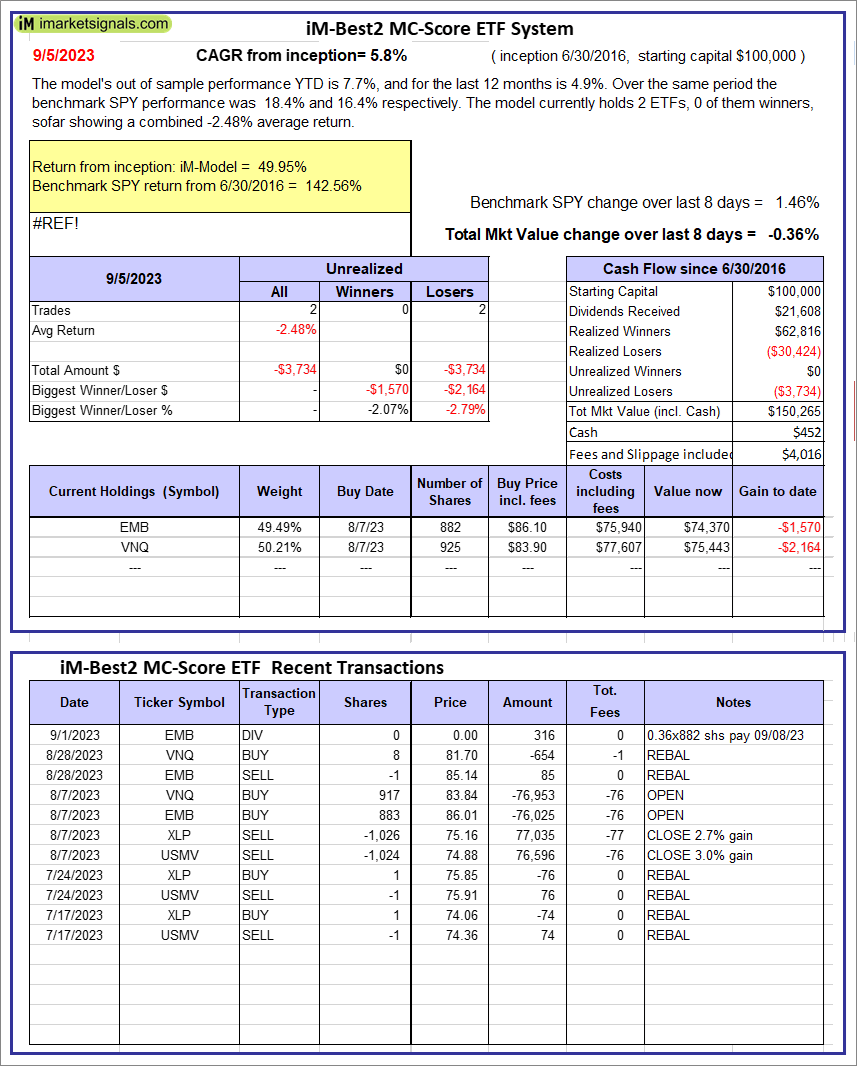 |
iM-Best2 MC-Score ETF System: The model’s out of sample performance YTD is 7.7%, and for the last 12 months is 4.9%. Over the same period the benchmark SPY performance was 18.4% and 16.4% respectively. Over the previous week the market value of the iM-Best2 MC-Score ETF System gained -0.36% at a time when SPY gained 1.46%. A starting capital of $100,000 at inception on 6/30/2016 would have grown to $150,265 which includes $452 cash and excludes $4,016 spent on fees and slippage. |
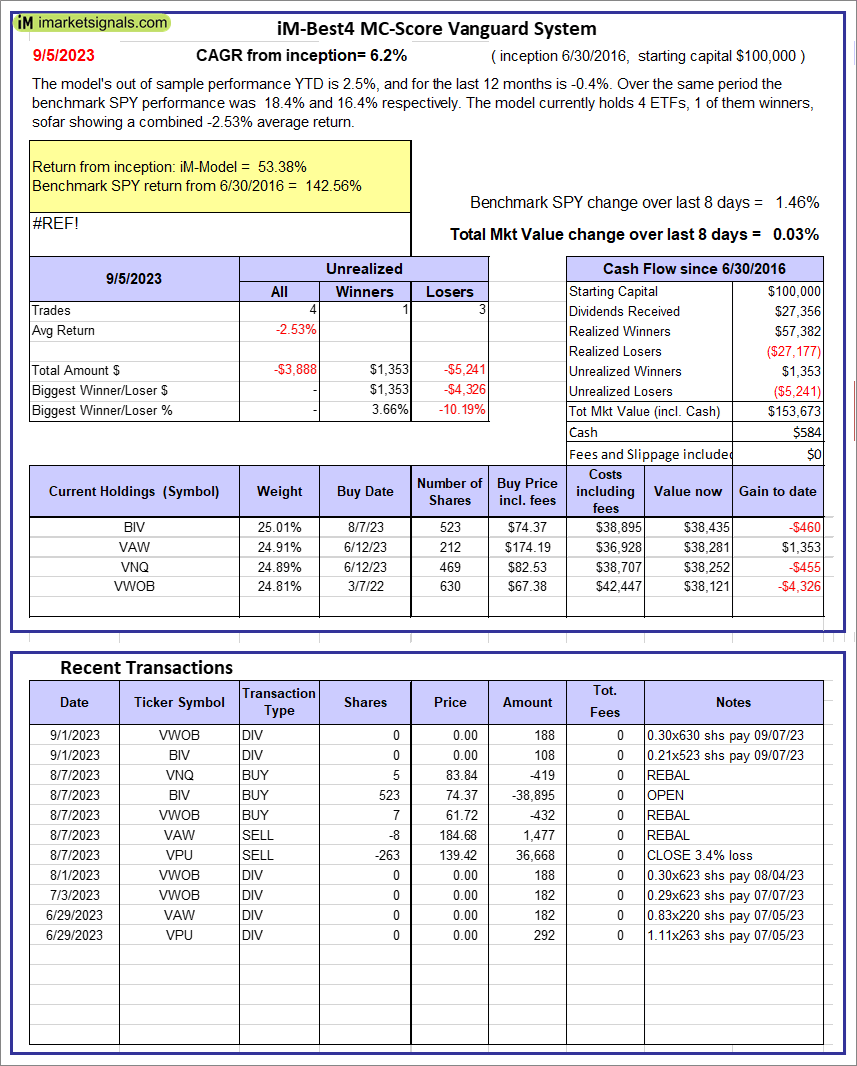 |
iM-Best4 MC-Score Vanguard System: The model’s out of sample performance YTD is 2.5%, and for the last 12 months is -0.4%. Over the same period the benchmark SPY performance was 18.4% and 16.4% respectively. Over the previous week the market value of the iM-Best4 MC-Score Vanguard System gained 0.03% at a time when SPY gained 1.46%. A starting capital of $100,000 at inception on 6/30/2016 would have grown to $153,673 which includes $584 cash and excludes $00 spent on fees and slippage. |
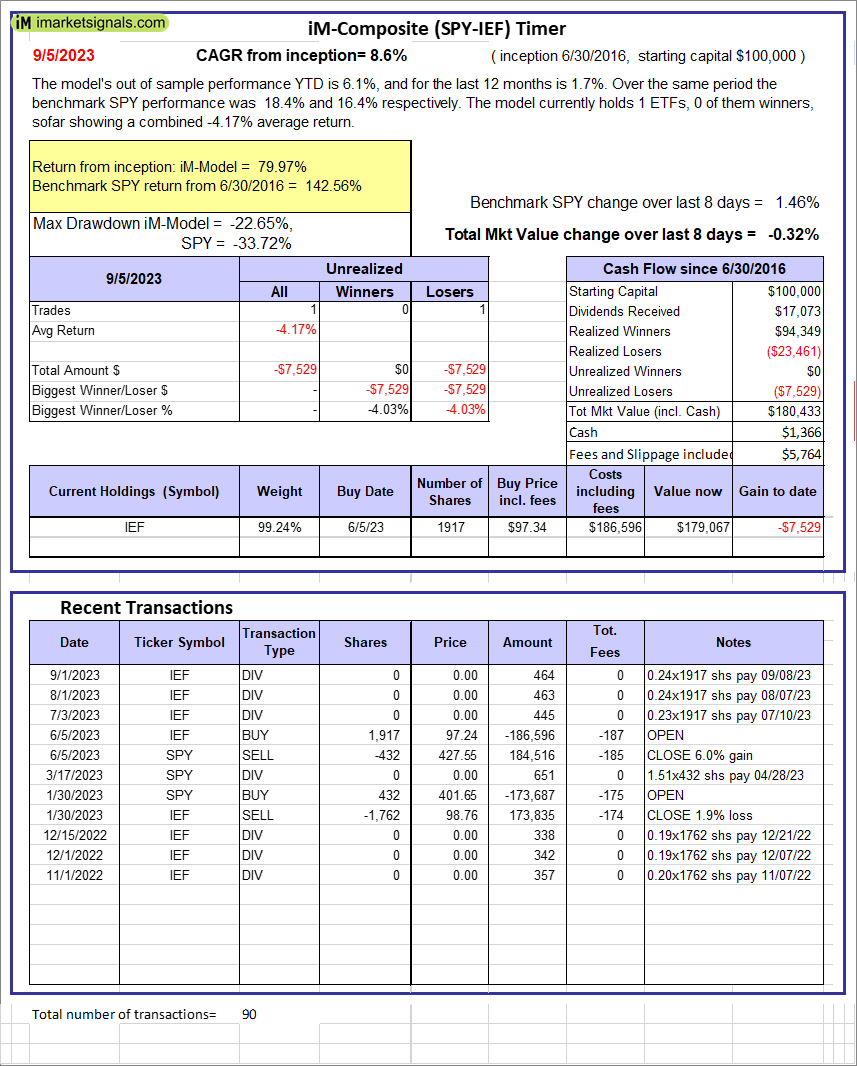 |
iM-Composite (SPY-IEF) Timer: The model’s out of sample performance YTD is 6.1%, and for the last 12 months is 1.7%. Over the same period the benchmark SPY performance was 18.4% and 16.4% respectively. Over the previous week the market value of the iM-Composite (SPY-IEF) Timer gained -0.32% at a time when SPY gained 1.46%. A starting capital of $100,000 at inception on 6/30/2016 would have grown to $180,433 which includes $1,366 cash and excludes $5,764 spent on fees and slippage. |
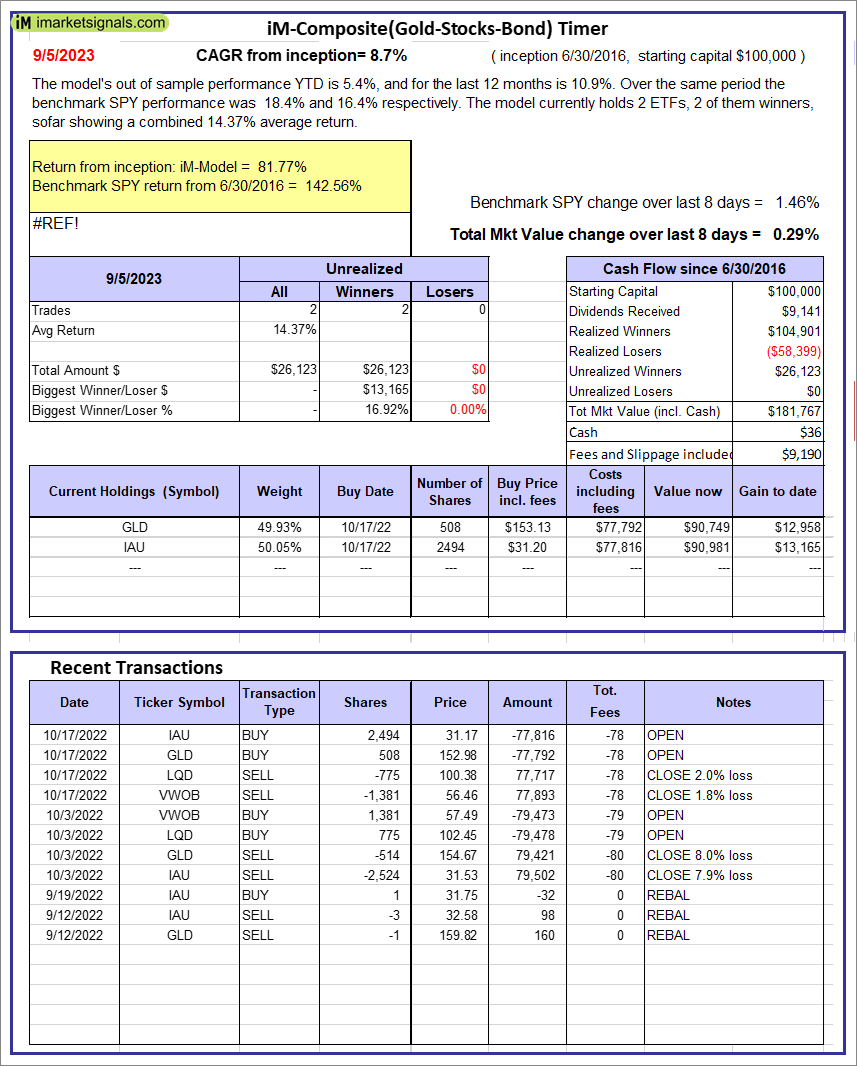 |
iM-Composite(Gold-Stocks-Bond) Timer: The model’s out of sample performance YTD is 5.4%, and for the last 12 months is 10.9%. Over the same period the benchmark SPY performance was 18.4% and 16.4% respectively. Over the previous week the market value of the iM-Composite(Gold-Stocks-Bond) Timer gained 0.29% at a time when SPY gained 1.46%. A starting capital of $100,000 at inception on 6/30/2016 would have grown to $181,767 which includes $36 cash and excludes $9,190 spent on fees and slippage. |
iM-Best Reports – 9/6/2023
Posted in pmp SPY-SH
Leave a Reply
You must be logged in to post a comment.