
  |
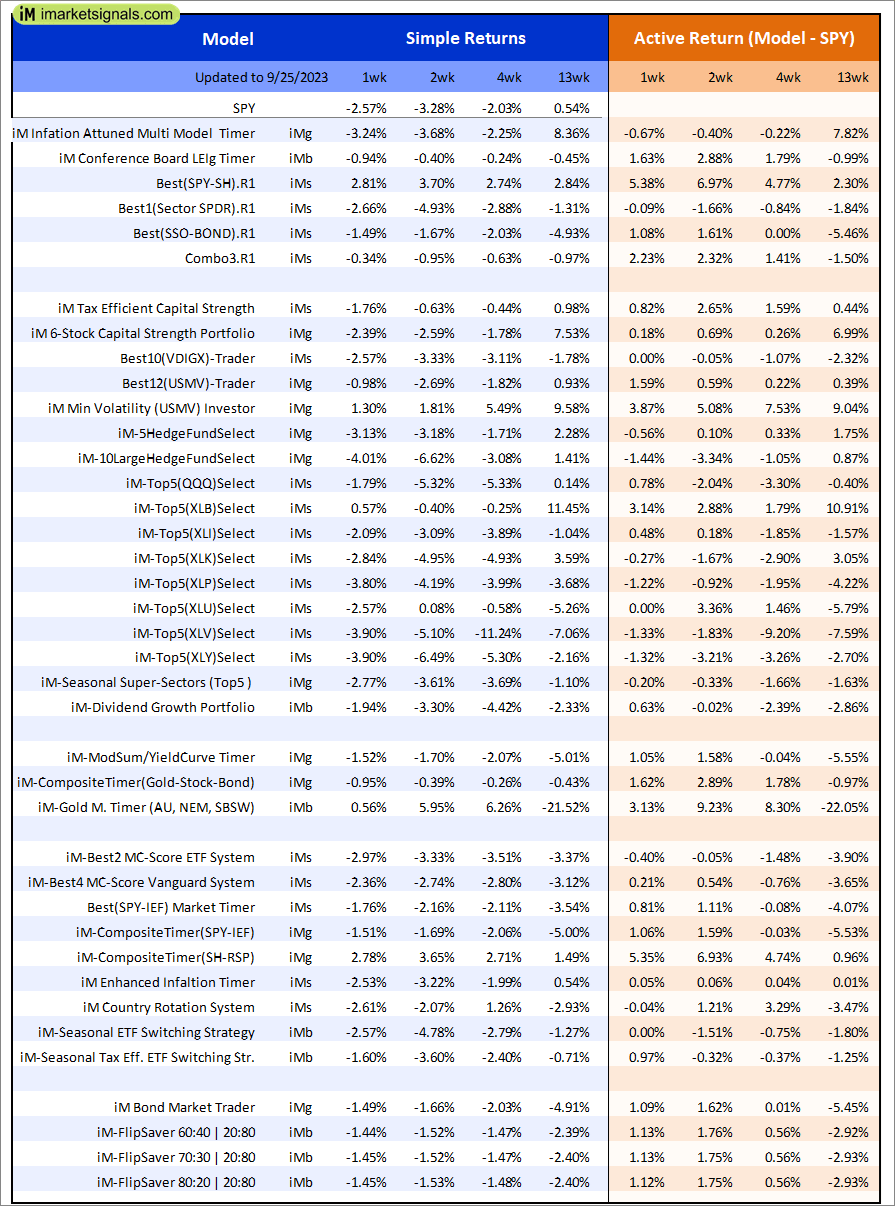
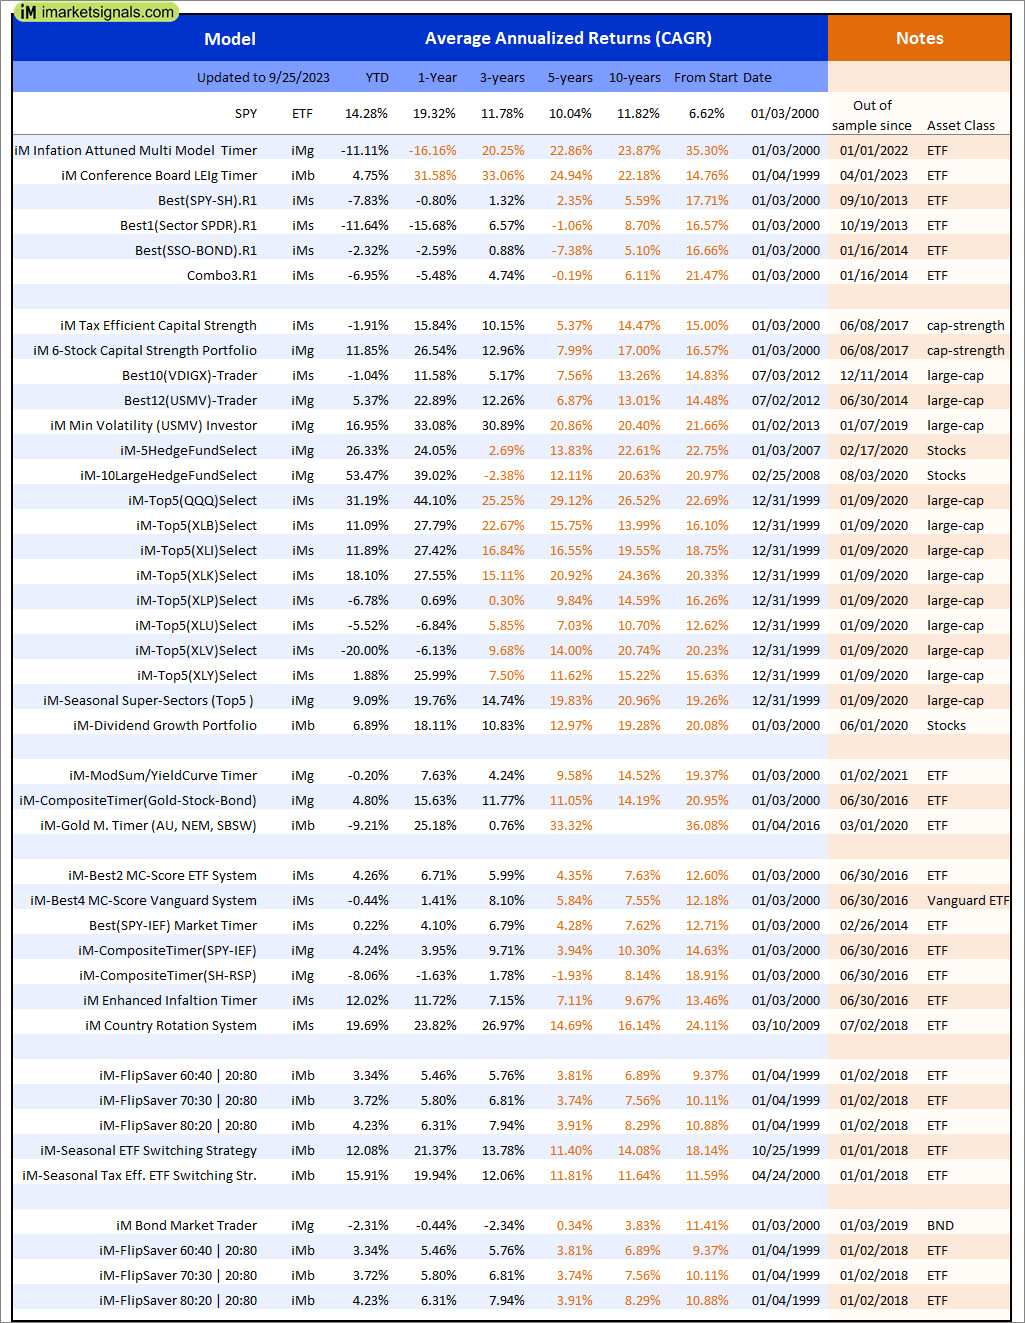
Out of sample performance summary of our models for the past 1, 2, 4 and 13 week periods. The active active return indicates how the models over- or underperformed the benchmark ETF SPY. Also the YTD, and the 1-, 3-, 5- and 10-year annualized returns are shown in the second table |
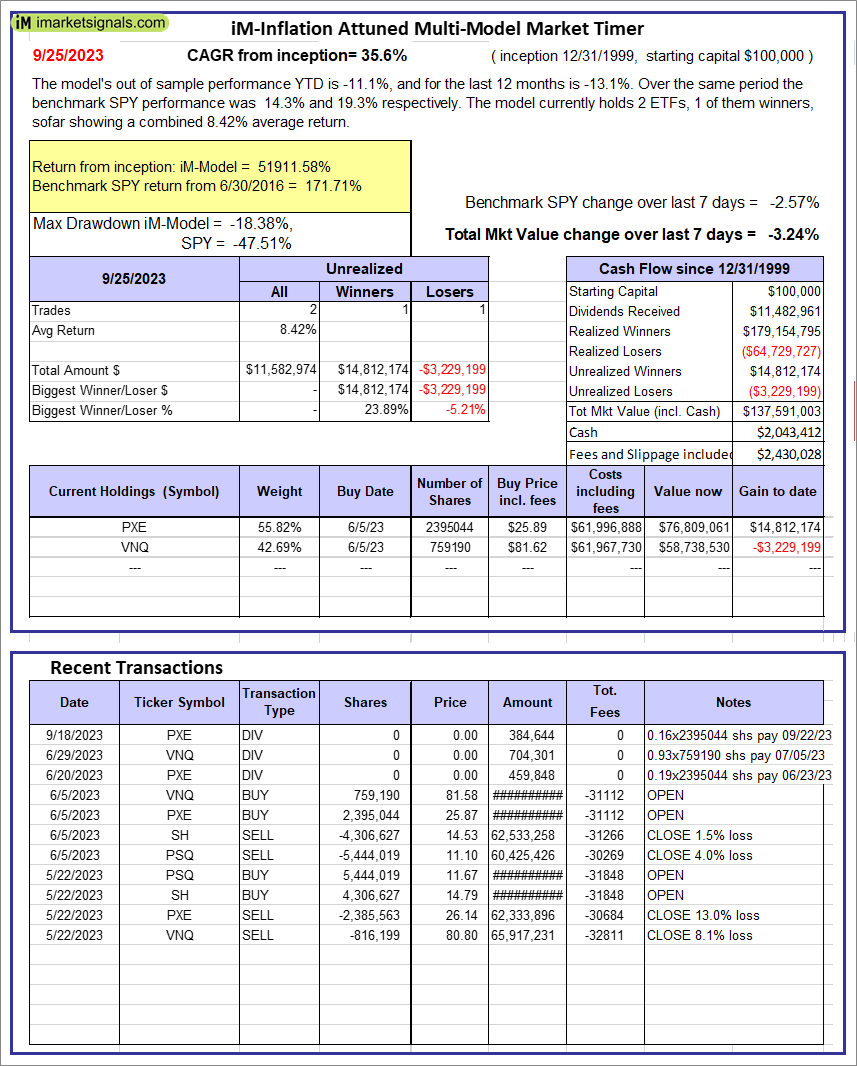 |
iM-Inflation Attuned Multi-Model Market Timer: The model’s out of sample performance YTD is -11.1%, and for the last 12 months is -13.1%. Over the same period the benchmark SPY performance was 14.3% and 19.3% respectively. Over the previous week the market value of the iM-Inflation Attuned Multi-Model Market Timer gained -3.24% at a time when SPY gained -2.57%. A starting capital of $100,000 at inception on 3/24/2017 would have grown to $137,591,003 which includes $2,043,412 cash and excludes $2,430,028 spent on fees and slippage. |
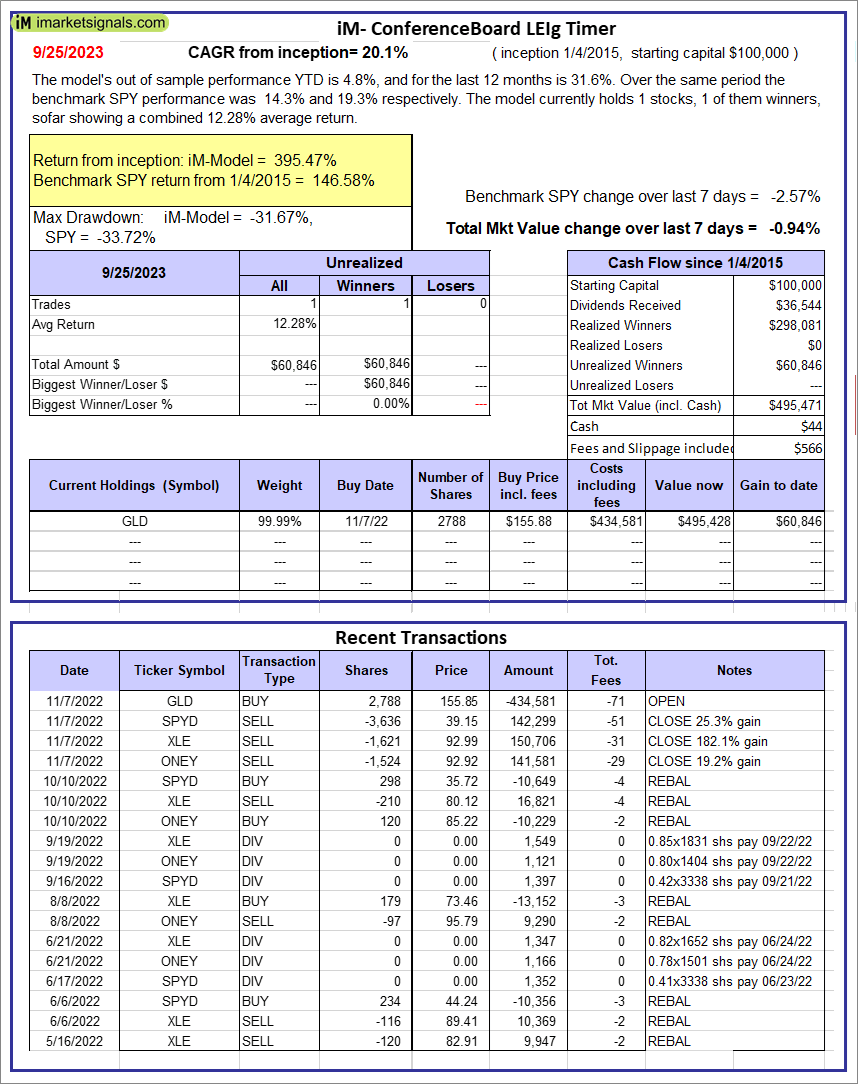 |
iM-Conference Board LEIg Timer: The model’s performance YTD is 14.3%, and for the last 12 months is 7.3%. Over the same period the benchmark SPY performance was 20.1% and 9.4% respectively. Over the previous week the market value of the iM-Conference Board LEIg Timer gained -0.94% at a time when SPY gained -2.57%. A starting capital of $100,000 at inception on 4/5/2017 would have grown to $495,471 which includes $44 cash and excludes $566 spent on fees and slippage. |
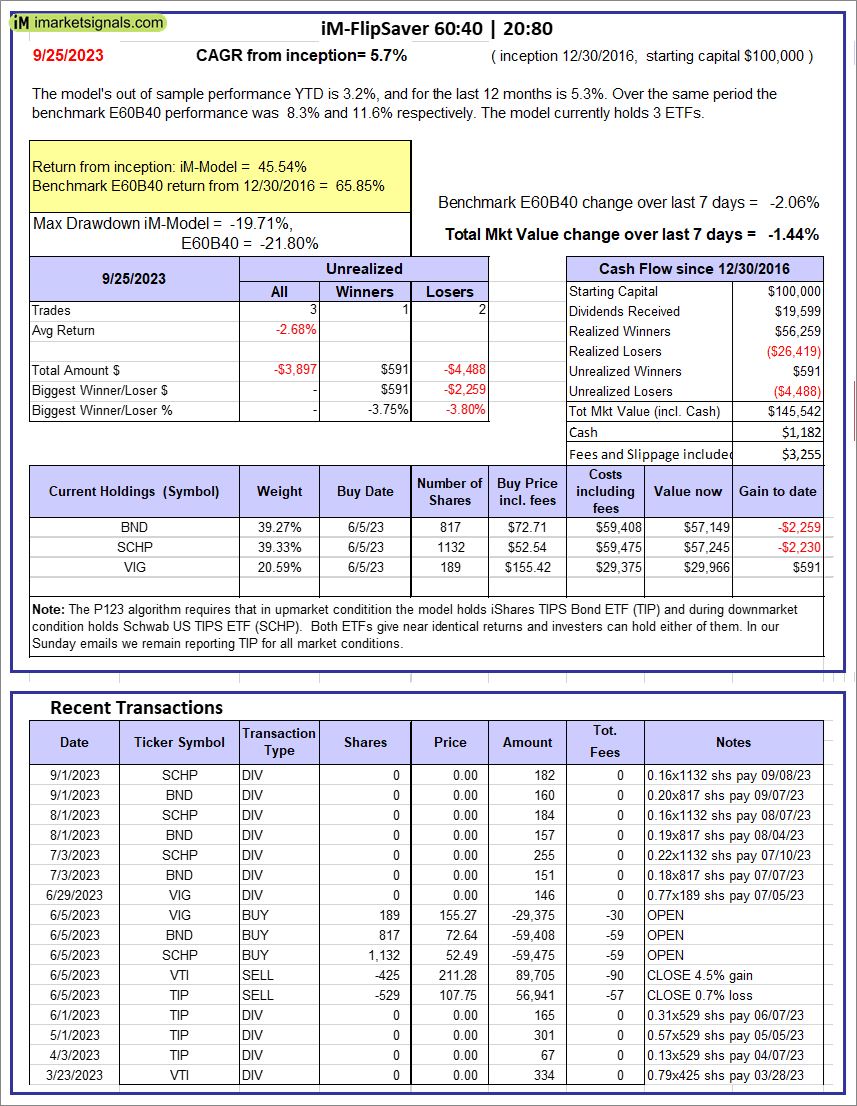 |
iM-FlipSaver 60:40 | 20:80 – 2017: The model’s out of sample performance YTD is 3.2%, and for the last 12 months is 5.3%. Over the same period the benchmark E60B40 performance was 8.3% and 11.6% respectively. Over the previous week the market value of iM-FlipSaver 80:20 | 20:80 gained -1.44% at a time when SPY gained -2.06%. A starting capital of $100,000 at inception on 7/16/2015 would have grown to $145,542 which includes $1,182 cash and excludes $3,255 spent on fees and slippage. |
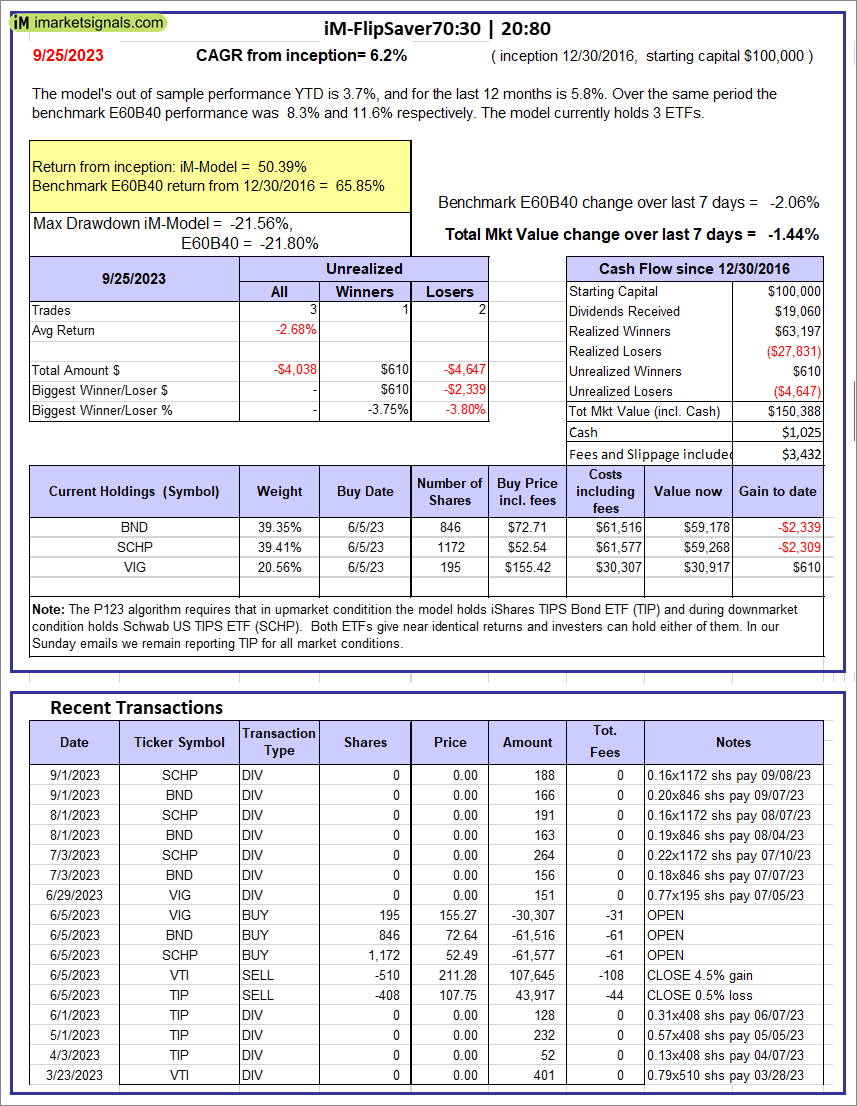 |
iM-FlipSaver 70:30 | 20:80 – 2017: The model’s out of sample performance YTD is 3.7%, and for the last 12 months is 5.8%. Over the same period the benchmark E60B40 performance was 8.3% and 11.6% respectively. Over the previous week the market value of iM-FlipSaver 70:30 | 20:80 gained -1.44% at a time when SPY gained -2.06%. A starting capital of $100,000 at inception on 7/15/2015 would have grown to $150,388 which includes $1,025 cash and excludes $3,432 spent on fees and slippage. |
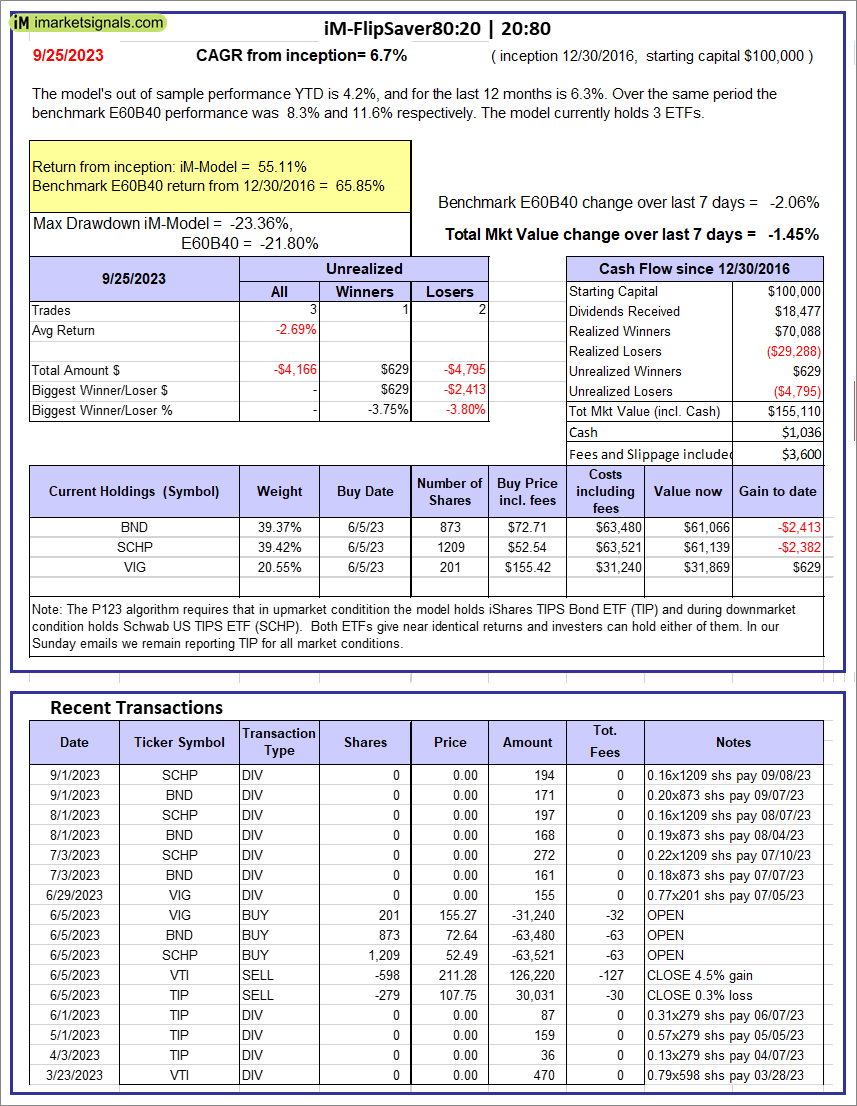 |
iM-FlipSaver 80:20 | 20:80 – 2017: The model’s out of sample performance YTD is 4.2%, and for the last 12 months is 6.3%. Over the same period the benchmark E60B40 performance was 8.3% and 11.6% respectively. Over the previous week the market value of iM-FlipSaver 80:20 | 20:80 gained -1.45% at a time when SPY gained -2.06%. A starting capital of $100,000 at inception on 1/2/2017 would have grown to $155,110 which includes $1,036 cash and excludes $3,600 spent on fees and slippage. |
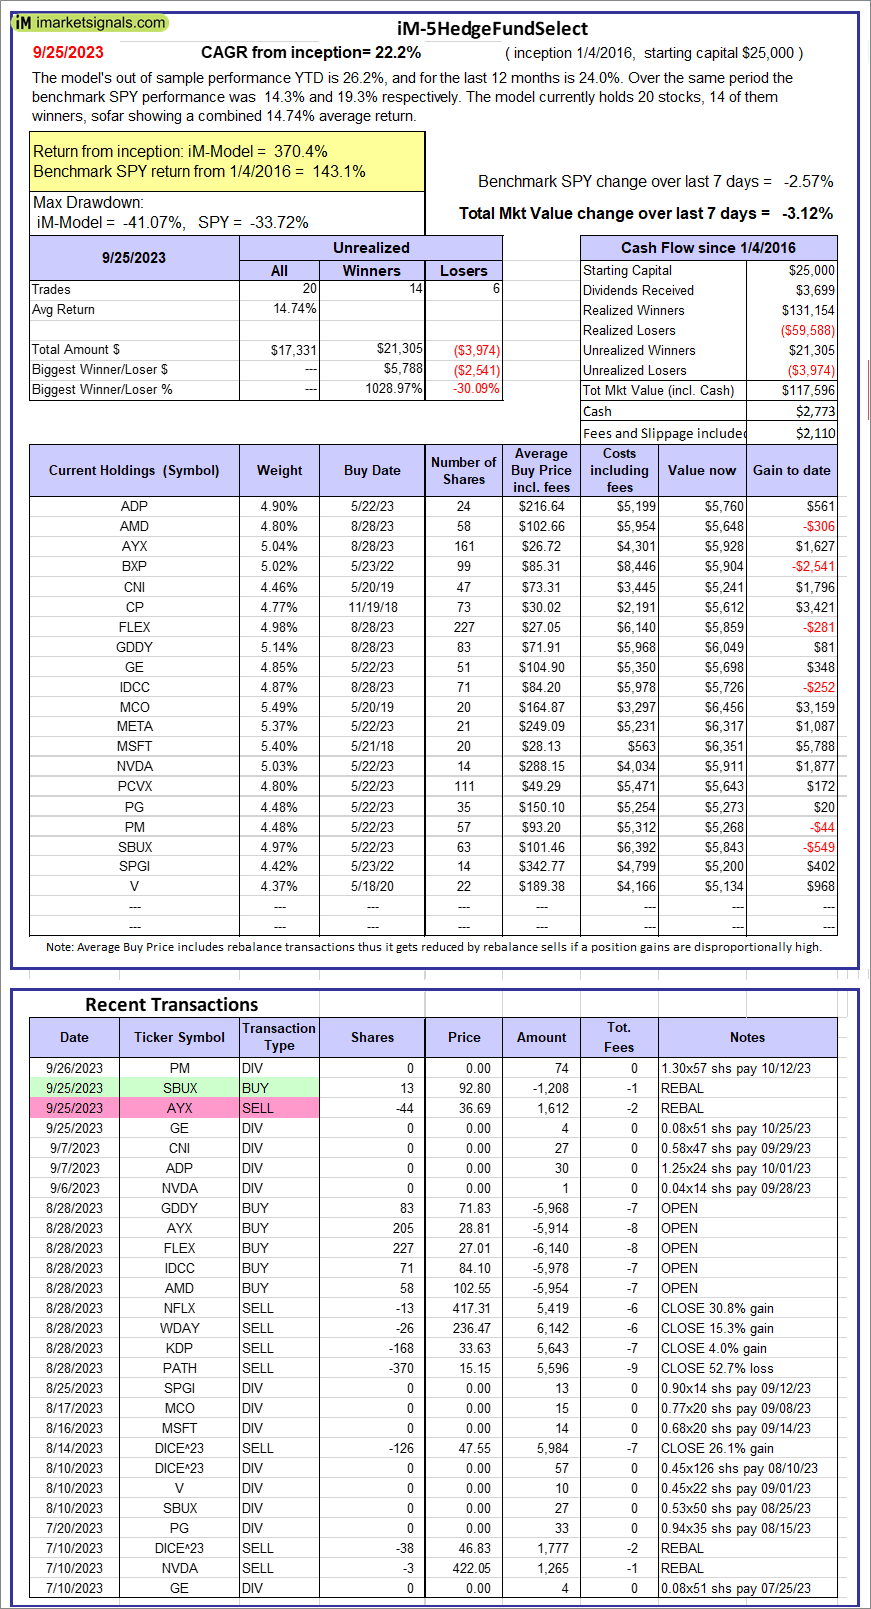 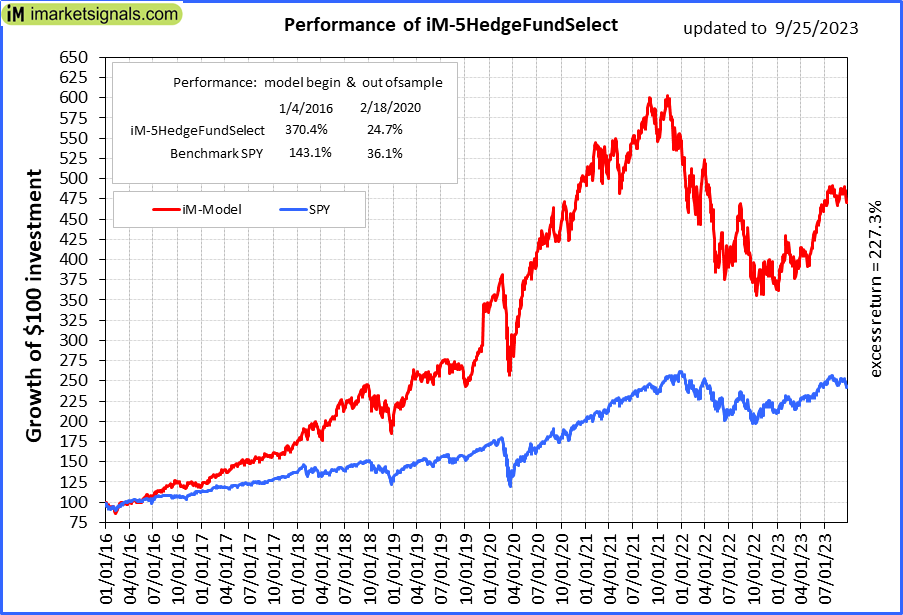 |
iM-5HedgeFundSelect: Since inception, on 1/5/2016, the model gained 370.38% while the benchmark SPY gained 143.13% over the same period. Over the previous week the market value of iM-5HedgeFundSelect gained -3.12% at a time when SPY gained -2.57%. A starting capital of $25,000 at inception on 1/5/2016 would have grown to $117,596 which includes $2,773 cash and excludes $2,110 spent on fees and slippage. |
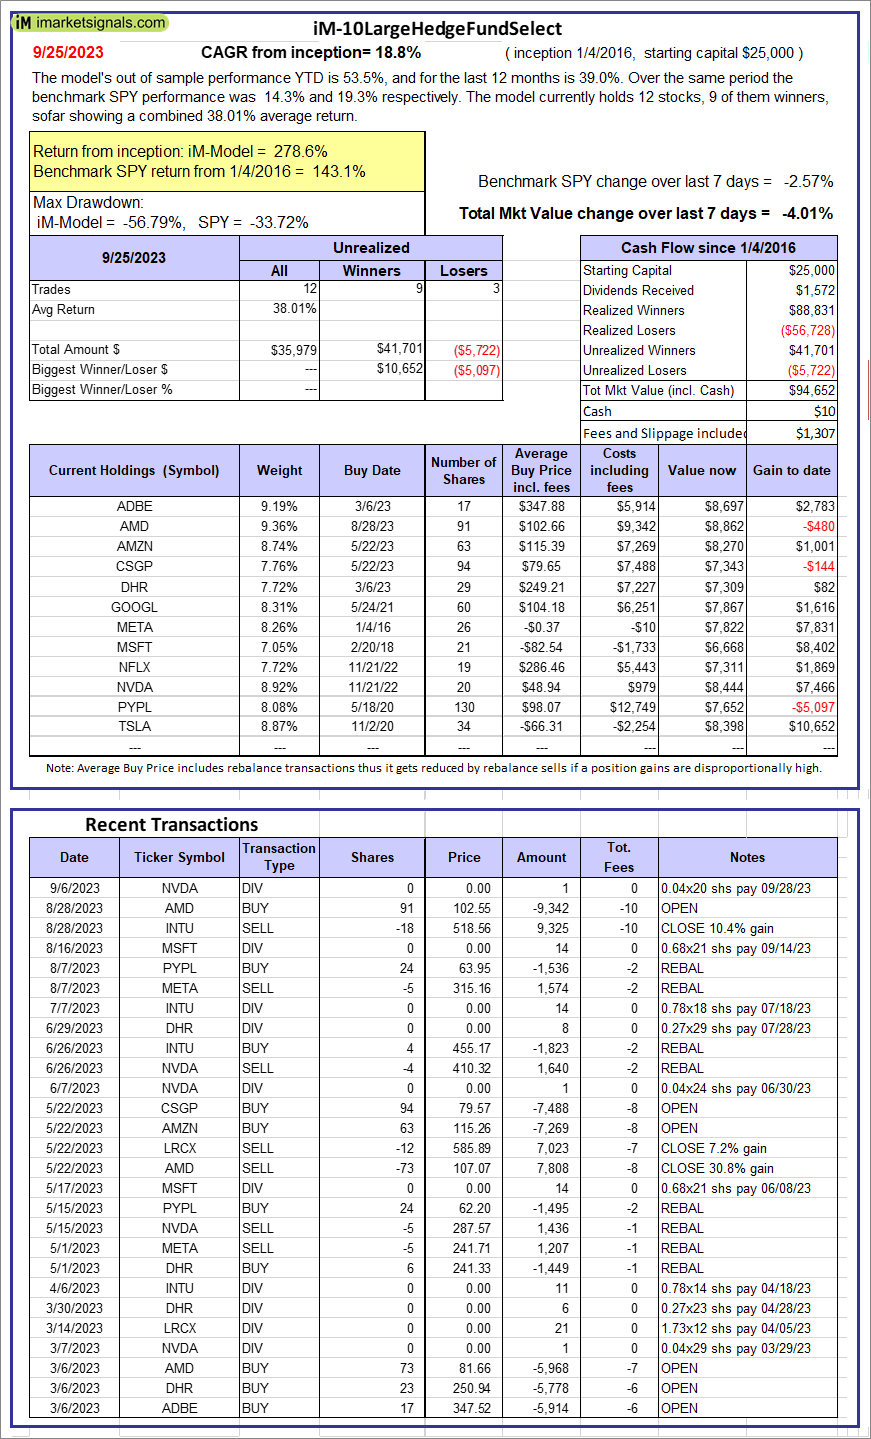 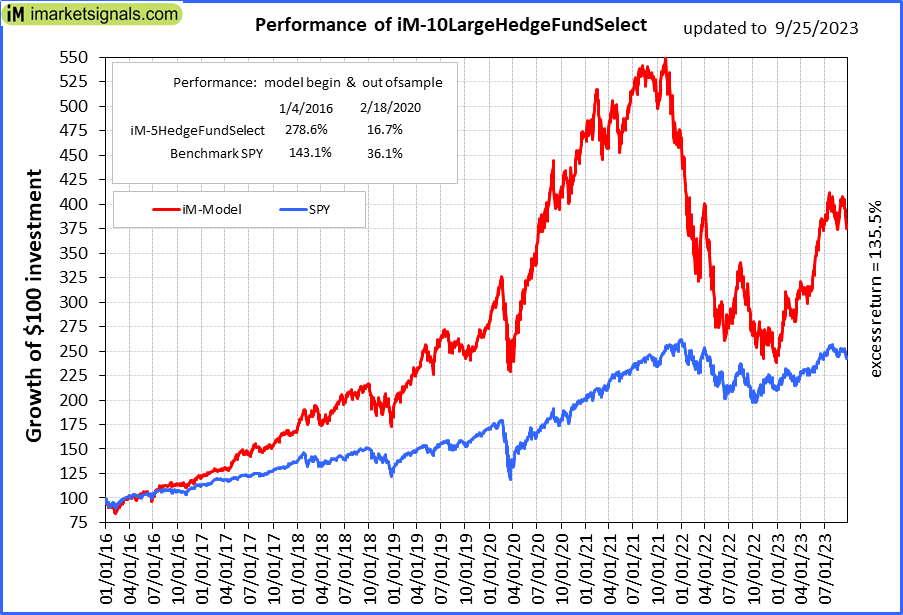 |
iM-10LargeHedgeFundSelect: Since inception, on 1/5/2016, the model gained 278.61% while the benchmark SPY gained 143.13% over the same period. Over the previous week the market value of iM-10LargeHedgeFundSelect gained -4.01% at a time when SPY gained -2.57%. A starting capital of $25,000 at inception on 1/5/2016 would have grown to $94,652 which includes $10 cash and excludes $1,307 spent on fees and slippage. |
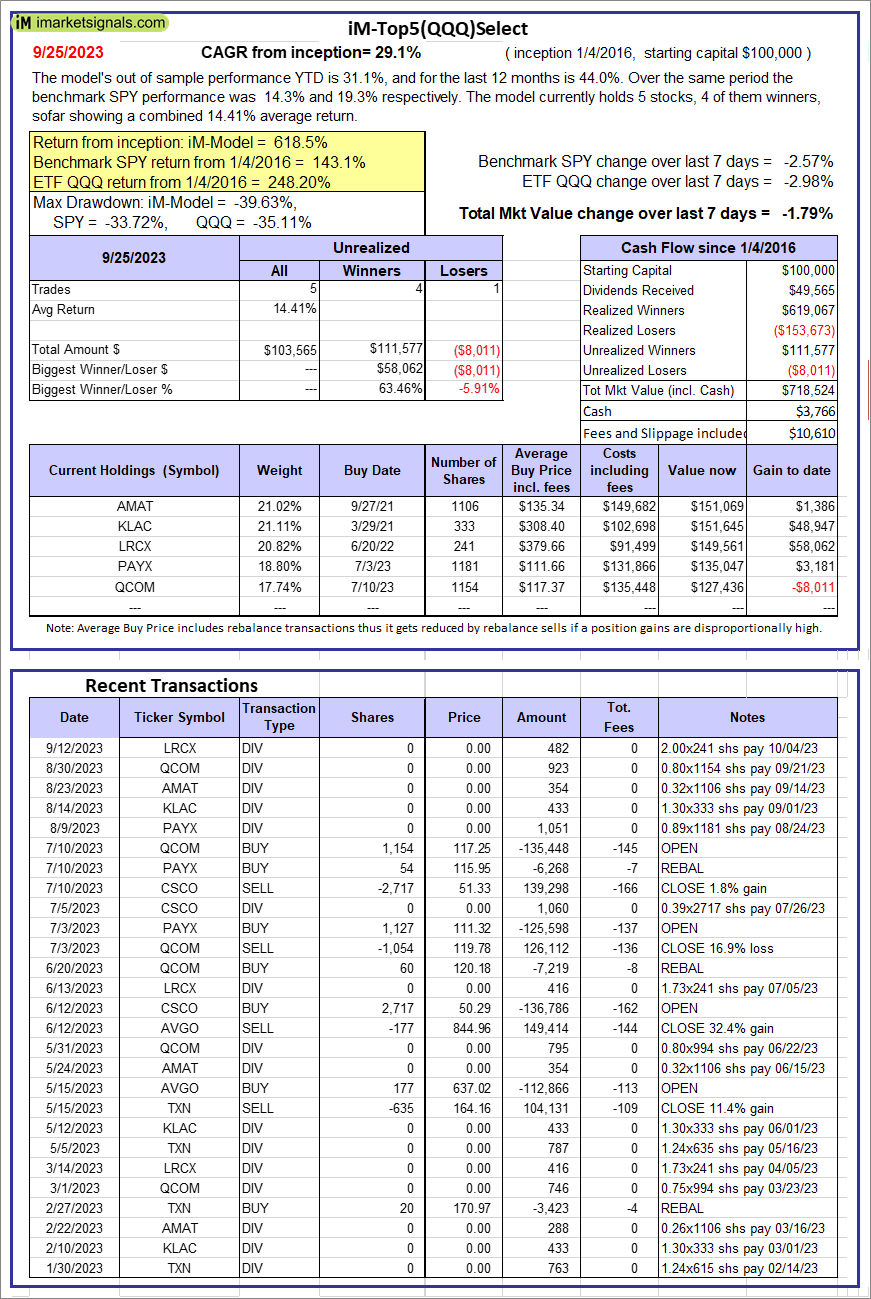 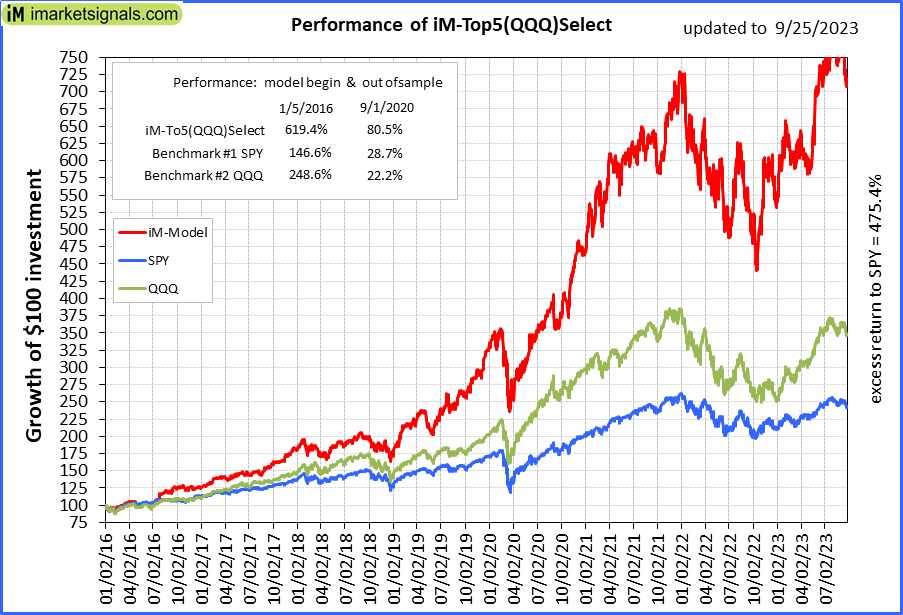 |
iM-Top5(QQQ)Select: Since inception, on 1/5/2016, the model gained 618.52% while the benchmark SPY gained 143.13% over the same period. Over the previous week the market value of iM-Top5(QQQ)Select gained -1.79% at a time when SPY gained -2.57%. A starting capital of $100,000 at inception on 1/5/2016 would have grown to $718,524 which includes $3,766 cash and excludes $10,610 spent on fees and slippage. |
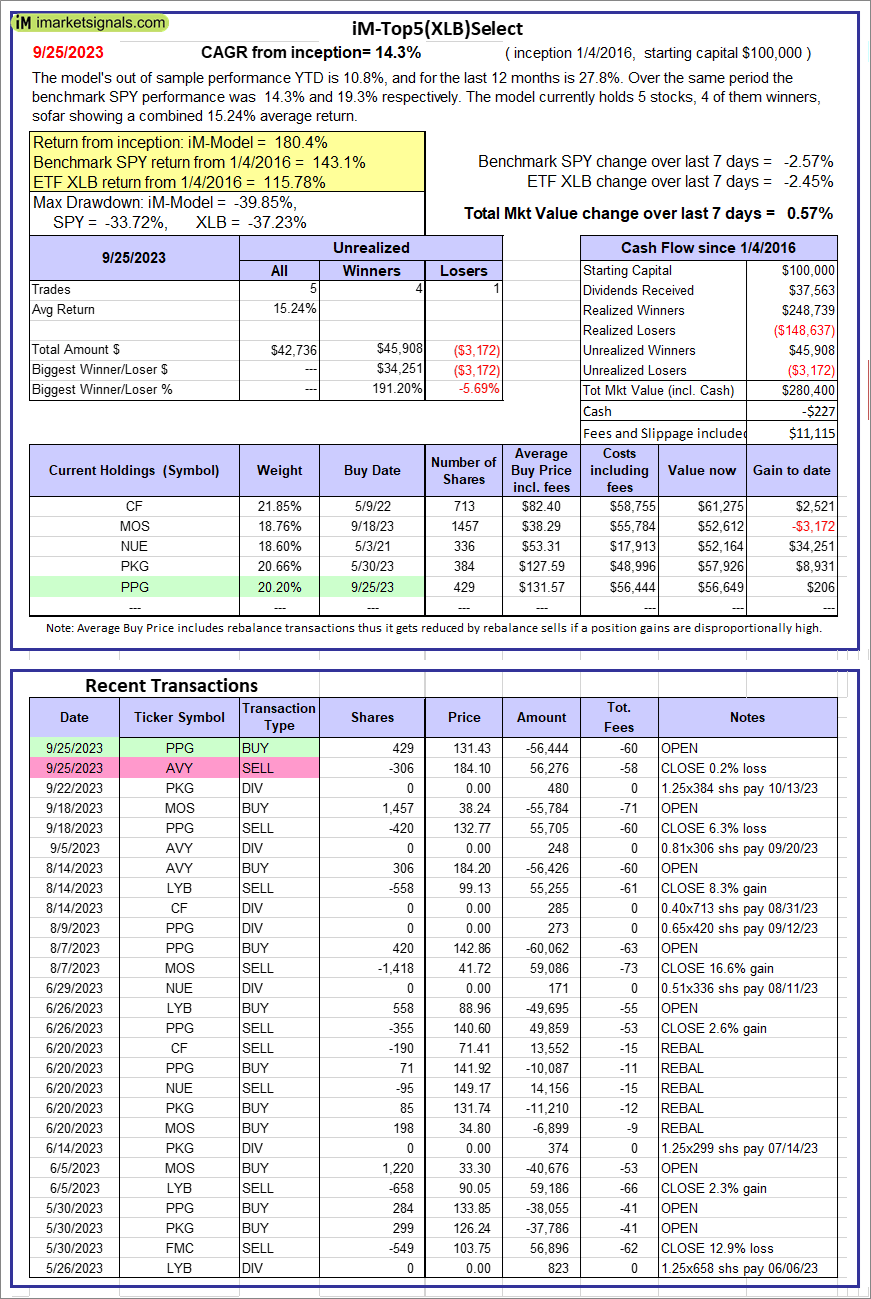 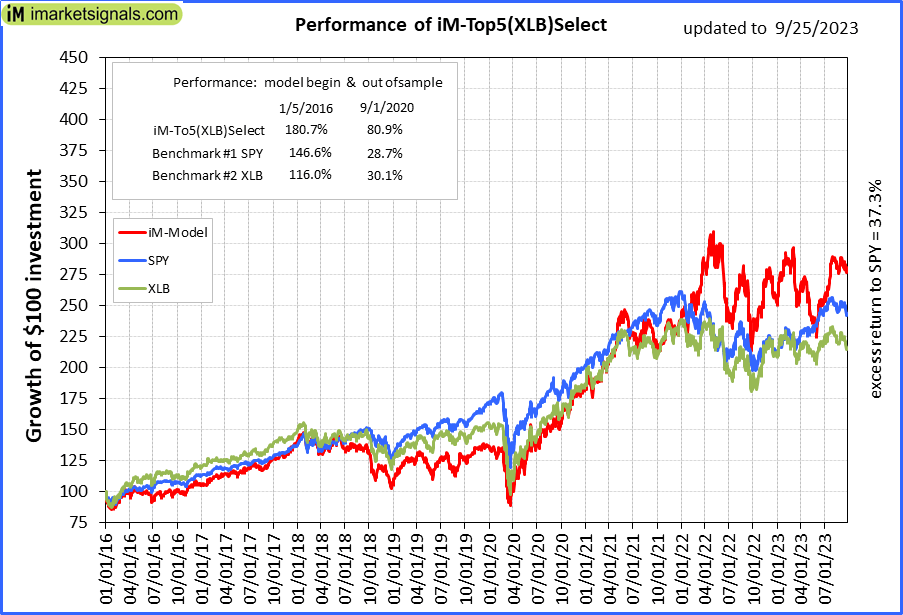 |
iM-Top5(XLB)Select: Since inception, on 1/5/2016, the model gained 180.40% while the benchmark SPY gained 143.13% over the same period. Over the previous week the market value of iM-Top5(XLB)Select gained 0.57% at a time when SPY gained -2.57%. A starting capital of $100,000 at inception on 1/5/2016 would have grown to $280,400 which includes -$227 cash and excludes $11,115 spent on fees and slippage. |
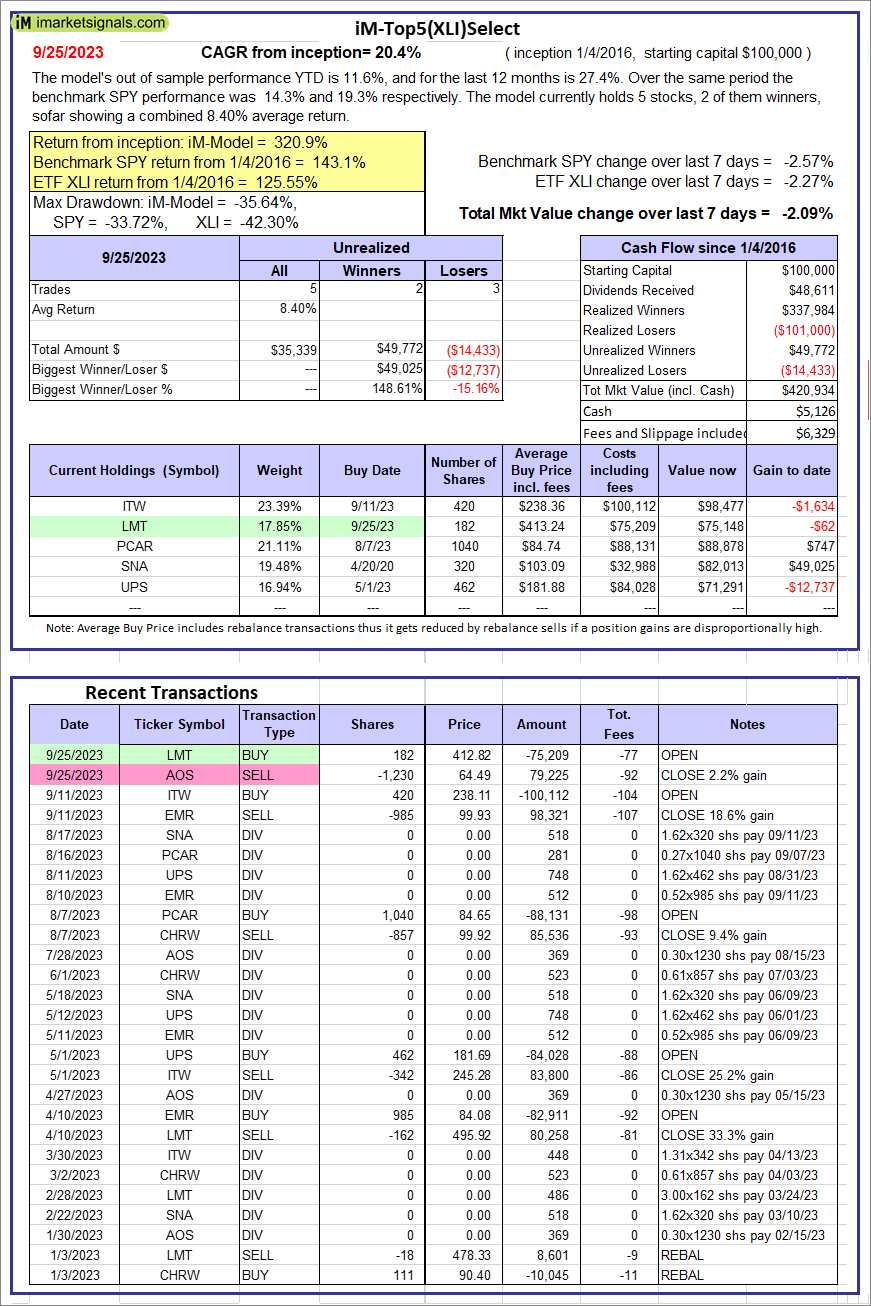 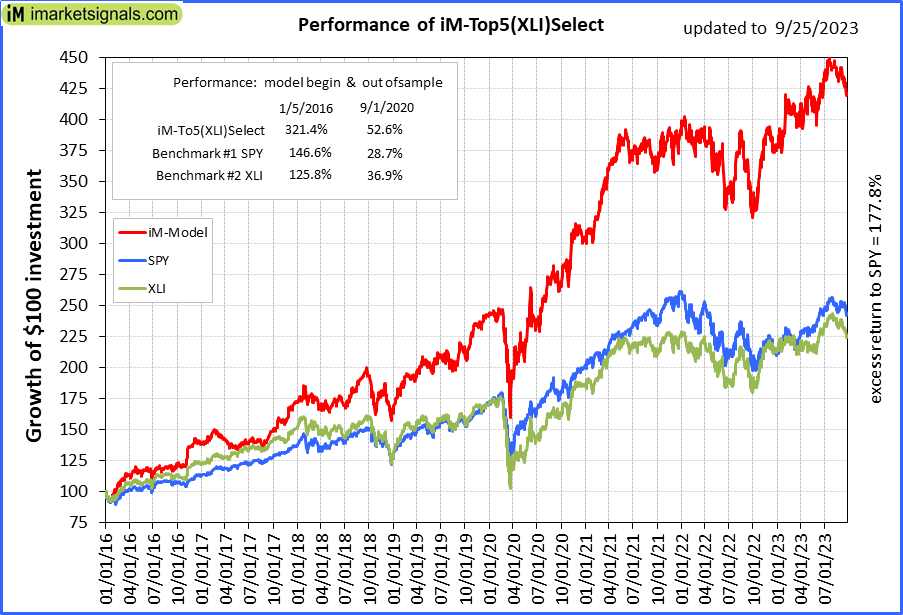 |
iM-Top5(XLI)Select: Since inception, on 1/5/2016, the model gained 320.93% while the benchmark SPY gained 143.13% over the same period. Over the previous week the market value of iM-Top5(XLI)Select gained -2.09% at a time when SPY gained -2.57%. A starting capital of $100,000 at inception on 1/5/2016 would have grown to $420,934 which includes $5,126 cash and excludes $6,329 spent on fees and slippage. |
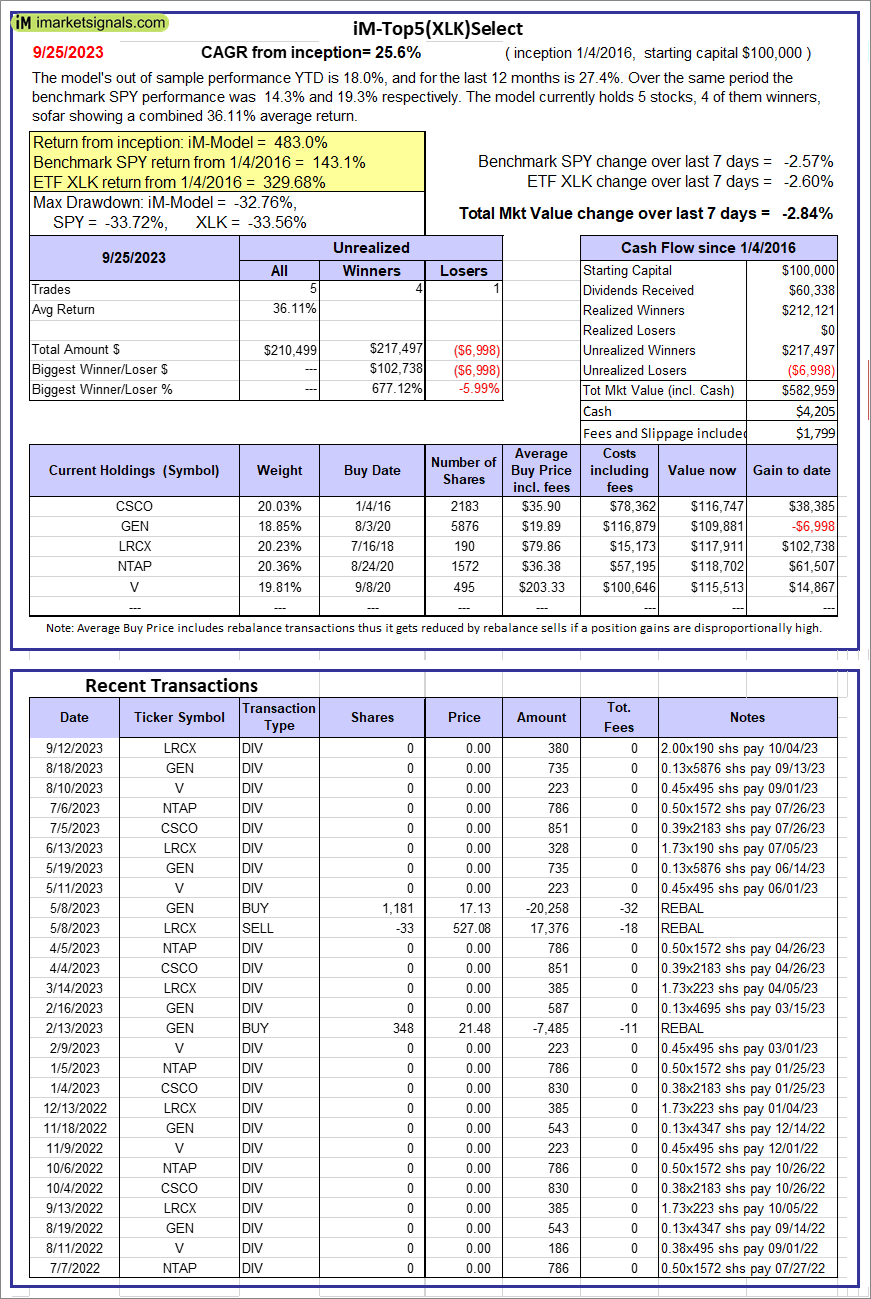 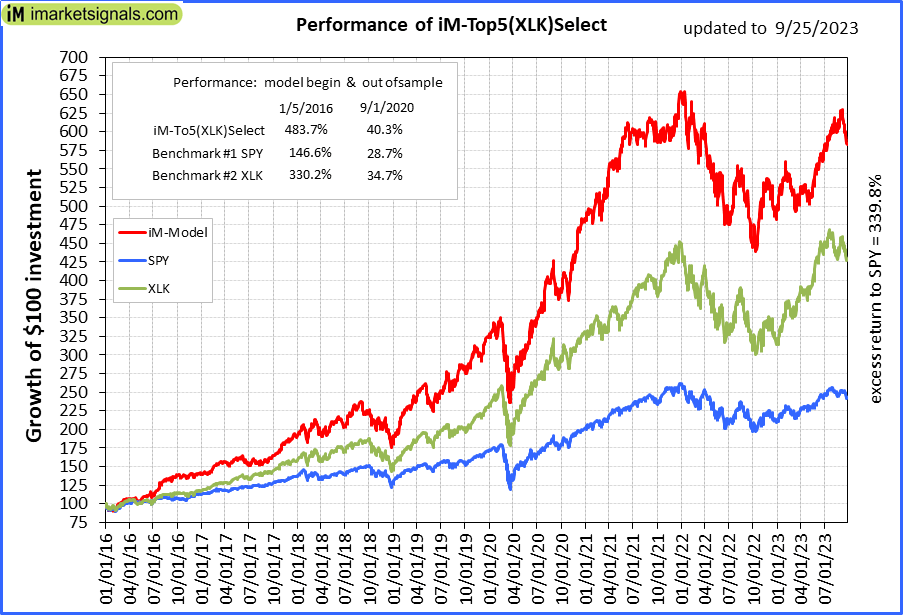 |
iM-Top5(XLK)Select: Since inception, on 1/5/2016, the model gained 482.96% while the benchmark SPY gained 143.13% over the same period. Over the previous week the market value of iM-Top5(XLK)Select gained -2.84% at a time when SPY gained -2.57%. A starting capital of $100,000 at inception on 1/5/2016 would have grown to $582,959 which includes $4,205 cash and excludes $1,799 spent on fees and slippage. |
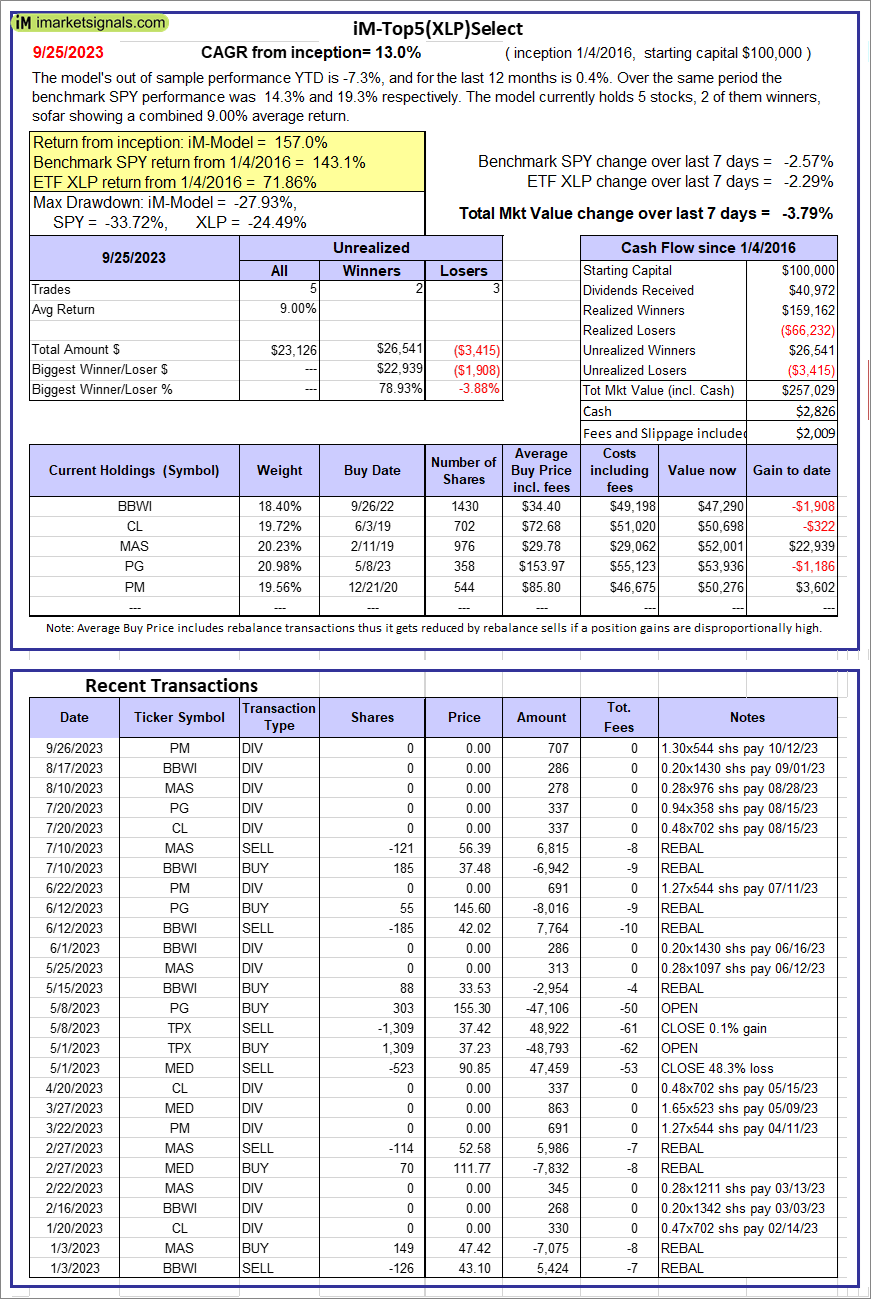 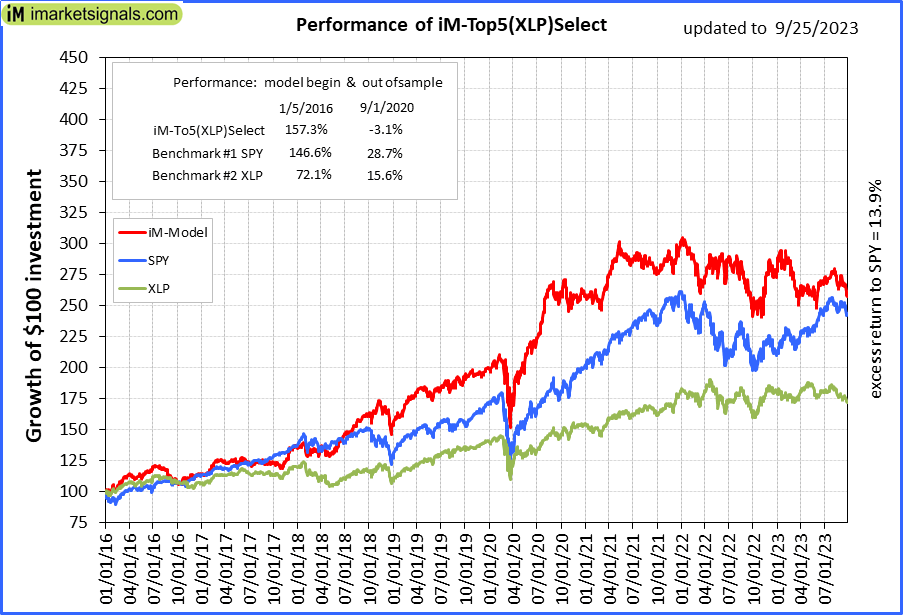 |
iM-Top5(XLP)Select: Since inception, on 1/5/2016, the model gained 157.03% while the benchmark SPY gained 143.13% over the same period. Over the previous week the market value of iM-Top5(XLP)Select gained -3.79% at a time when SPY gained -2.57%. A starting capital of $100,000 at inception on 1/5/2016 would have grown to $257,029 which includes $2,826 cash and excludes $2,009 spent on fees and slippage. |
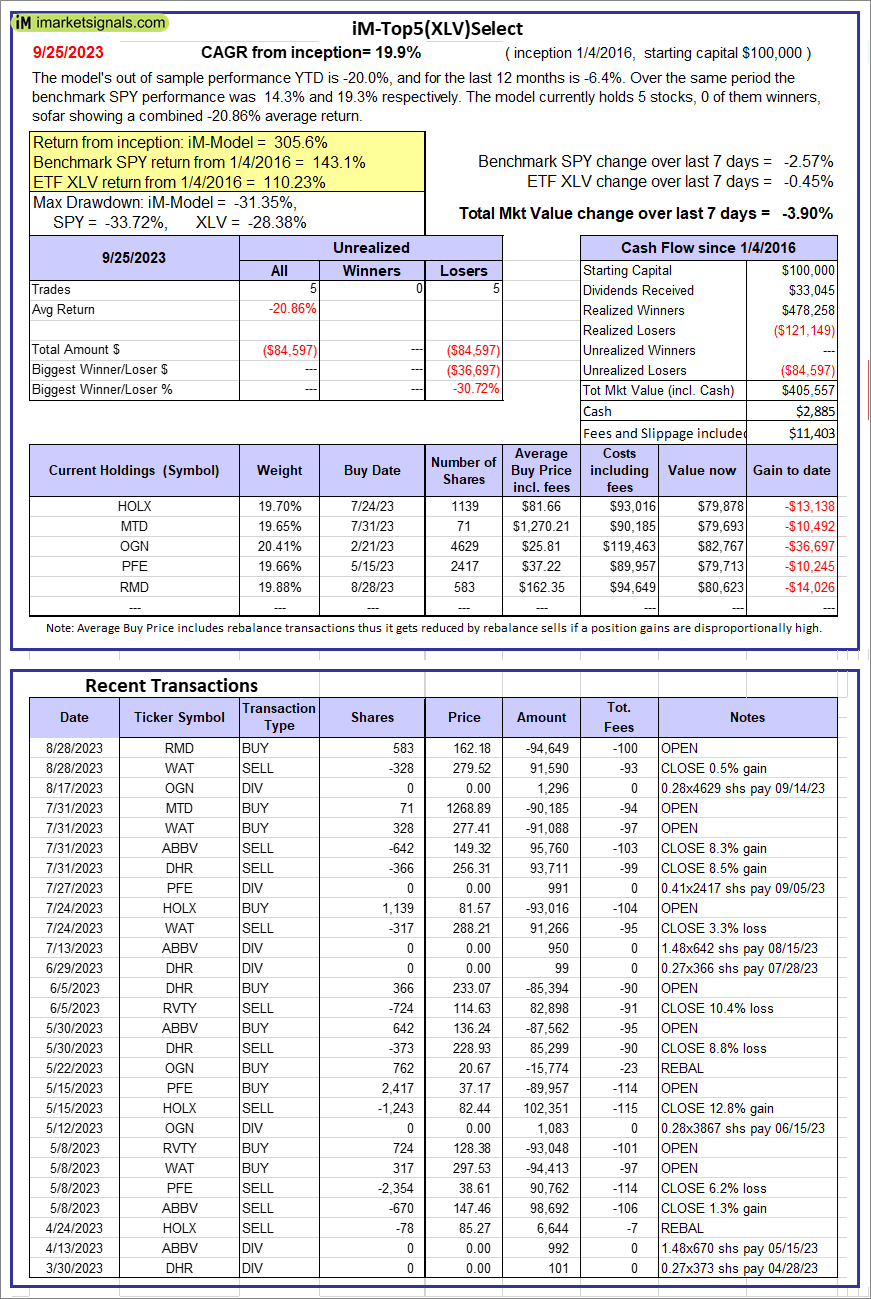 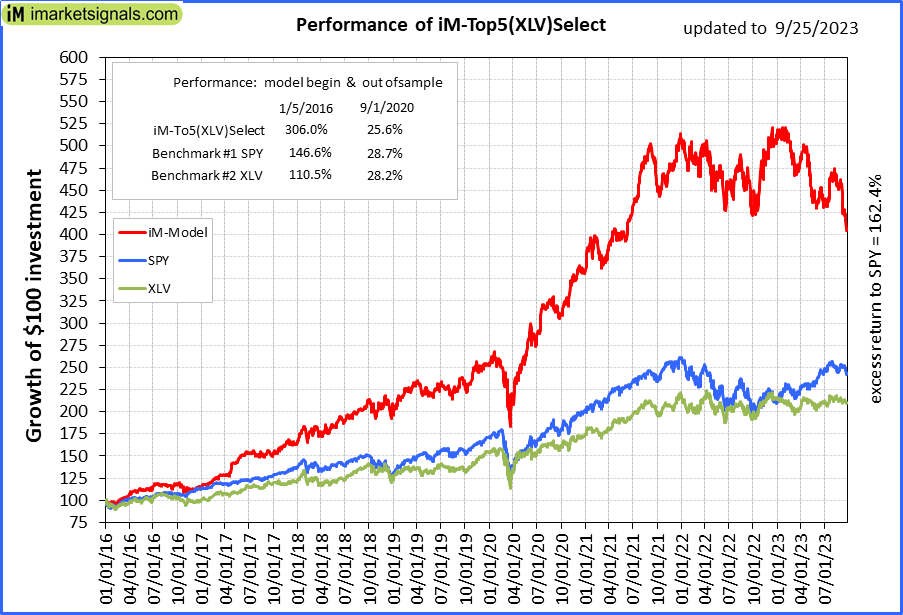 |
iM-Top5(XLV)Select: Since inception, on 1/5/2016, the model gained 305.56% while the benchmark SPY gained 143.13% over the same period. Over the previous week the market value of iM-Top5(XLV)Select gained -3.90% at a time when SPY gained -2.57%. A starting capital of $100,000 at inception on 1/5/2016 would have grown to $405,557 which includes $2,885 cash and excludes $11,403 spent on fees and slippage. |
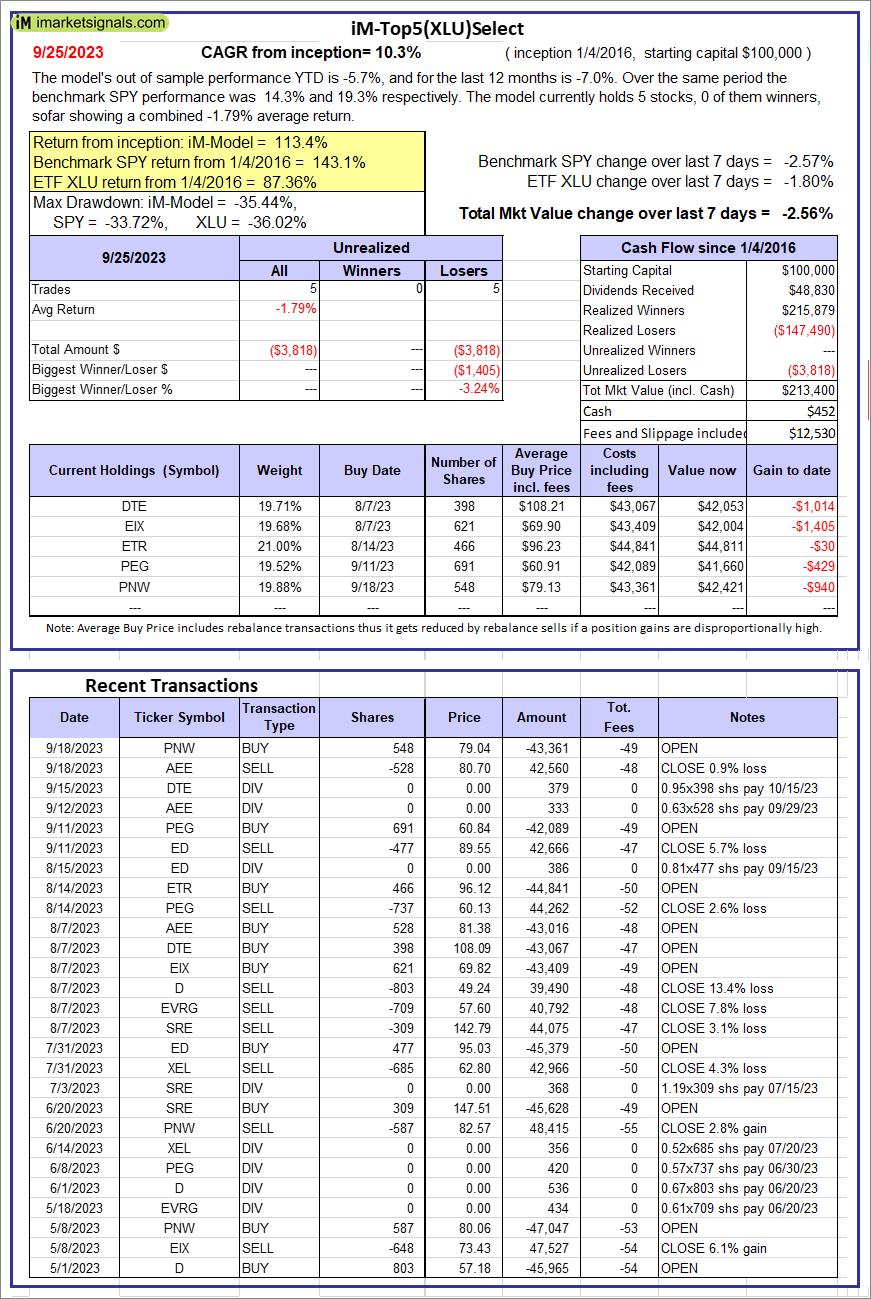 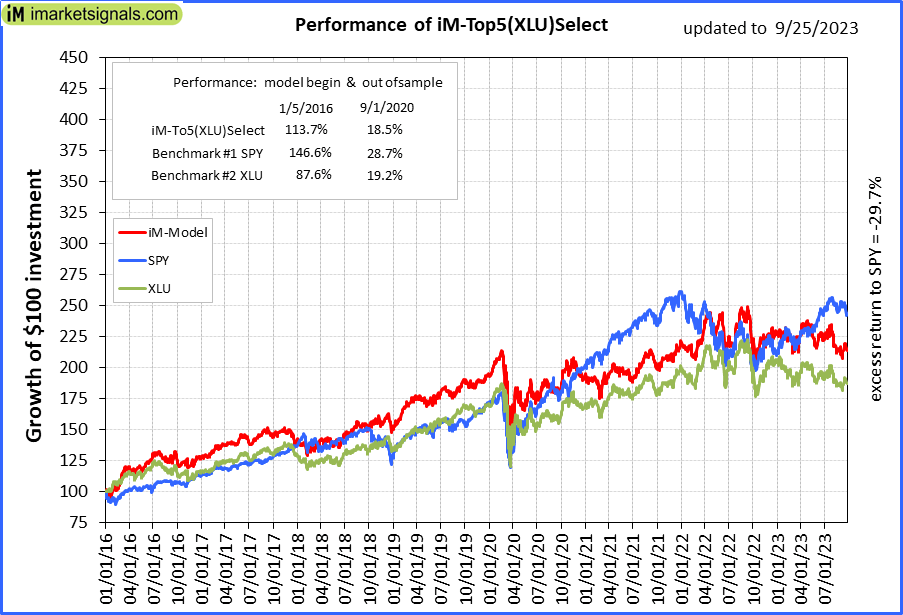 |
iM-Top5(XLU)Select: Since inception, on 1/5/2016, the model gained 113.40% while the benchmark SPY gained 143.13% over the same period. Over the previous week the market value of iM-Top5(XLU)Select gained -2.56% at a time when SPY gained -2.57%. A starting capital of $100,000 at inception on 1/5/2016 would have grown to $213,400 which includes $452 cash and excludes $12,530 spent on fees and slippage. |
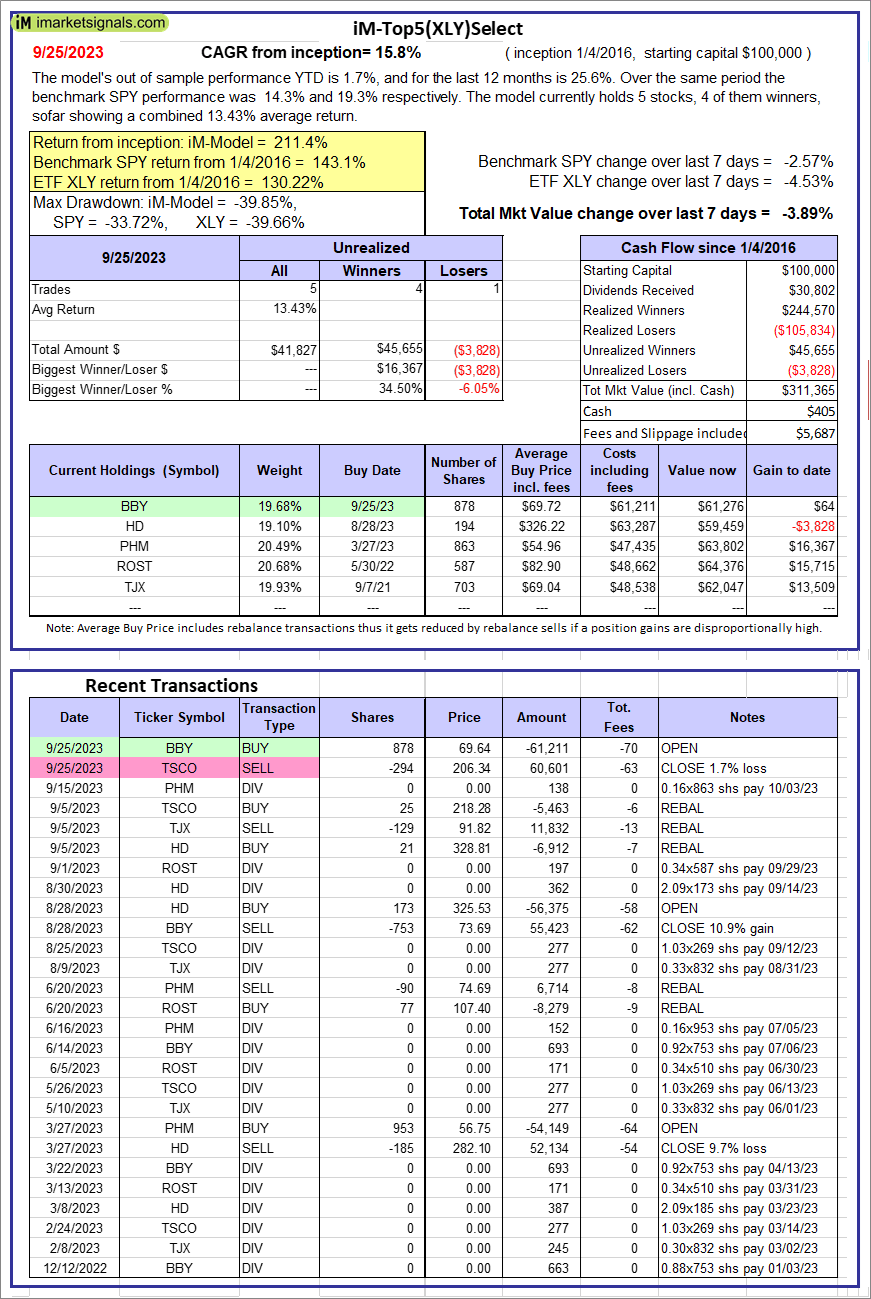 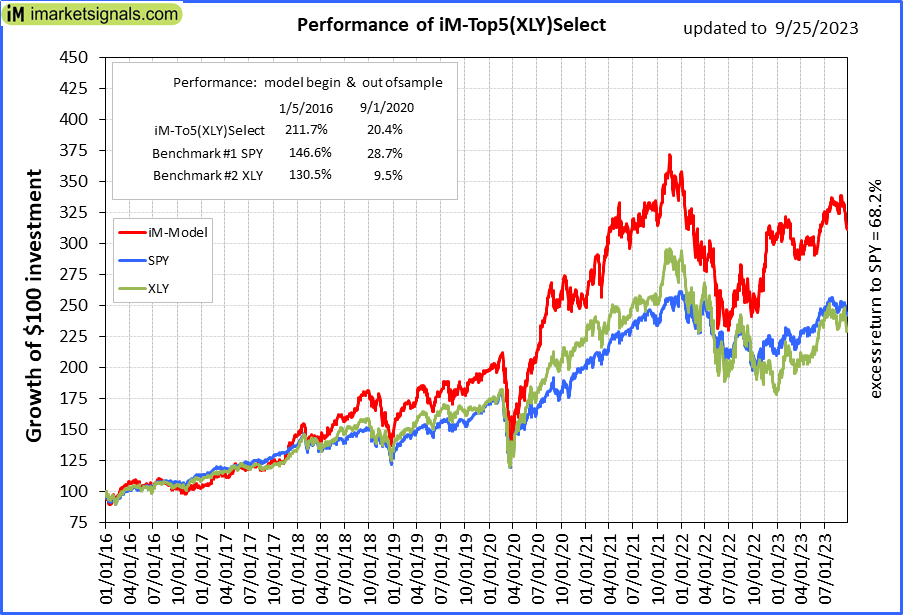 |
iM-Top5(XLY)Select: Since inception, on 1/5/2016, the model gained 211.36% while the benchmark SPY gained 143.13% over the same period. Over the previous week the market value of iM-Top5(XLY)Select gained -3.89% at a time when SPY gained -2.57%. A starting capital of $100,000 at inception on 1/5/2016 would have grown to $311,365 which includes $405 cash and excludes $5,687 spent on fees and slippage. |
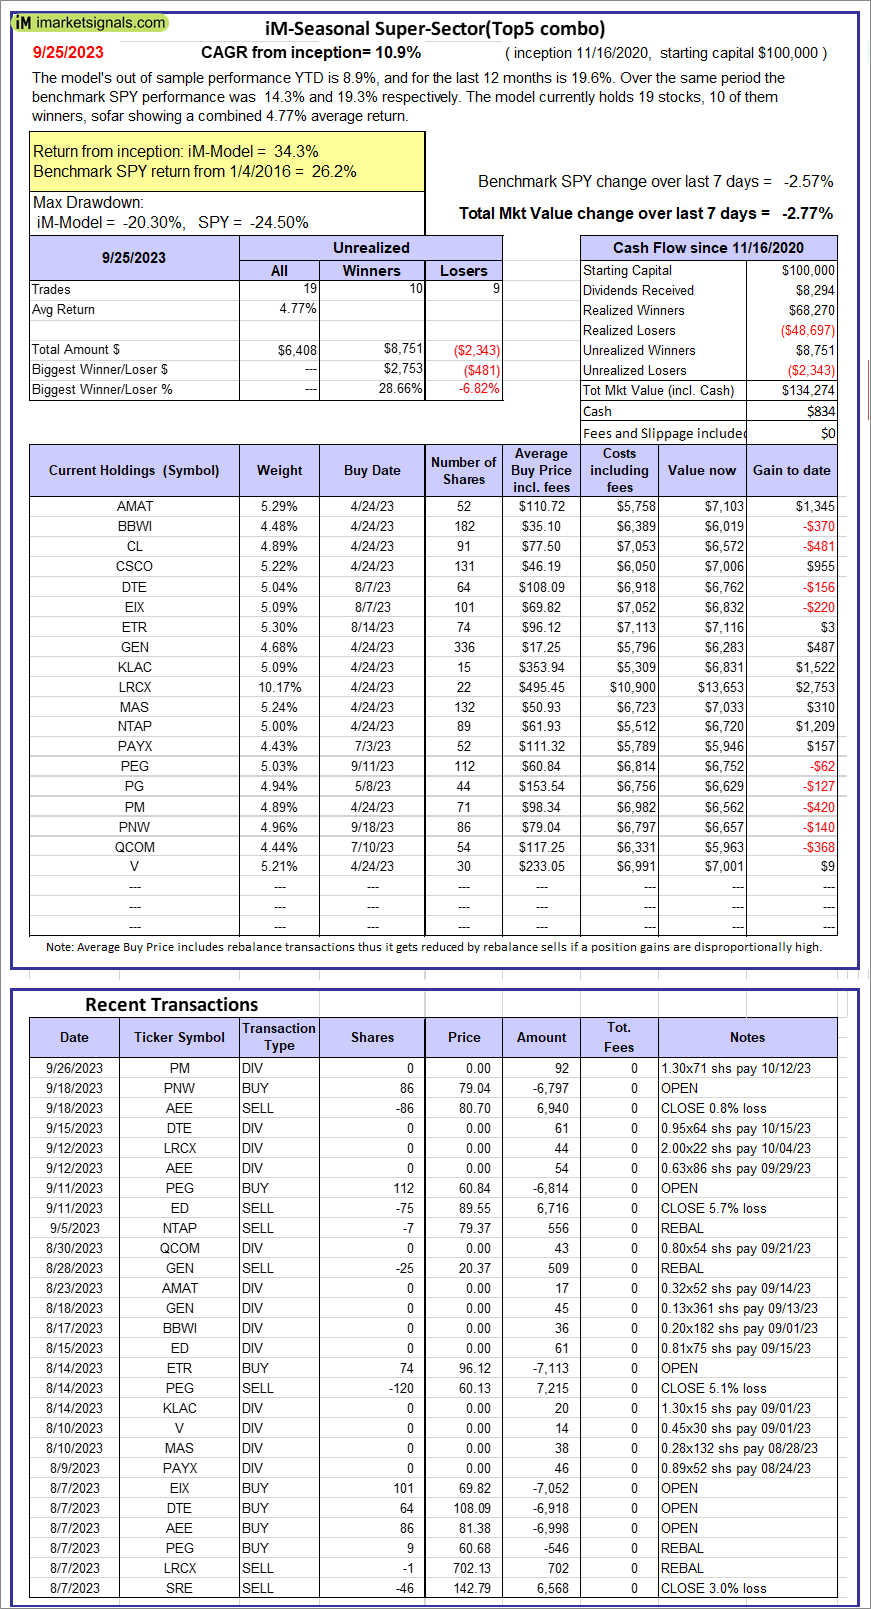 |
iM-Seasonal Super-Sectors (Top5 combo) : Since inception, on 11/17/2020, the model gained 34.27% while the benchmark SPY gained 26.21% over the same period. Over the previous week the market value of iM-Seasonal Super-Sectors (Top5 combo) gained -2.77% at a time when SPY gained -2.57%. A starting capital of $100,000 at inception on 11/17/2020 would have grown to $134,274 which includes $834 cash and excludes $00 spent on fees and slippage. |
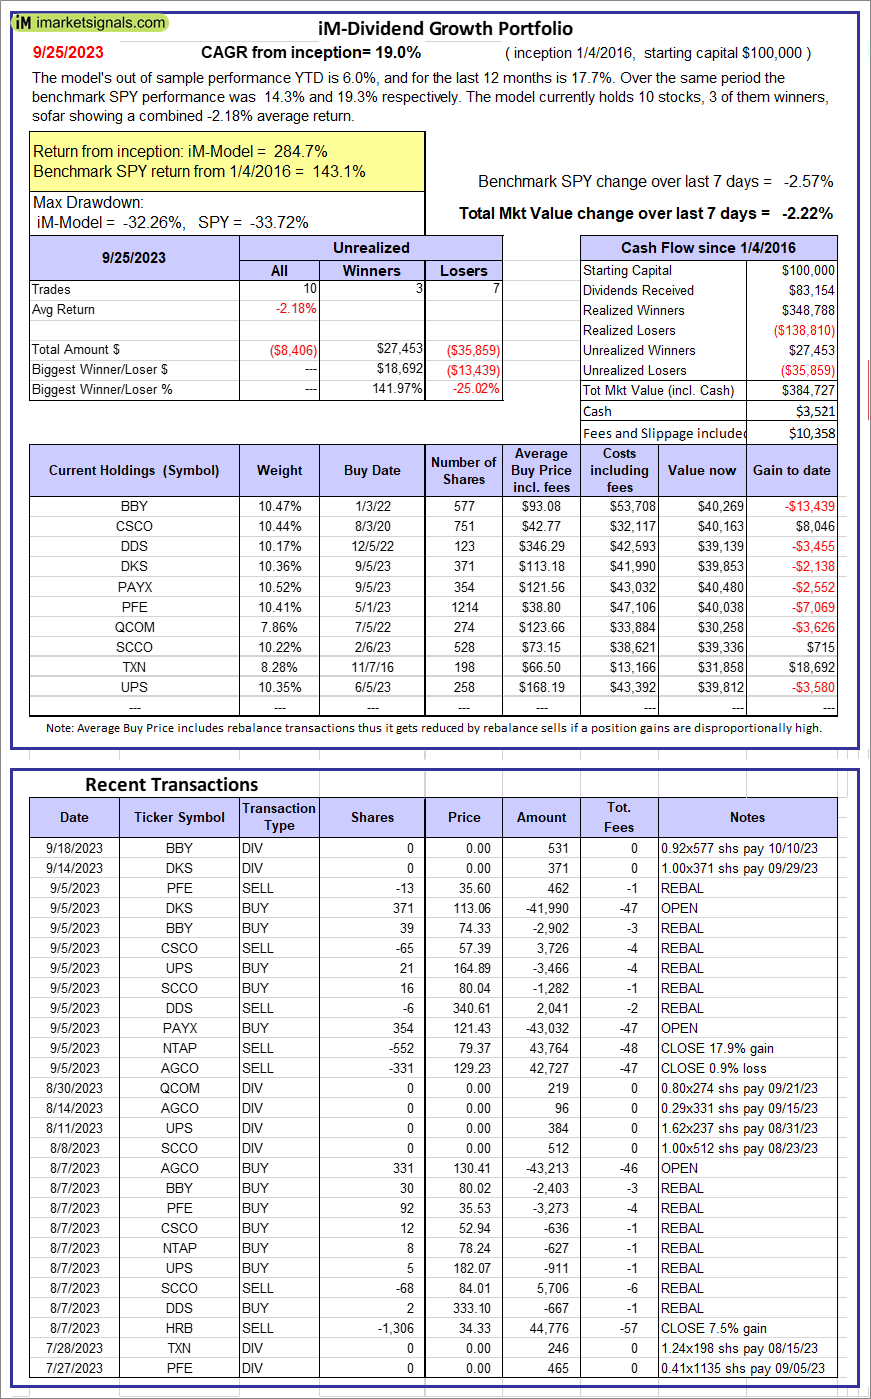 |
iM-Dividend Growth Portfolio: The model’s out of sample performance YTD is 6.0%, and for the last 12 months is 17.7%. Over the same period the benchmark SPY performance was 14.3% and 19.3% respectively. Over the previous week the market value of the iM-Dividend Growth Portfolio gained -2.22% at a time when SPY gained -2.57%. A starting capital of $100,000 at inception on 6/30/2016 would have grown to $384,727 which includes $3,521 cash and excludes $10,358 spent on fees and slippage. |
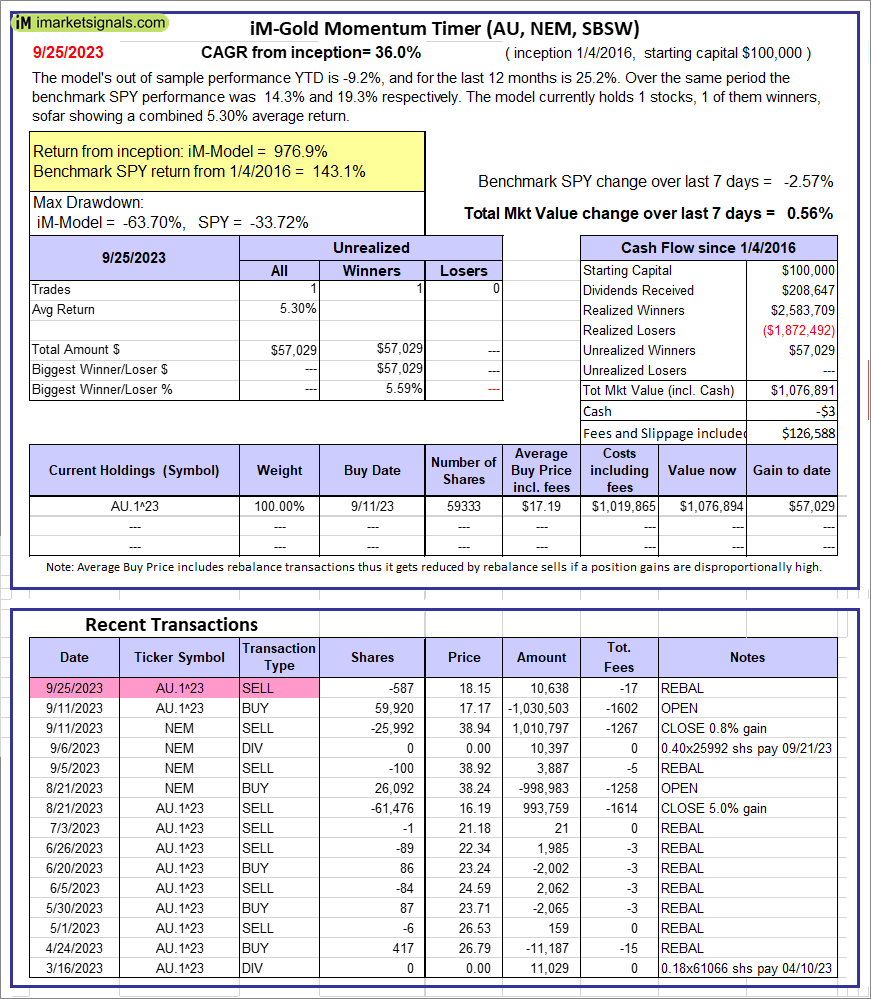 |
iM-Gold Momentum Timer (AU, NEM, SBSW): The model’s out of sample performance YTD is -9.2%, and for the last 12 months is 25.2%. Over the same period the benchmark SPY performance was 14.3% and 19.3% respectively. Over the previous week the market value of iM-Gold Momentum Timer (AU, NEM, SBSW) gained 0.56% at a time when SPY gained -2.57%. A starting capital of $100,000 at inception on 6/30/2016 would have grown to -$03 which includes $126,588 cash and excludes Gain to date spent on fees and slippage. |
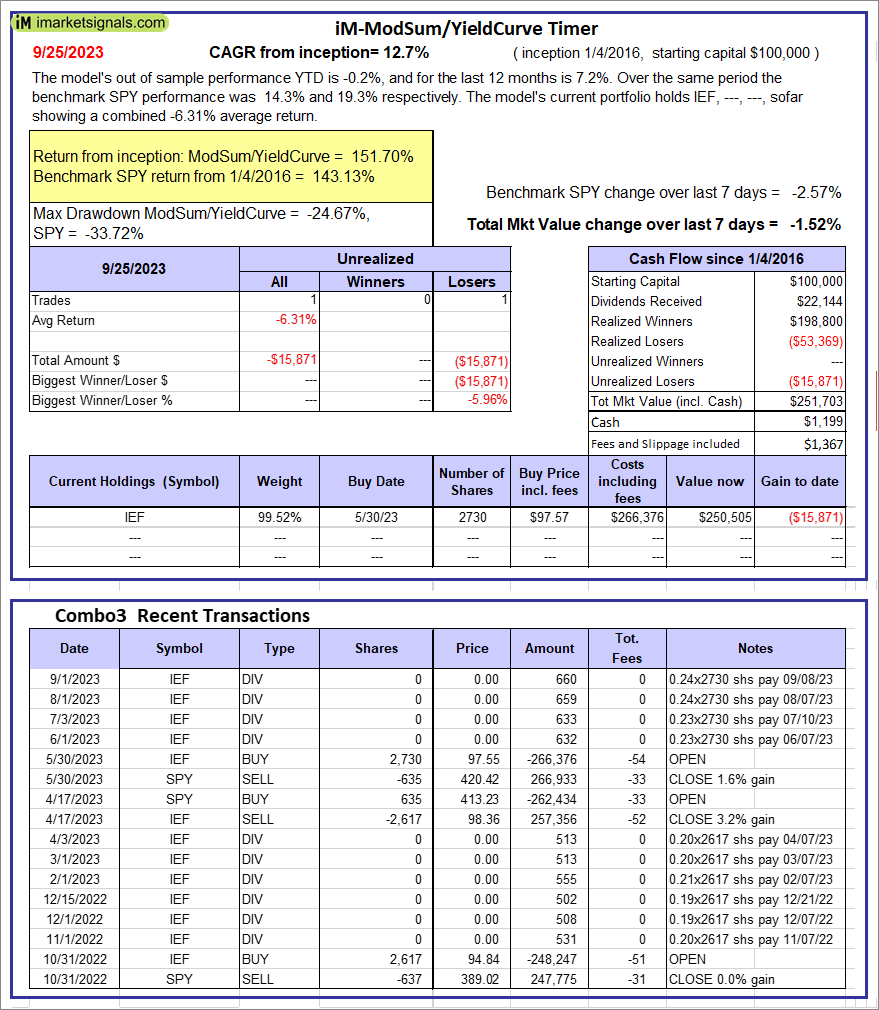 |
iM-ModSum/YieldCurve Timer: The model’s out of sample performance YTD is -0.2%, and for the last 12 months is 7.2%. Over the same period the benchmark SPY performance was 14.3% and 19.3% respectively. Over the previous week the market value of iM-PortSum/YieldCurve Timer gained -1.52% at a time when SPY gained -2.57%. A starting capital of $100,000 at inception on 1/1/2016 would have grown to $251,703 which includes $1,199 cash and excludes $1,367 spent on fees and slippage. |
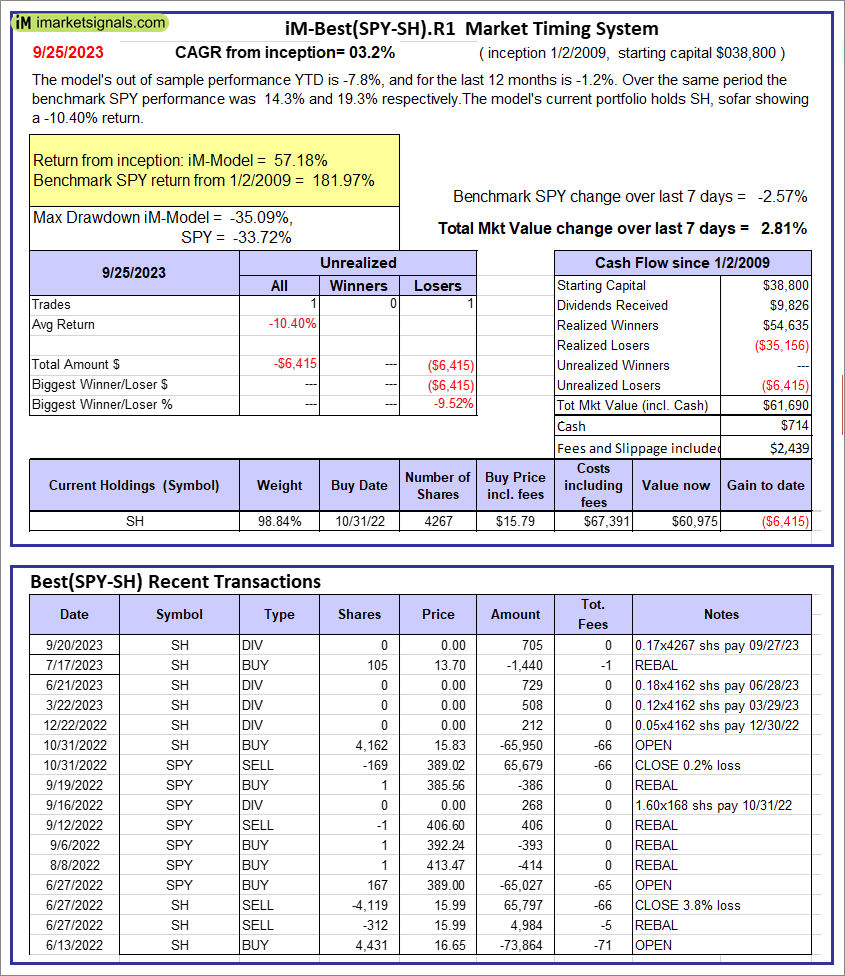 |
iM-Best(SPY-SH).R1: The model’s out of sample performance YTD is -7.8%, and for the last 12 months is -1.2%. Over the same period the benchmark SPY performance was 14.3% and 19.3% respectively. Over the previous week the market value of Best(SPY-SH) gained 2.81% at a time when SPY gained -2.57%. A starting capital of $100,000 at inception on 1/2/2009 would have grown to $61,690 which includes $714 cash and excludes $2,439 spent on fees and slippage. |
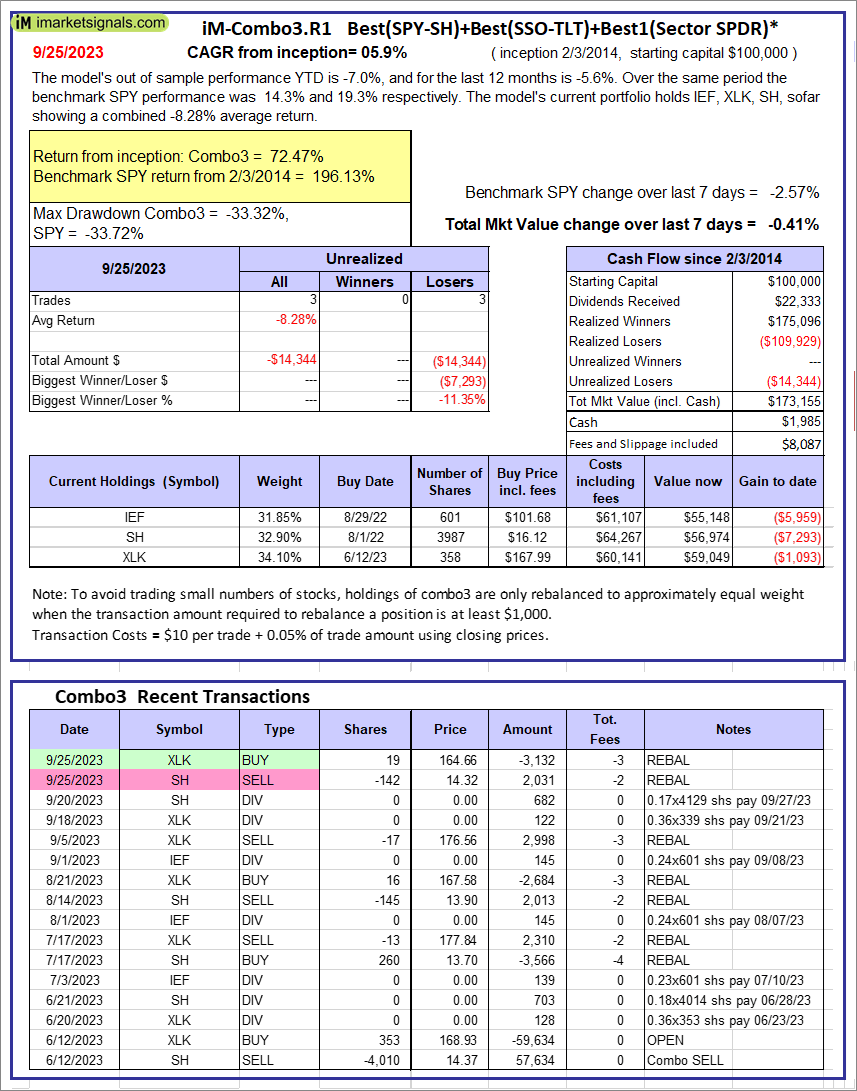 |
iM-Combo3.R1: The model’s out of sample performance YTD is -7.0%, and for the last 12 months is -5.6%. Over the same period the benchmark SPY performance was 14.3% and 19.3% respectively. Over the previous week the market value of iM-Combo3.R1 gained -0.41% at a time when SPY gained -2.57%. A starting capital of $100,000 at inception on 2/3/2014 would have grown to $173,155 which includes $1,985 cash and excludes $8,087 spent on fees and slippage. |
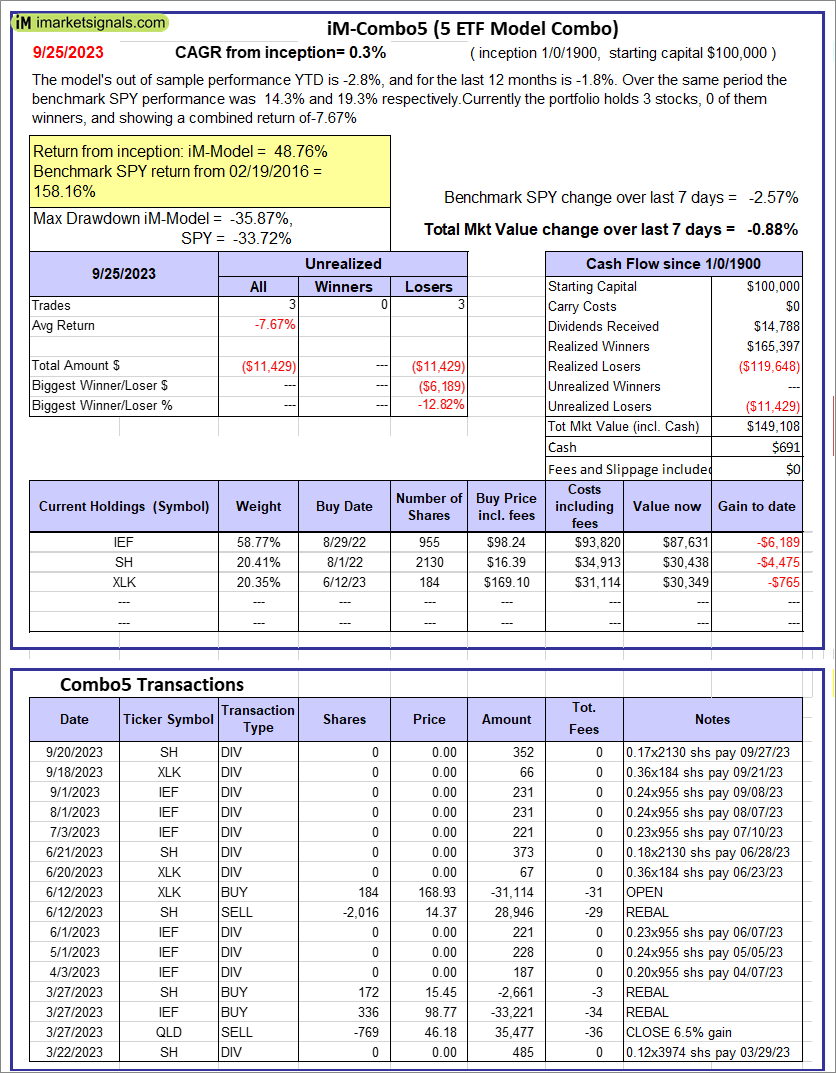 |
iM-Combo5: The model’s out of sample performance YTD is -2.8%, and for the last 12 months is -1.8%. Over the same period the benchmark SPY performance was 14.3% and 19.3% respectively. Over the previous week the market value of iM-Combo5 gained -0.88% at a time when SPY gained -2.57%. A starting capital of $100,000 at inception on 2/22/2016 would have grown to $149,108 which includes $691 cash and excludes $0 spent on fees and slippage. |
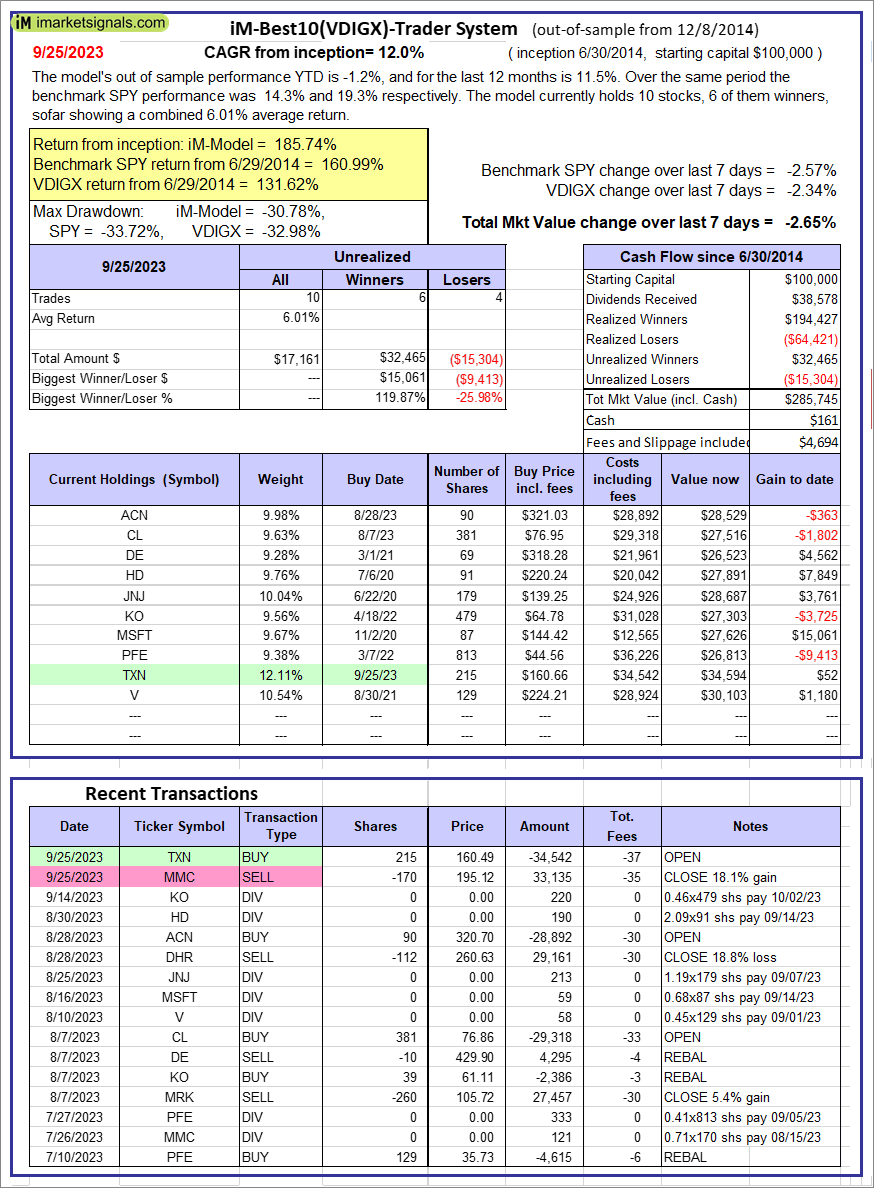 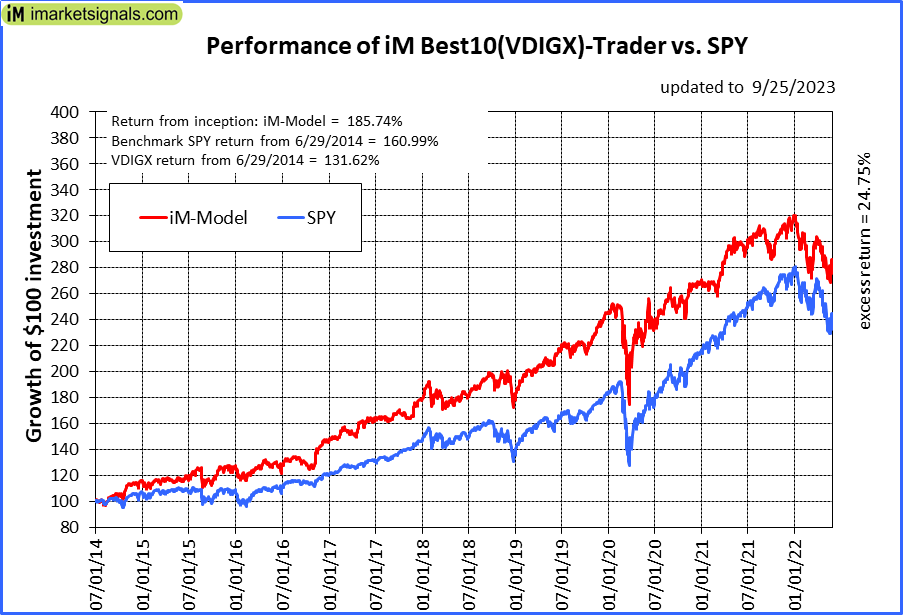 |
iM-Best10(VDIGX)-Trader: The model’s out of sample performance YTD is -1.2%, and for the last 12 months is 11.5%. Over the same period the benchmark SPY performance was 14.3% and 19.3% respectively. Since inception, on 7/1/2014, the model gained 185.74% while the benchmark SPY gained 160.99% and VDIGX gained 131.62% over the same period. Over the previous week the market value of iM-Best10(VDIGX) gained -2.65% at a time when SPY gained -2.57%. A starting capital of $100,000 at inception on 7/1/2014 would have grown to $285,745 which includes $161 cash and excludes $4,694 spent on fees and slippage. |
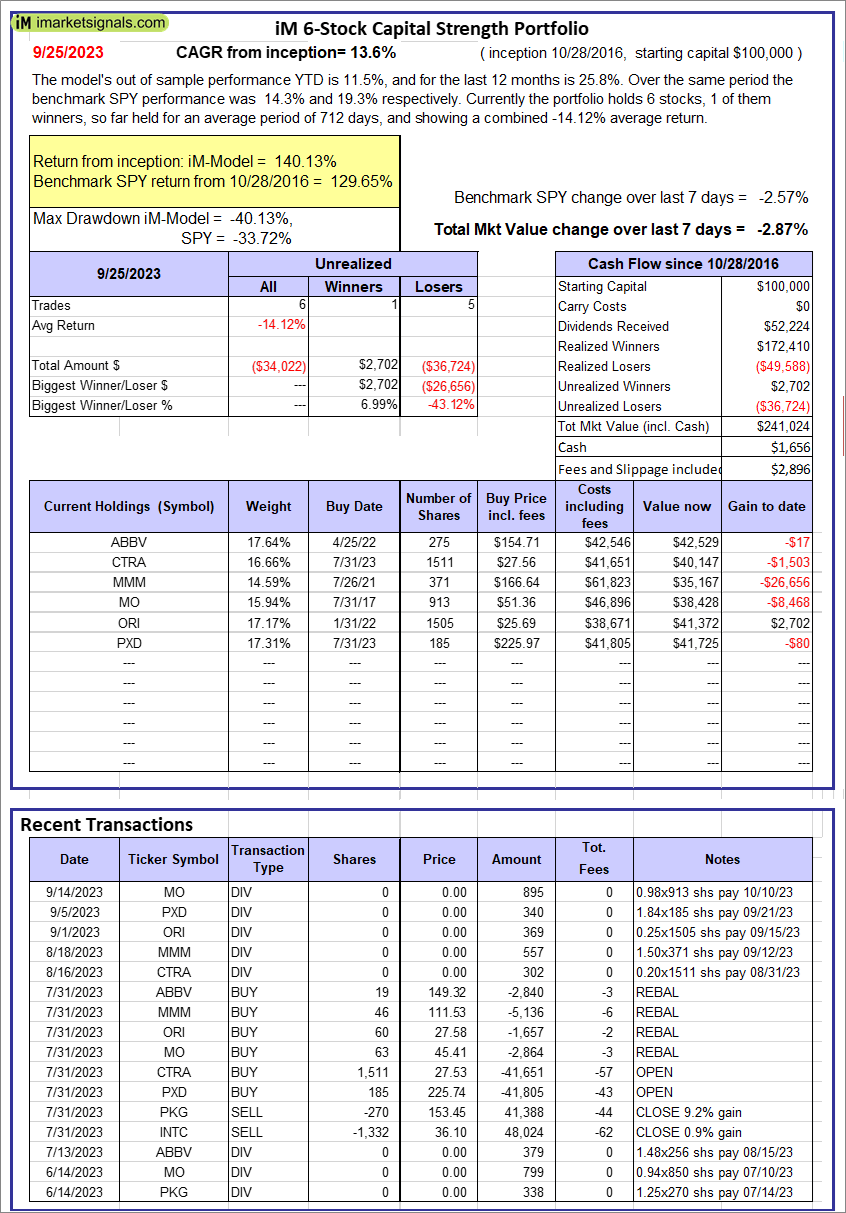 |
iM 6-Stock Capital Strength Portfolio: The model’s out of sample performance YTD is 11.5%, and for the last 12 months is 25.8%. Over the same period the benchmark SPY performance was 14.3% and 19.3% respectively. Over the previous week the market value of the iM 6-Stock Capital Strength Portfolio gained -2.87% at a time when SPY gained -2.57%. A starting capital of $100,000 at inception on 10/28/2016 would have grown to $241,024 which includes $1,656 cash and excludes $2,896 spent on fees and slippage. |
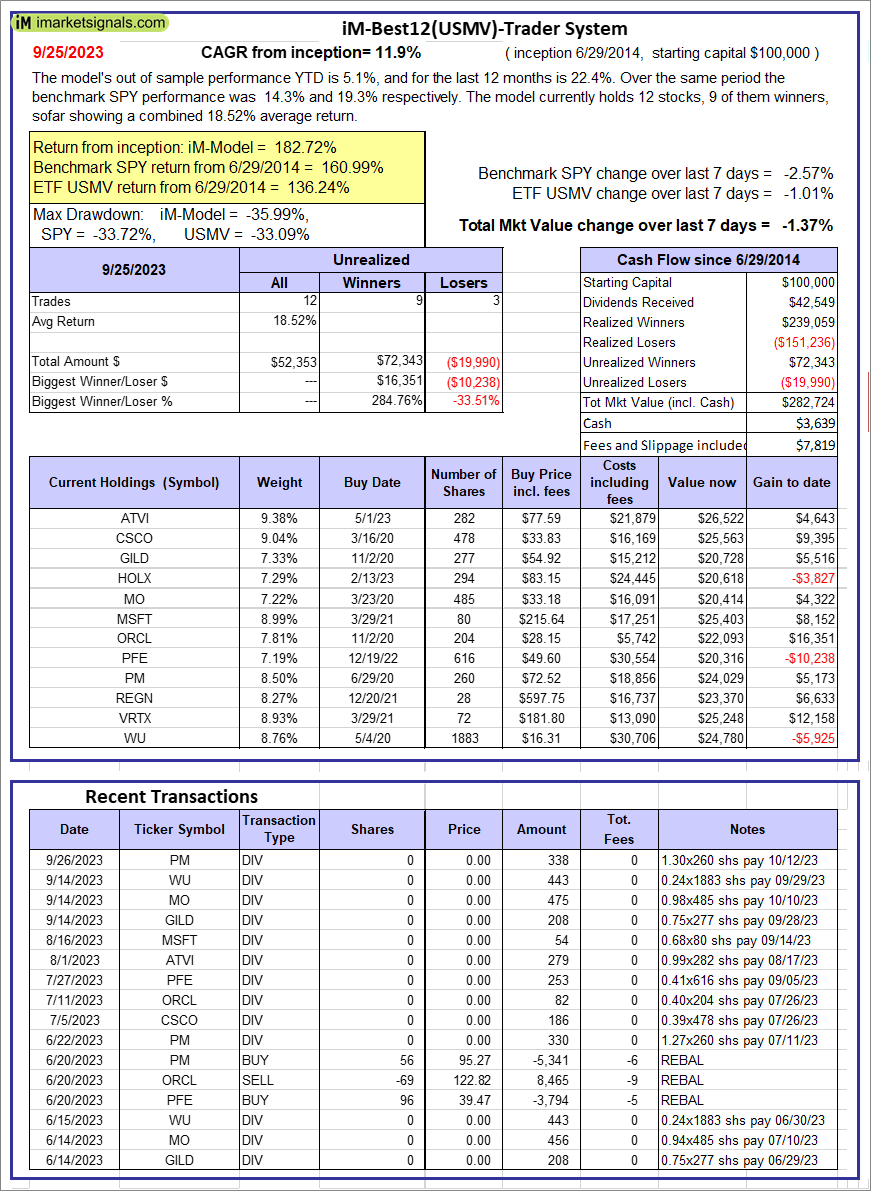 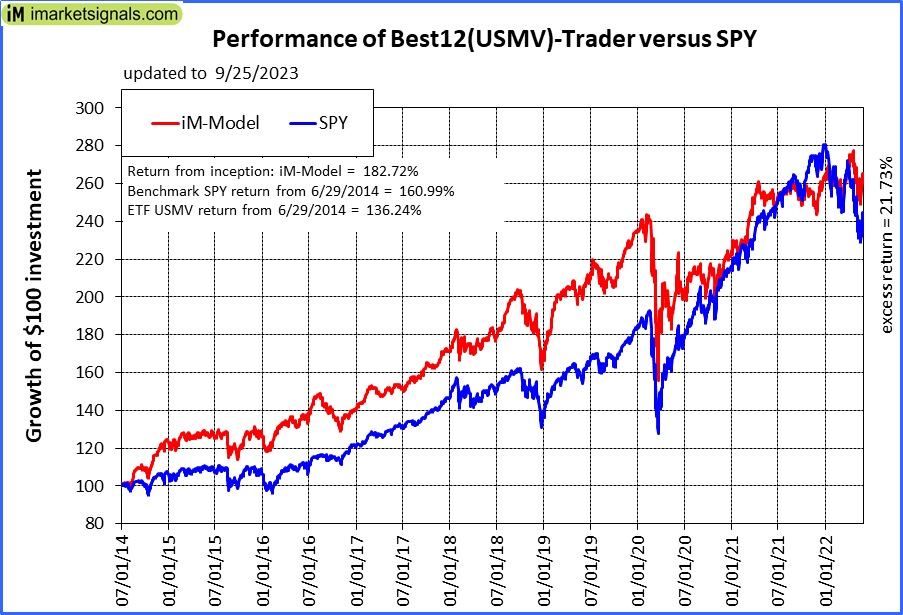 |
iM-Best12(USMV)-Trader: The model’s out of sample performance YTD is 5.1%, and for the last 12 months is 22.4%. Over the same period the benchmark SPY performance was 14.3% and 19.3% respectively. Since inception, on 6/30/2014, the model gained 182.72% while the benchmark SPY gained 160.99% and the ETF USMV gained 136.24% over the same period. Over the previous week the market value of iM-Best12(USMV)-Trader gained -1.37% at a time when SPY gained -2.57%. A starting capital of $100,000 at inception on 6/30/2014 would have grown to $282,724 which includes $3,639 cash and excludes $7,819 spent on fees and slippage. |
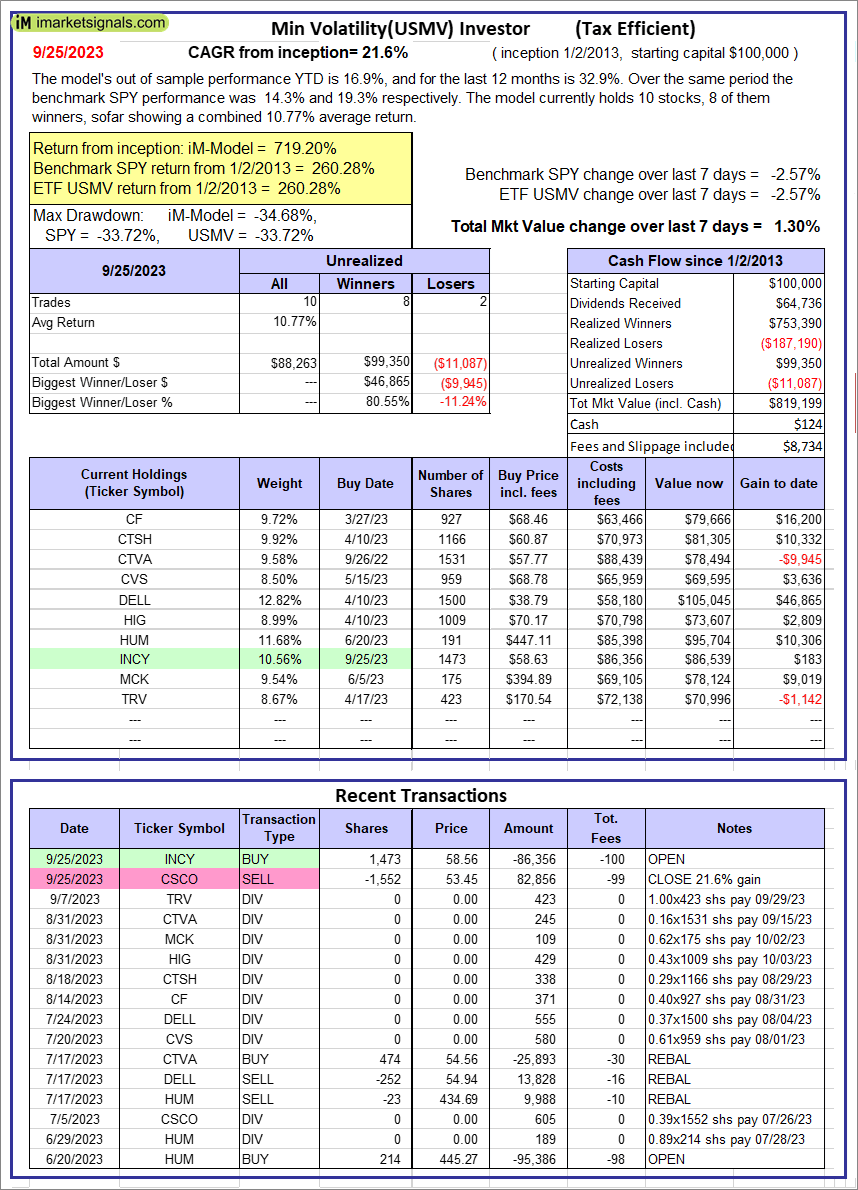 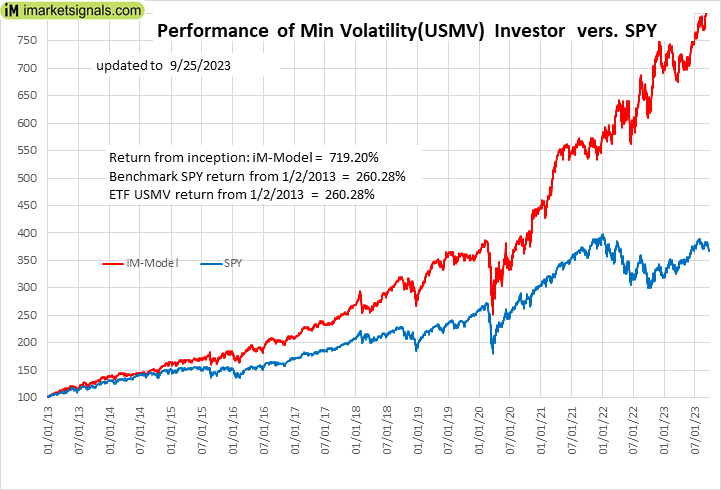 |
iM-Min Volatility(USMV) Investor (Tax Efficient): The model’s out of sample performance YTD is 16.9%, and for the last 12 months is 32.9%. Over the same period the benchmark SPY performance was 14.3% and 19.3% respectively. Since inception, on 1/3/2013, the model gained 719.20% while the benchmark SPY gained 260.28% and the ETF USMV gained 260.28% over the same period. Over the previous week the market value of iM-Best12(USMV)Q1 gained 1.30% at a time when SPY gained -2.57%. A starting capital of $100,000 at inception on 1/3/2013 would have grown to $819,199 which includes $124 cash and excludes $8,734 spent on fees and slippage. |
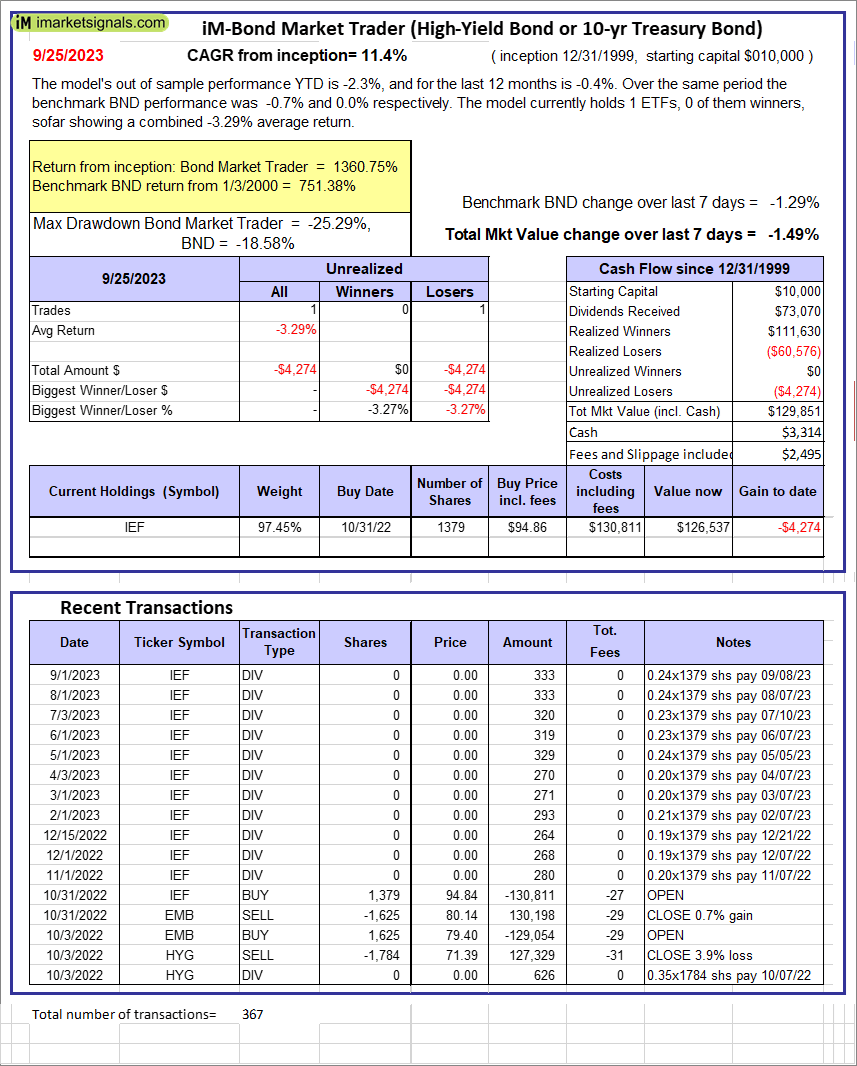 |
iM-Bond Market Trader (High-Yield Bond or 10-yr Treasury Bond): The model’s out of sample performance YTD is -2.3%, and for the last 12 months is -0.4%. Over the same period the benchmark BND performance was -0.7% and 0.0% respectively. Over the previous week the market value of the iM-Bond Market Trader (High-Yield Bond or 10-yr Treasury Bond) gained -1.49% at a time when BND gained -1.29%. A starting capital of $10,000 at inception on 1/3/2000 would have grown to $129,851 which includes $3,314 cash and excludes $2,495 spent on fees and slippage. |
|
|
iM-ModSum/YieldCurve Timer: The model’s out of sample performance YTD is -0.2%, and for the last 12 months is 7.2%. Over the same period the benchmark SPY performance was 14.3% and 19.3% respectively. Over the previous week the market value of iM-PortSum/YieldCurve Timer gained -1.52% at a time when SPY gained -2.57%. A starting capital of $100,000 at inception on 1/1/2016 would have grown to $251,703 which includes $1,199 cash and excludes $1,367 spent on fees and slippage. |
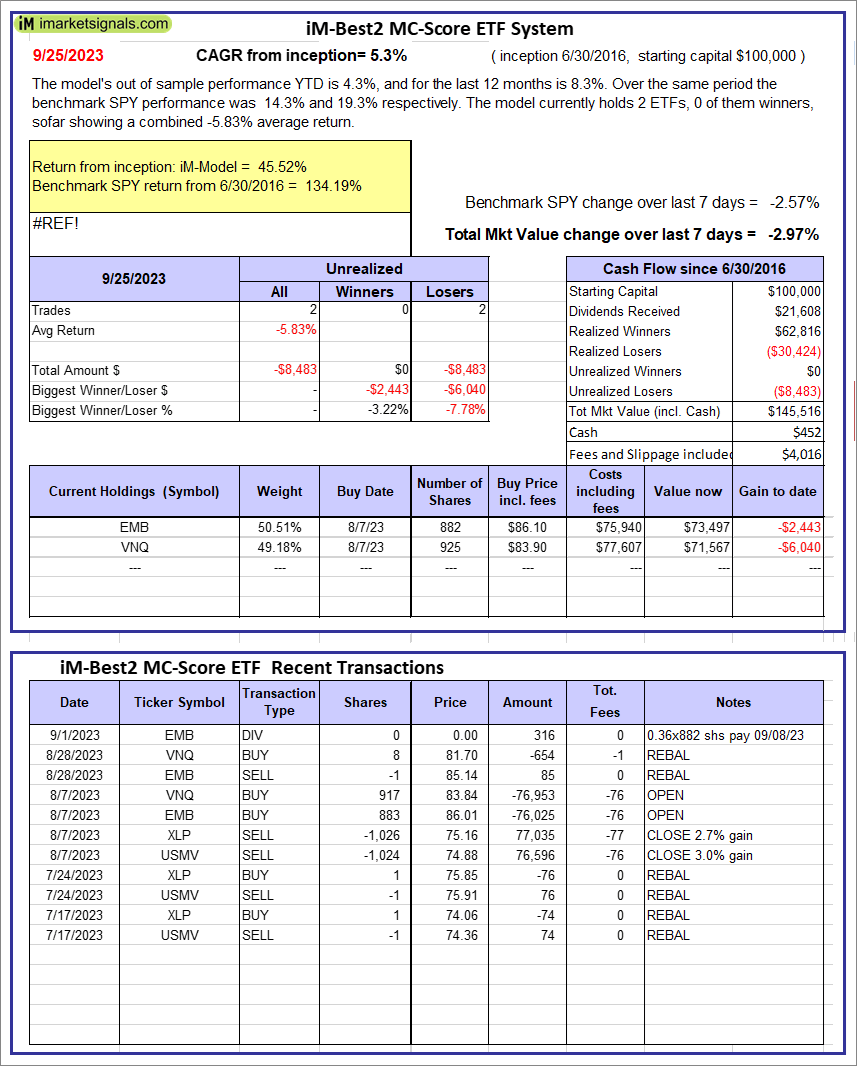 |
iM-Best2 MC-Score ETF System: The model’s out of sample performance YTD is 4.3%, and for the last 12 months is 8.3%. Over the same period the benchmark SPY performance was 14.3% and 19.3% respectively. Over the previous week the market value of the iM-Best2 MC-Score ETF System gained -2.97% at a time when SPY gained -2.57%. A starting capital of $100,000 at inception on 6/30/2016 would have grown to $145,516 which includes $452 cash and excludes $4,016 spent on fees and slippage. |
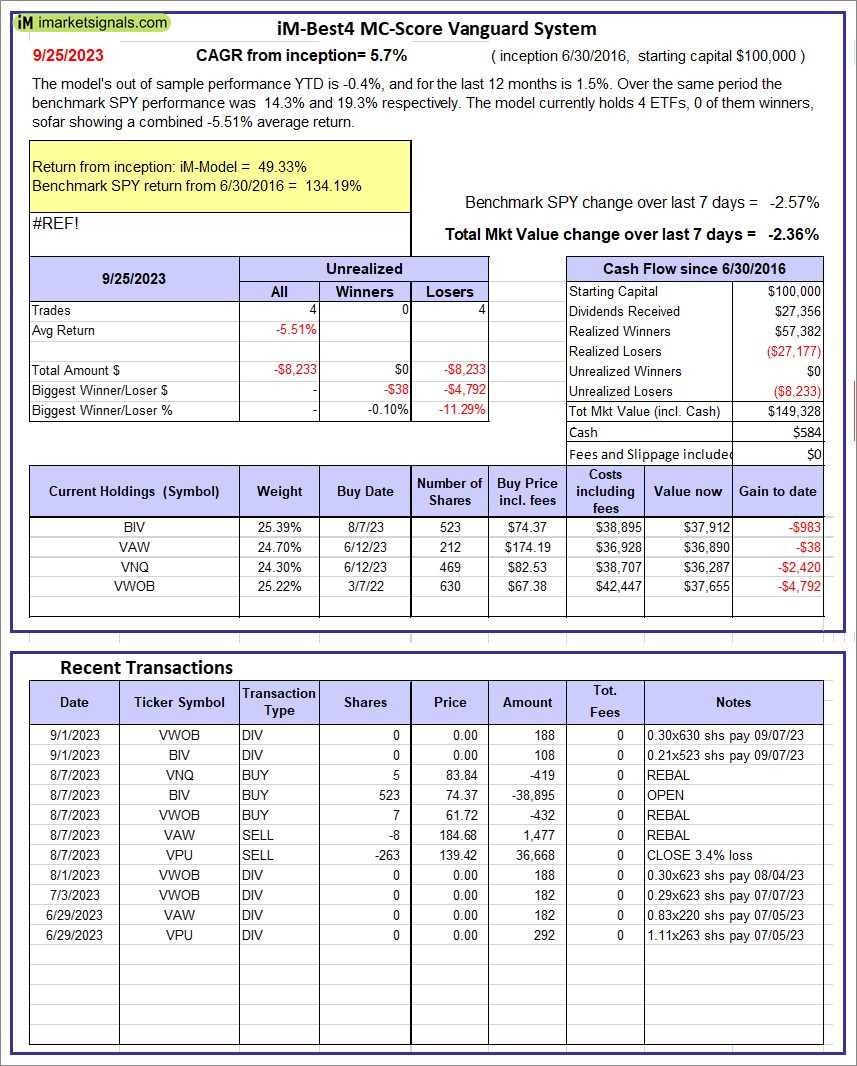 |
iM-Best4 MC-Score Vanguard System: The model’s out of sample performance YTD is -0.4%, and for the last 12 months is 1.5%. Over the same period the benchmark SPY performance was 14.3% and 19.3% respectively. Over the previous week the market value of the iM-Best4 MC-Score Vanguard System gained -2.36% at a time when SPY gained -2.57%. A starting capital of $100,000 at inception on 6/30/2016 would have grown to $149,328 which includes $584 cash and excludes $00 spent on fees and slippage. |
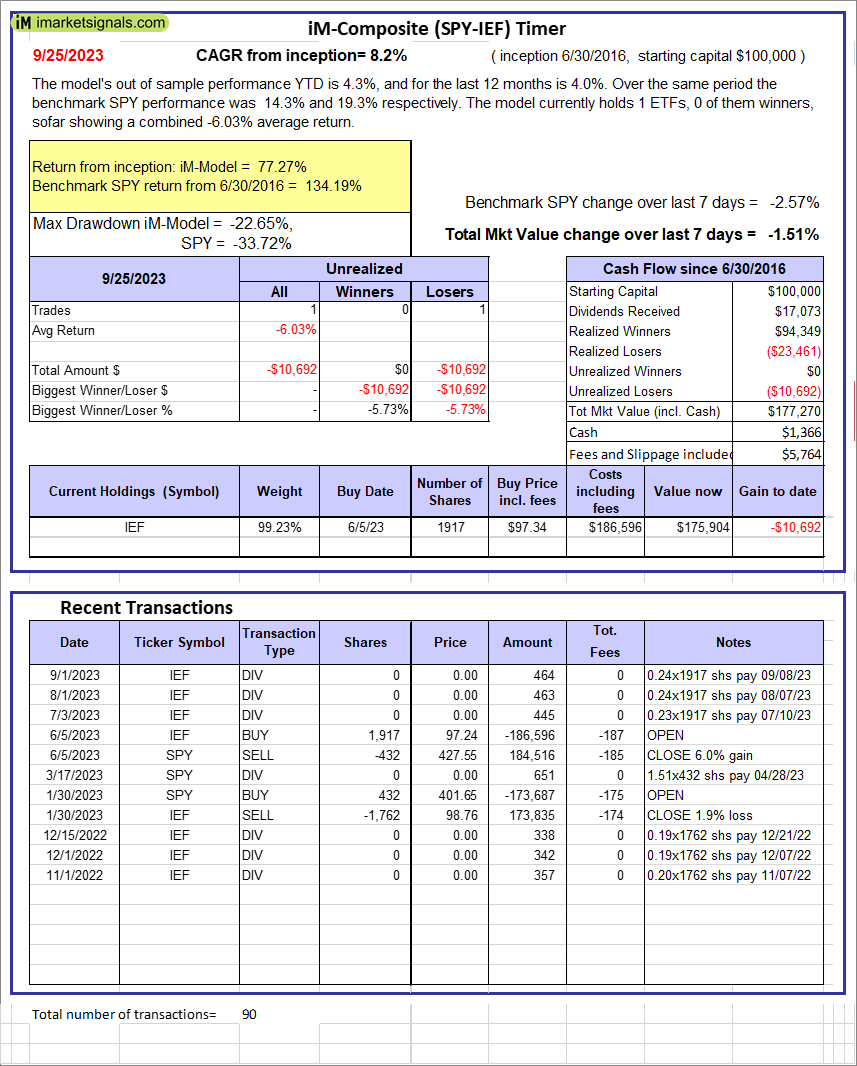 |
iM-Composite (SPY-IEF) Timer: The model’s out of sample performance YTD is 4.3%, and for the last 12 months is 4.0%. Over the same period the benchmark SPY performance was 14.3% and 19.3% respectively. Over the previous week the market value of the iM-Composite (SPY-IEF) Timer gained -1.51% at a time when SPY gained -2.57%. A starting capital of $100,000 at inception on 6/30/2016 would have grown to $177,270 which includes $1,366 cash and excludes $5,764 spent on fees and slippage. |
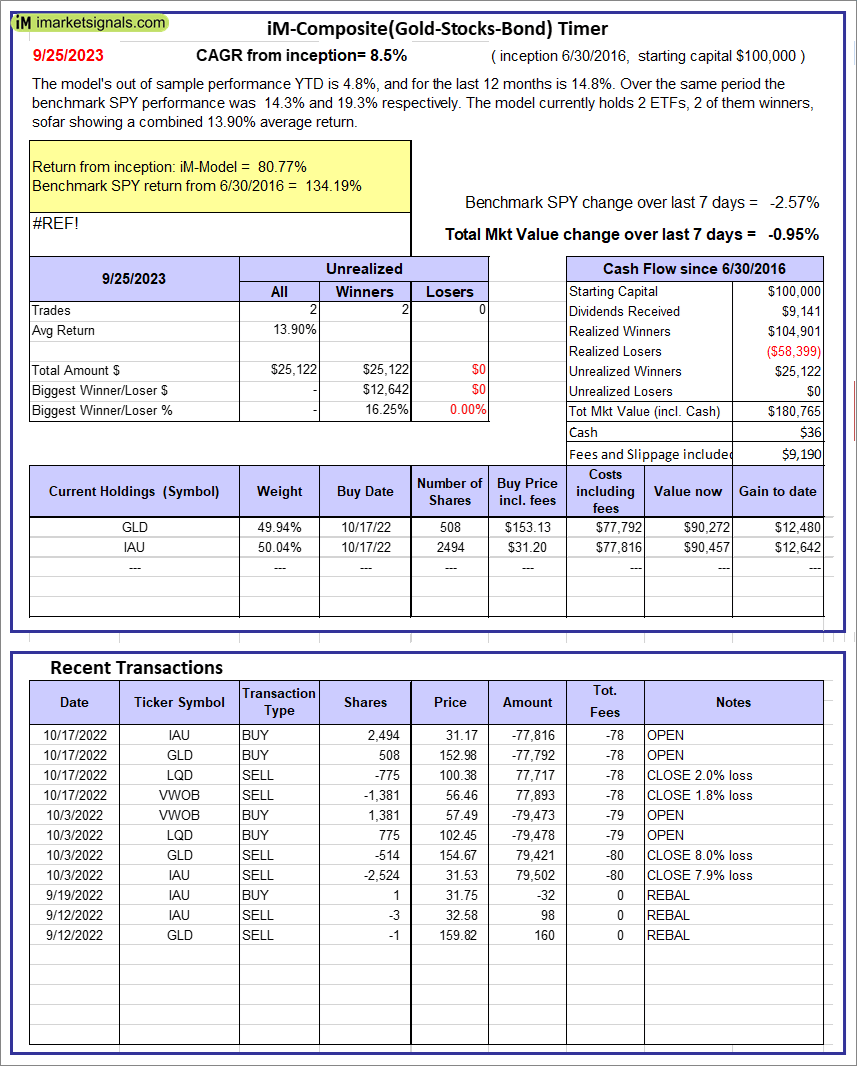 |
iM-Composite(Gold-Stocks-Bond) Timer: The model’s out of sample performance YTD is 4.8%, and for the last 12 months is 14.8%. Over the same period the benchmark SPY performance was 14.3% and 19.3% respectively. Over the previous week the market value of the iM-Composite(Gold-Stocks-Bond) Timer gained -0.95% at a time when SPY gained -2.57%. A starting capital of $100,000 at inception on 6/30/2016 would have grown to $180,765 which includes $36 cash and excludes $9,190 spent on fees and slippage. |
iM-Best Reports – 9/25/2023
Posted in pmp SPY-SH
Leave a Reply
You must be logged in to post a comment.