
  |
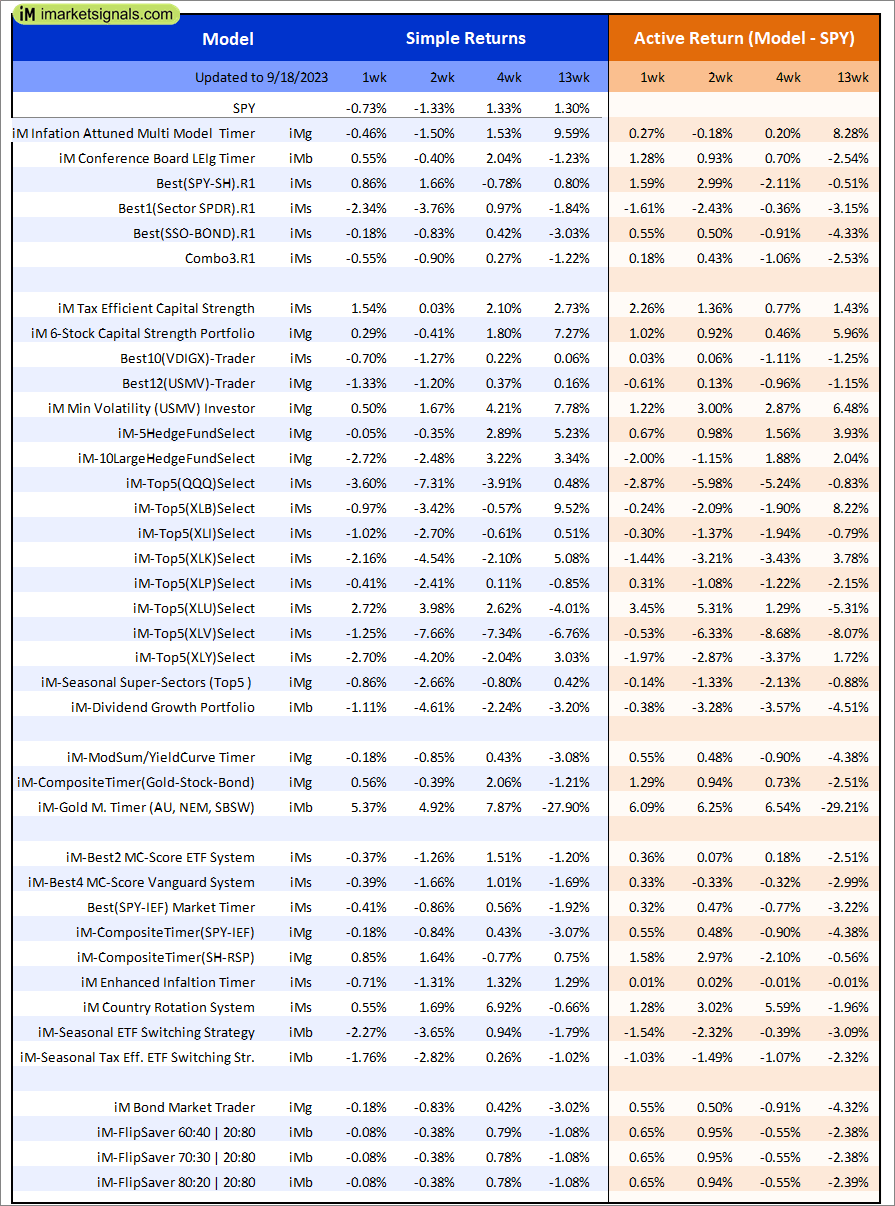
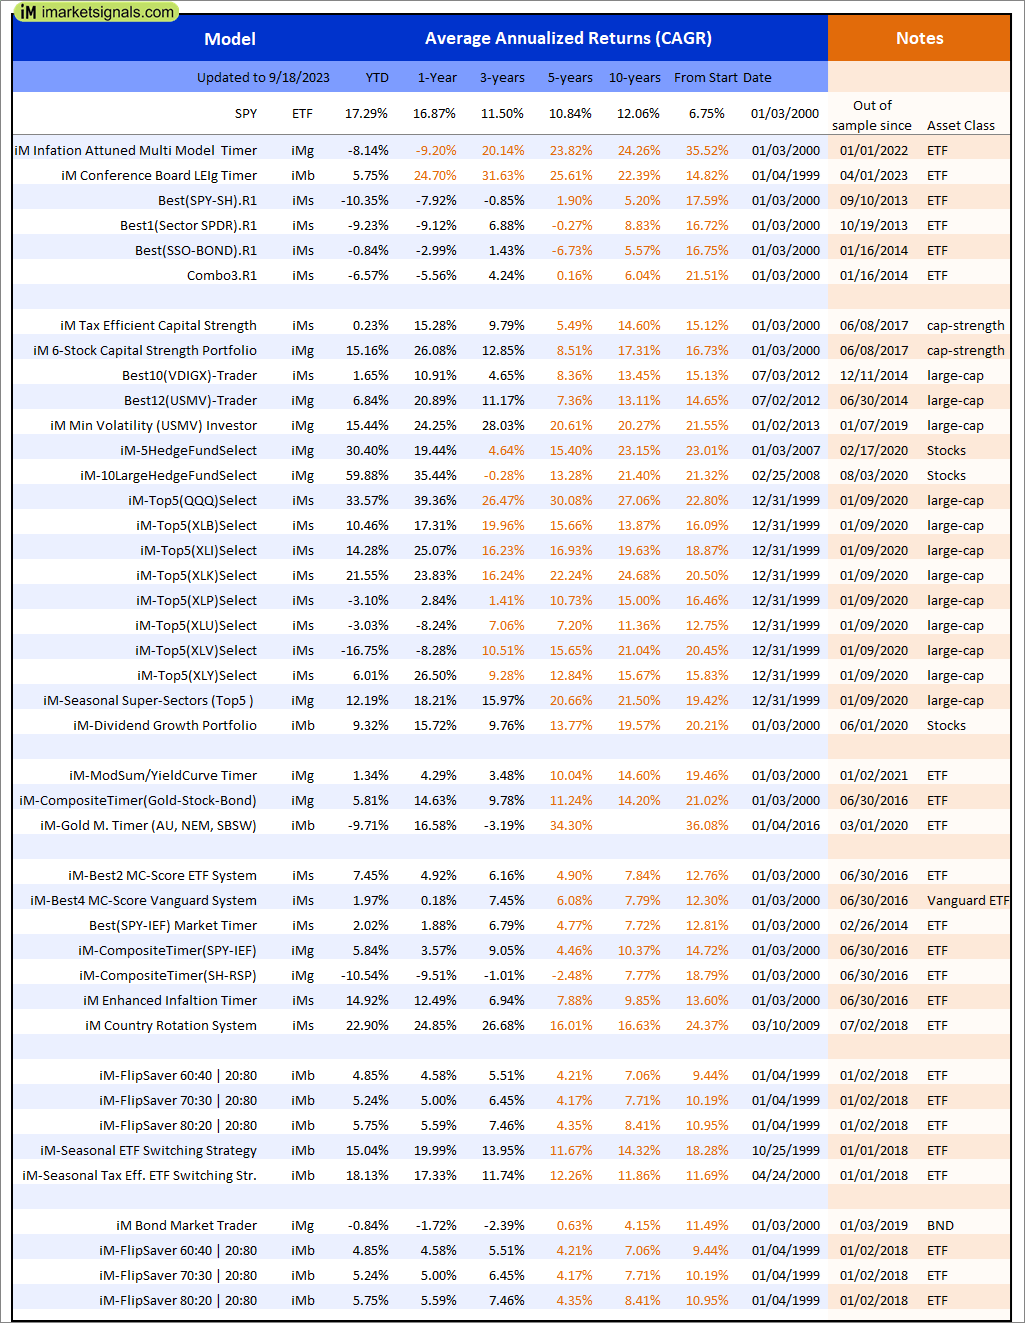
Out of sample performance summary of our models for the past 1, 2, 4 and 13 week periods. The active active return indicates how the models over- or underperformed the benchmark ETF SPY. Also the YTD, and the 1-, 3-, 5- and 10-year annualized returns are shown in the second table |
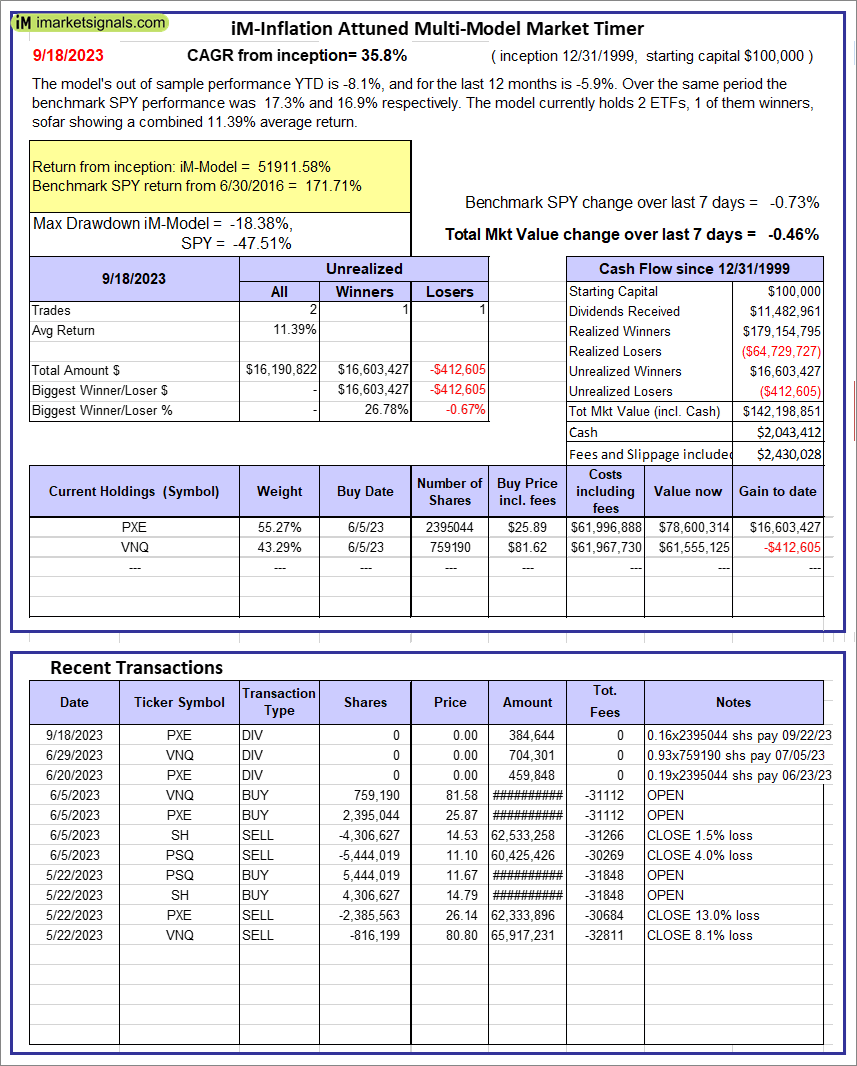 |
iM-Inflation Attuned Multi-Model Market Timer: The model’s out of sample performance YTD is -8.1%, and for the last 12 months is -5.9%. Over the same period the benchmark SPY performance was 17.3% and 16.9% respectively. Over the previous week the market value of the iM-Inflation Attuned Multi-Model Market Timer gained -0.46% at a time when SPY gained -0.73%. A starting capital of $100,000 at inception on 3/24/2017 would have grown to $142,198,851 which includes $2,043,412 cash and excludes $2,430,028 spent on fees and slippage. |
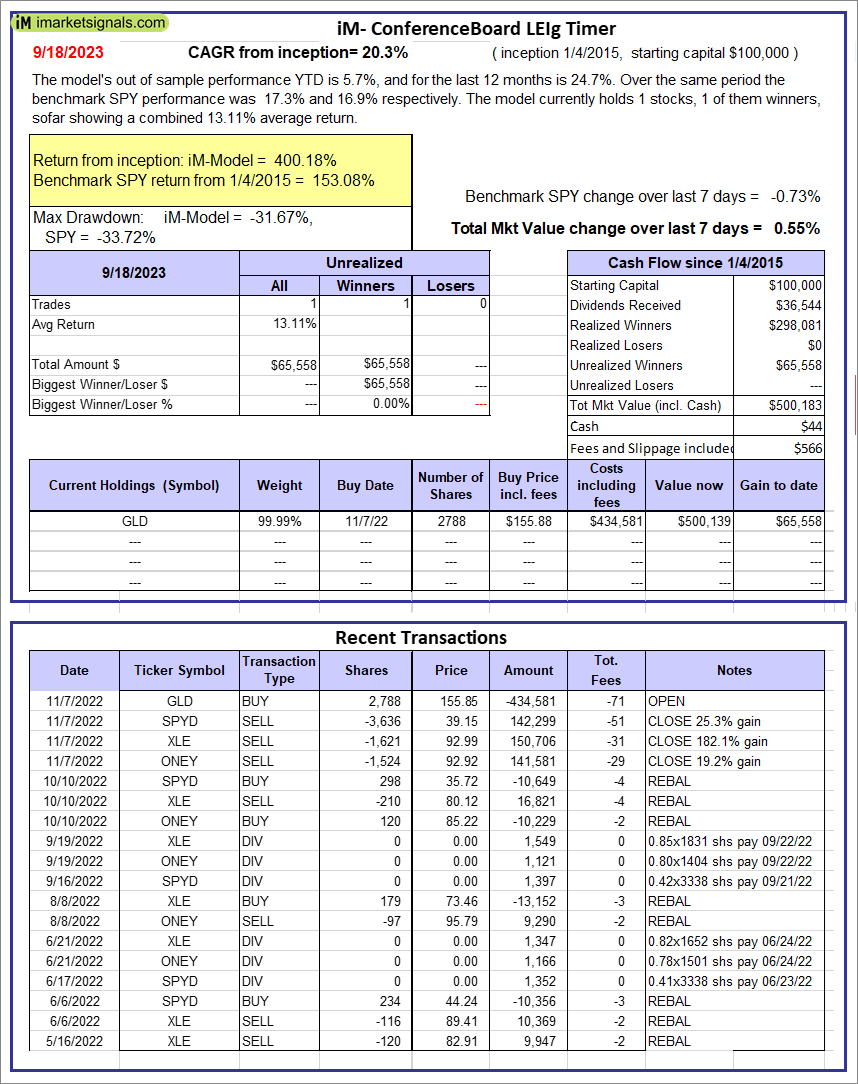 |
iM-Conference Board LEIg Timer: The model’s performance YTD is 14.3%, and for the last 12 months is 7.3%. Over the same period the benchmark SPY performance was 20.1% and 9.4% respectively. Over the previous week the market value of the iM-Conference Board LEIg Timer gained 0.55% at a time when SPY gained -0.73%. A starting capital of $100,000 at inception on 4/5/2017 would have grown to $500,183 which includes $44 cash and excludes $566 spent on fees and slippage. |
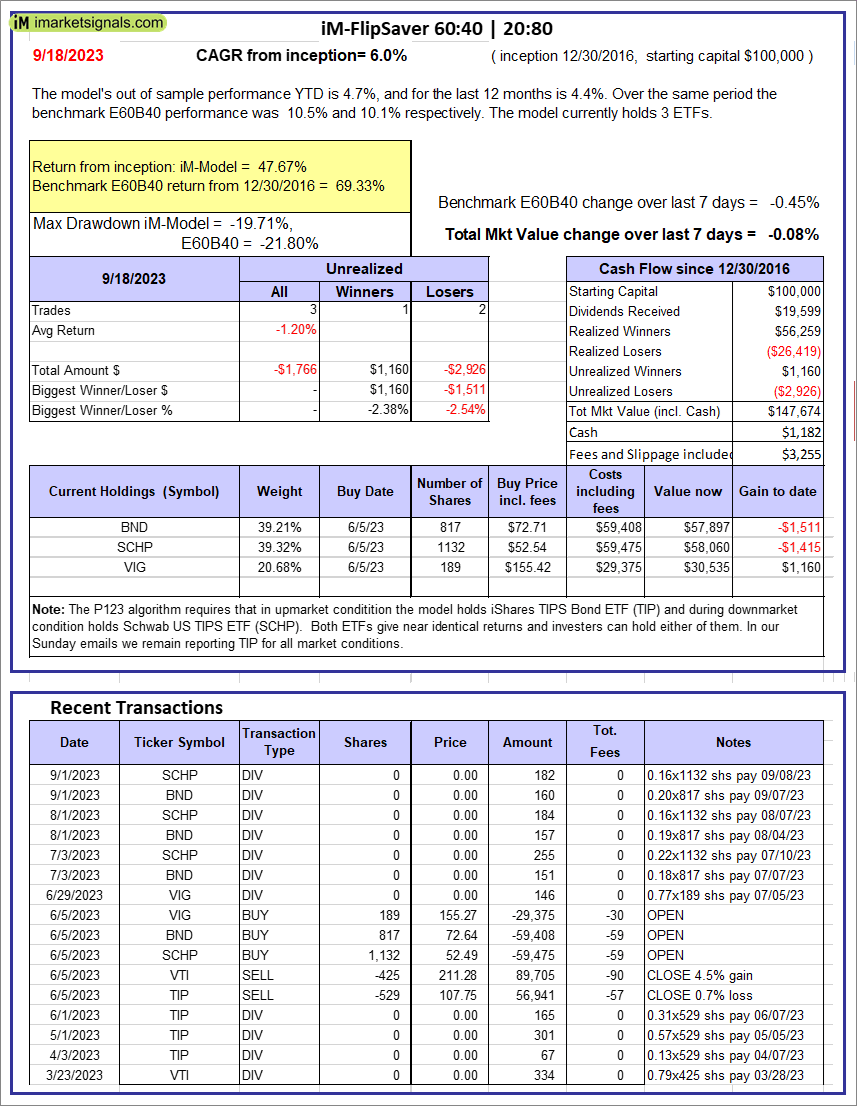 |
iM-FlipSaver 60:40 | 20:80 – 2017: The model’s out of sample performance YTD is 4.7%, and for the last 12 months is 4.4%. Over the same period the benchmark E60B40 performance was 10.5% and 10.1% respectively. Over the previous week the market value of iM-FlipSaver 80:20 | 20:80 gained -0.08% at a time when SPY gained -0.45%. A starting capital of $100,000 at inception on 7/16/2015 would have grown to $147,674 which includes $1,182 cash and excludes $3,255 spent on fees and slippage. |
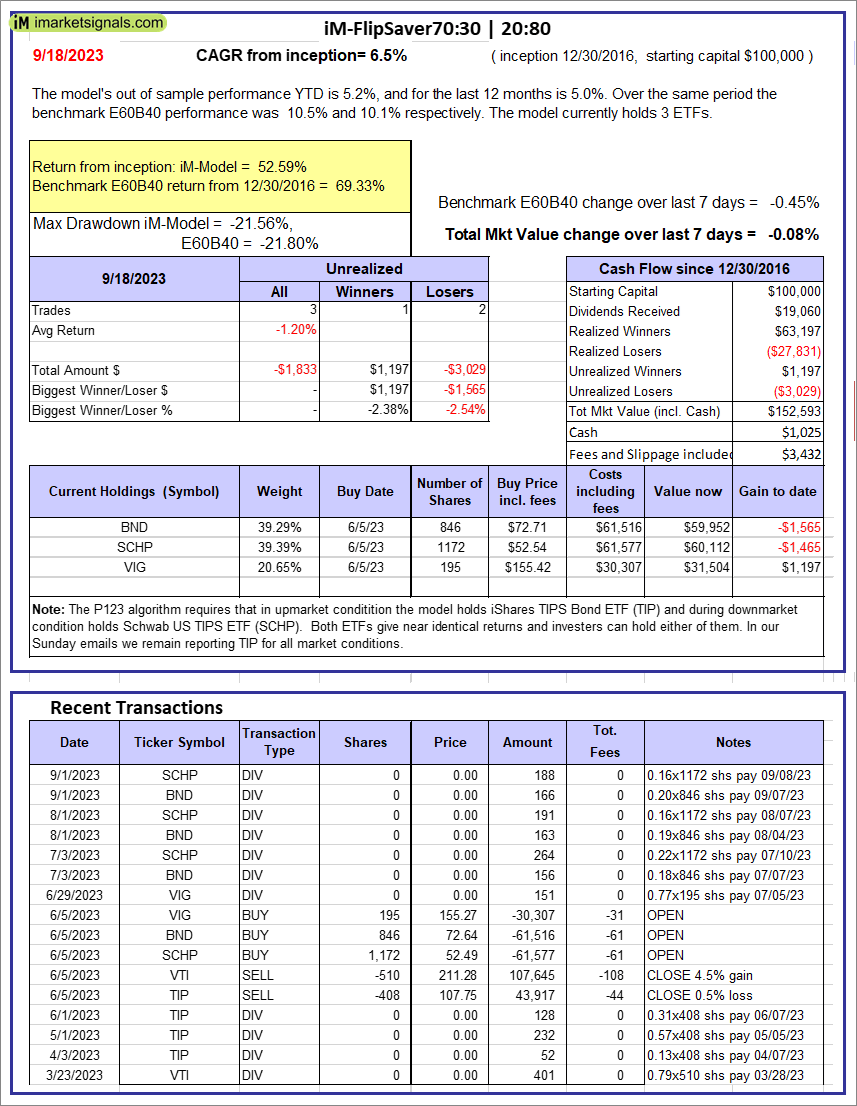 |
iM-FlipSaver 70:30 | 20:80 – 2017: The model’s out of sample performance YTD is 5.2%, and for the last 12 months is 5.0%. Over the same period the benchmark E60B40 performance was 10.5% and 10.1% respectively. Over the previous week the market value of iM-FlipSaver 70:30 | 20:80 gained -0.08% at a time when SPY gained -0.45%. A starting capital of $100,000 at inception on 7/15/2015 would have grown to $152,593 which includes $1,025 cash and excludes $3,432 spent on fees and slippage. |
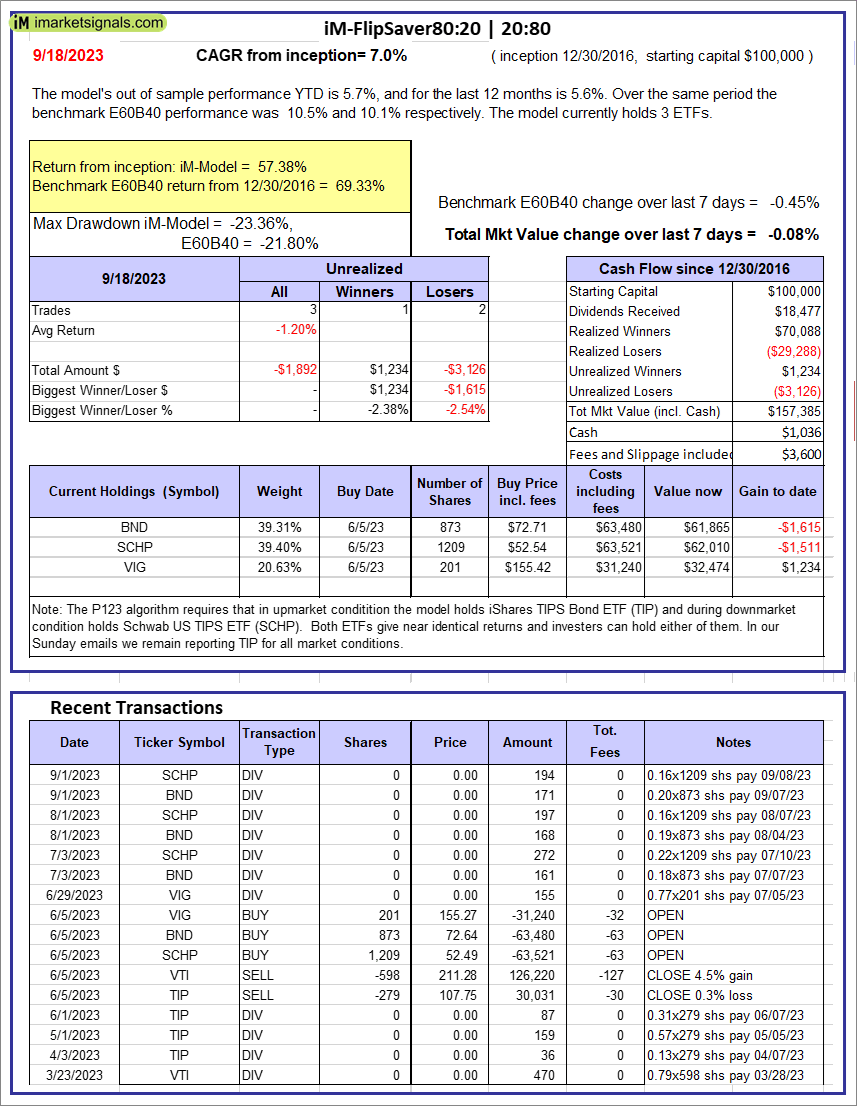 |
iM-FlipSaver 80:20 | 20:80 – 2017: The model’s out of sample performance YTD is 5.7%, and for the last 12 months is 5.6%. Over the same period the benchmark E60B40 performance was 10.5% and 10.1% respectively. Over the previous week the market value of iM-FlipSaver 80:20 | 20:80 gained -0.08% at a time when SPY gained -0.45%. A starting capital of $100,000 at inception on 1/2/2017 would have grown to $157,385 which includes $1,036 cash and excludes $3,600 spent on fees and slippage. |
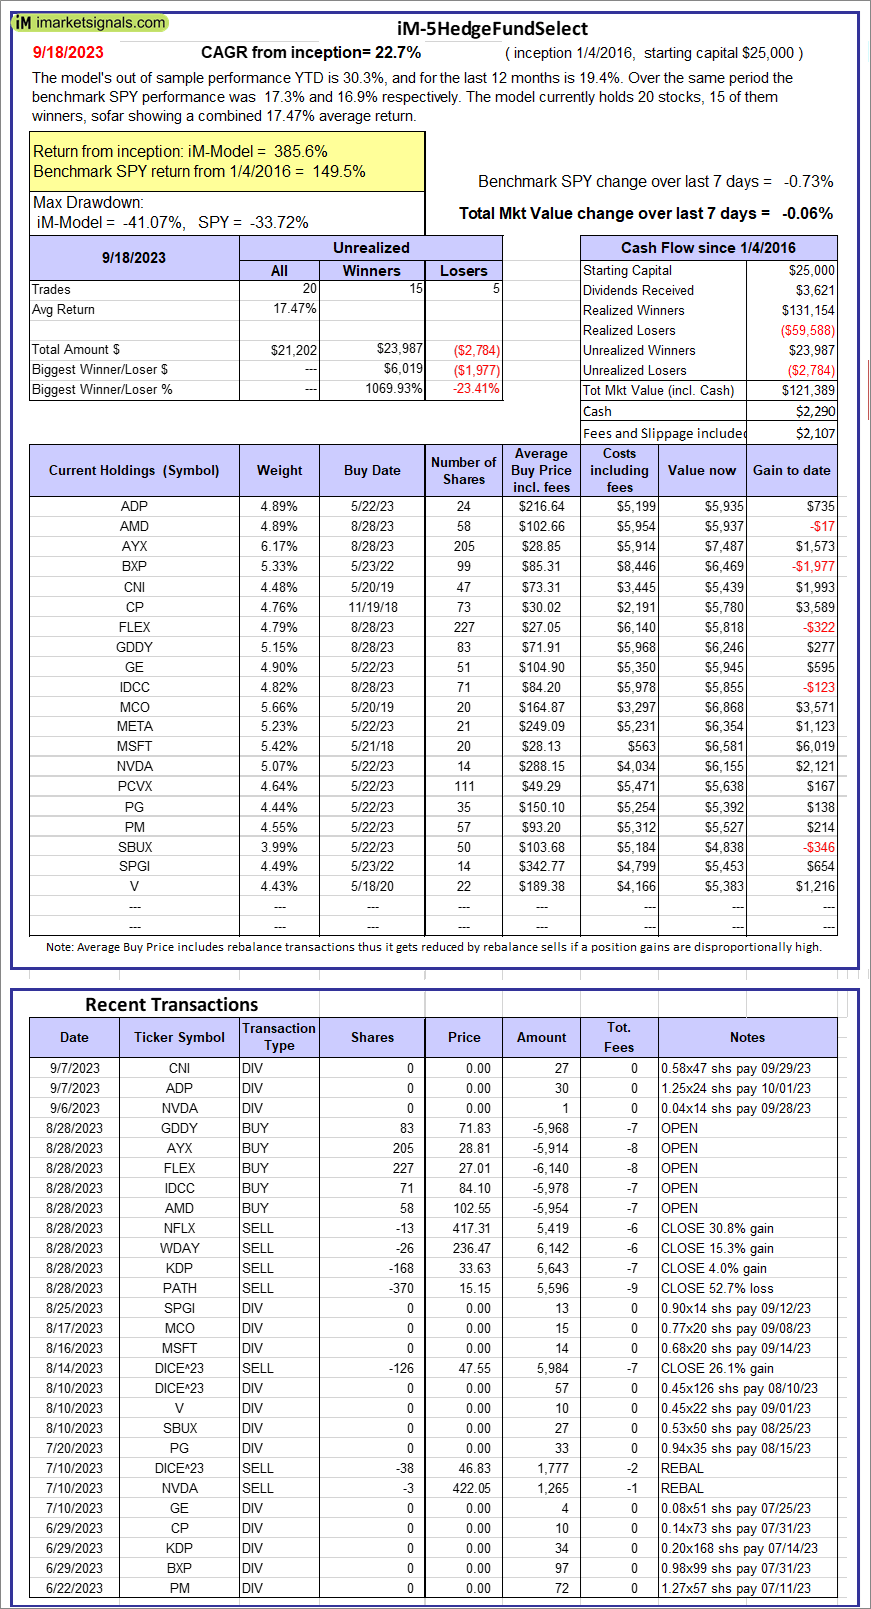 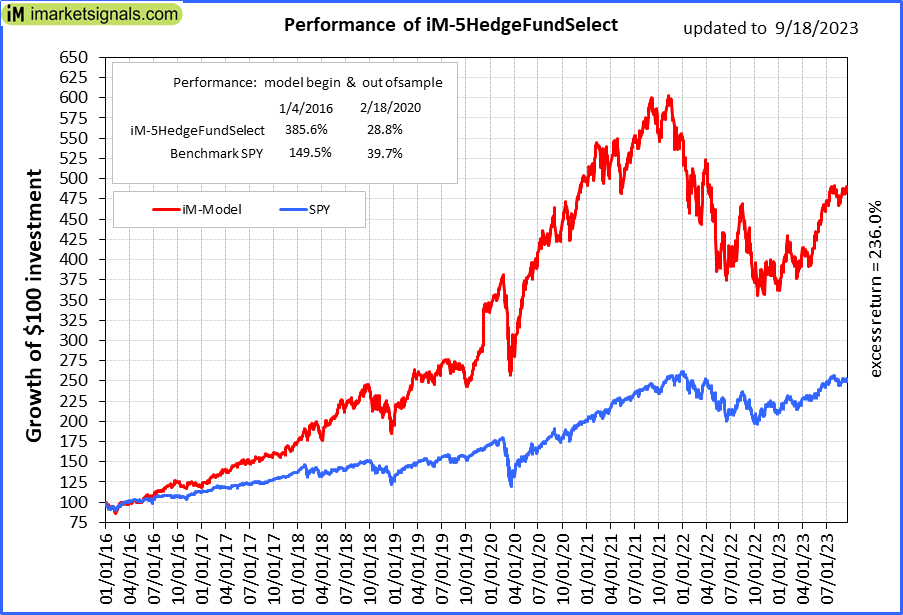 |
iM-5HedgeFundSelect: Since inception, on 1/5/2016, the model gained 385.56% while the benchmark SPY gained 149.54% over the same period. Over the previous week the market value of iM-5HedgeFundSelect gained -0.06% at a time when SPY gained -0.73%. A starting capital of $25,000 at inception on 1/5/2016 would have grown to $121,389 which includes $2,290 cash and excludes $2,107 spent on fees and slippage. |
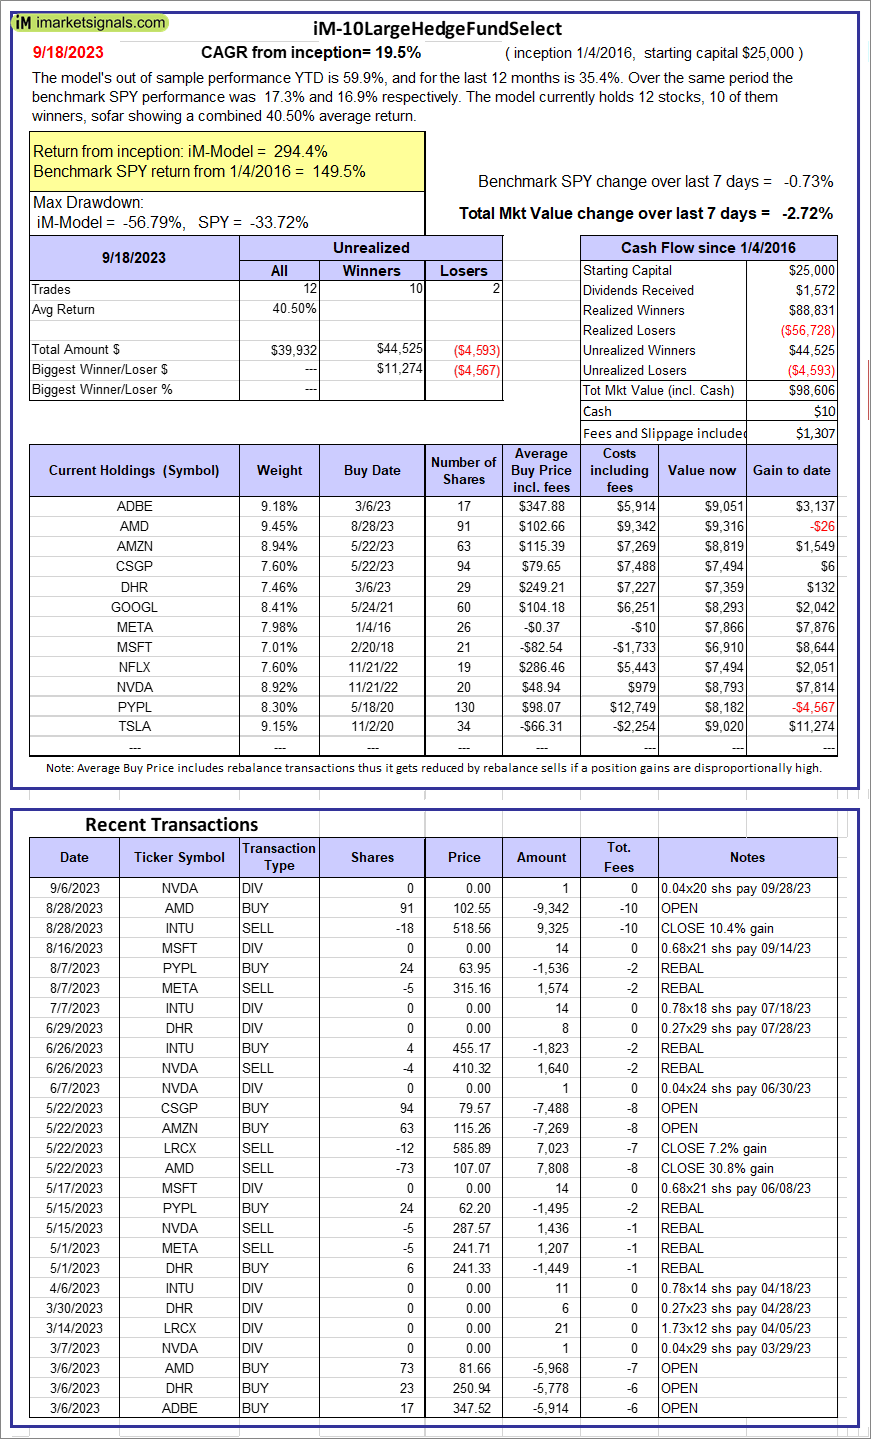 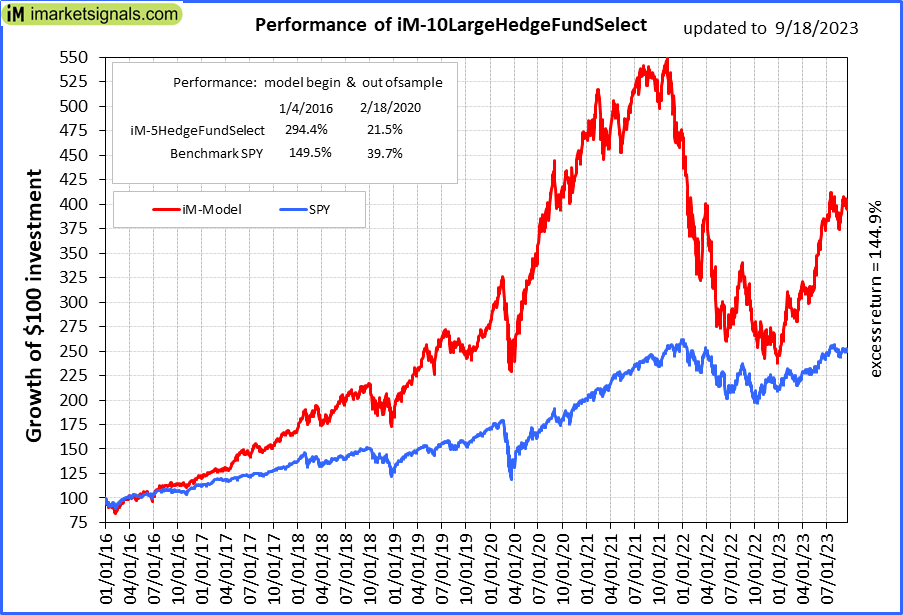 |
iM-10LargeHedgeFundSelect: Since inception, on 1/5/2016, the model gained 294.42% while the benchmark SPY gained 149.54% over the same period. Over the previous week the market value of iM-10LargeHedgeFundSelect gained -2.72% at a time when SPY gained -0.73%. A starting capital of $25,000 at inception on 1/5/2016 would have grown to $98,606 which includes $10 cash and excludes $1,307 spent on fees and slippage. |
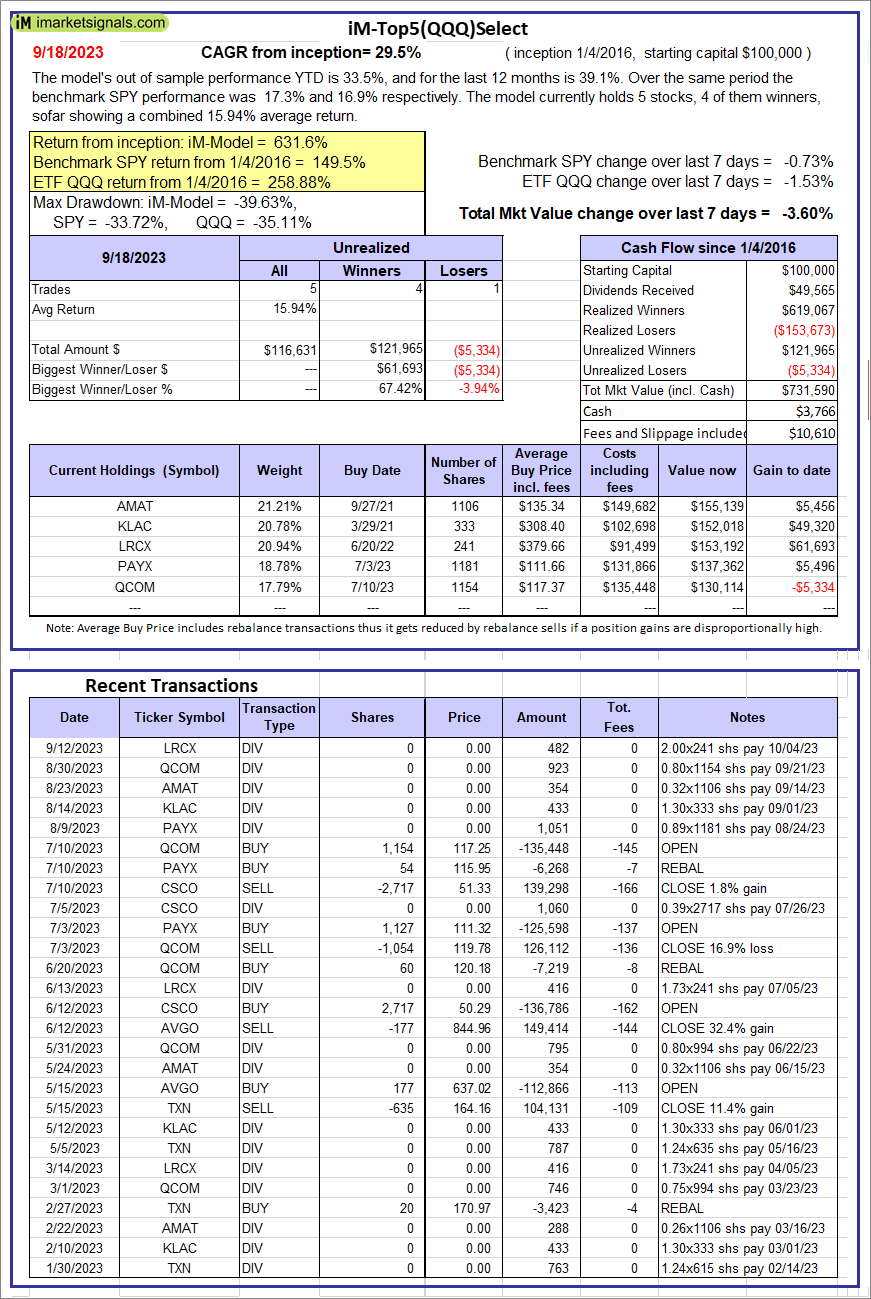 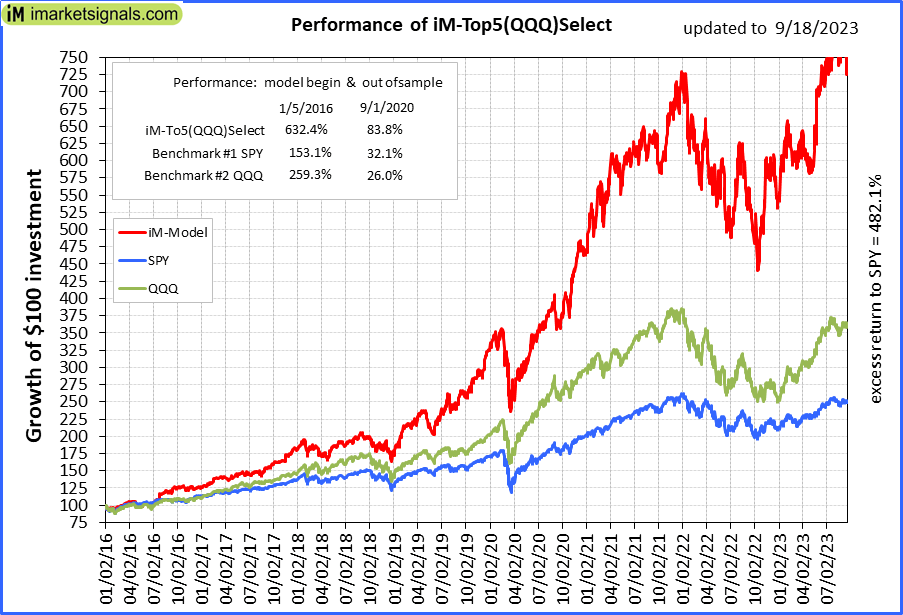 |
iM-Top5(QQQ)Select: Since inception, on 1/5/2016, the model gained 631.59% while the benchmark SPY gained 149.54% over the same period. Over the previous week the market value of iM-Top5(QQQ)Select gained -3.60% at a time when SPY gained -0.73%. A starting capital of $100,000 at inception on 1/5/2016 would have grown to $731,590 which includes $3,766 cash and excludes $10,610 spent on fees and slippage. |
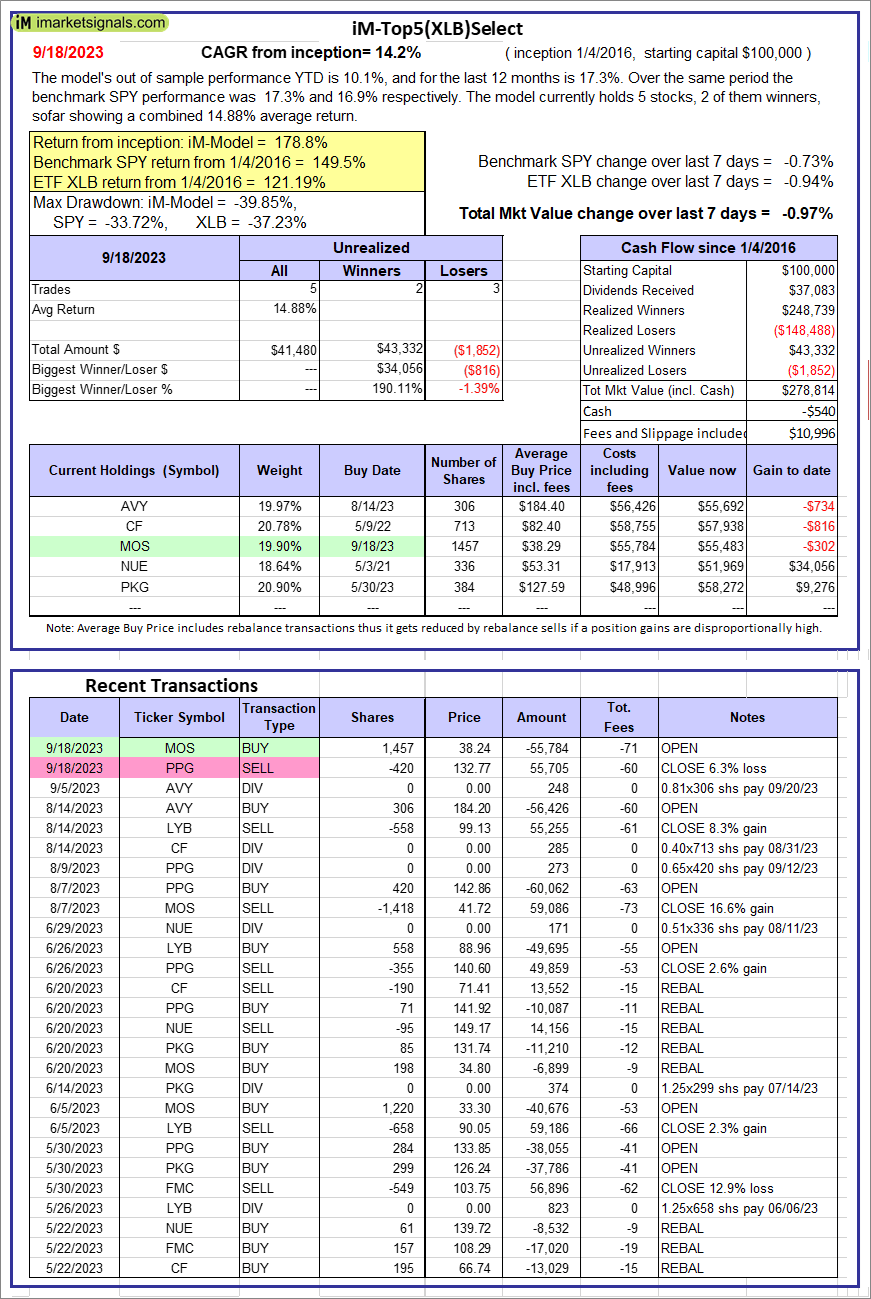 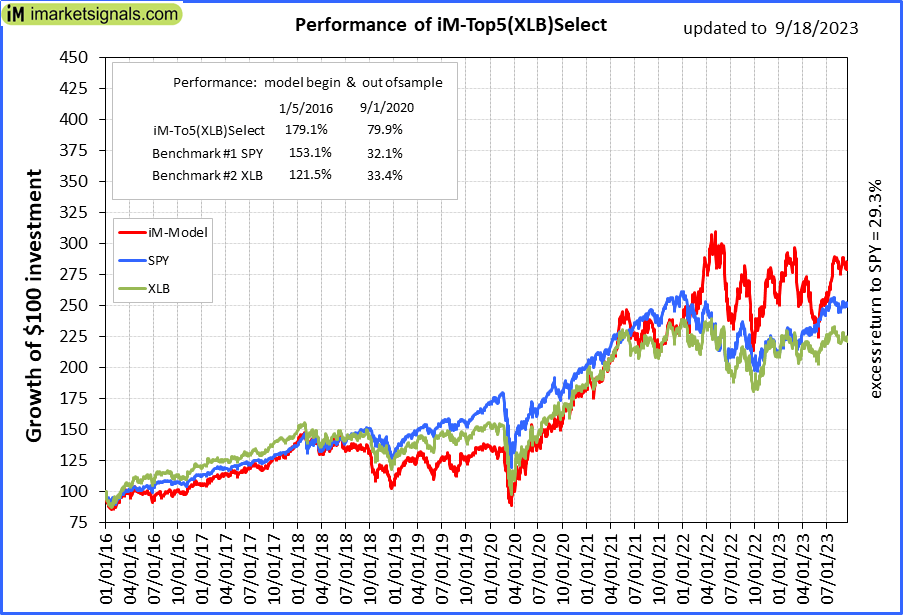 |
iM-Top5(XLB)Select: Since inception, on 1/5/2016, the model gained 178.81% while the benchmark SPY gained 149.54% over the same period. Over the previous week the market value of iM-Top5(XLB)Select gained -0.97% at a time when SPY gained -0.73%. A starting capital of $100,000 at inception on 1/5/2016 would have grown to $278,814 which includes -$540 cash and excludes $10,996 spent on fees and slippage. |
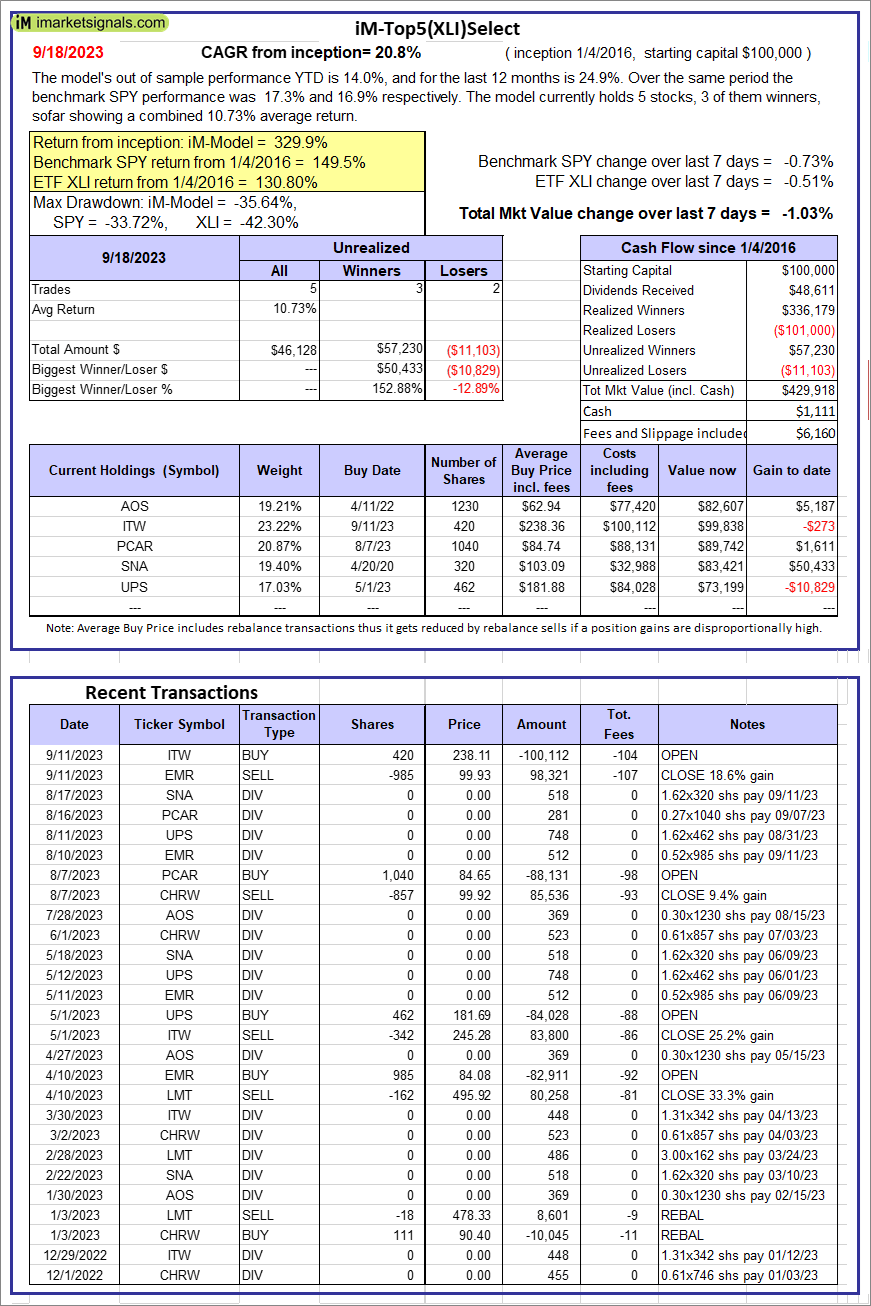 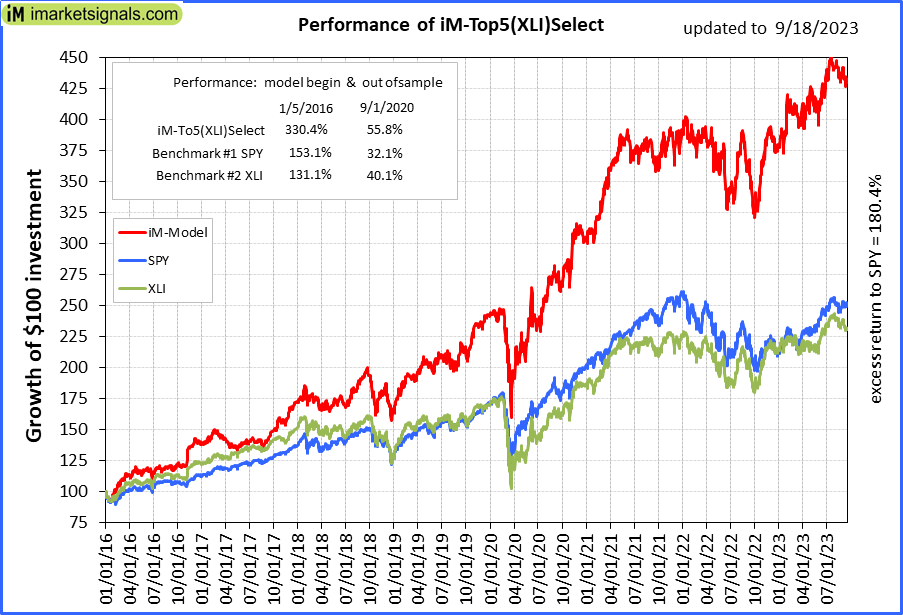 |
iM-Top5(XLI)Select: Since inception, on 1/5/2016, the model gained 329.92% while the benchmark SPY gained 149.54% over the same period. Over the previous week the market value of iM-Top5(XLI)Select gained -1.03% at a time when SPY gained -0.73%. A starting capital of $100,000 at inception on 1/5/2016 would have grown to $429,918 which includes $1,111 cash and excludes $6,160 spent on fees and slippage. |
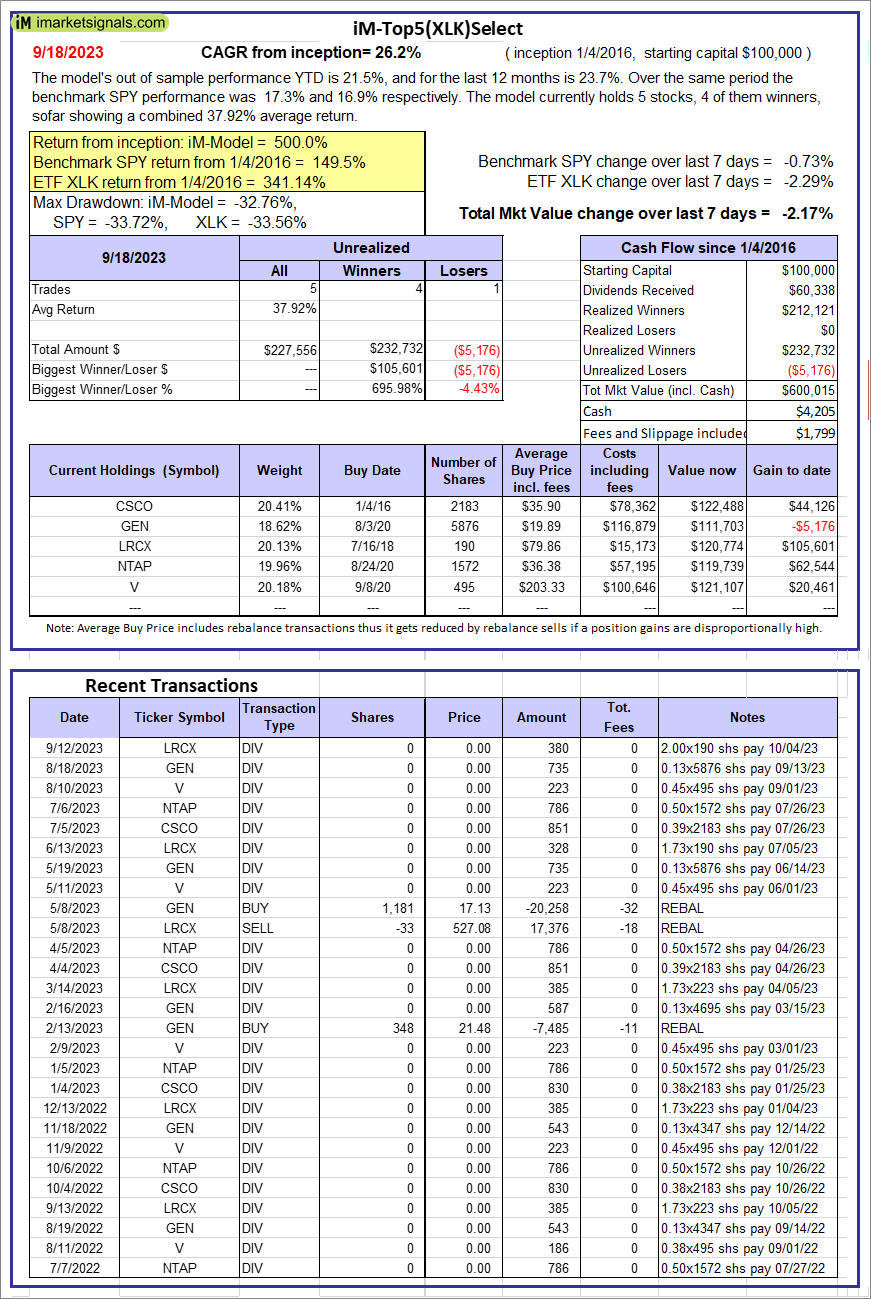 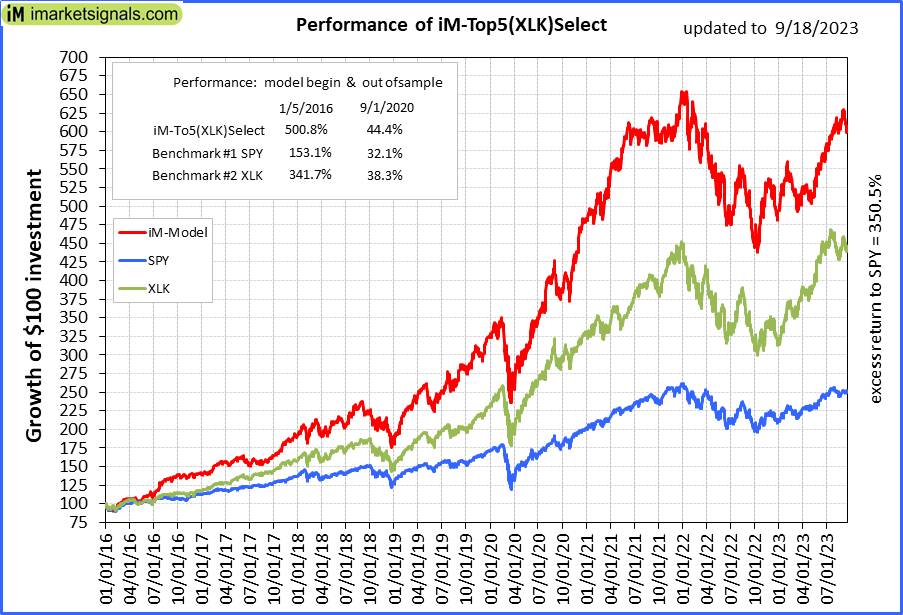 |
iM-Top5(XLK)Select: Since inception, on 1/5/2016, the model gained 500.02% while the benchmark SPY gained 149.54% over the same period. Over the previous week the market value of iM-Top5(XLK)Select gained -2.17% at a time when SPY gained -0.73%. A starting capital of $100,000 at inception on 1/5/2016 would have grown to $600,015 which includes $4,205 cash and excludes $1,799 spent on fees and slippage. |
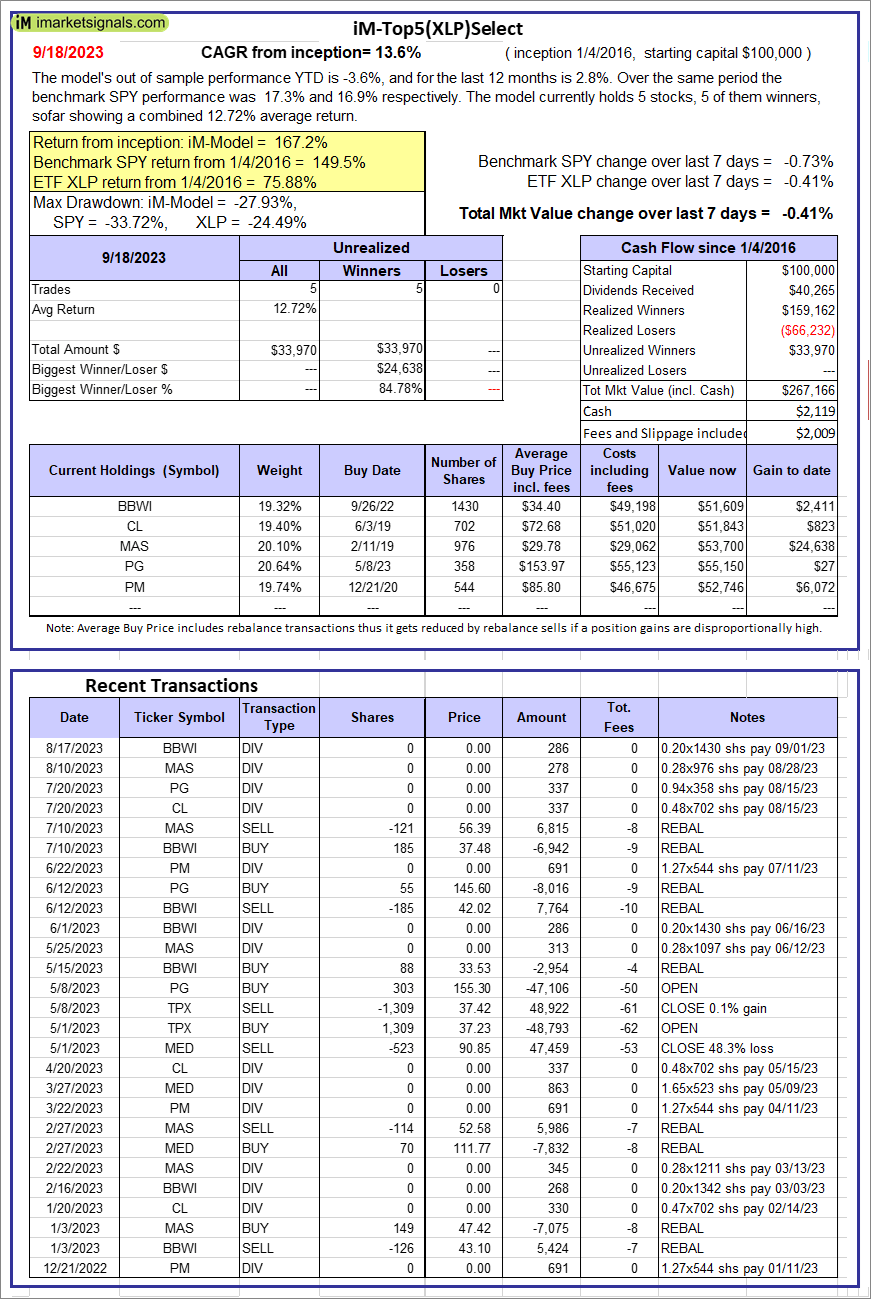 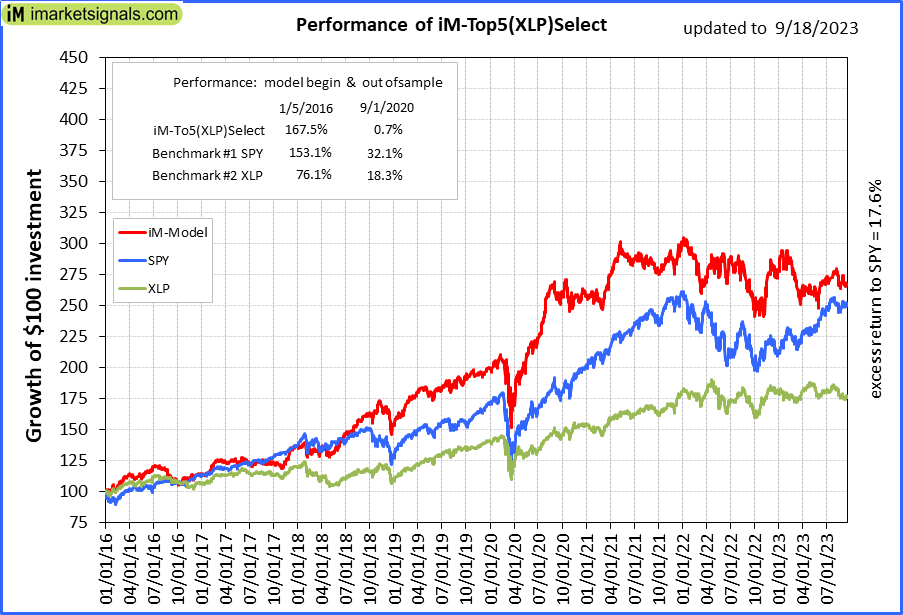 |
iM-Top5(XLP)Select: Since inception, on 1/5/2016, the model gained 167.17% while the benchmark SPY gained 149.54% over the same period. Over the previous week the market value of iM-Top5(XLP)Select gained -0.41% at a time when SPY gained -0.73%. A starting capital of $100,000 at inception on 1/5/2016 would have grown to $267,166 which includes $2,119 cash and excludes $2,009 spent on fees and slippage. |
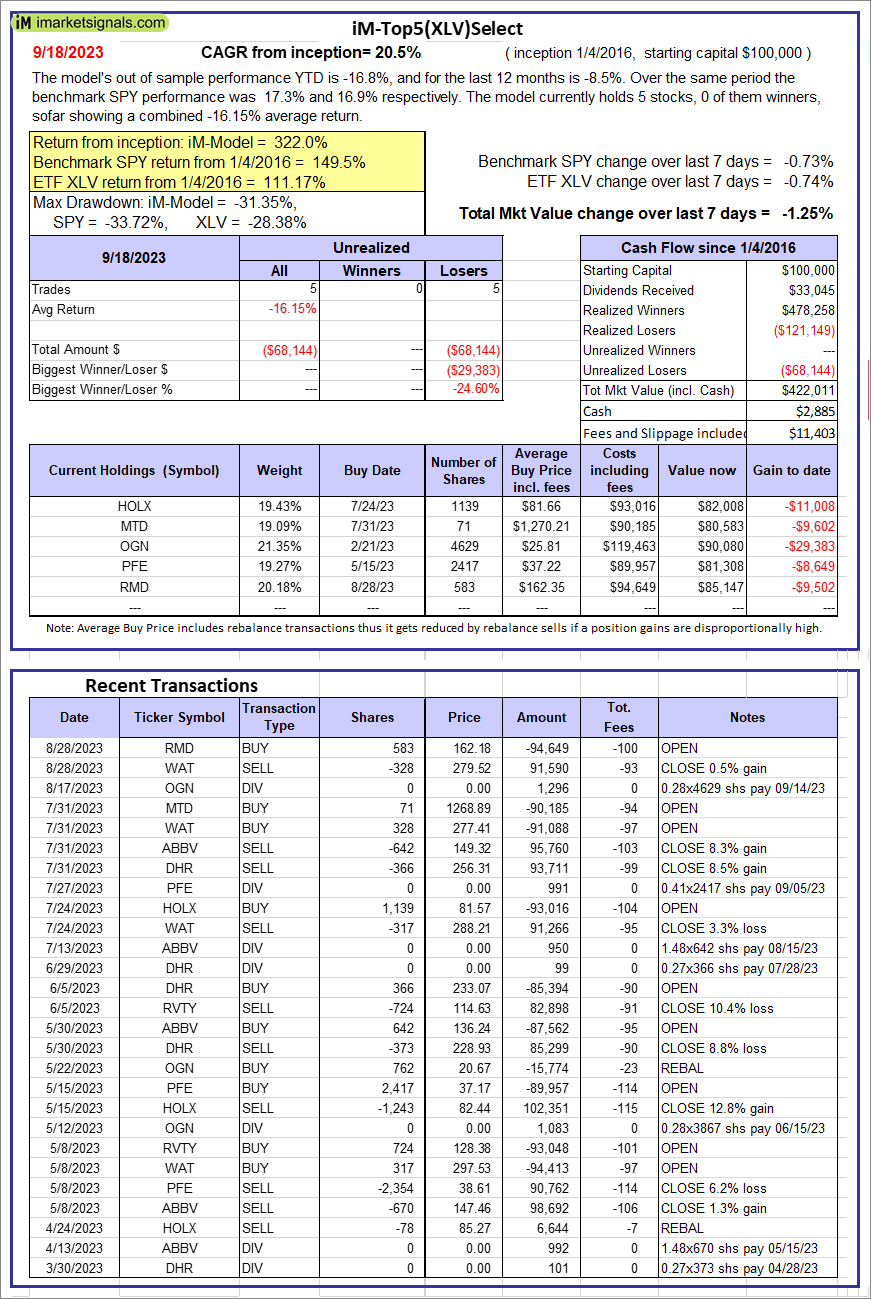 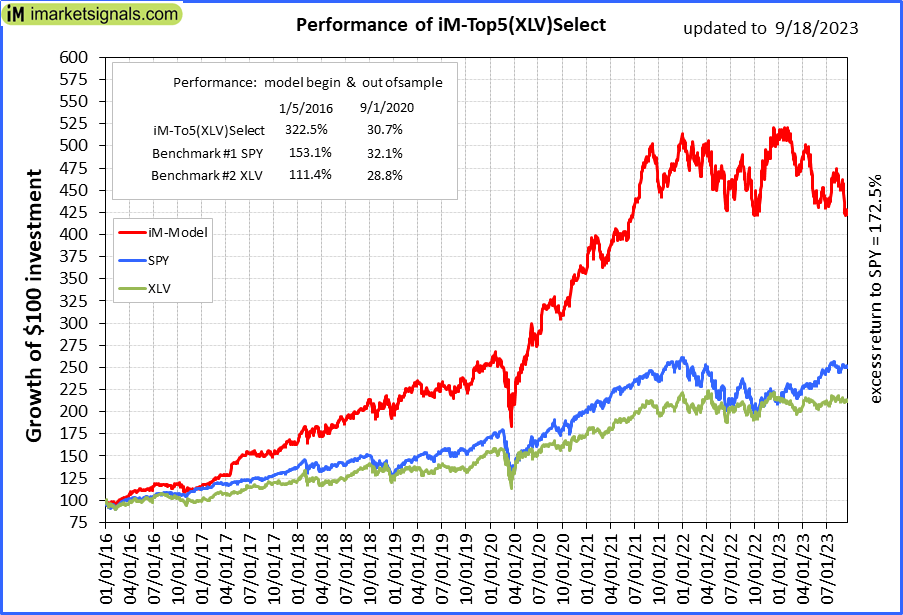 |
iM-Top5(XLV)Select: Since inception, on 1/5/2016, the model gained 322.01% while the benchmark SPY gained 149.54% over the same period. Over the previous week the market value of iM-Top5(XLV)Select gained -1.25% at a time when SPY gained -0.73%. A starting capital of $100,000 at inception on 1/5/2016 would have grown to $422,011 which includes $2,885 cash and excludes $11,403 spent on fees and slippage. |
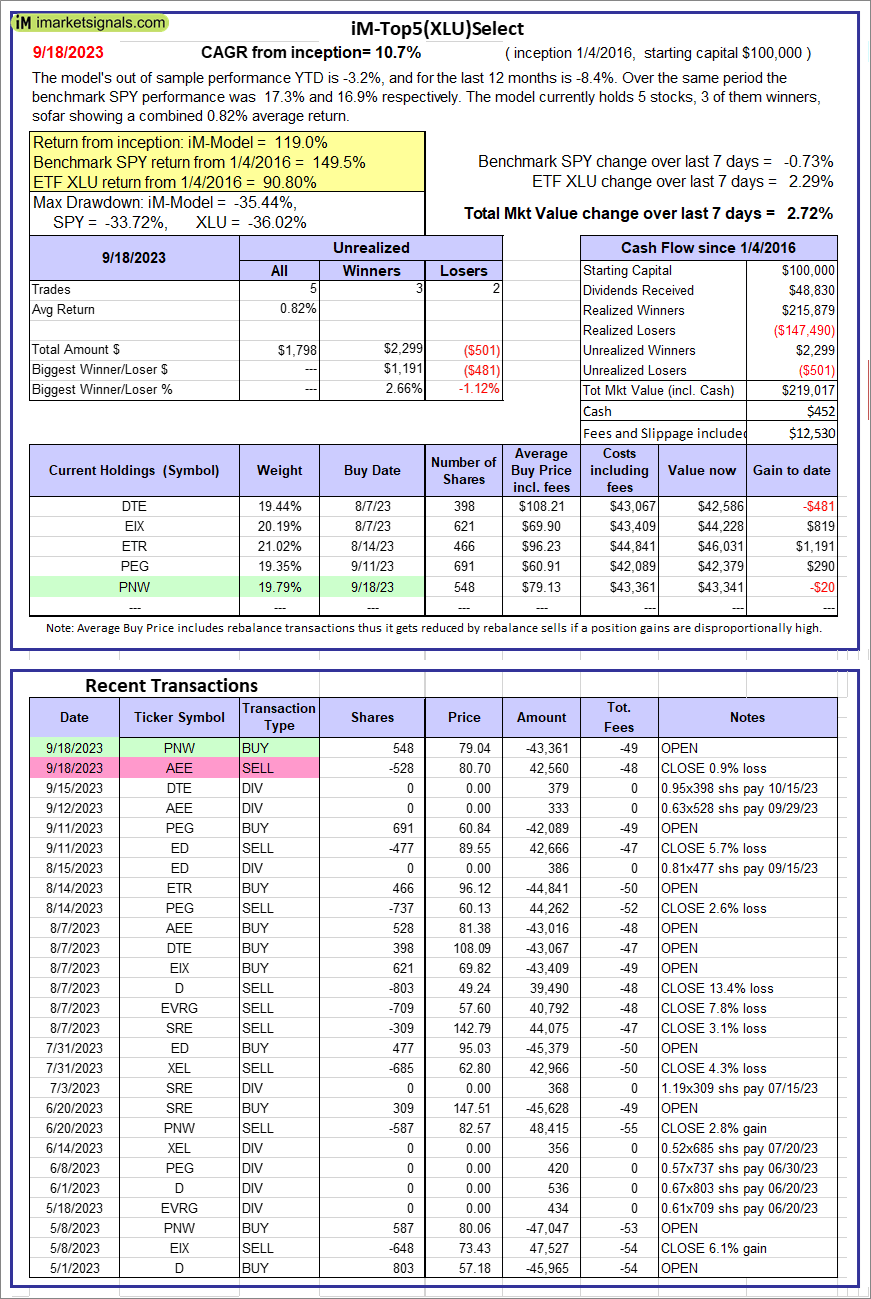 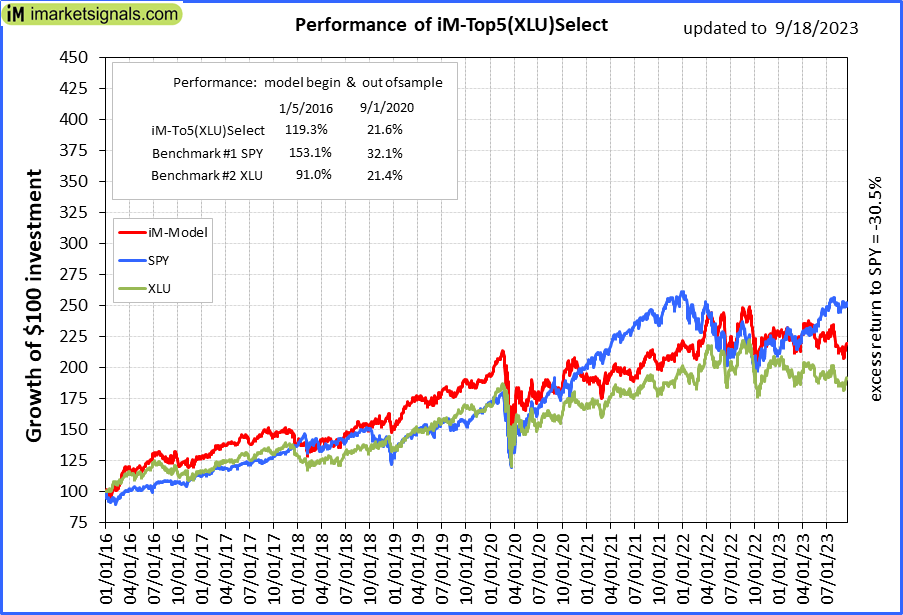 |
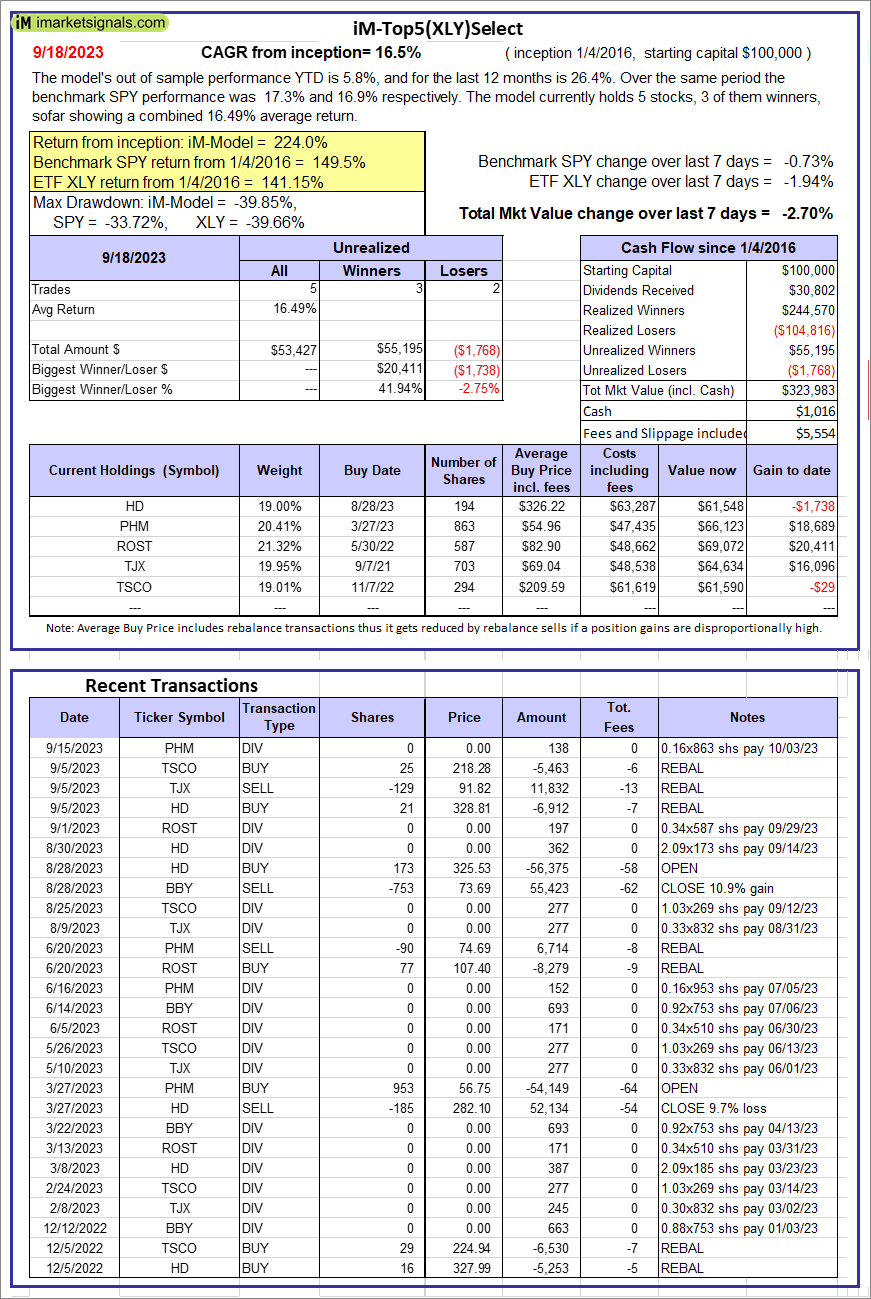
iM-Top5(XLU)Select: Since inception, on 1/5/2016, the model gained 119.02% while the benchmark SPY gained 149.54% over the same period. Over the previous week the market value of iM-Top5(XLU)Select gained 2.72% at a time when SPY gained -0.73%. A starting capital of $100,000 at inception on 1/5/2016 would have grown to $219,017 which includes $452 cash and excludes $12,530 spent on fees and slippage. |
 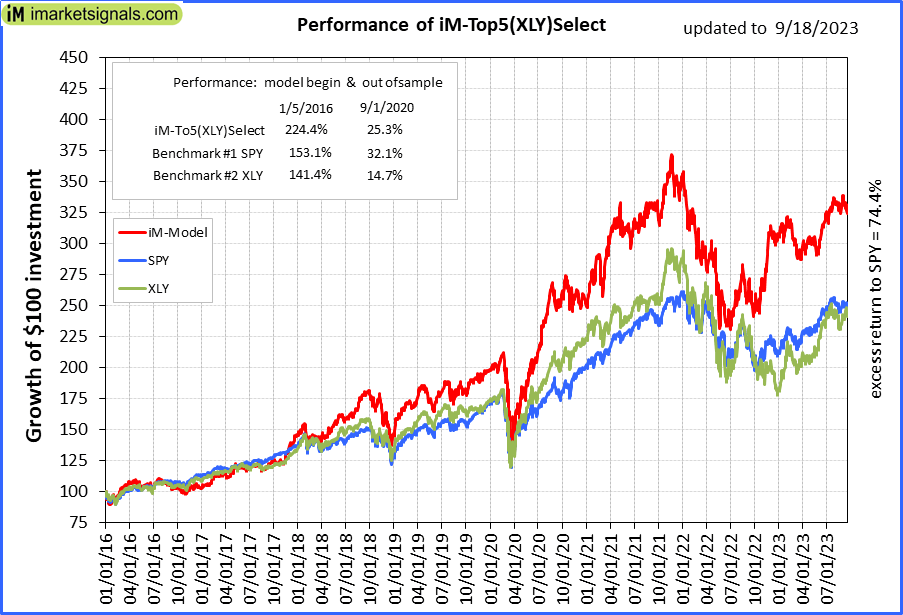 |
iM-Top5(XLY)Select: Since inception, on 1/5/2016, the model gained 223.98% while the benchmark SPY gained 149.54% over the same period. Over the previous week the market value of iM-Top5(XLY)Select gained -2.70% at a time when SPY gained -0.73%. A starting capital of $100,000 at inception on 1/5/2016 would have grown to $323,983 which includes $1,016 cash and excludes $5,554 spent on fees and slippage. |
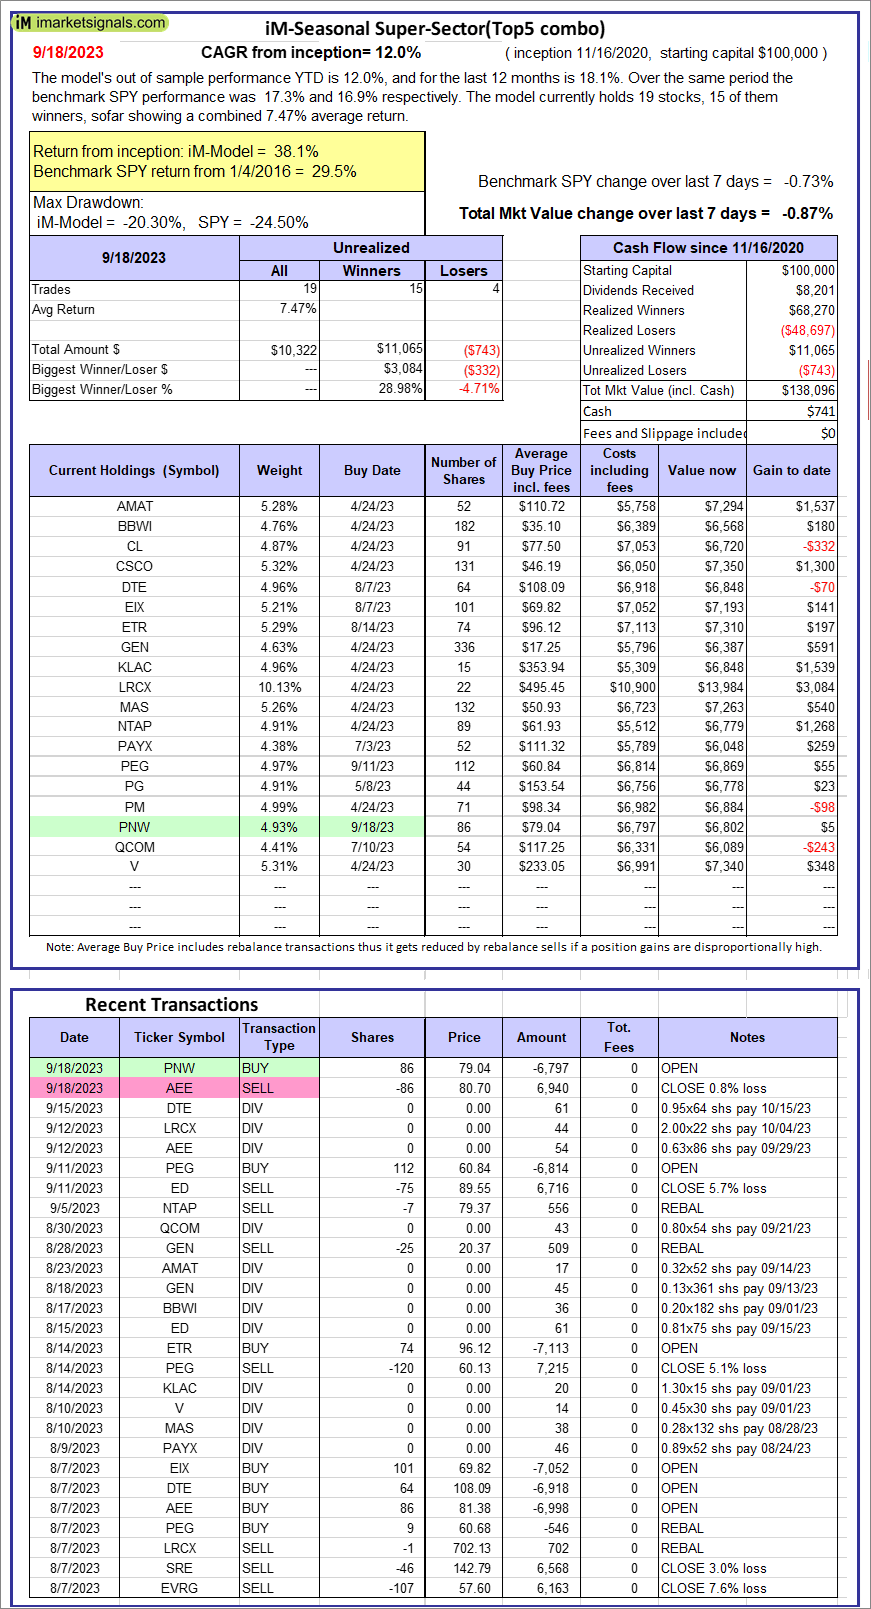 |
iM-Seasonal Super-Sectors (Top5 combo) : Since inception, on 11/17/2020, the model gained 38.10% while the benchmark SPY gained 29.54% over the same period. Over the previous week the market value of iM-Seasonal Super-Sectors (Top5 combo) gained -0.87% at a time when SPY gained -0.73%. A starting capital of $100,000 at inception on 11/17/2020 would have grown to $138,096 which includes $741 cash and excludes $00 spent on fees and slippage. |
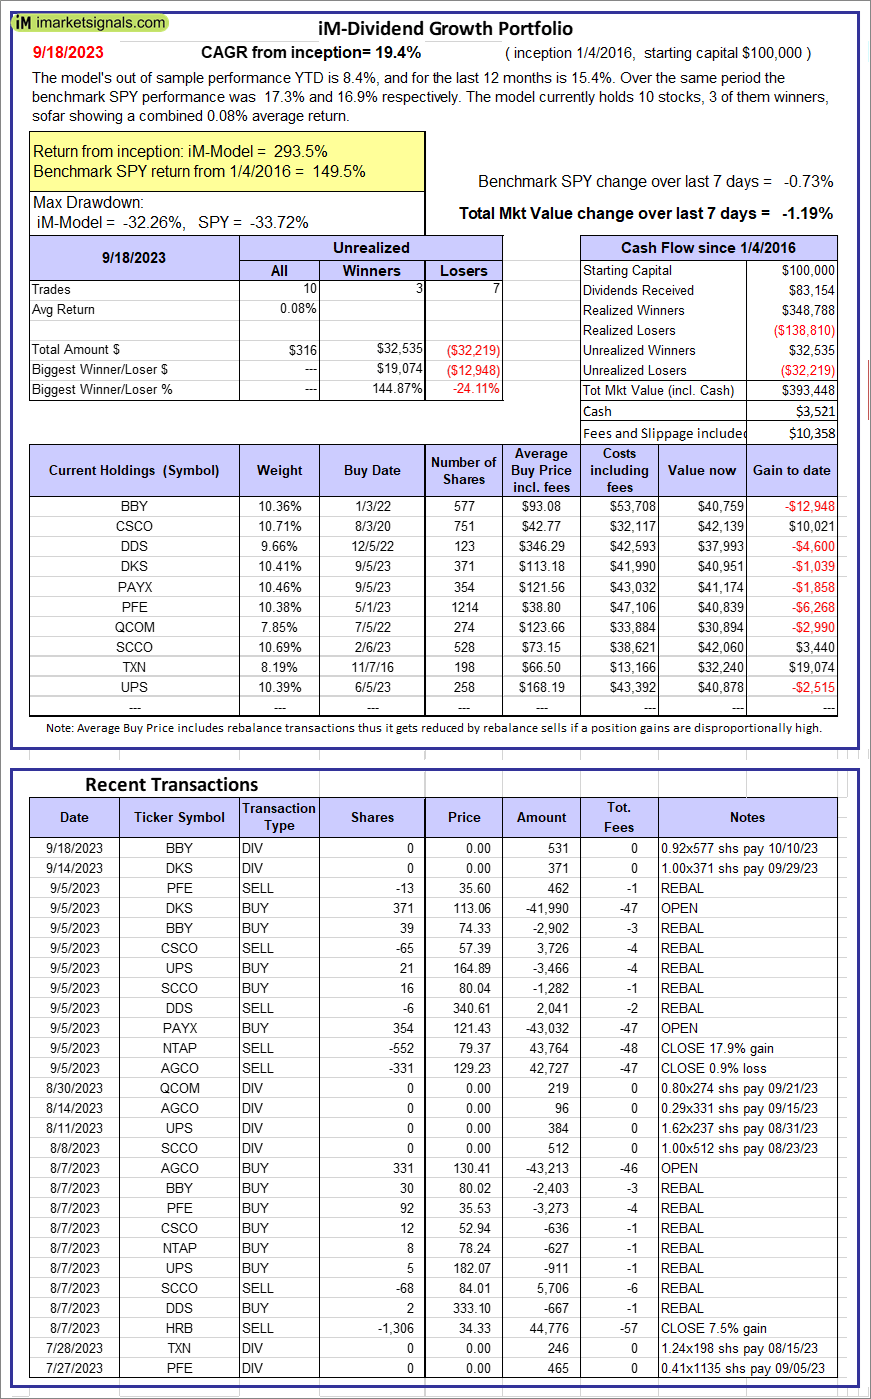 |
iM-Dividend Growth Portfolio: The model’s out of sample performance YTD is 8.4%, and for the last 12 months is 15.4%. Over the same period the benchmark SPY performance was 17.3% and 16.9% respectively. Over the previous week the market value of the iM-Dividend Growth Portfolio gained -1.19% at a time when SPY gained -0.73%. A starting capital of $100,000 at inception on 6/30/2016 would have grown to $393,448 which includes $3,521 cash and excludes $10,358 spent on fees and slippage. |
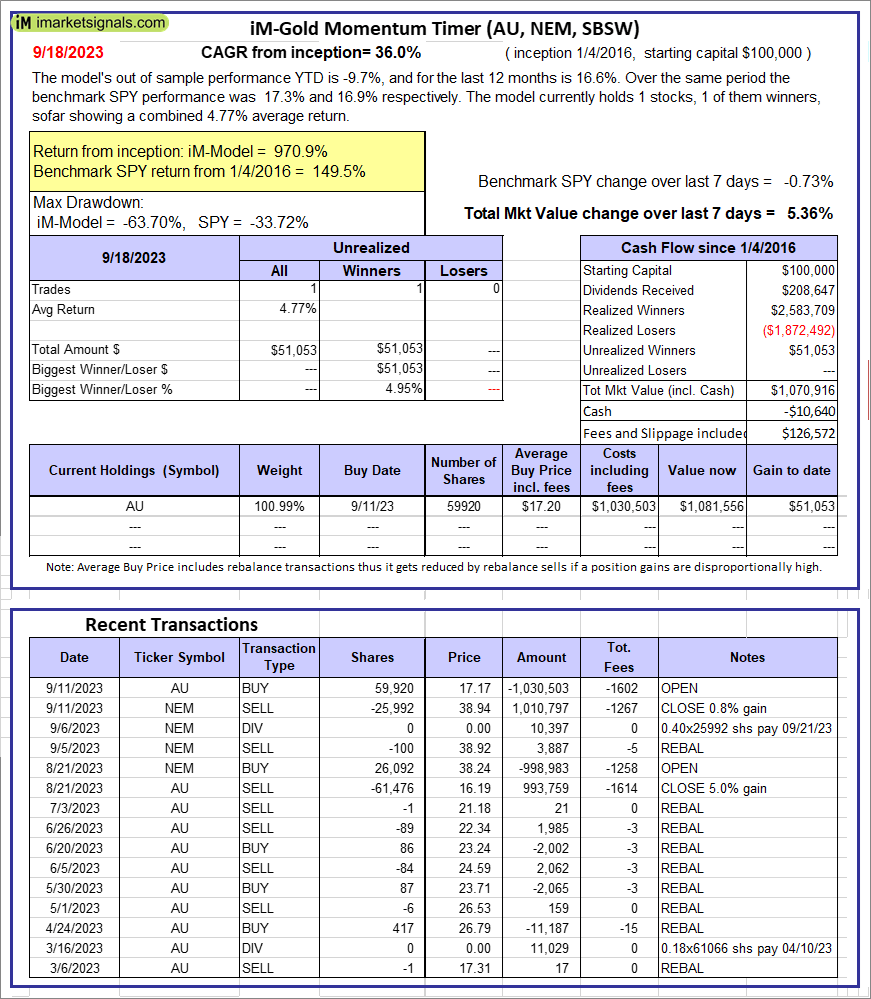 |
iM-Gold Momentum Timer (AU, NEM, SBSW): The model’s out of sample performance YTD is -9.7%, and for the last 12 months is 16.6%. Over the same period the benchmark SPY performance was 17.3% and 16.9% respectively. Over the previous week the market value of iM-Gold Momentum Timer (AU, NEM, SBSW) gained 5.36% at a time when SPY gained -0.73%. A starting capital of $100,000 at inception on 6/30/2016 would have grown to -$10,640 which includes $126,572 cash and excludes Gain to date spent on fees and slippage. |
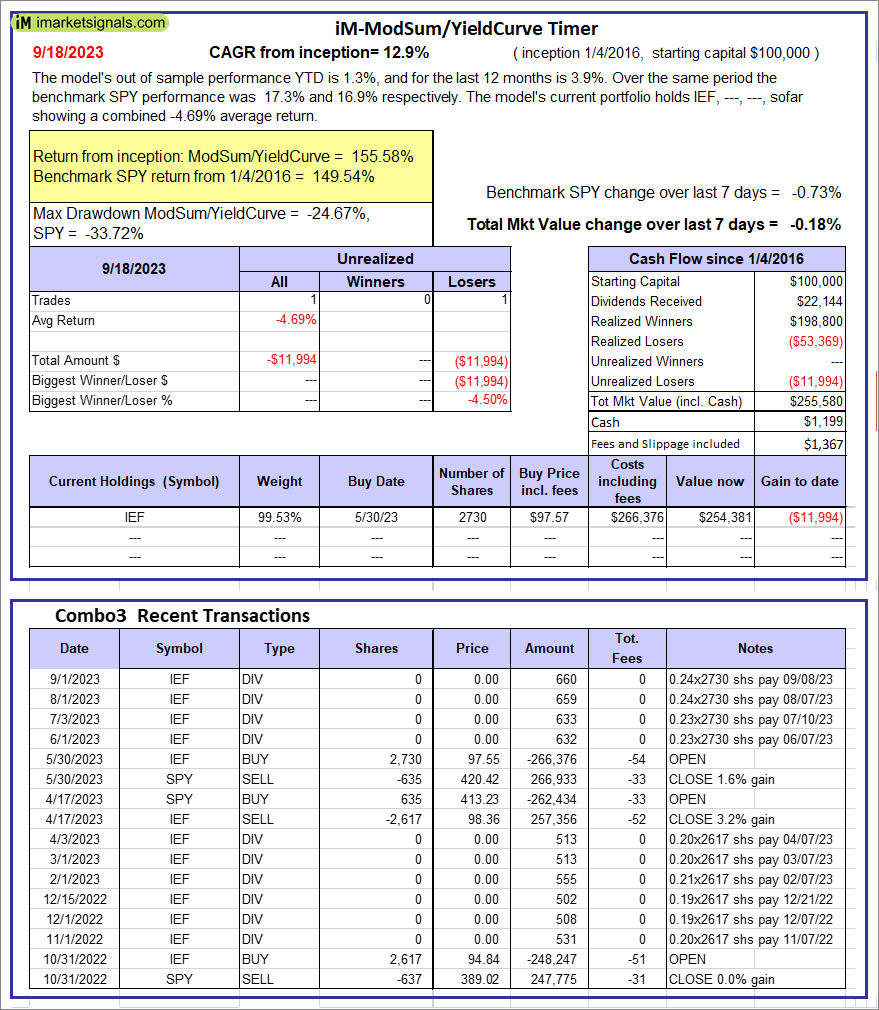 |
iM-ModSum/YieldCurve Timer: The model’s out of sample performance YTD is 1.3%, and for the last 12 months is 3.9%. Over the same period the benchmark SPY performance was 17.3% and 16.9% respectively. Over the previous week the market value of iM-PortSum/YieldCurve Timer gained -0.18% at a time when SPY gained -0.73%. A starting capital of $100,000 at inception on 1/1/2016 would have grown to $255,580 which includes $1,199 cash and excludes $1,367 spent on fees and slippage. |
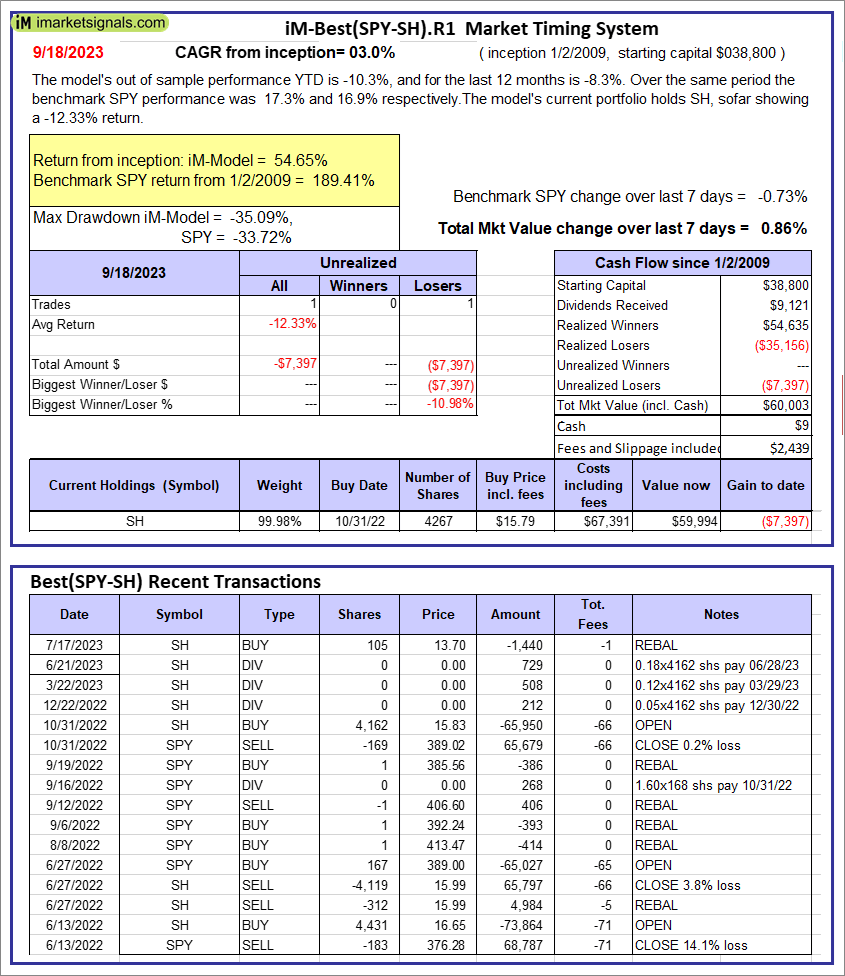 |
iM-Best(SPY-SH).R1: The model’s out of sample performance YTD is -10.3%, and for the last 12 months is -8.3%. Over the same period the benchmark SPY performance was 17.3% and 16.9% respectively. Over the previous week the market value of Best(SPY-SH) gained 0.86% at a time when SPY gained -0.73%. A starting capital of $100,000 at inception on 1/2/2009 would have grown to $60,003 which includes $9 cash and excludes $2,439 spent on fees and slippage. |
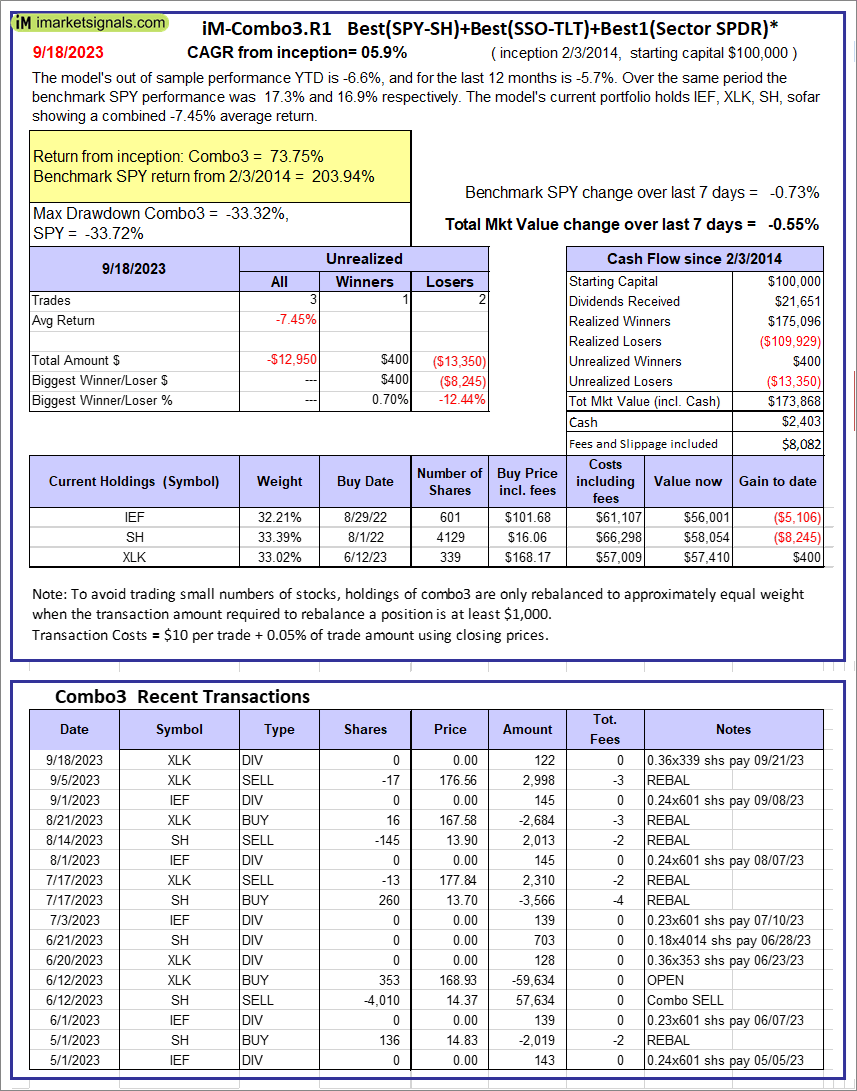 |
iM-Combo3.R1: The model’s out of sample performance YTD is -6.6%, and for the last 12 months is -5.7%. Over the same period the benchmark SPY performance was 17.3% and 16.9% respectively. Over the previous week the market value of iM-Combo3.R1 gained -0.55% at a time when SPY gained -0.73%. A starting capital of $100,000 at inception on 2/3/2014 would have grown to $173,868 which includes $2,403 cash and excludes $8,082 spent on fees and slippage. |
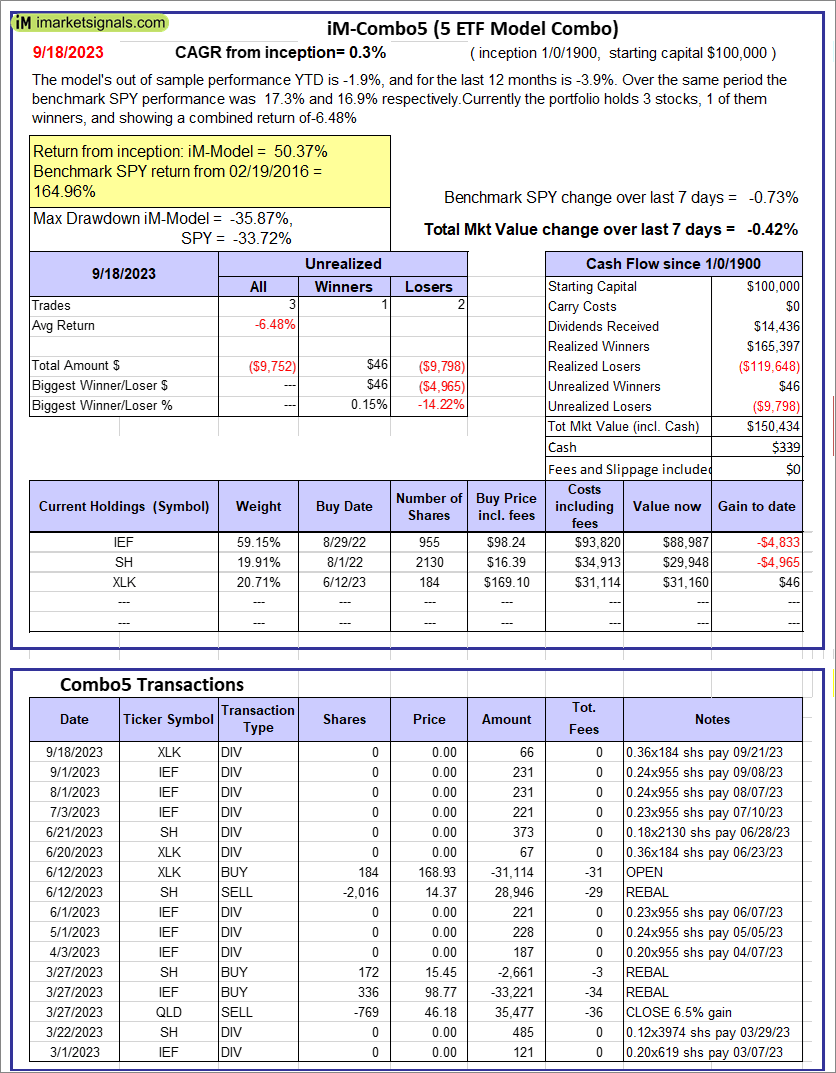 |
iM-Combo5: The model’s out of sample performance YTD is -1.9%, and for the last 12 months is -3.9%. Over the same period the benchmark SPY performance was 17.3% and 16.9% respectively. Over the previous week the market value of iM-Combo5 gained -0.42% at a time when SPY gained -0.73%. A starting capital of $100,000 at inception on 2/22/2016 would have grown to $150,434 which includes $339 cash and excludes $0 spent on fees and slippage. |
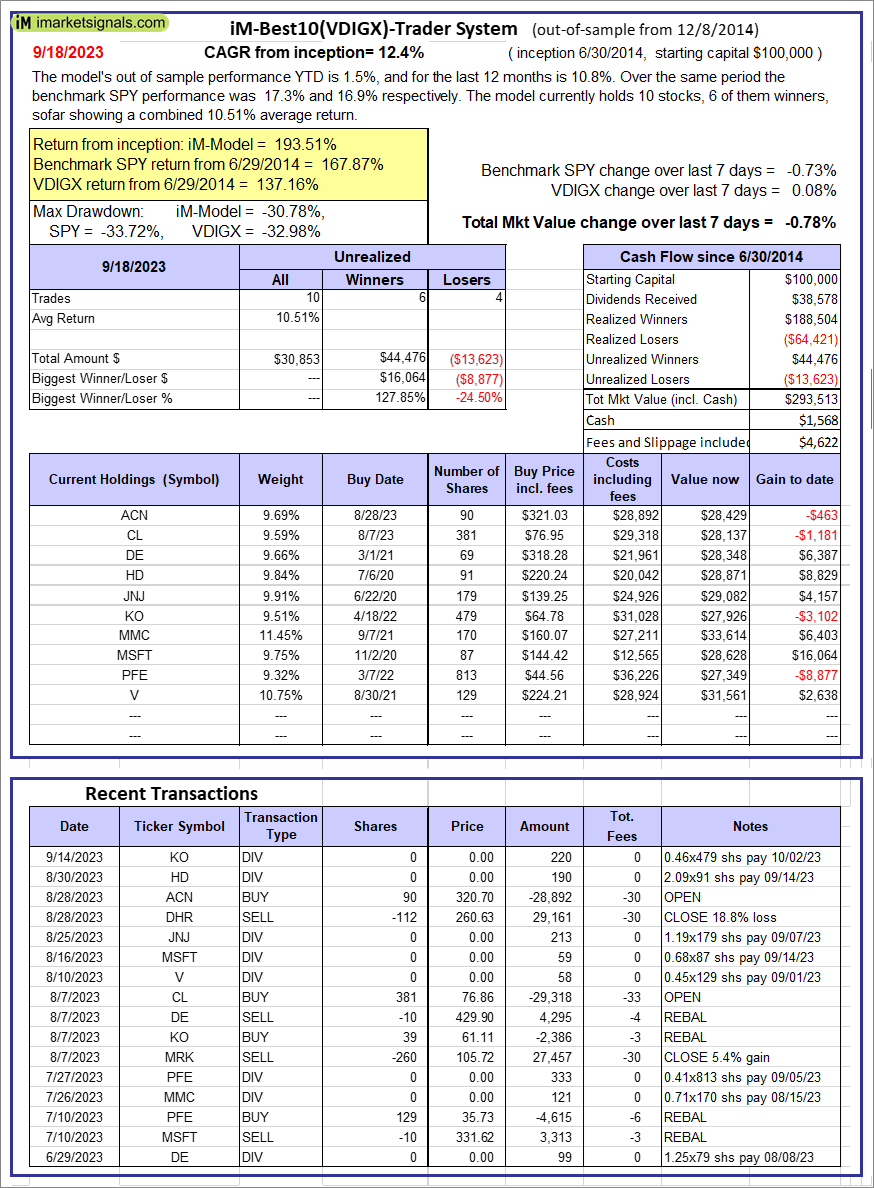 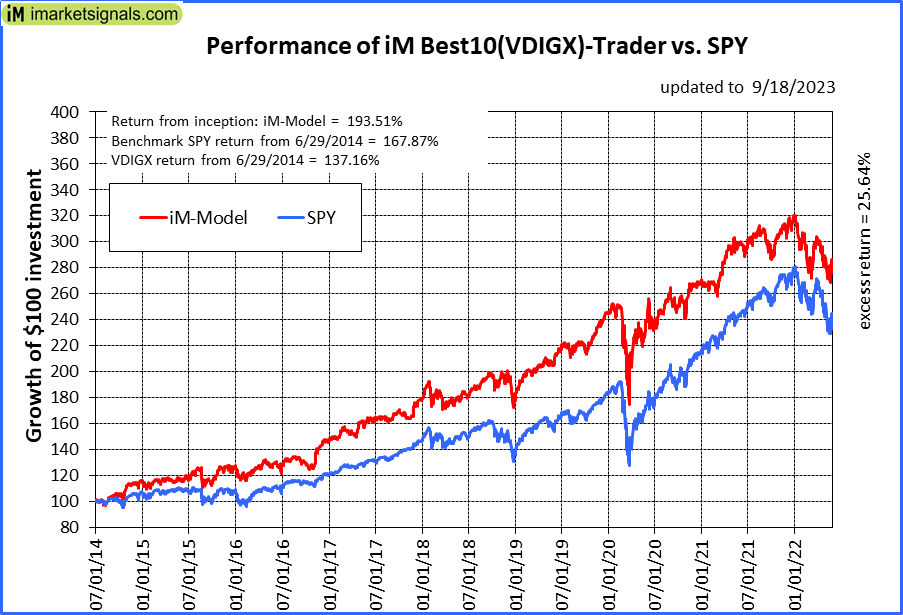 |
iM-Best10(VDIGX)-Trader: The model’s out of sample performance YTD is 1.5%, and for the last 12 months is 10.8%. Over the same period the benchmark SPY performance was 17.3% and 16.9% respectively. Since inception, on 7/1/2014, the model gained 193.51% while the benchmark SPY gained 167.87% and VDIGX gained 137.16% over the same period. Over the previous week the market value of iM-Best10(VDIGX) gained -0.78% at a time when SPY gained -0.73%. A starting capital of $100,000 at inception on 7/1/2014 would have grown to $293,513 which includes $1,568 cash and excludes $4,622 spent on fees and slippage. |
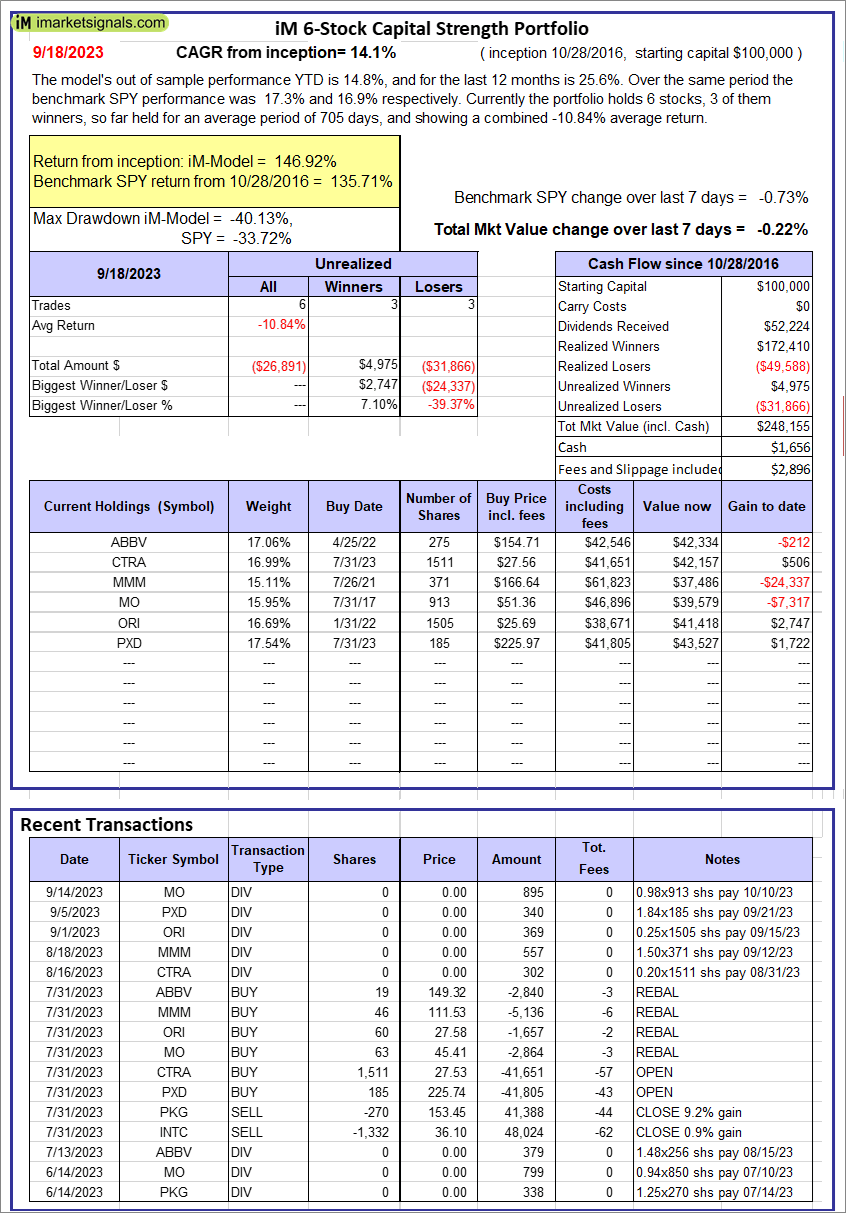 |
iM 6-Stock Capital Strength Portfolio: The model’s out of sample performance YTD is 14.8%, and for the last 12 months is 25.6%. Over the same period the benchmark SPY performance was 17.3% and 16.9% respectively. Over the previous week the market value of the iM 6-Stock Capital Strength Portfolio gained -0.22% at a time when SPY gained -0.73%. A starting capital of $100,000 at inception on 10/28/2016 would have grown to $248,155 which includes $1,656 cash and excludes $2,896 spent on fees and slippage. |
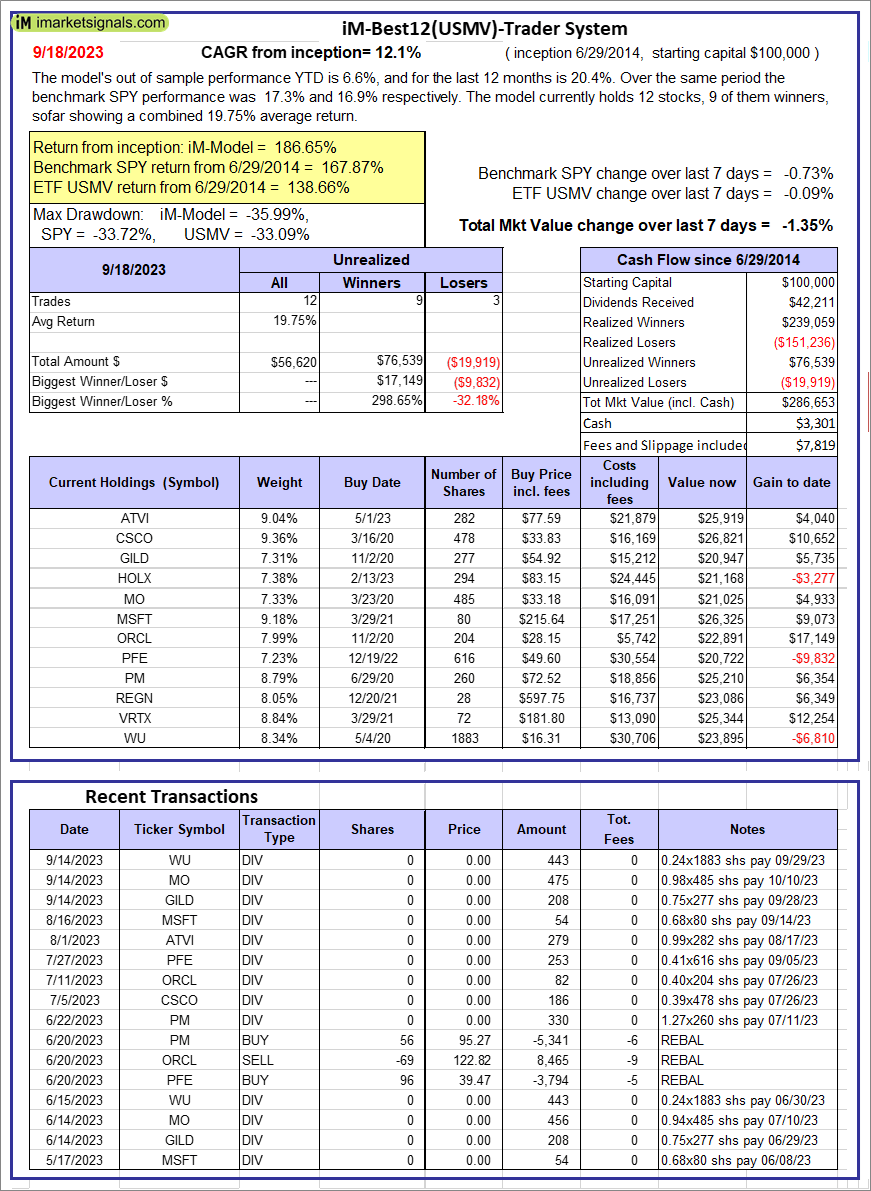 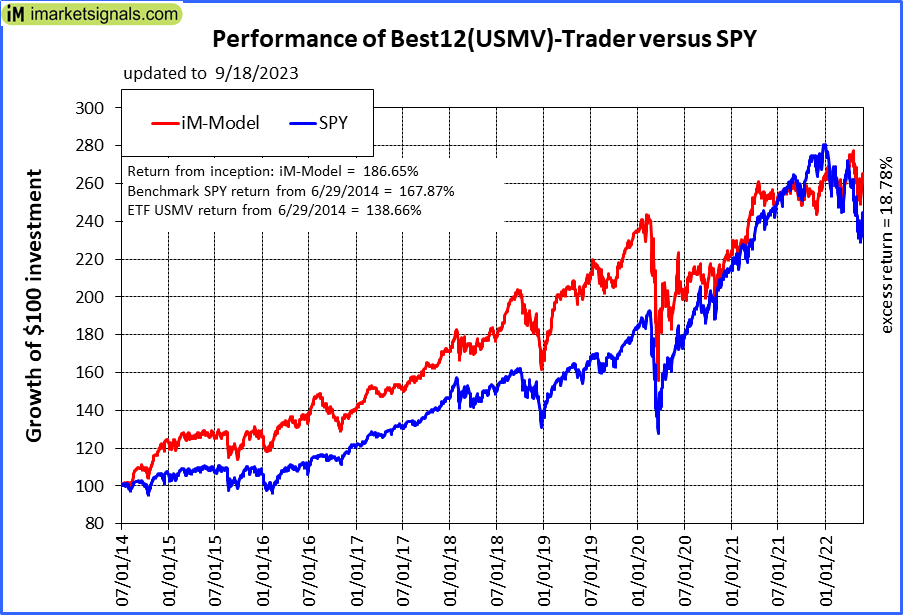 |
iM-Best12(USMV)-Trader: The model’s out of sample performance YTD is 6.6%, and for the last 12 months is 20.4%. Over the same period the benchmark SPY performance was 17.3% and 16.9% respectively. Since inception, on 6/30/2014, the model gained 186.65% while the benchmark SPY gained 167.87% and the ETF USMV gained 138.66% over the same period. Over the previous week the market value of iM-Best12(USMV)-Trader gained -1.35% at a time when SPY gained -0.73%. A starting capital of $100,000 at inception on 6/30/2014 would have grown to $286,653 which includes $3,301 cash and excludes $7,819 spent on fees and slippage. |
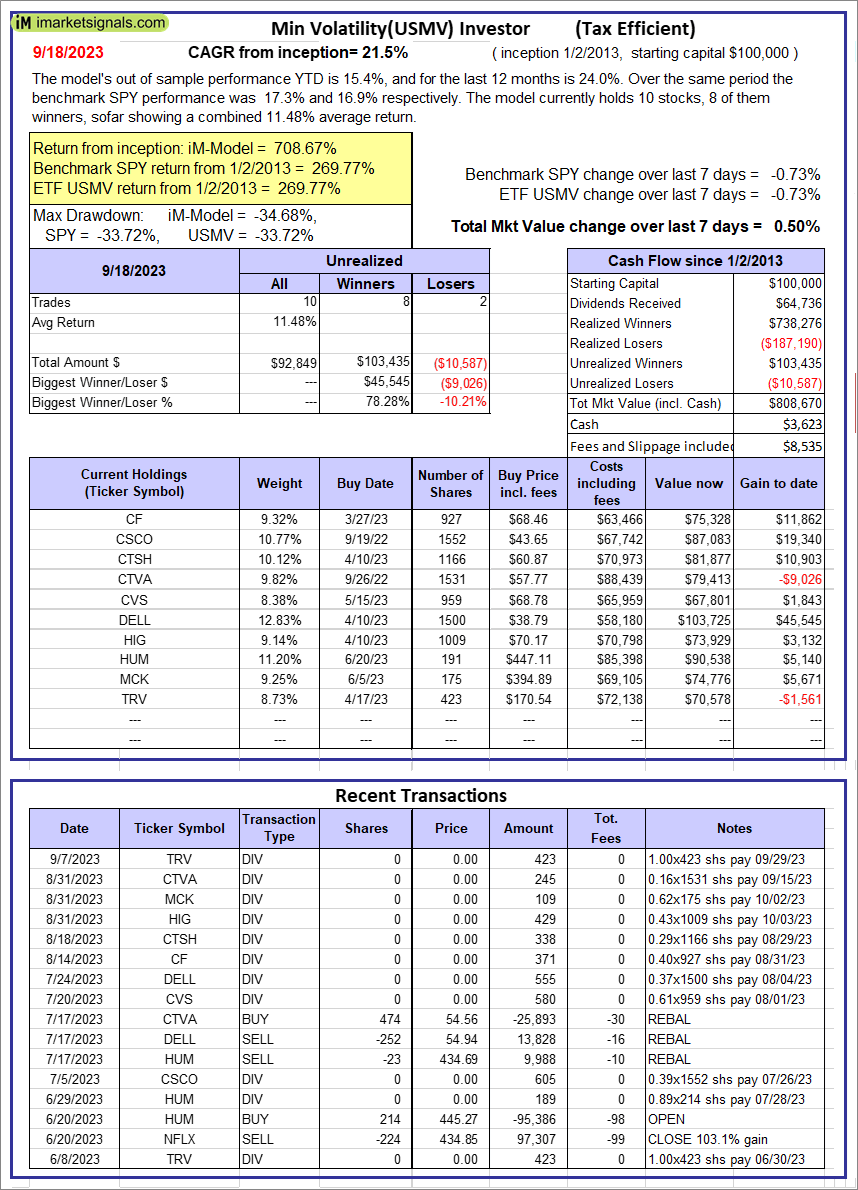 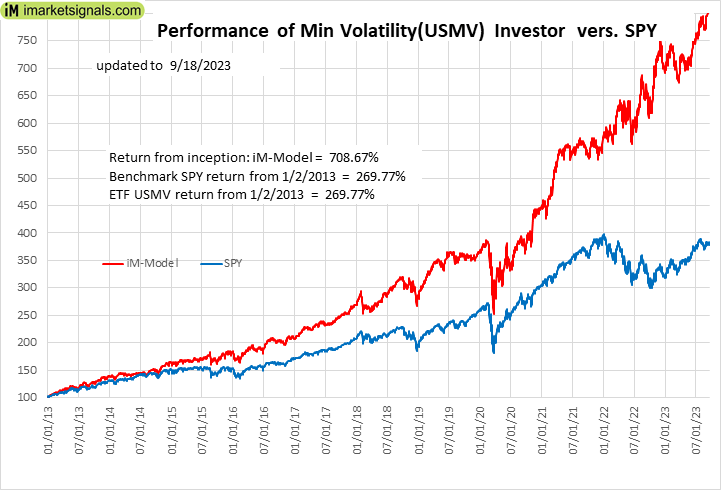 |
iM-Min Volatility(USMV) Investor (Tax Efficient): The model’s out of sample performance YTD is 15.4%, and for the last 12 months is 24.0%. Over the same period the benchmark SPY performance was 17.3% and 16.9% respectively. Since inception, on 1/3/2013, the model gained 708.67% while the benchmark SPY gained 269.77% and the ETF USMV gained 269.77% over the same period. Over the previous week the market value of iM-Best12(USMV)Q1 gained 0.50% at a time when SPY gained -0.73%. A starting capital of $100,000 at inception on 1/3/2013 would have grown to $808,670 which includes $3,623 cash and excludes $8,535 spent on fees and slippage. |
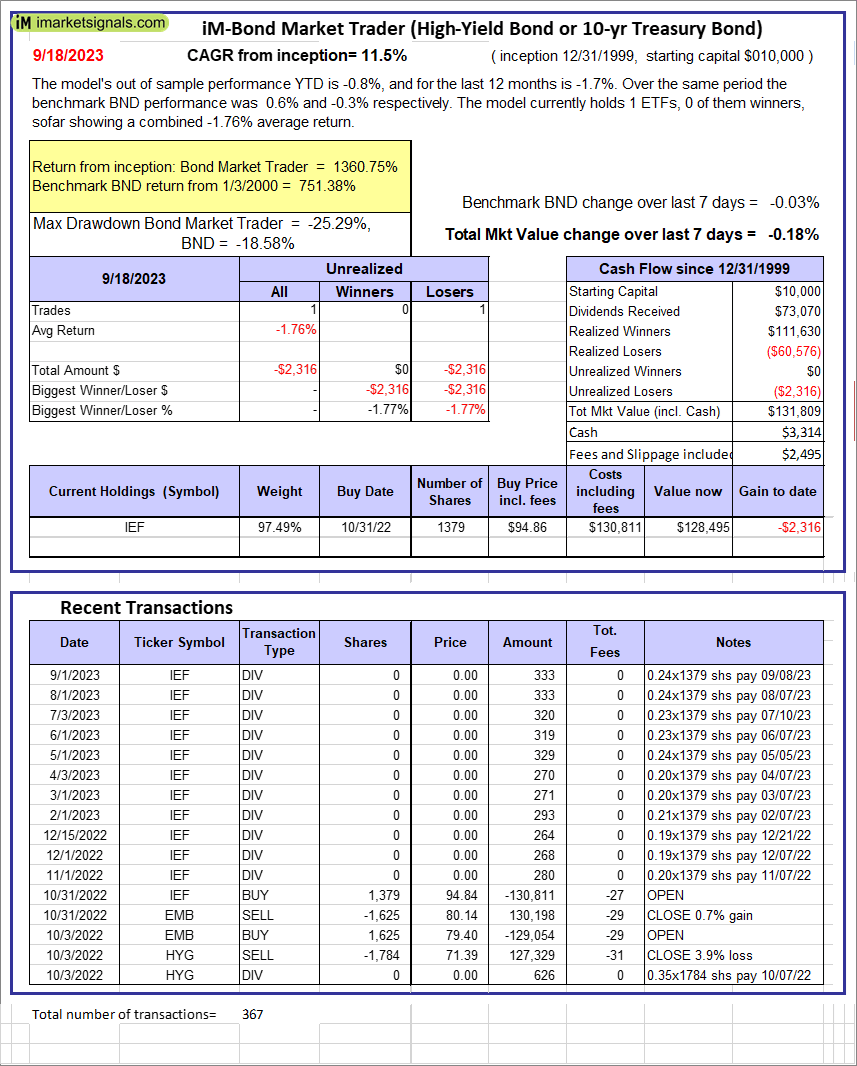 |
iM-Bond Market Trader (High-Yield Bond or 10-yr Treasury Bond): The model’s out of sample performance YTD is -0.8%, and for the last 12 months is -1.7%. Over the same period the benchmark BND performance was 0.6% and -0.3% respectively. Over the previous week the market value of the iM-Bond Market Trader (High-Yield Bond or 10-yr Treasury Bond) gained -0.18% at a time when BND gained -0.03%. A starting capital of $10,000 at inception on 1/3/2000 would have grown to $131,809 which includes $3,314 cash and excludes $2,495 spent on fees and slippage. |
|
|
iM-ModSum/YieldCurve Timer: The model’s out of sample performance YTD is 1.3%, and for the last 12 months is 3.9%. Over the same period the benchmark SPY performance was 17.3% and 16.9% respectively. Over the previous week the market value of iM-PortSum/YieldCurve Timer gained -0.18% at a time when SPY gained -0.73%. A starting capital of $100,000 at inception on 1/1/2016 would have grown to $255,580 which includes $1,199 cash and excludes $1,367 spent on fees and slippage. |
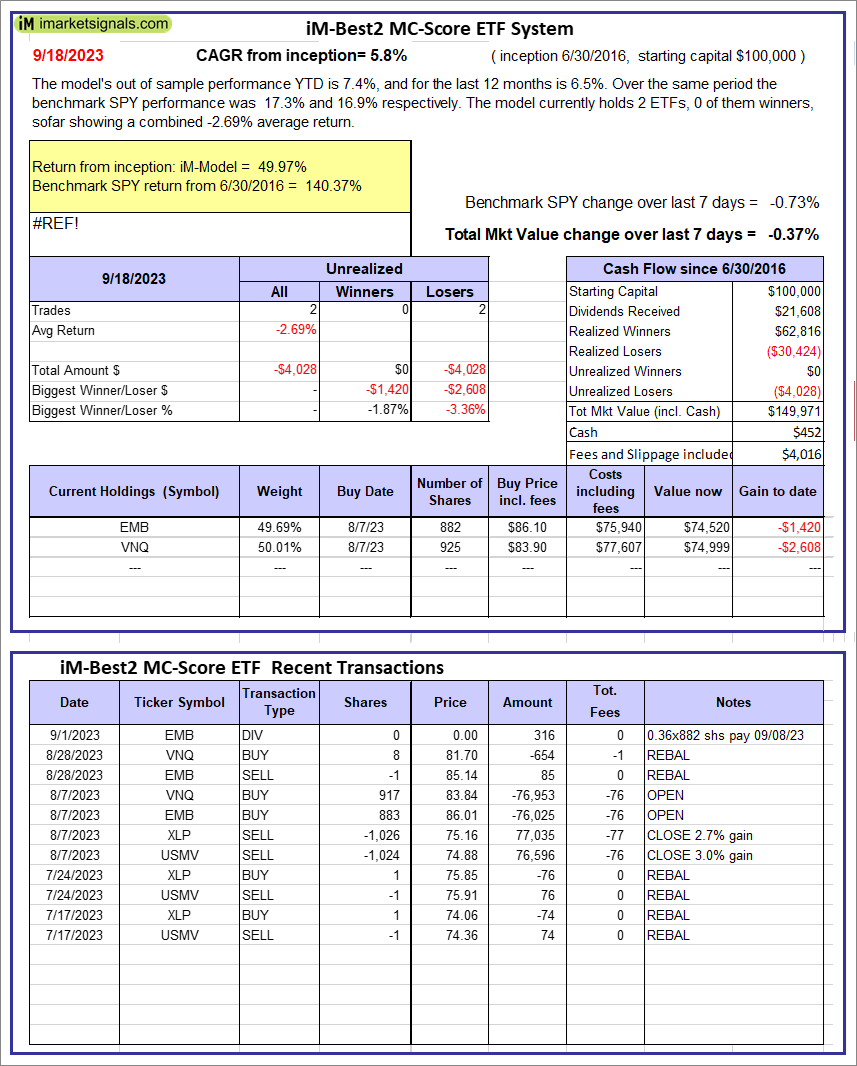 |
iM-Best2 MC-Score ETF System: The model’s out of sample performance YTD is 7.4%, and for the last 12 months is 6.5%. Over the same period the benchmark SPY performance was 17.3% and 16.9% respectively. Over the previous week the market value of the iM-Best2 MC-Score ETF System gained -0.37% at a time when SPY gained -0.73%. A starting capital of $100,000 at inception on 6/30/2016 would have grown to $149,971 which includes $452 cash and excludes $4,016 spent on fees and slippage. |
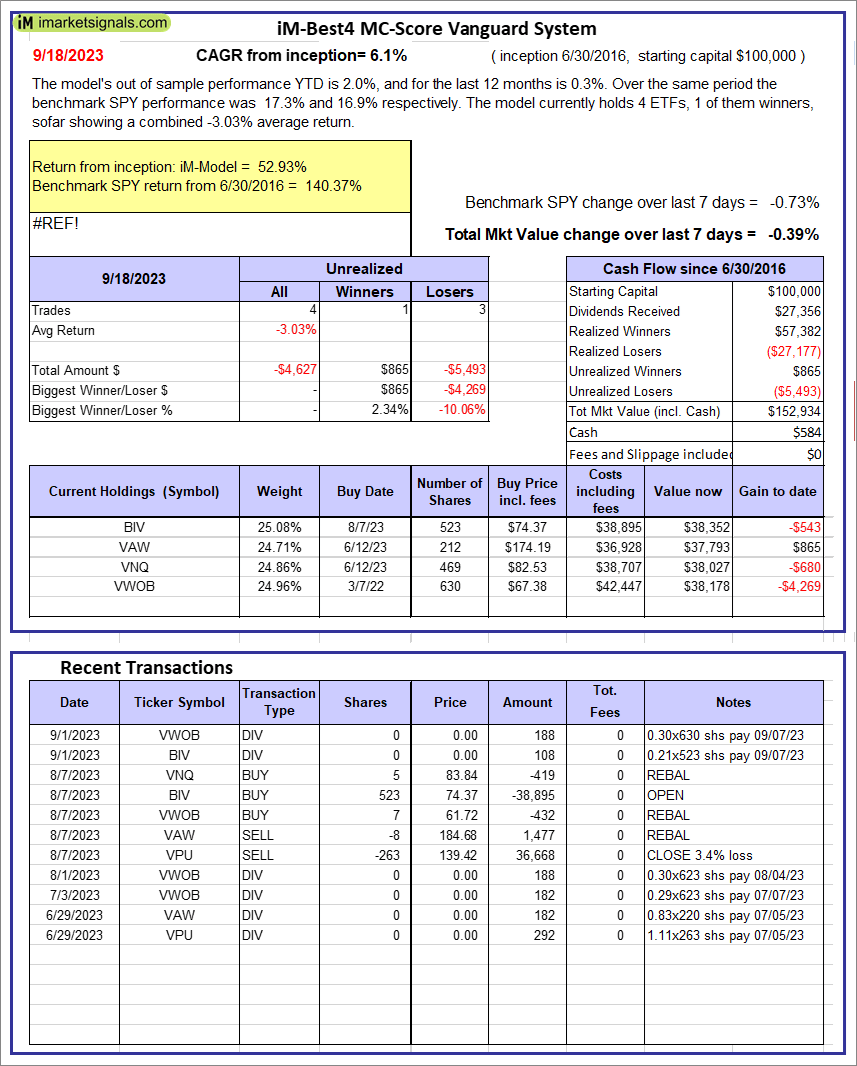 |
iM-Best4 MC-Score Vanguard System: The model’s out of sample performance YTD is 2.0%, and for the last 12 months is 0.3%. Over the same period the benchmark SPY performance was 17.3% and 16.9% respectively. Over the previous week the market value of the iM-Best4 MC-Score Vanguard System gained -0.39% at a time when SPY gained -0.73%. A starting capital of $100,000 at inception on 6/30/2016 would have grown to $152,934 which includes $584 cash and excludes $00 spent on fees and slippage. |
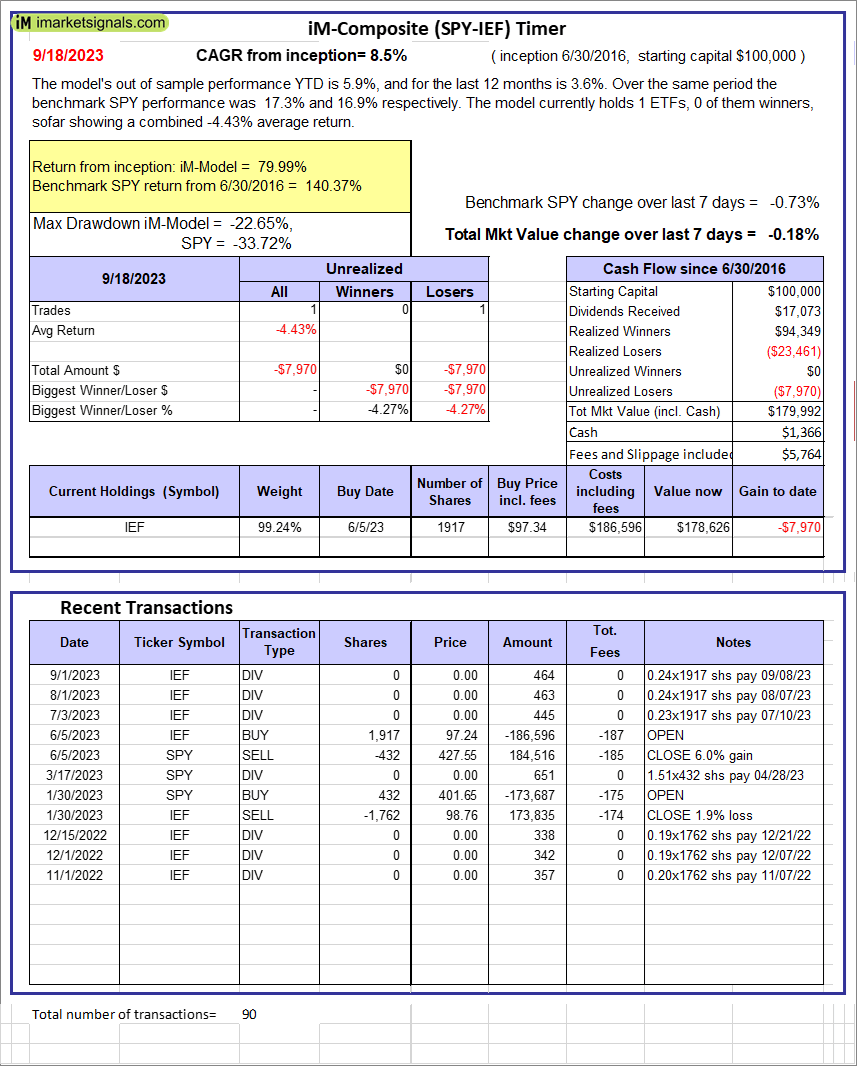 |
iM-Composite (SPY-IEF) Timer: The model’s out of sample performance YTD is 5.9%, and for the last 12 months is 3.6%. Over the same period the benchmark SPY performance was 17.3% and 16.9% respectively. Over the previous week the market value of the iM-Composite (SPY-IEF) Timer gained -0.18% at a time when SPY gained -0.73%. A starting capital of $100,000 at inception on 6/30/2016 would have grown to $179,992 which includes $1,366 cash and excludes $5,764 spent on fees and slippage. |
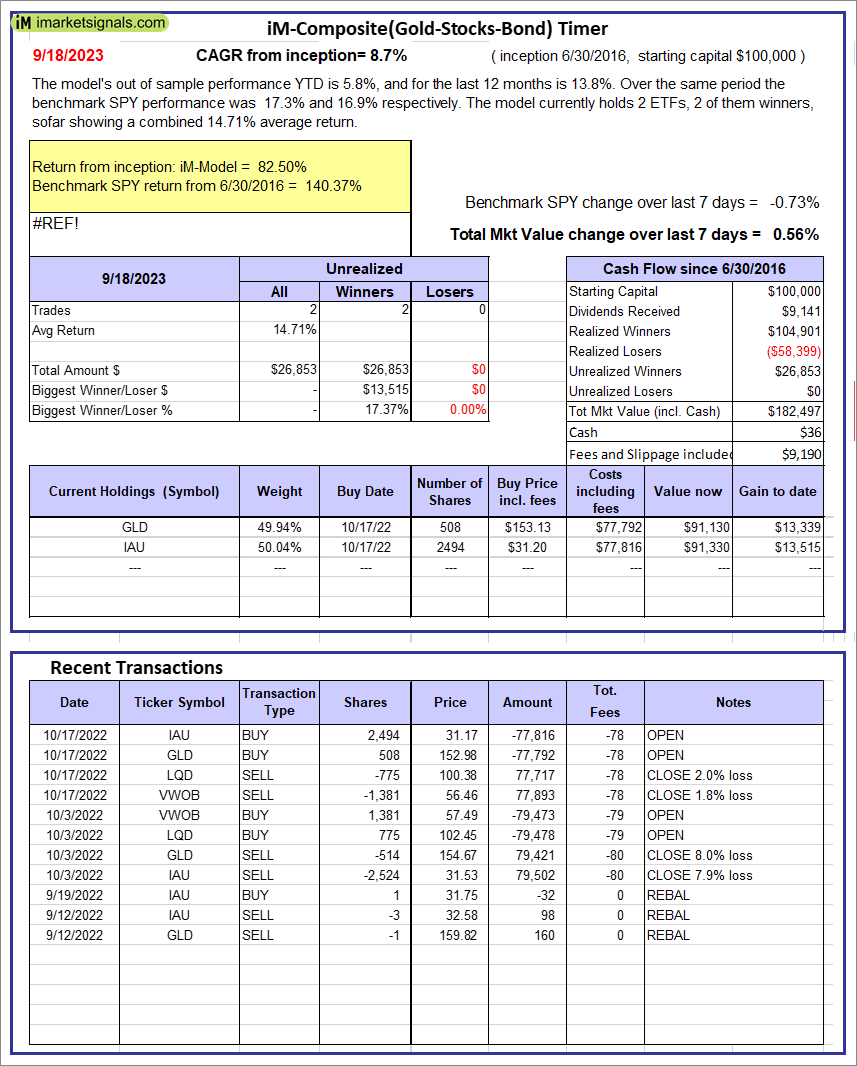 |
iM-Composite(Gold-Stocks-Bond) Timer: The model’s out of sample performance YTD is 5.8%, and for the last 12 months is 13.8%. Over the same period the benchmark SPY performance was 17.3% and 16.9% respectively. Over the previous week the market value of the iM-Composite(Gold-Stocks-Bond) Timer gained 0.56% at a time when SPY gained -0.73%. A starting capital of $100,000 at inception on 6/30/2016 would have grown to $182,497 which includes $36 cash and excludes $9,190 spent on fees and slippage. |
iM-Best Reports – 9/18/2023
Posted in pmp SPY-SH
Leave a Reply
You must be logged in to post a comment.