
  |
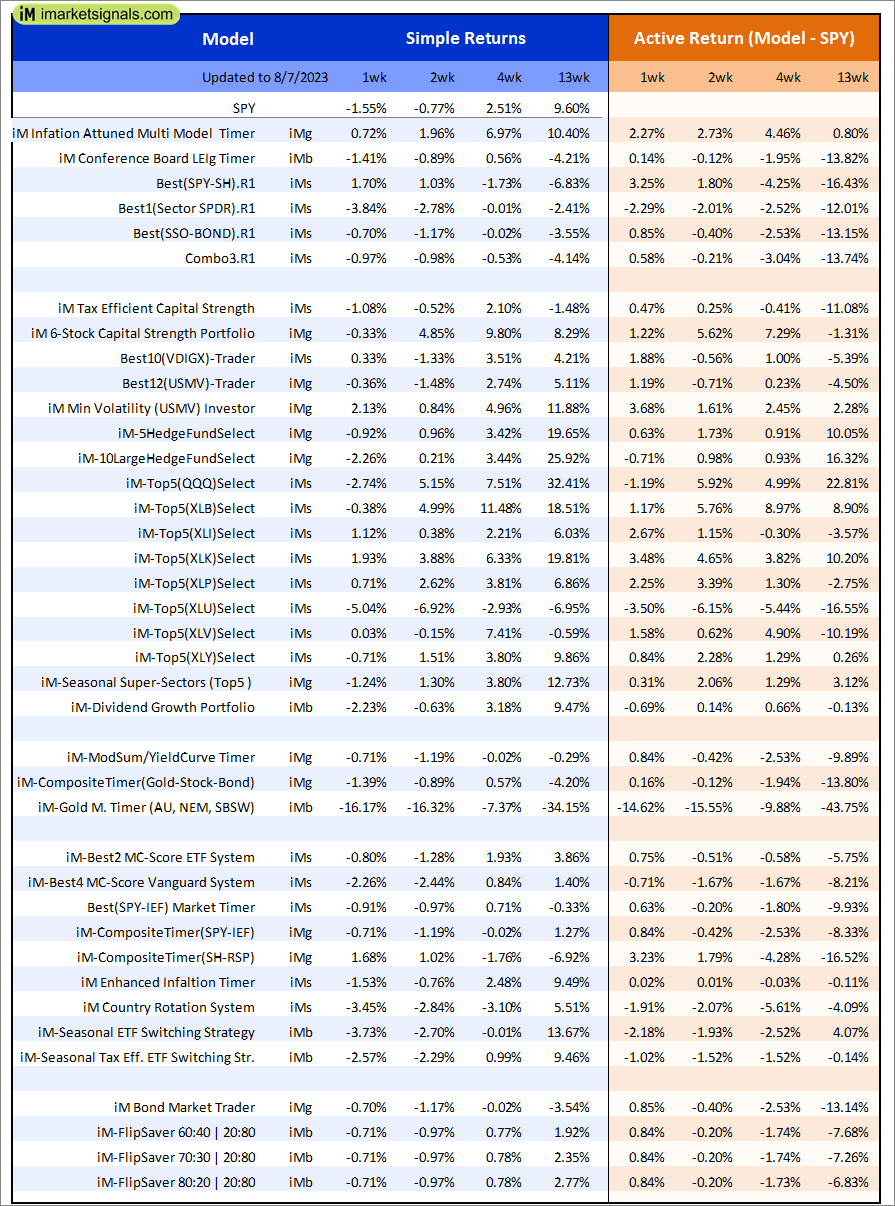
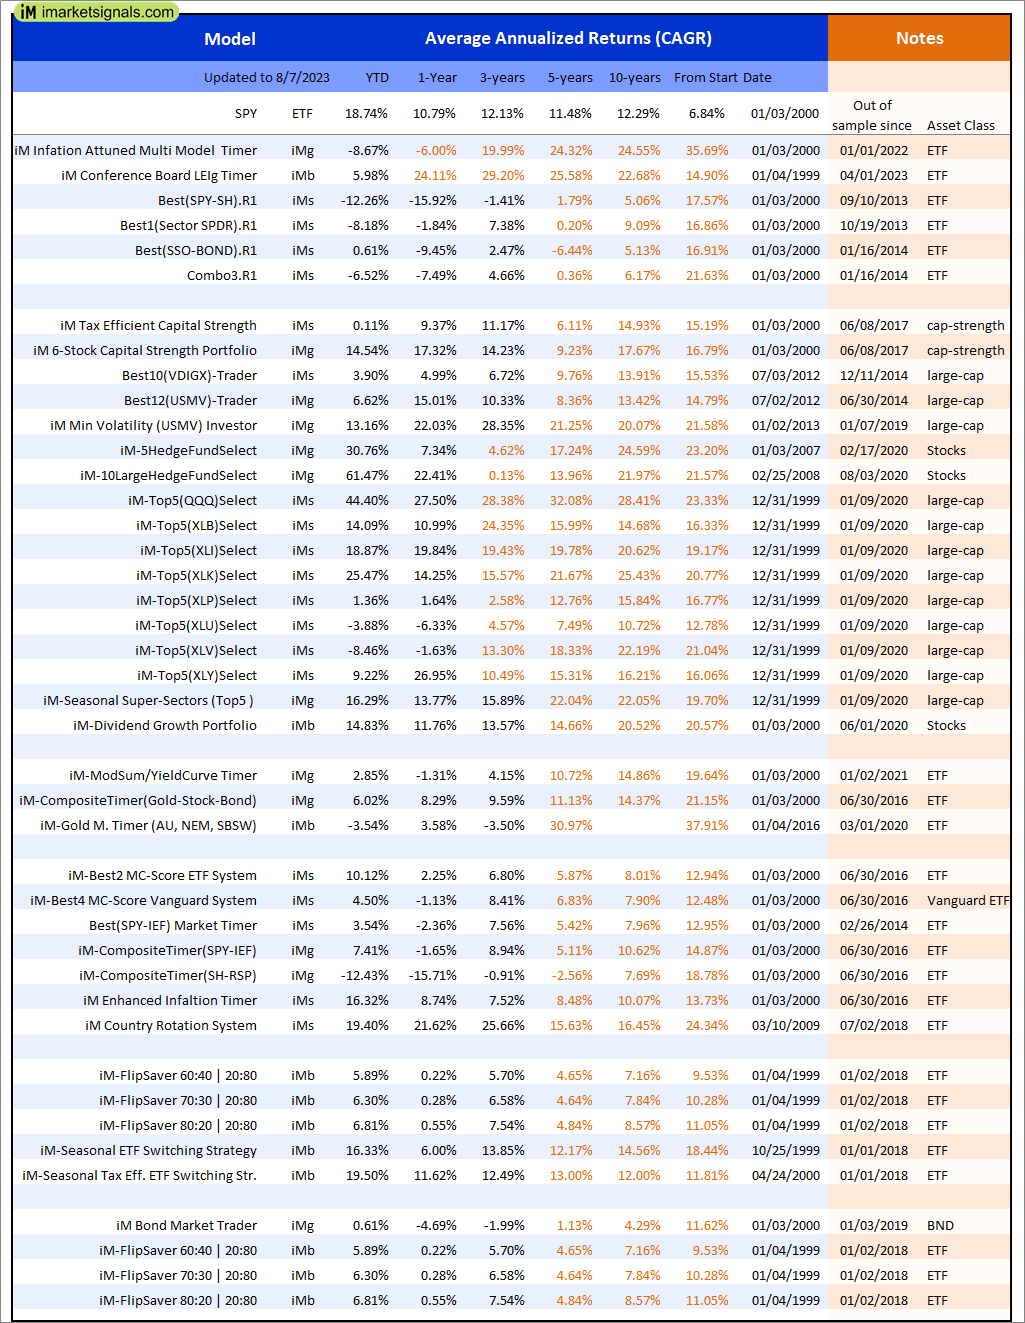
Out of sample performance summary of our models for the past 1, 2, 4 and 13 week periods. The active active return indicates how the models over- or underperformed the benchmark ETF SPY. Also the YTD, and the 1-, 3-, 5- and 10-year annualized returns are shown in the second table |
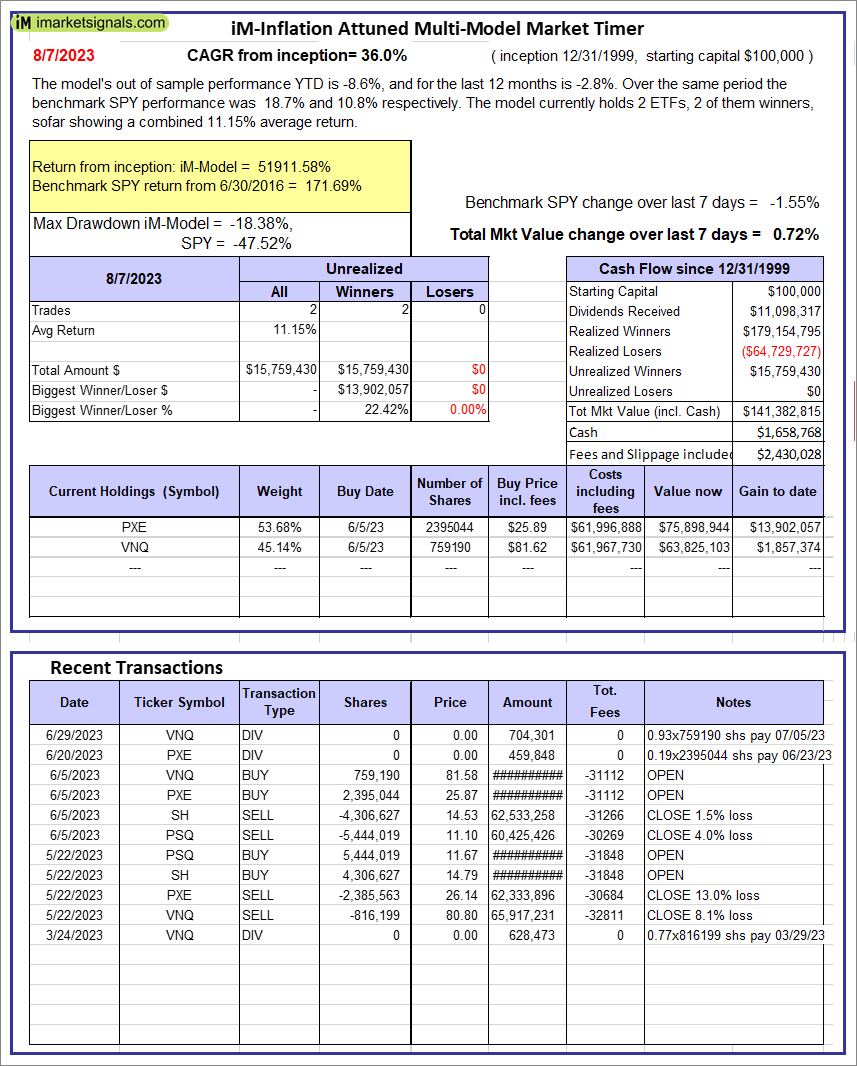 |
iM-Inflation Attuned Multi-Model Market Timer: The model’s out of sample performance YTD is -8.6%, and for the last 12 months is -2.8%. Over the same period the benchmark SPY performance was 18.7% and 10.8% respectively. Over the previous week the market value of the iM-Inflation Attuned Multi-Model Market Timer gained 0.72% at a time when SPY gained -1.55%. A starting capital of $100,000 at inception on 3/24/2017 would have grown to $141,382,815 which includes $1,658,768 cash and excludes $2,430,028 spent on fees and slippage. |
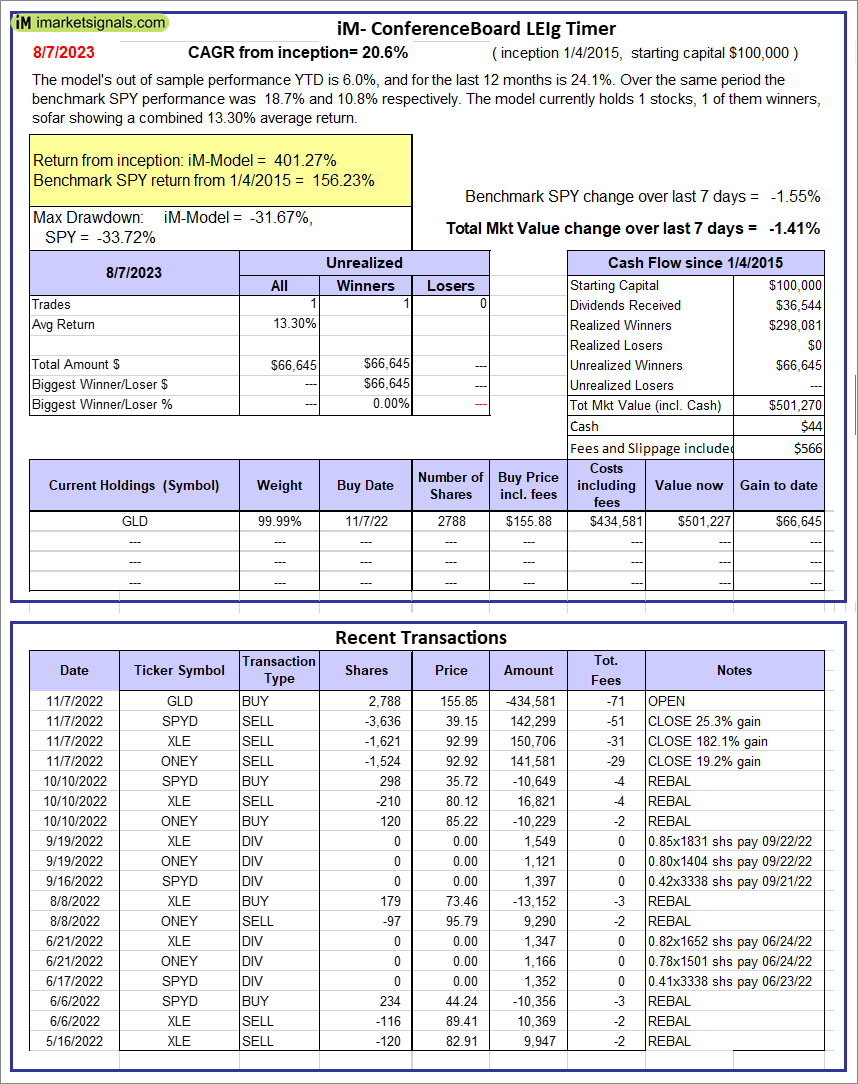 |
iM-Conference Board LEIg Timer: The model’s performance YTD is 14.3%, and for the last 12 months is 7.3%. Over the same period the benchmark SPY performance was 20.1% and 9.4% respectively. Over the previous week the market value of the iM-Conference Board LEIg Timer gained -1.41% at a time when SPY gained -1.55%. A starting capital of $100,000 at inception on 4/5/2017 would have grown to $501,270 which includes $44 cash and excludes $566 spent on fees and slippage. |
 |
iM-FlipSaver 60:40 | 20:80 – 2017: The model’s out of sample performance YTD is 5.8%, and for the last 12 months is 0.0%. Over the same period the benchmark E60B40 performance was 11.7% and 5.4% respectively. Over the previous week the market value of iM-FlipSaver 80:20 | 20:80 gained -0.71% at a time when SPY gained -1.28%. A starting capital of $100,000 at inception on 7/16/2015 would have grown to $149,148 which includes $840 cash and excludes $3,255 spent on fees and slippage. |
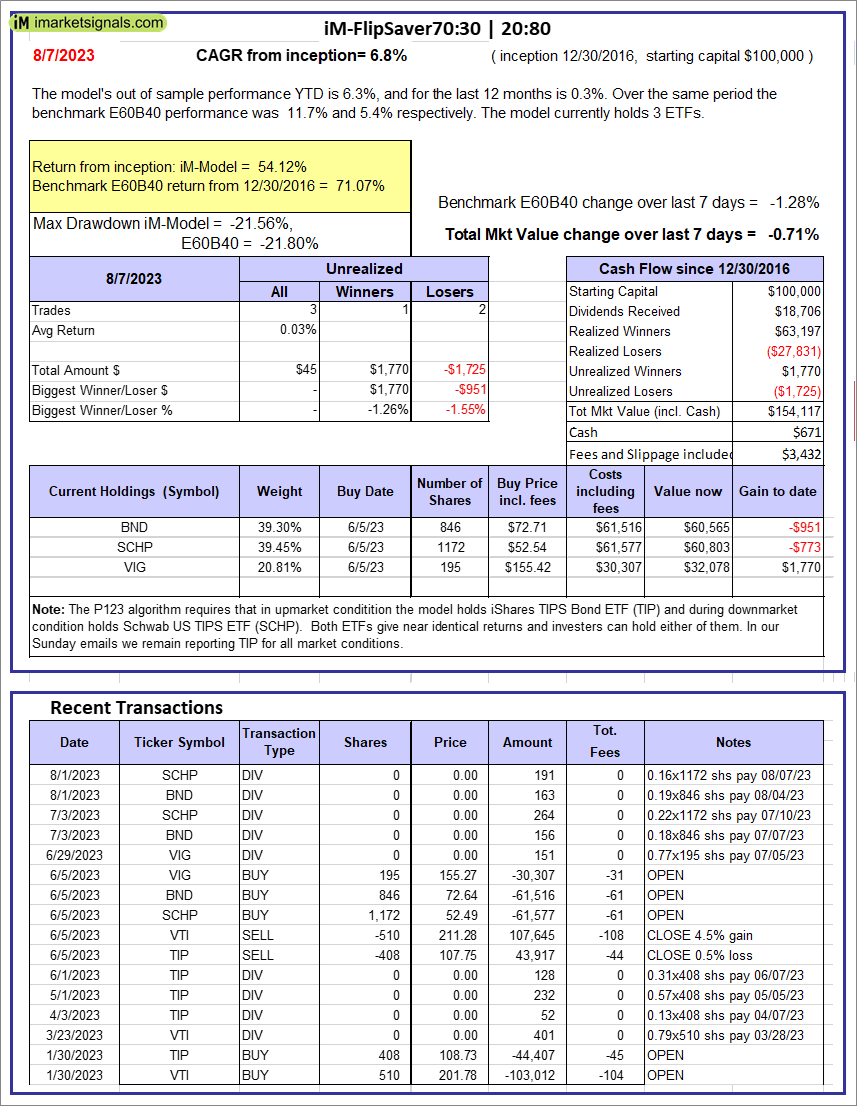 |
iM-FlipSaver 70:30 | 20:80 – 2017: The model’s out of sample performance YTD is 6.3%, and for the last 12 months is 0.3%. Over the same period the benchmark E60B40 performance was 11.7% and 5.4% respectively. Over the previous week the market value of iM-FlipSaver 70:30 | 20:80 gained -0.71% at a time when SPY gained -1.28%. A starting capital of $100,000 at inception on 7/15/2015 would have grown to $154,117 which includes $671 cash and excludes $3,432 spent on fees and slippage. |
 |
iM-FlipSaver 80:20 | 20:80 – 2017: The model’s out of sample performance YTD is 6.8%, and for the last 12 months is 0.5%. Over the same period the benchmark E60B40 performance was 11.7% and 5.4% respectively. Over the previous week the market value of iM-FlipSaver 80:20 | 20:80 gained -0.71% at a time when SPY gained -1.28%. A starting capital of $100,000 at inception on 1/2/2017 would have grown to $158,957 which includes $671 cash and excludes $3,600 spent on fees and slippage. |
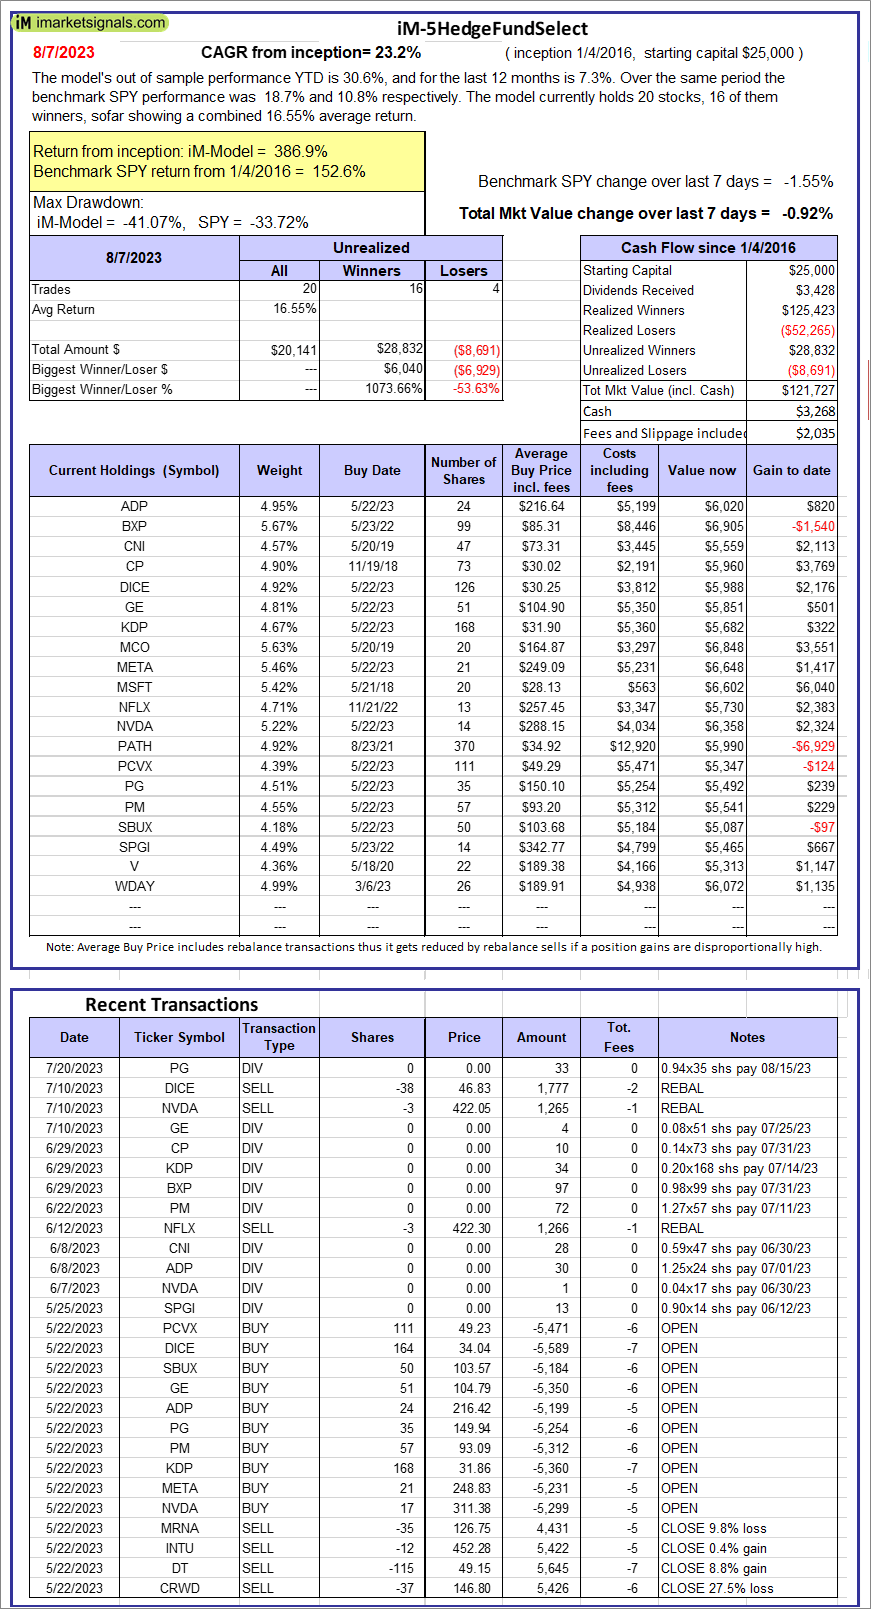  |
iM-5HedgeFundSelect: Since inception, on 1/5/2016, the model gained 386.91% while the benchmark SPY gained 152.64% over the same period. Over the previous week the market value of iM-5HedgeFundSelect gained -0.92% at a time when SPY gained -1.55%. A starting capital of $25,000 at inception on 1/5/2016 would have grown to $121,727 which includes $3,268 cash and excludes $2,035 spent on fees and slippage. |
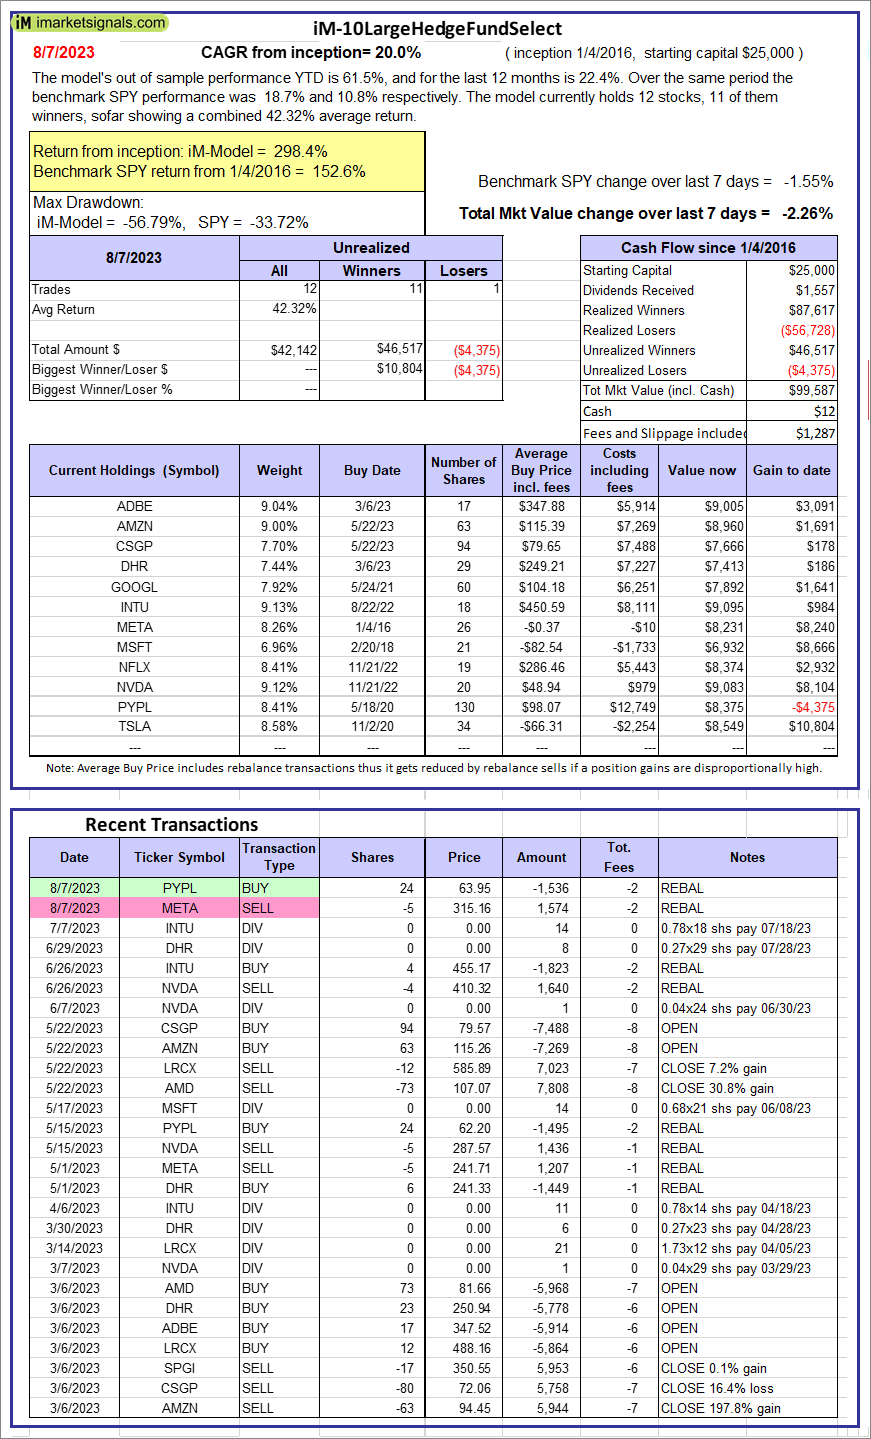 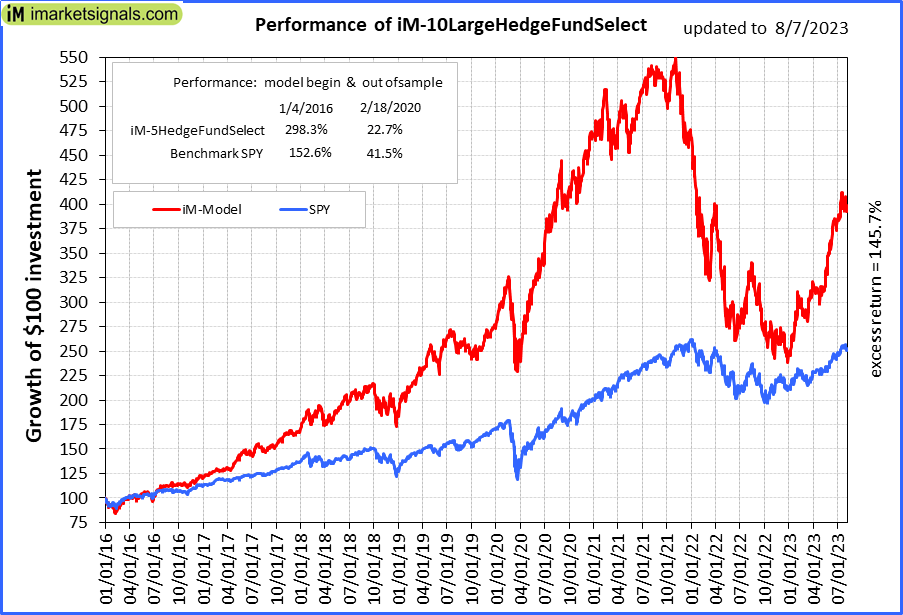 |
iM-10LargeHedgeFundSelect: Since inception, on 1/5/2016, the model gained 298.35% while the benchmark SPY gained 152.64% over the same period. Over the previous week the market value of iM-10LargeHedgeFundSelect gained -2.26% at a time when SPY gained -1.55%. A starting capital of $25,000 at inception on 1/5/2016 would have grown to $99,587 which includes $12 cash and excludes $1,287 spent on fees and slippage. |
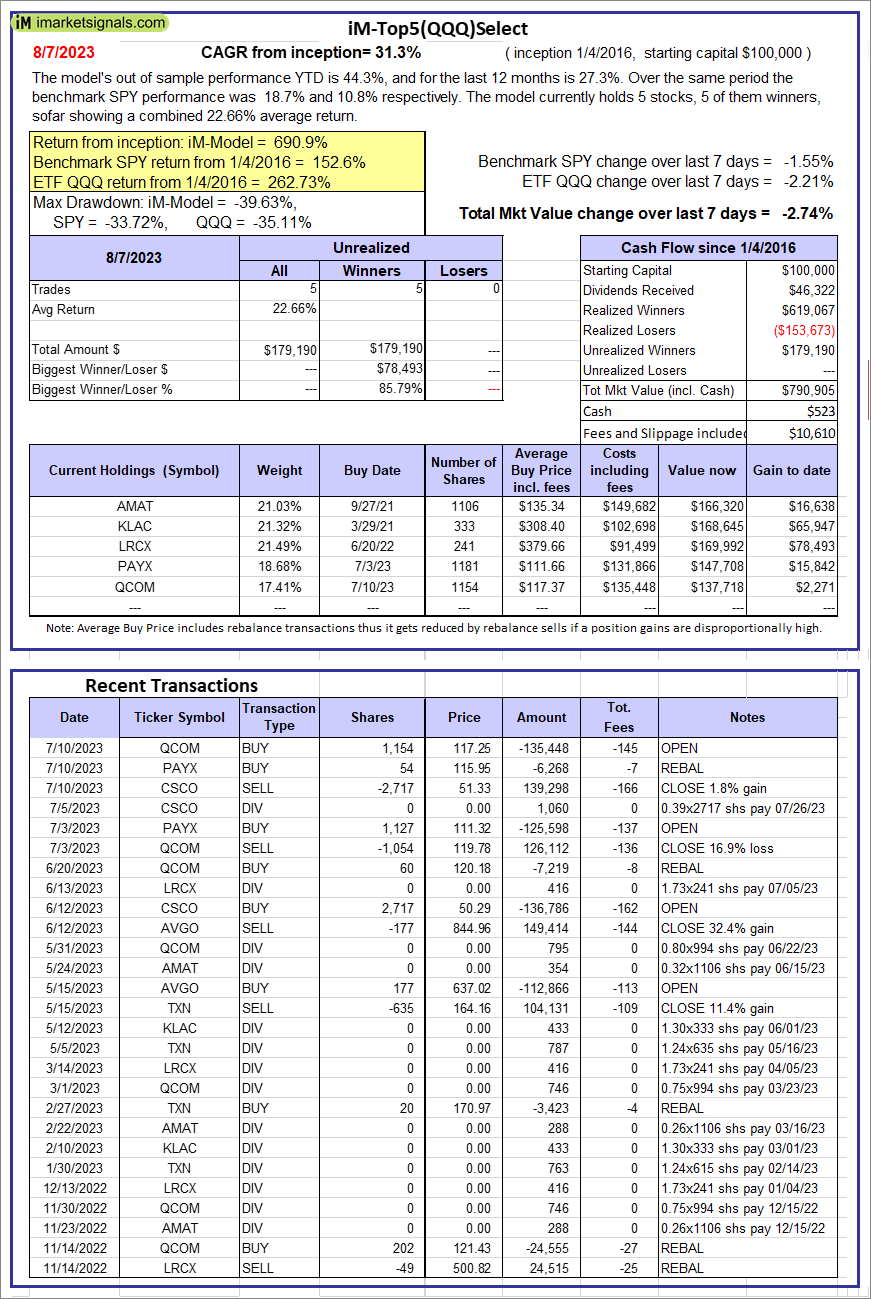 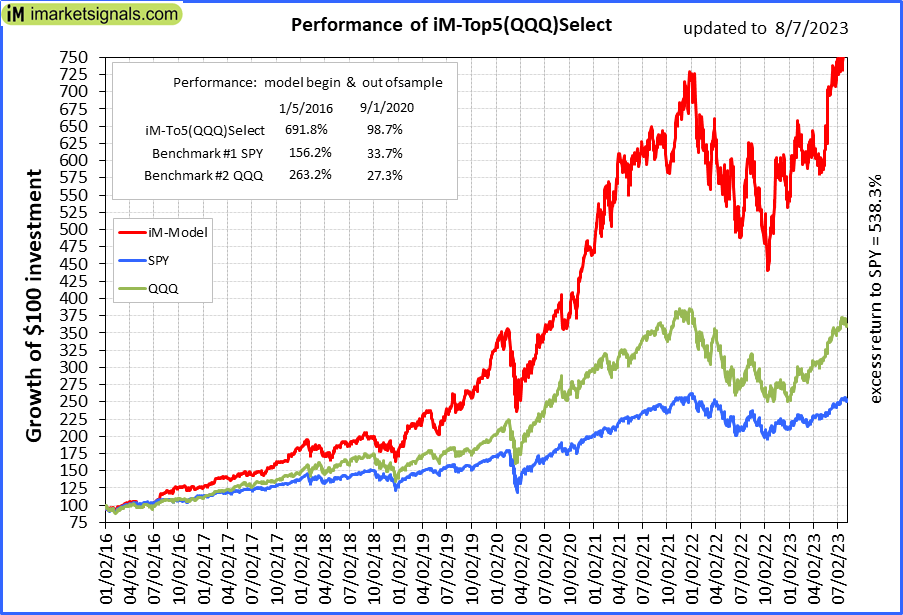 |
iM-Top5(QQQ)Select: Since inception, on 1/5/2016, the model gained 690.91% while the benchmark SPY gained 152.64% over the same period. Over the previous week the market value of iM-Top5(QQQ)Select gained -2.74% at a time when SPY gained -1.55%. A starting capital of $100,000 at inception on 1/5/2016 would have grown to $790,905 which includes $523 cash and excludes $10,610 spent on fees and slippage. |
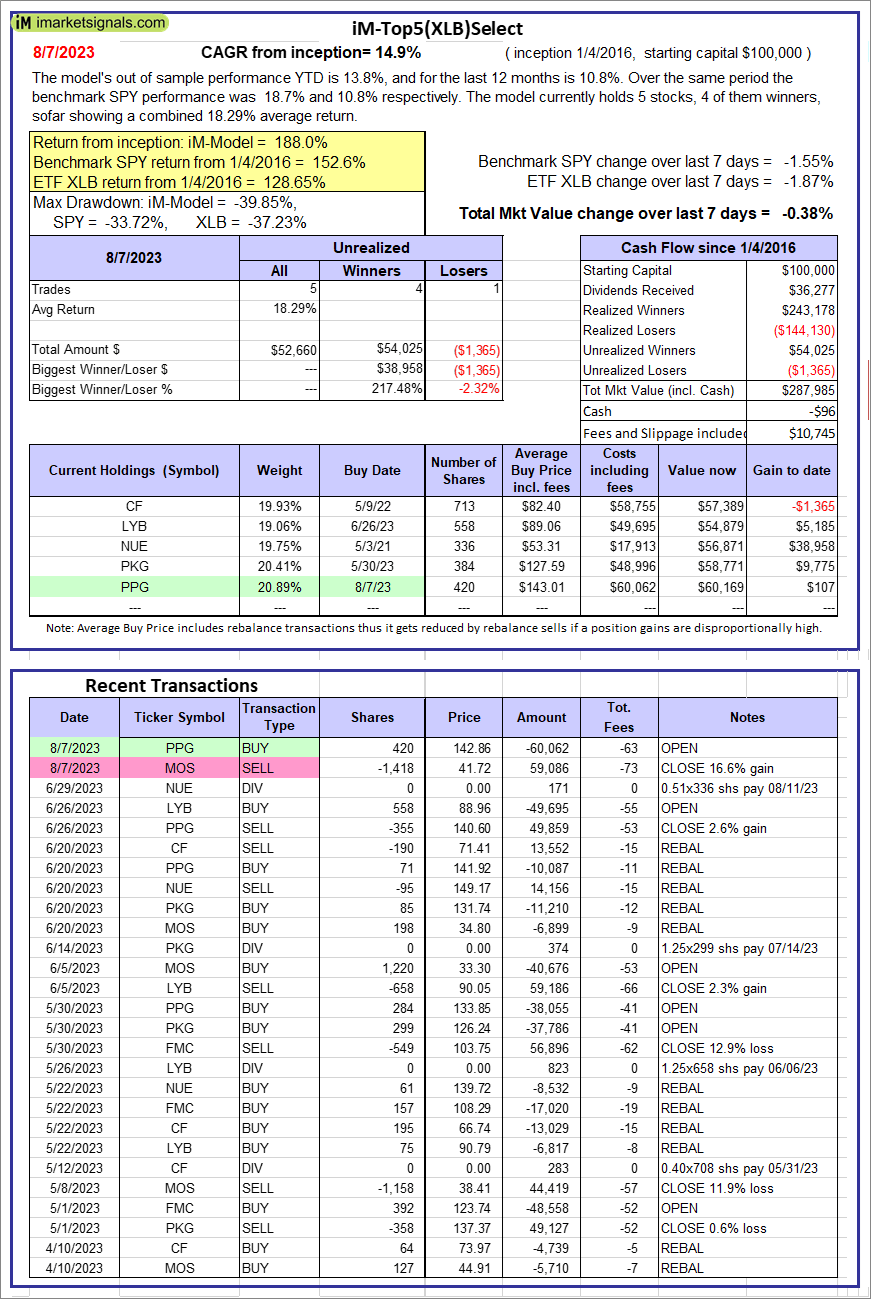 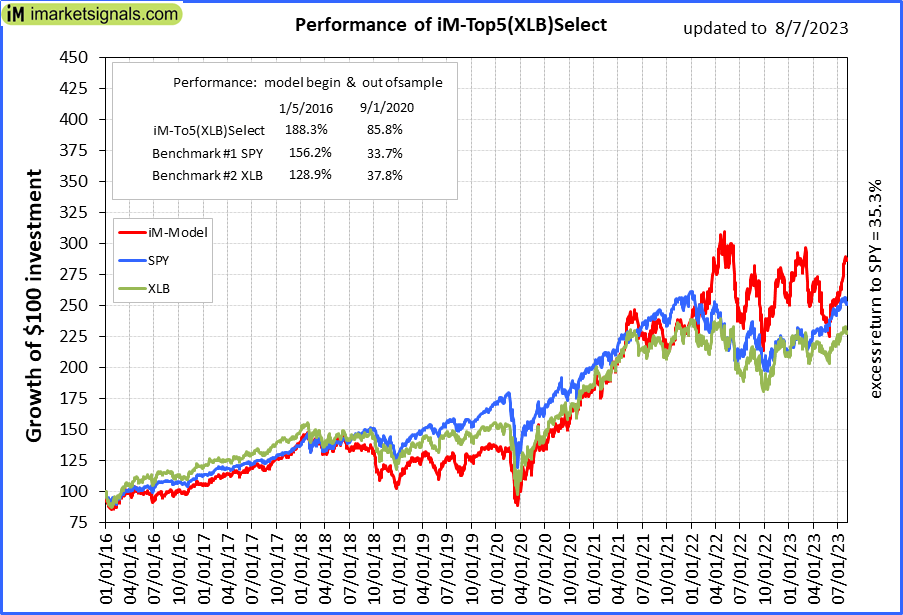 |
iM-Top5(XLB)Select: Since inception, on 1/5/2016, the model gained 187.98% while the benchmark SPY gained 152.64% over the same period. Over the previous week the market value of iM-Top5(XLB)Select gained -0.38% at a time when SPY gained -1.55%. A starting capital of $100,000 at inception on 1/5/2016 would have grown to $287,985 which includes -$96 cash and excludes $10,745 spent on fees and slippage. |
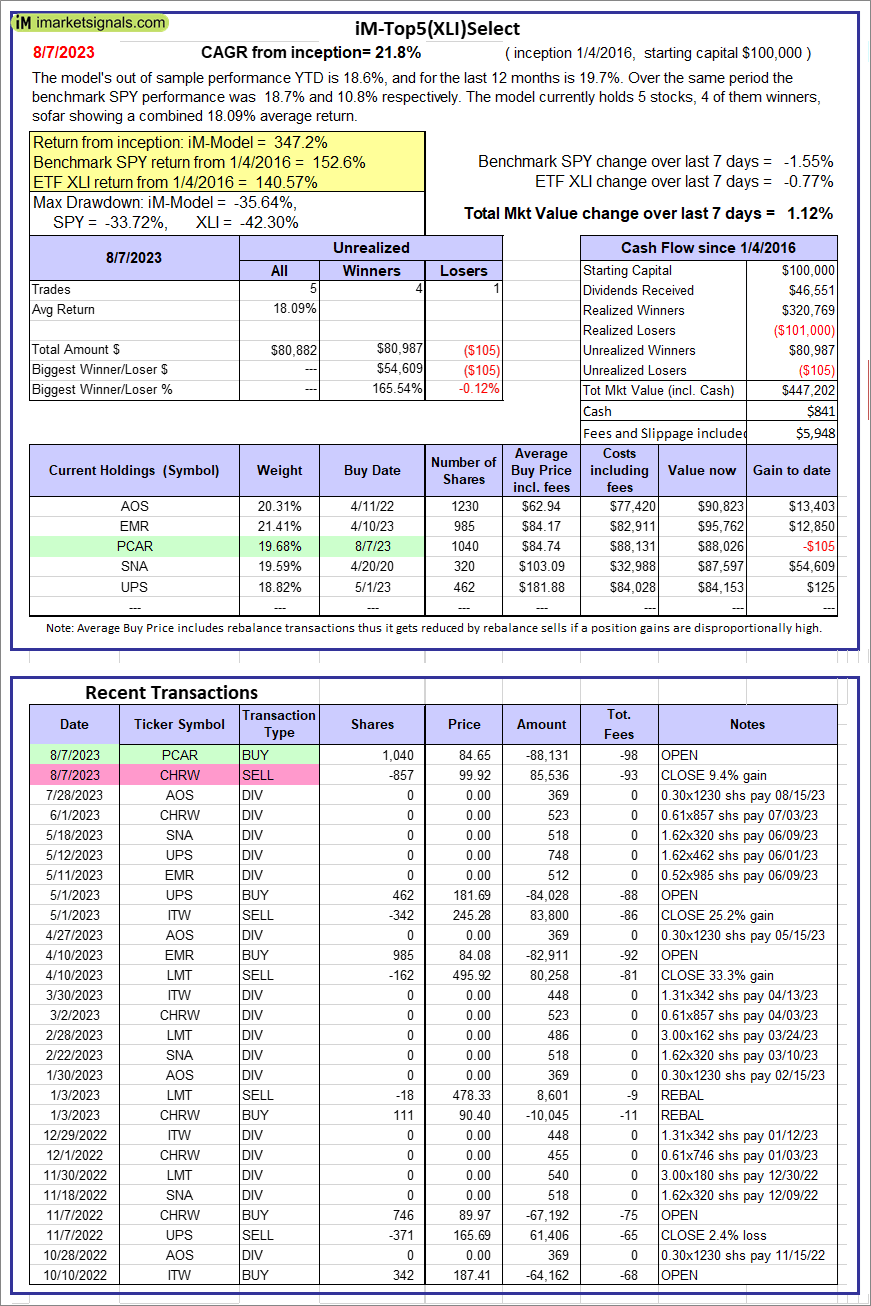 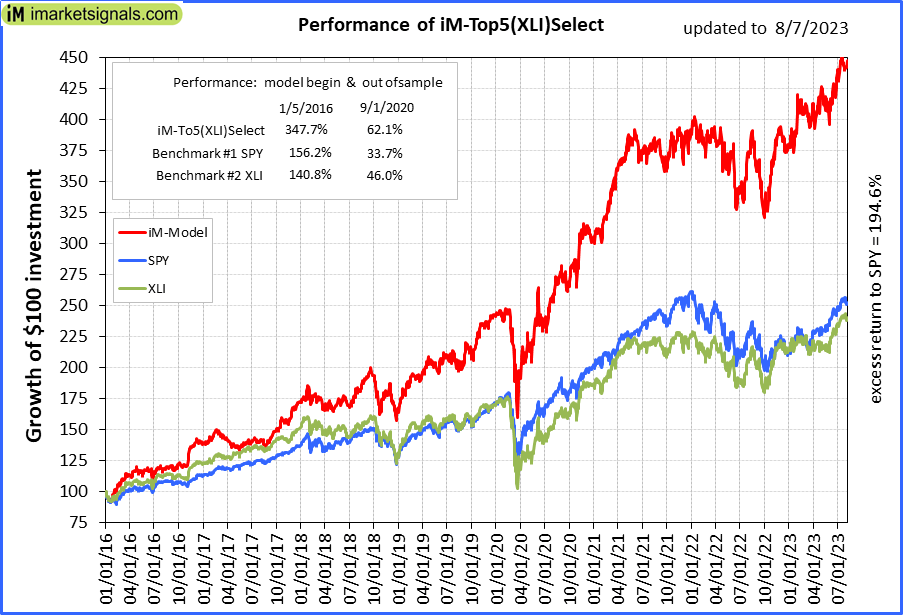 |
iM-Top5(XLI)Select: Since inception, on 1/5/2016, the model gained 347.20% while the benchmark SPY gained 152.64% over the same period. Over the previous week the market value of iM-Top5(XLI)Select gained 1.12% at a time when SPY gained -1.55%. A starting capital of $100,000 at inception on 1/5/2016 would have grown to $447,202 which includes $841 cash and excludes $5,948 spent on fees and slippage. |
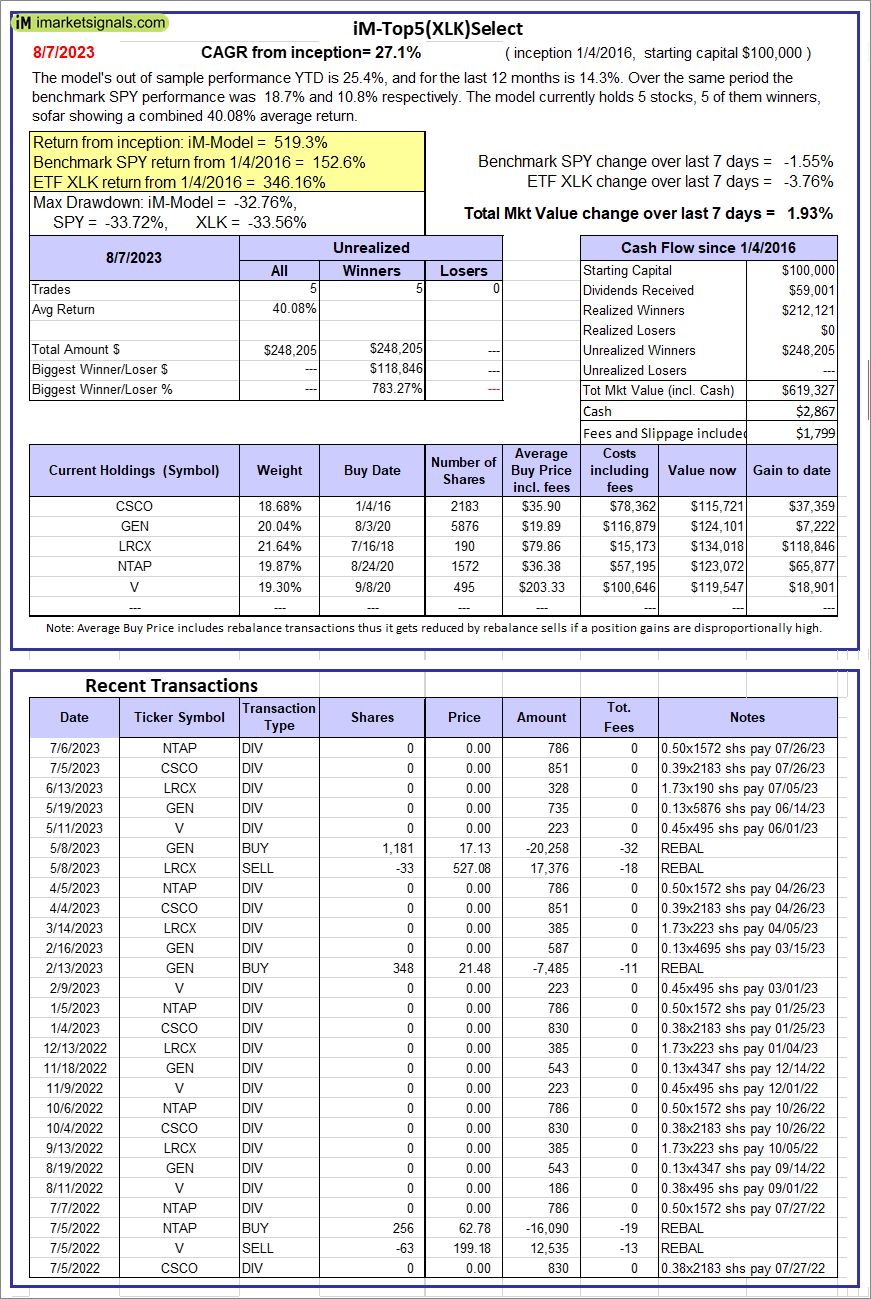 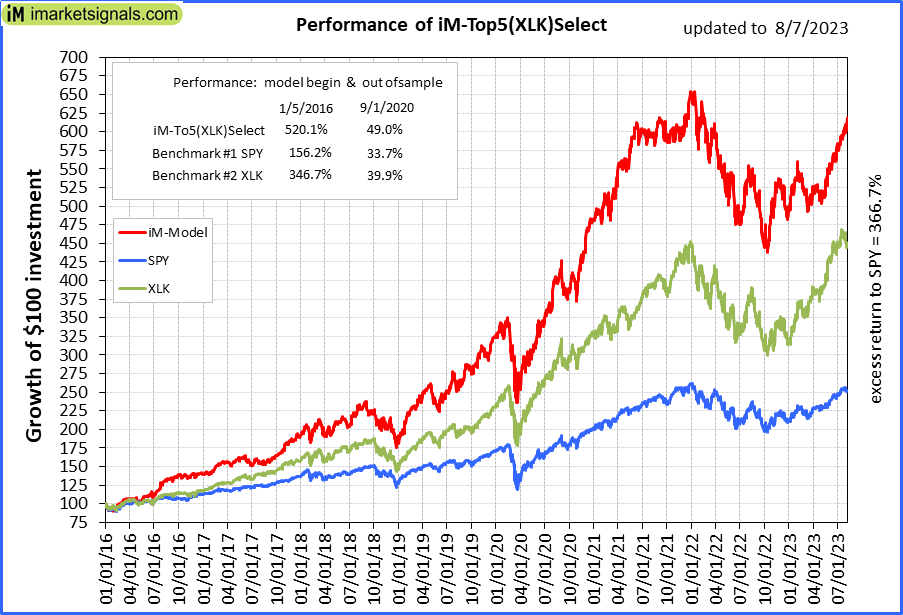 |
iM-Top5(XLK)Select: Since inception, on 1/5/2016, the model gained 519.33% while the benchmark SPY gained 152.64% over the same period. Over the previous week the market value of iM-Top5(XLK)Select gained 1.93% at a time when SPY gained -1.55%. A starting capital of $100,000 at inception on 1/5/2016 would have grown to $619,327 which includes $2,867 cash and excludes $1,799 spent on fees and slippage. |
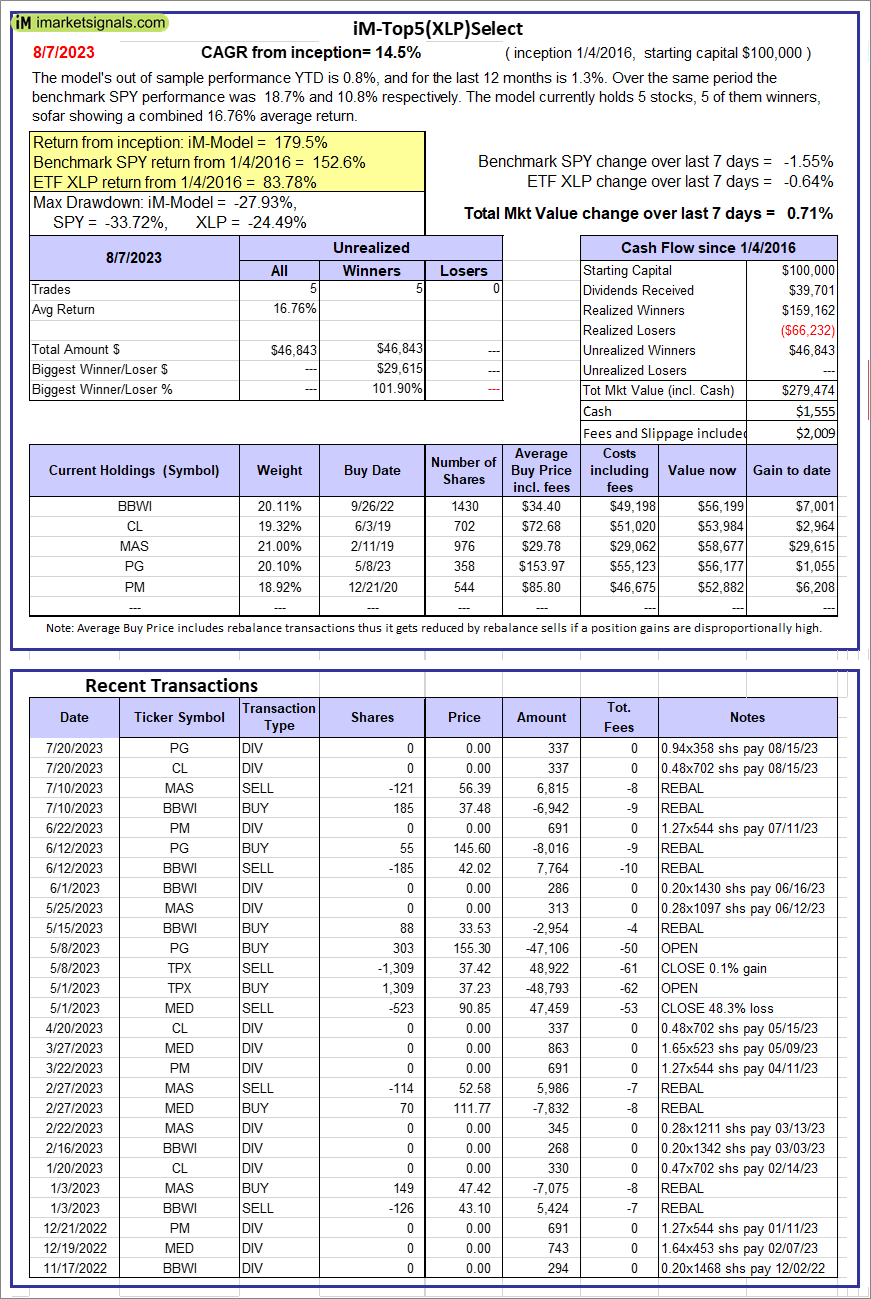 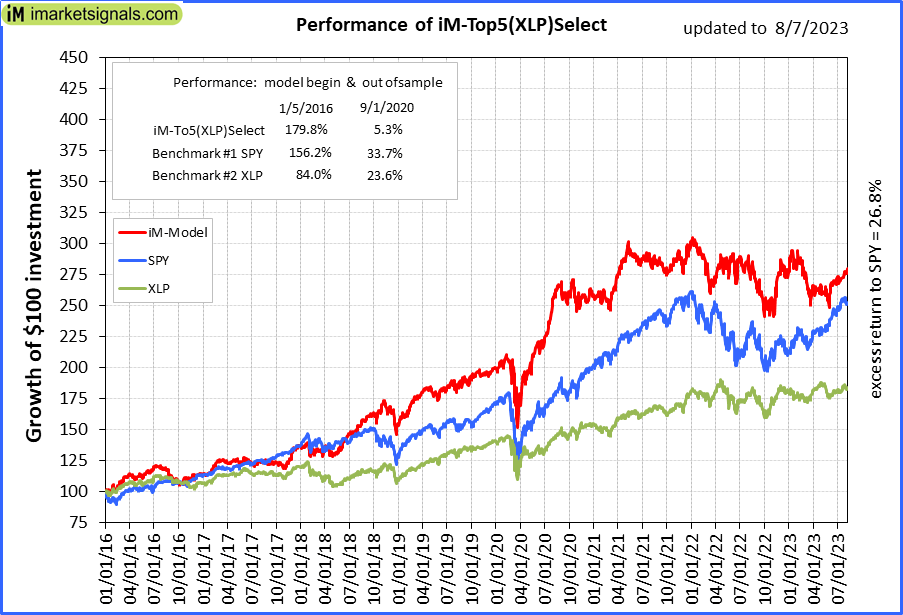 |
iM-Top5(XLP)Select: Since inception, on 1/5/2016, the model gained 179.47% while the benchmark SPY gained 152.64% over the same period. Over the previous week the market value of iM-Top5(XLP)Select gained 0.71% at a time when SPY gained -1.55%. A starting capital of $100,000 at inception on 1/5/2016 would have grown to $279,474 which includes $1,555 cash and excludes $2,009 spent on fees and slippage. |
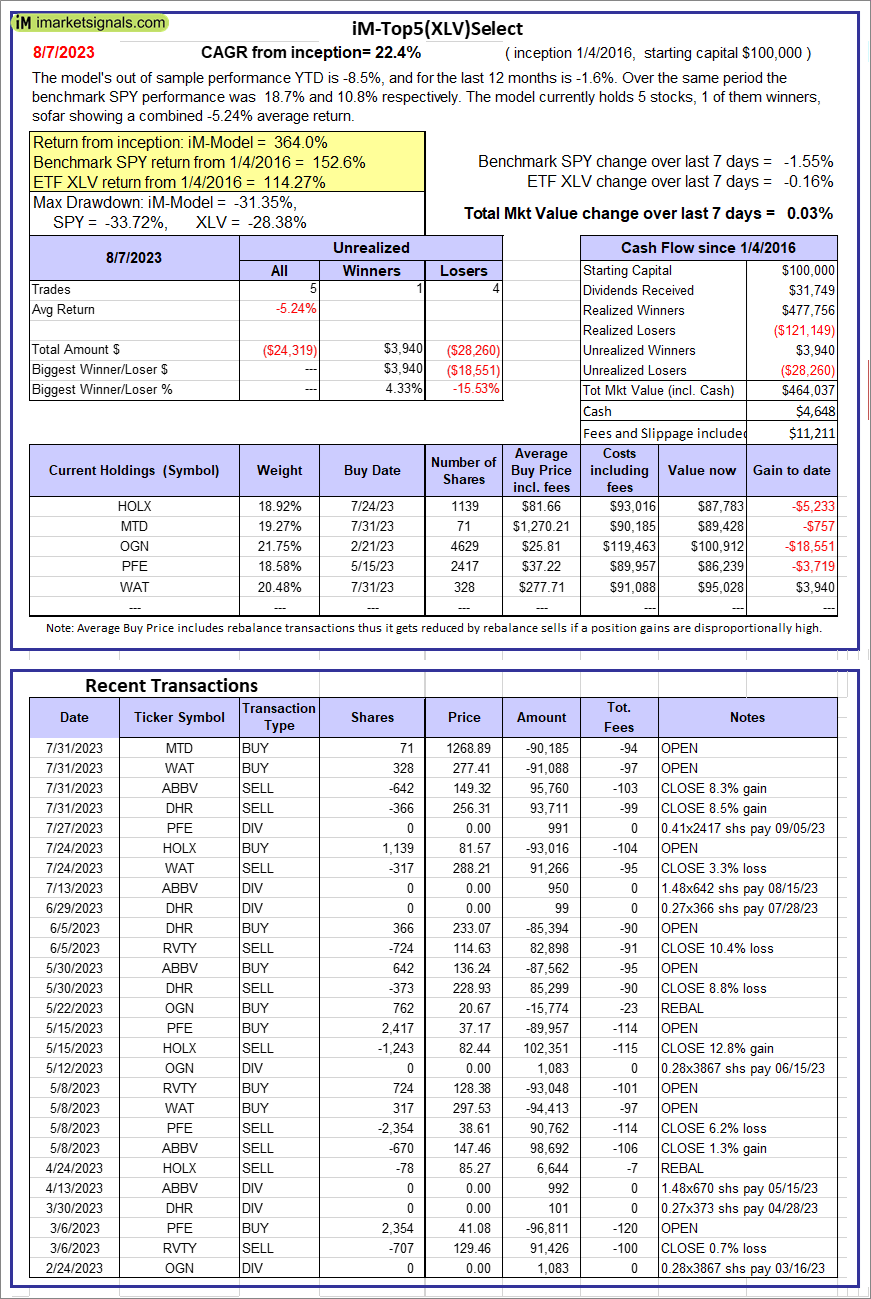 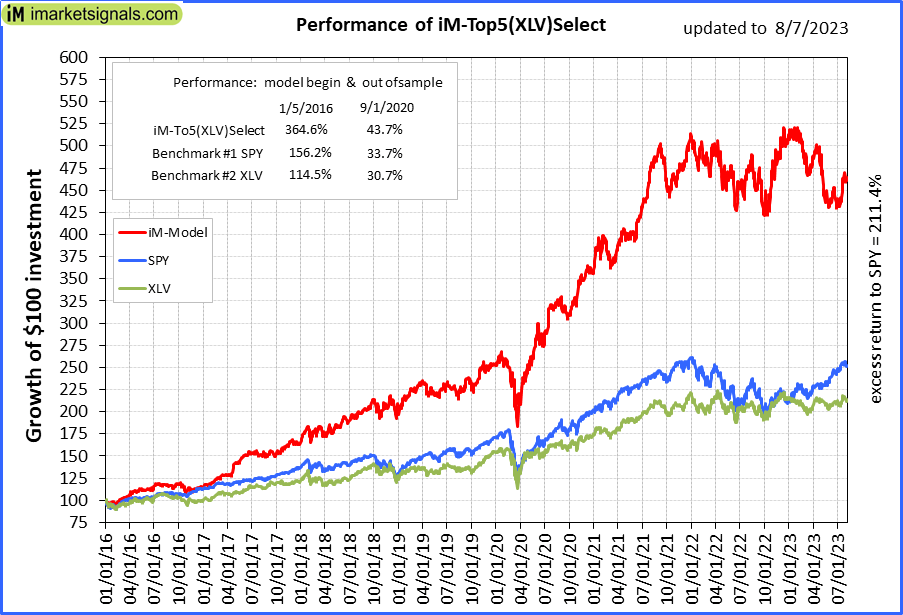 |
iM-Top5(XLV)Select: Since inception, on 1/5/2016, the model gained 364.04% while the benchmark SPY gained 152.64% over the same period. Over the previous week the market value of iM-Top5(XLV)Select gained 0.03% at a time when SPY gained -1.55%. A starting capital of $100,000 at inception on 1/5/2016 would have grown to $464,037 which includes $4,648 cash and excludes $11,211 spent on fees and slippage. |
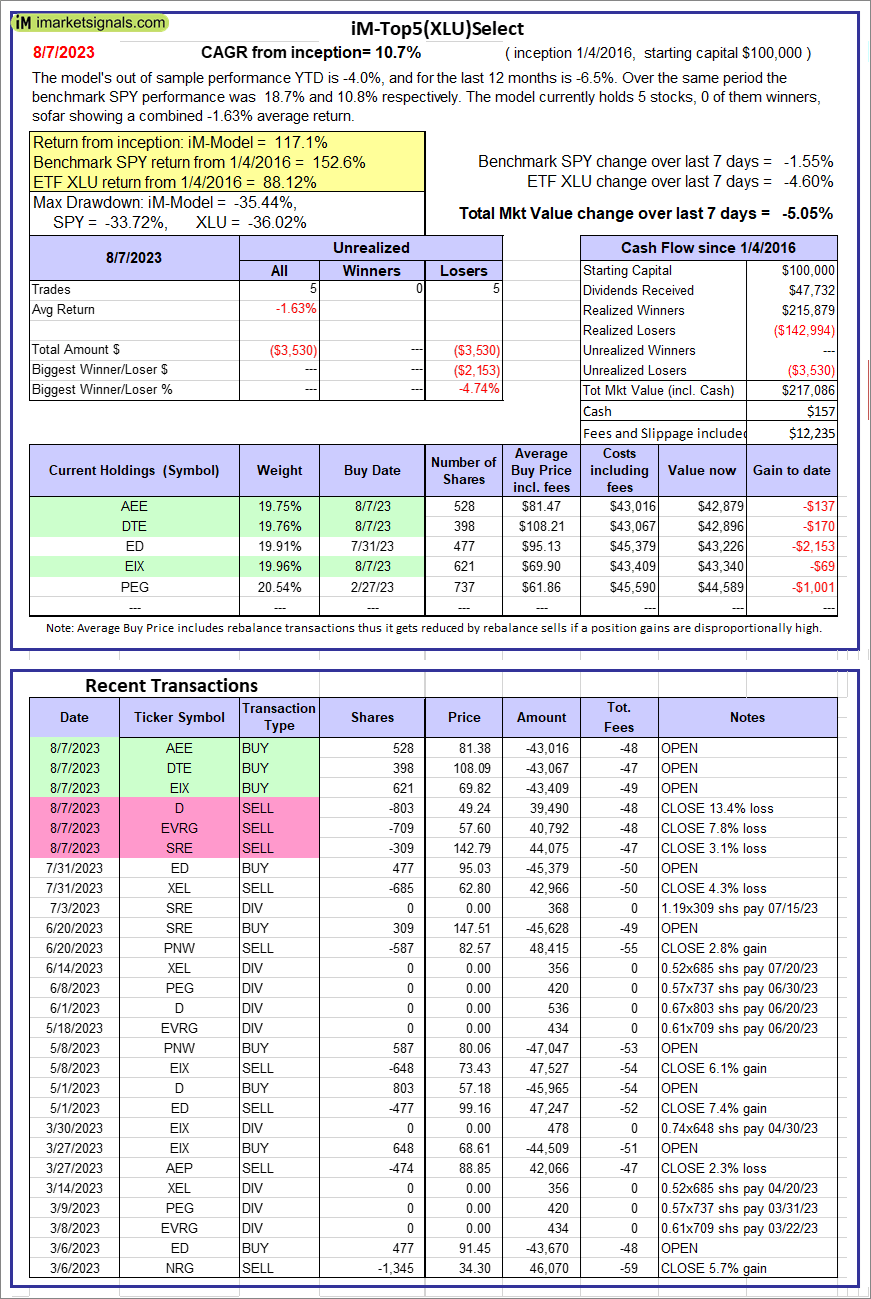 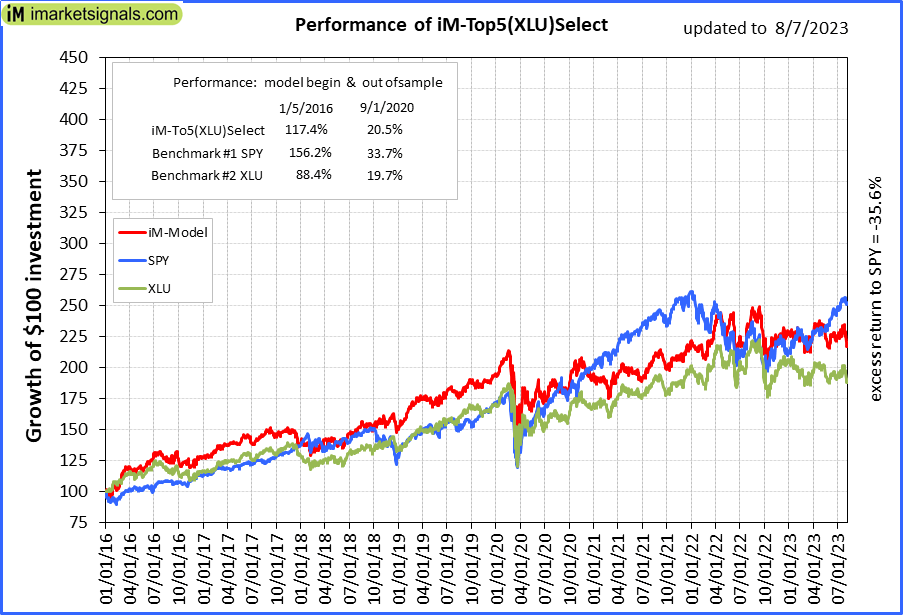 |
iM-Top5(XLU)Select: Since inception, on 1/5/2016, the model gained 117.09% while the benchmark SPY gained 152.64% over the same period. Over the previous week the market value of iM-Top5(XLU)Select gained -5.05% at a time when SPY gained -1.55%. A starting capital of $100,000 at inception on 1/5/2016 would have grown to $217,086 which includes $157 cash and excludes $12,235 spent on fees and slippage. |
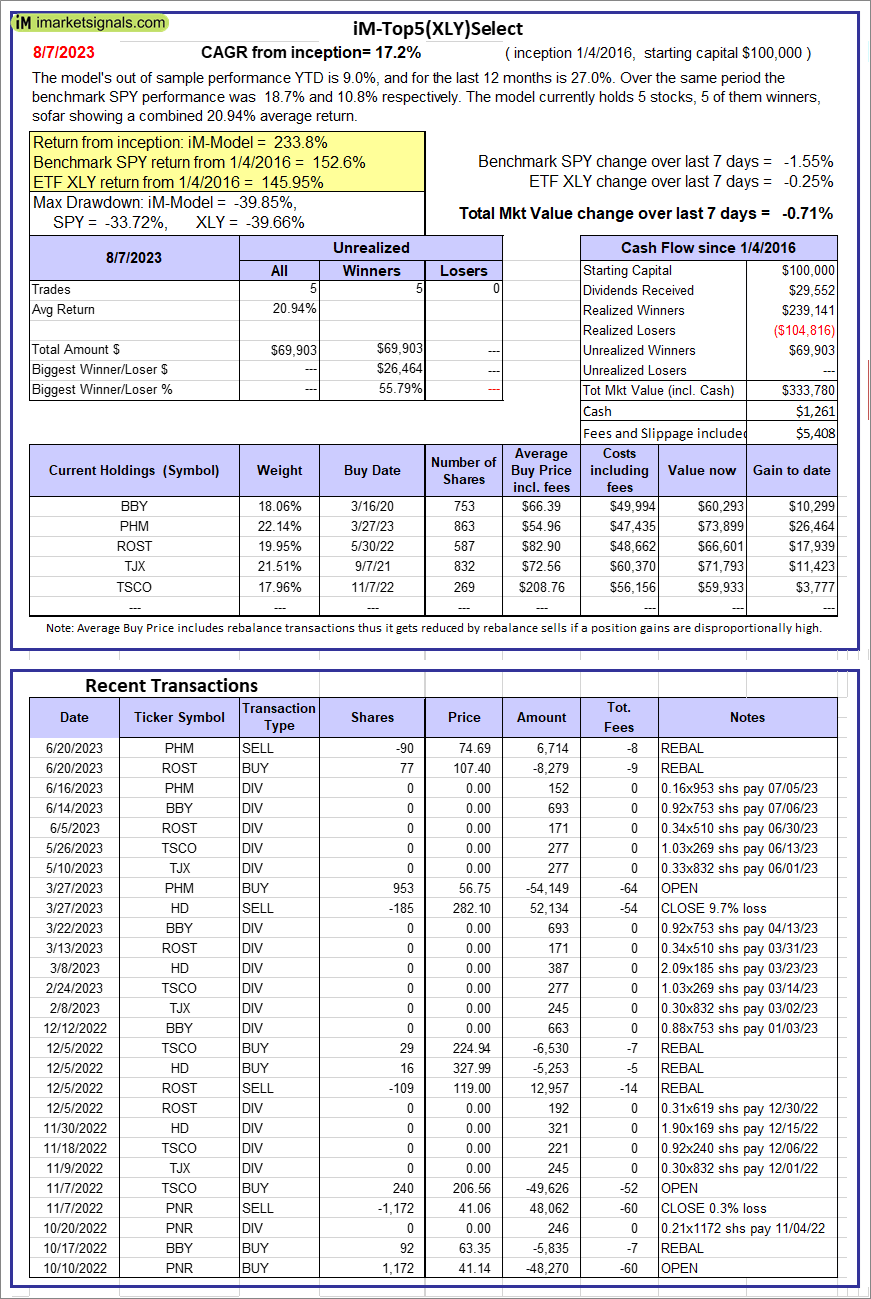 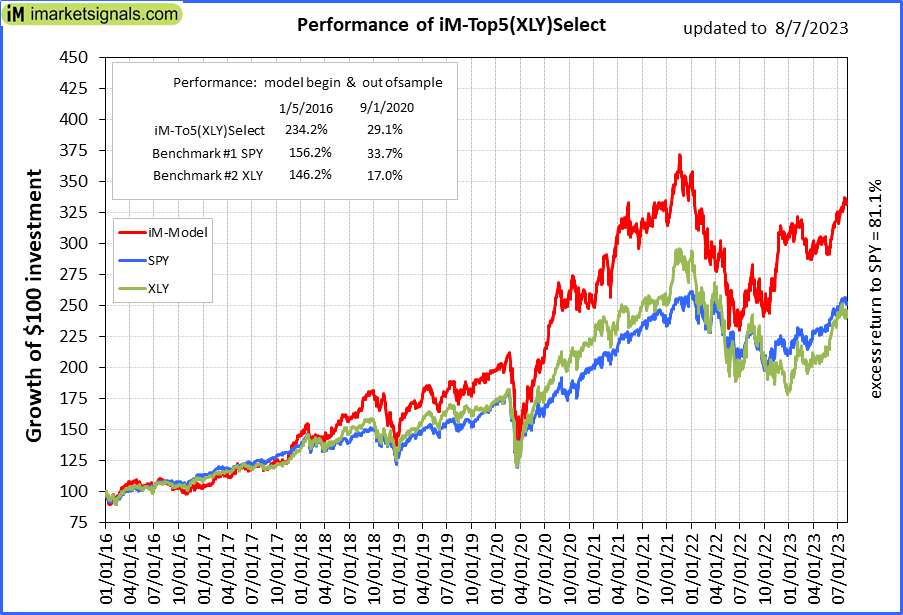 |
iM-Top5(XLY)Select: Since inception, on 1/5/2016, the model gained 233.78% while the benchmark SPY gained 152.64% over the same period. Over the previous week the market value of iM-Top5(XLY)Select gained -0.71% at a time when SPY gained -1.55%. A starting capital of $100,000 at inception on 1/5/2016 would have grown to $333,780 which includes $1,261 cash and excludes $5,408 spent on fees and slippage. |
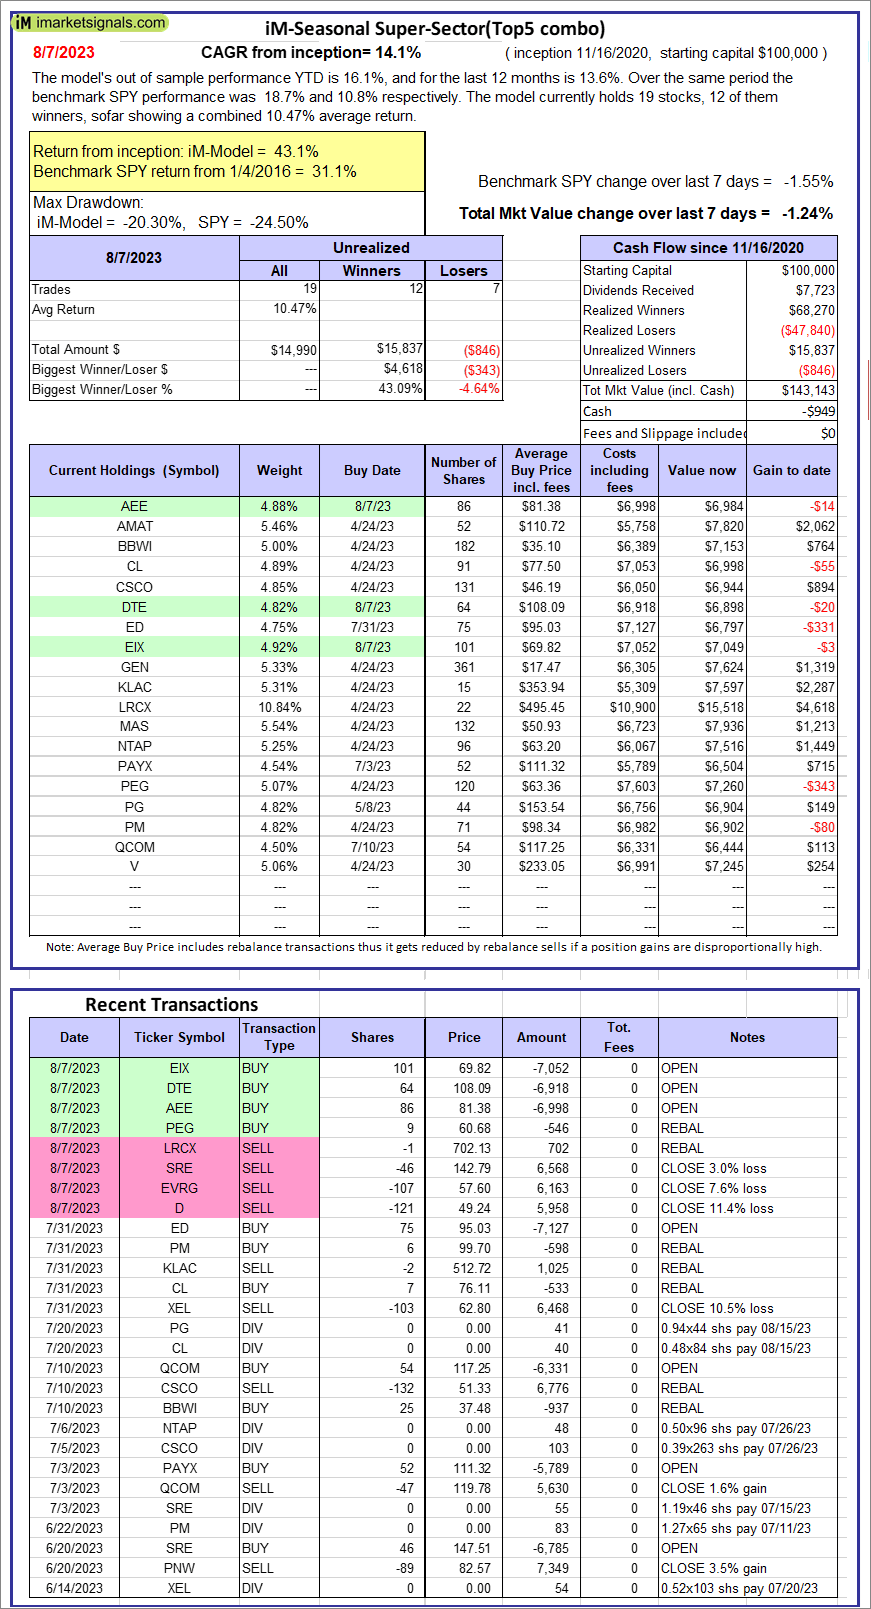 |
iM-Seasonal Super-Sectors (Top5 combo) : Since inception, on 11/17/2020, the model gained 43.14% while the benchmark SPY gained 31.14% over the same period. Over the previous week the market value of iM-Seasonal Super-Sectors (Top5 combo) gained -1.24% at a time when SPY gained -1.55%. A starting capital of $100,000 at inception on 11/17/2020 would have grown to $143,143 which includes -$949 cash and excludes $00 spent on fees and slippage. |
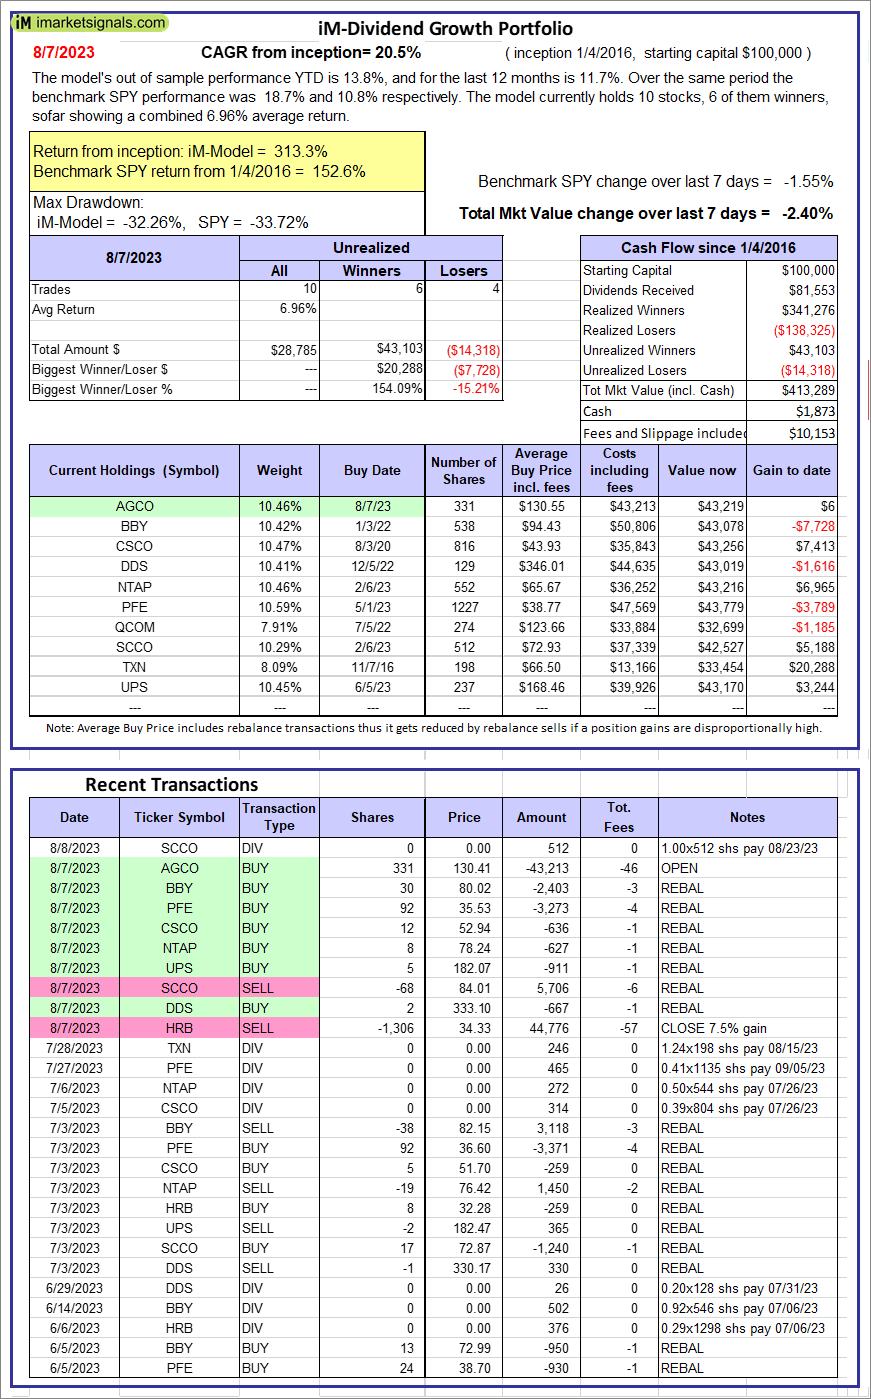 |
iM-Dividend Growth Portfolio: The model’s out of sample performance YTD is 13.8%, and for the last 12 months is 11.7%. Over the same period the benchmark SPY performance was 18.7% and 10.8% respectively. Over the previous week the market value of the iM-Dividend Growth Portfolio gained -2.40% at a time when SPY gained -1.55%. A starting capital of $100,000 at inception on 6/30/2016 would have grown to $413,289 which includes $1,873 cash and excludes $10,153 spent on fees and slippage. |
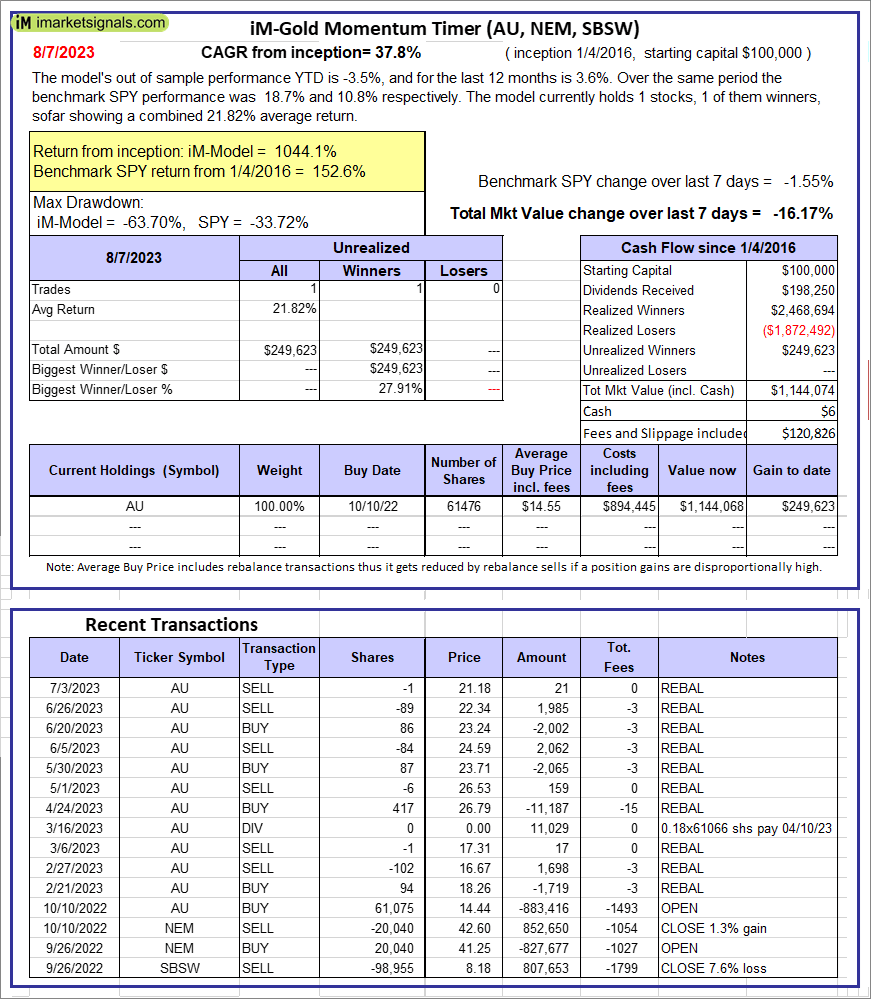 |
iM-Gold Momentum Timer (AU, NEM, SBSW): The model’s out of sample performance YTD is -3.5%, and for the last 12 months is 3.6%. Over the same period the benchmark SPY performance was 18.7% and 10.8% respectively. Over the previous week the market value of iM-Gold Momentum Timer (AU, NEM, SBSW) gained -16.17% at a time when SPY gained -1.55%. A starting capital of $100,000 at inception on 6/30/2016 would have grown to $06 which includes $120,826 cash and excludes Gain to date spent on fees and slippage. |
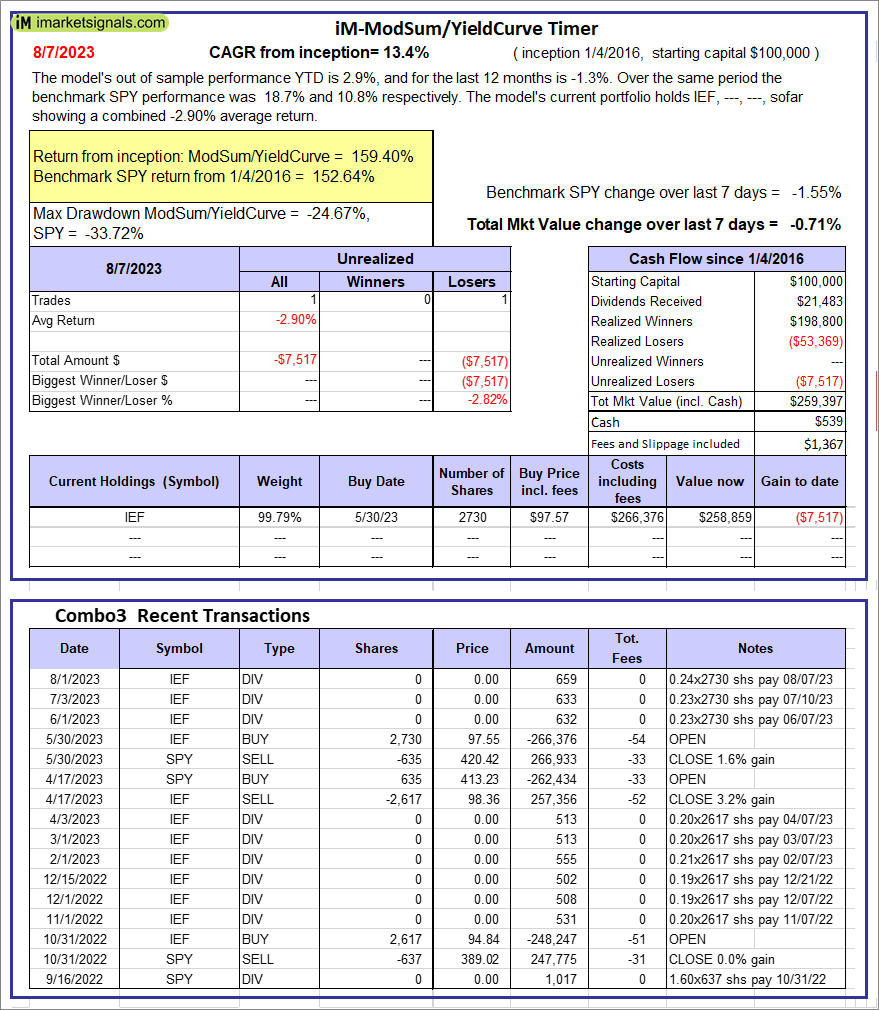 |
iM-ModSum/YieldCurve Timer: The model’s out of sample performance YTD is 2.9%, and for the last 12 months is -1.3%. Over the same period the benchmark SPY performance was 18.7% and 10.8% respectively. Over the previous week the market value of iM-PortSum/YieldCurve Timer gained -0.71% at a time when SPY gained -1.55%. A starting capital of $100,000 at inception on 1/1/2016 would have grown to $259,397 which includes $539 cash and excludes $1,367 spent on fees and slippage. |
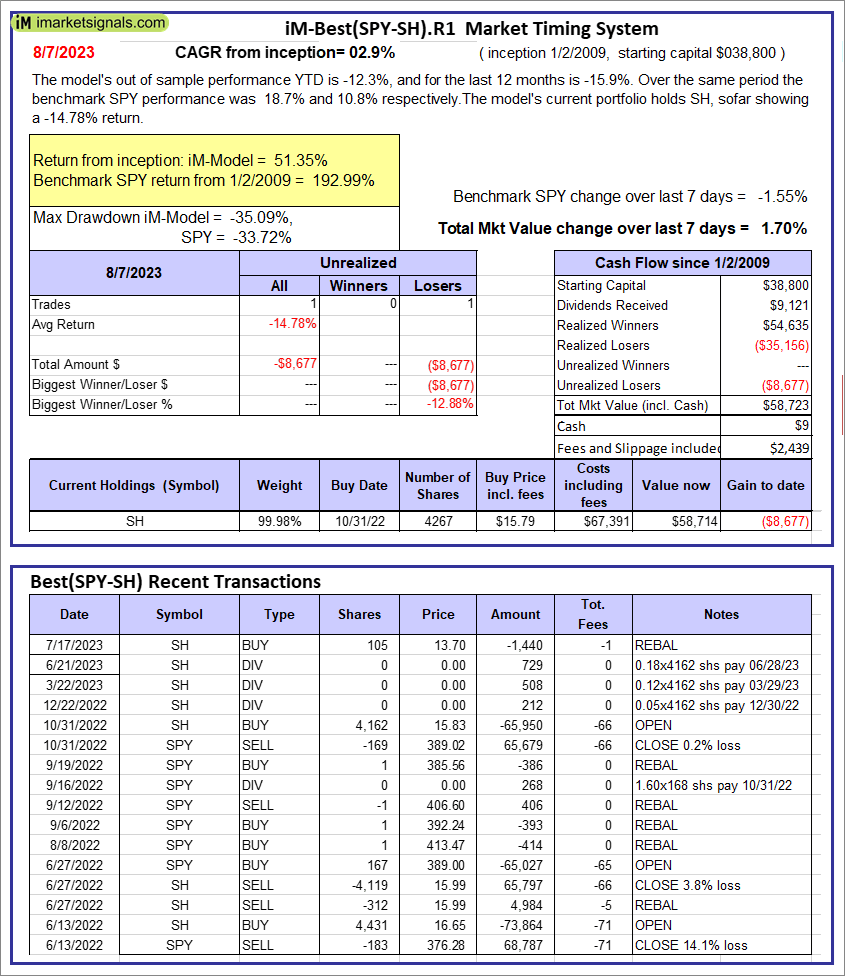 |
iM-Best(SPY-SH).R1: The model’s out of sample performance YTD is -12.3%, and for the last 12 months is -15.9%. Over the same period the benchmark SPY performance was 18.7% and 10.8% respectively. Over the previous week the market value of Best(SPY-SH) gained 1.70% at a time when SPY gained -1.55%. A starting capital of $100,000 at inception on 1/2/2009 would have grown to $58,723 which includes $9 cash and excludes $2,439 spent on fees and slippage. |
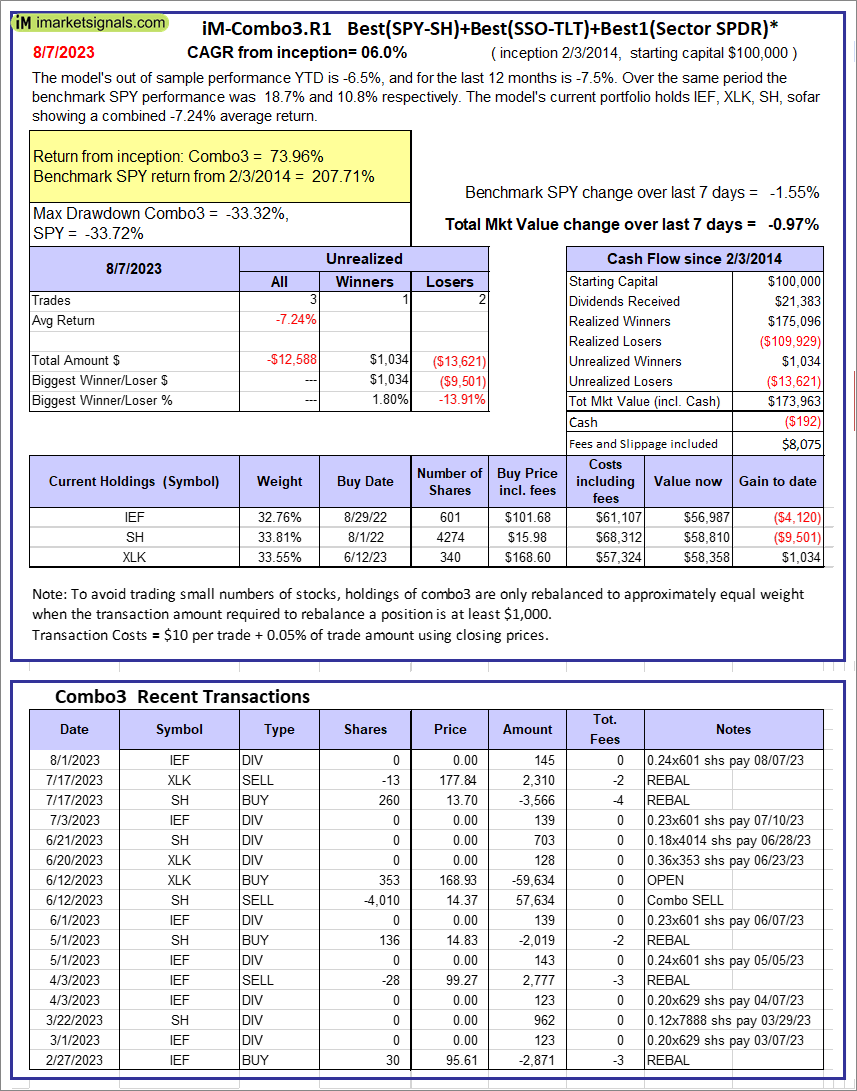 |
iM-Combo3.R1: The model’s out of sample performance YTD is -6.5%, and for the last 12 months is -7.5%. Over the same period the benchmark SPY performance was 18.7% and 10.8% respectively. Over the previous week the market value of iM-Combo3.R1 gained -0.97% at a time when SPY gained -1.55%. A starting capital of $100,000 at inception on 2/3/2014 would have grown to $173,963 which includes -$192 cash and excludes $8,075 spent on fees and slippage. |
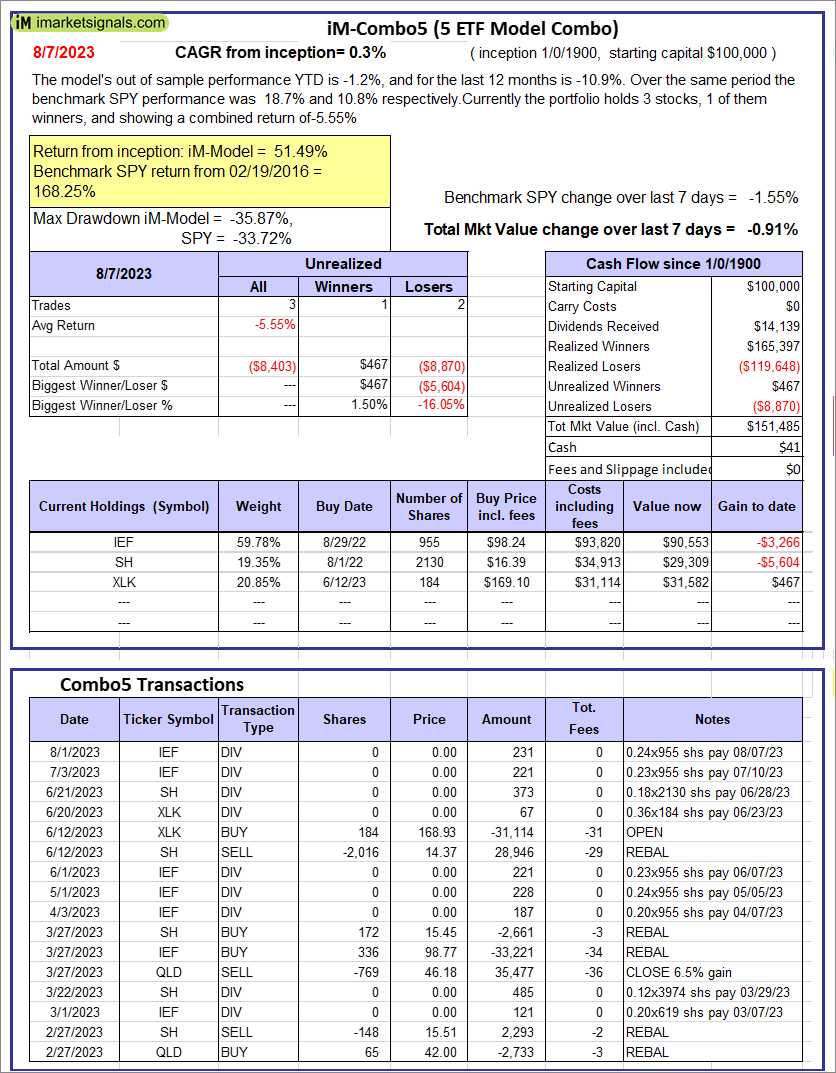 |
iM-Combo5: The model’s out of sample performance YTD is -1.2%, and for the last 12 months is -10.9%. Over the same period the benchmark SPY performance was 18.7% and 10.8% respectively. Over the previous week the market value of iM-Combo5 gained -0.91% at a time when SPY gained -1.55%. A starting capital of $100,000 at inception on 2/22/2016 would have grown to $151,485 which includes $41 cash and excludes $0 spent on fees and slippage. |
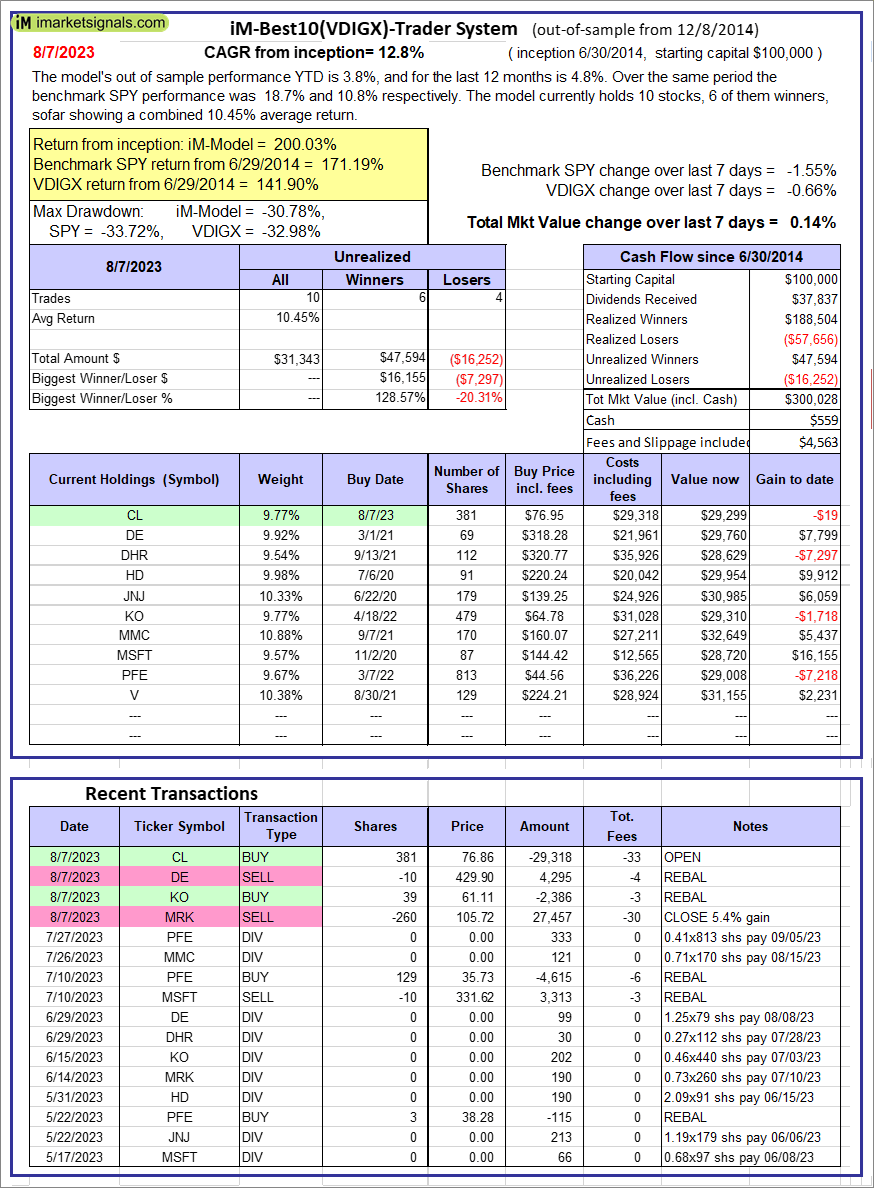 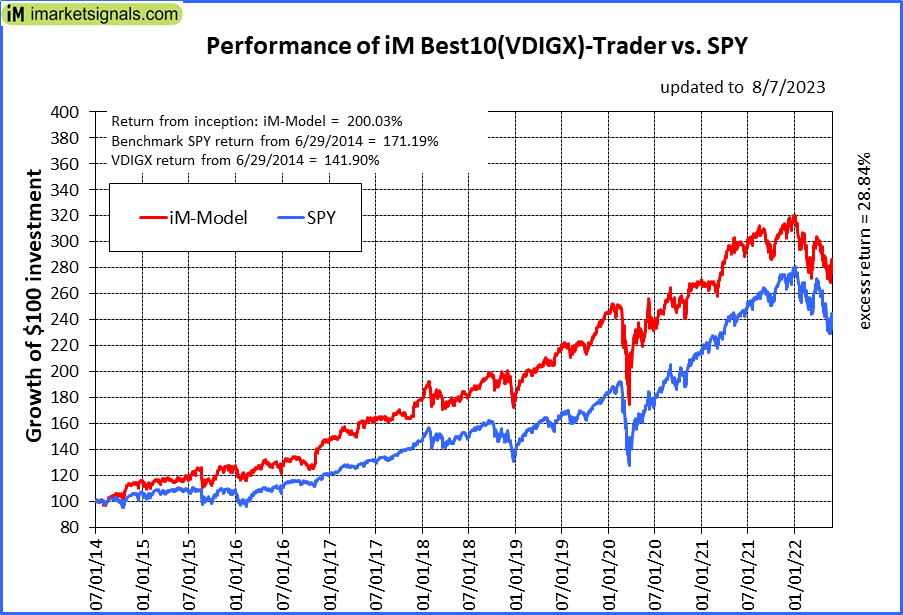 |
iM-Best10(VDIGX)-Trader: The model’s out of sample performance YTD is 3.8%, and for the last 12 months is 4.8%. Over the same period the benchmark SPY performance was 18.7% and 10.8% respectively. Since inception, on 7/1/2014, the model gained 200.03% while the benchmark SPY gained 171.19% and VDIGX gained 141.90% over the same period. Over the previous week the market value of iM-Best10(VDIGX) gained 0.14% at a time when SPY gained -1.55%. A starting capital of $100,000 at inception on 7/1/2014 would have grown to $300,028 which includes $559 cash and excludes $4,563 spent on fees and slippage. |
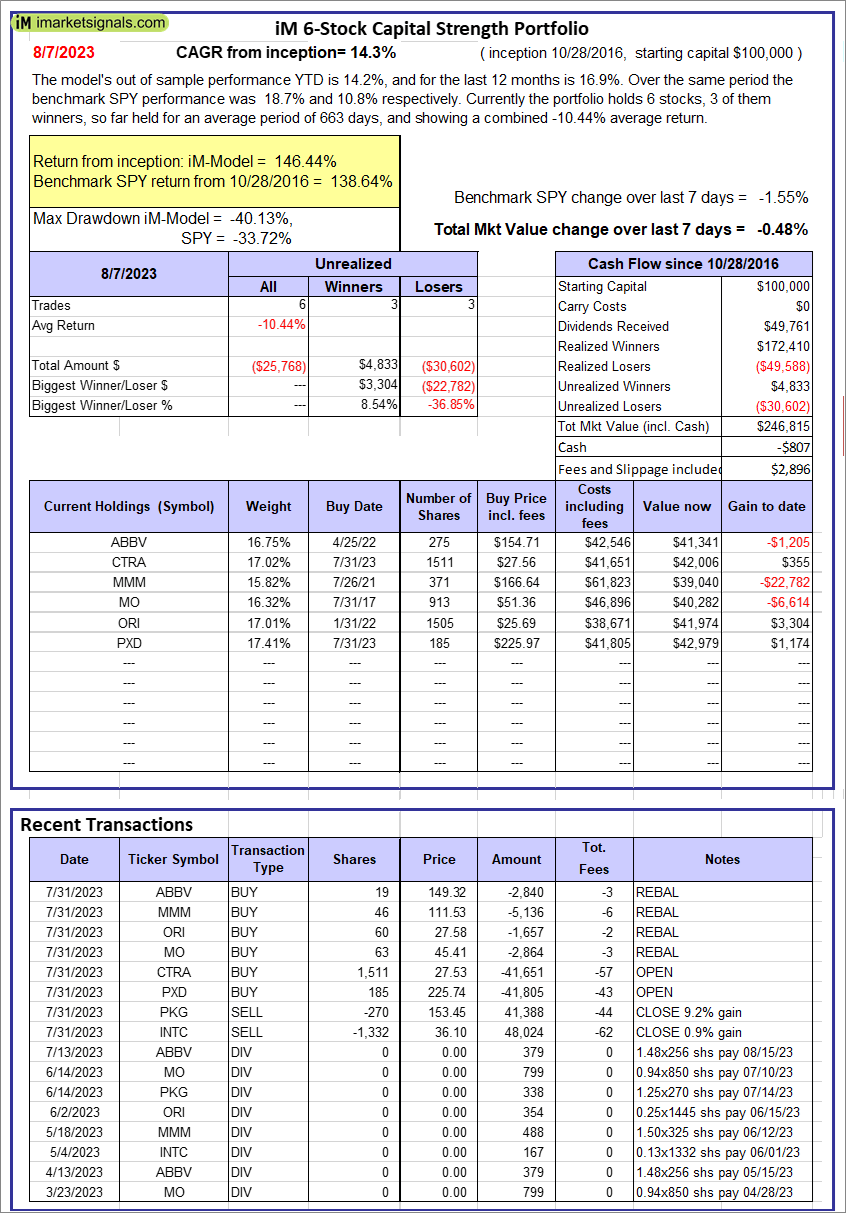 |
iM 6-Stock Capital Strength Portfolio: The model’s out of sample performance YTD is 14.2%, and for the last 12 months is 16.9%. Over the same period the benchmark SPY performance was 18.7% and 10.8% respectively. Over the previous week the market value of the iM 6-Stock Capital Strength Portfolio gained -0.48% at a time when SPY gained -1.55%. A starting capital of $100,000 at inception on 10/28/2016 would have grown to $246,815 which includes -$807 cash and excludes $2,896 spent on fees and slippage. |
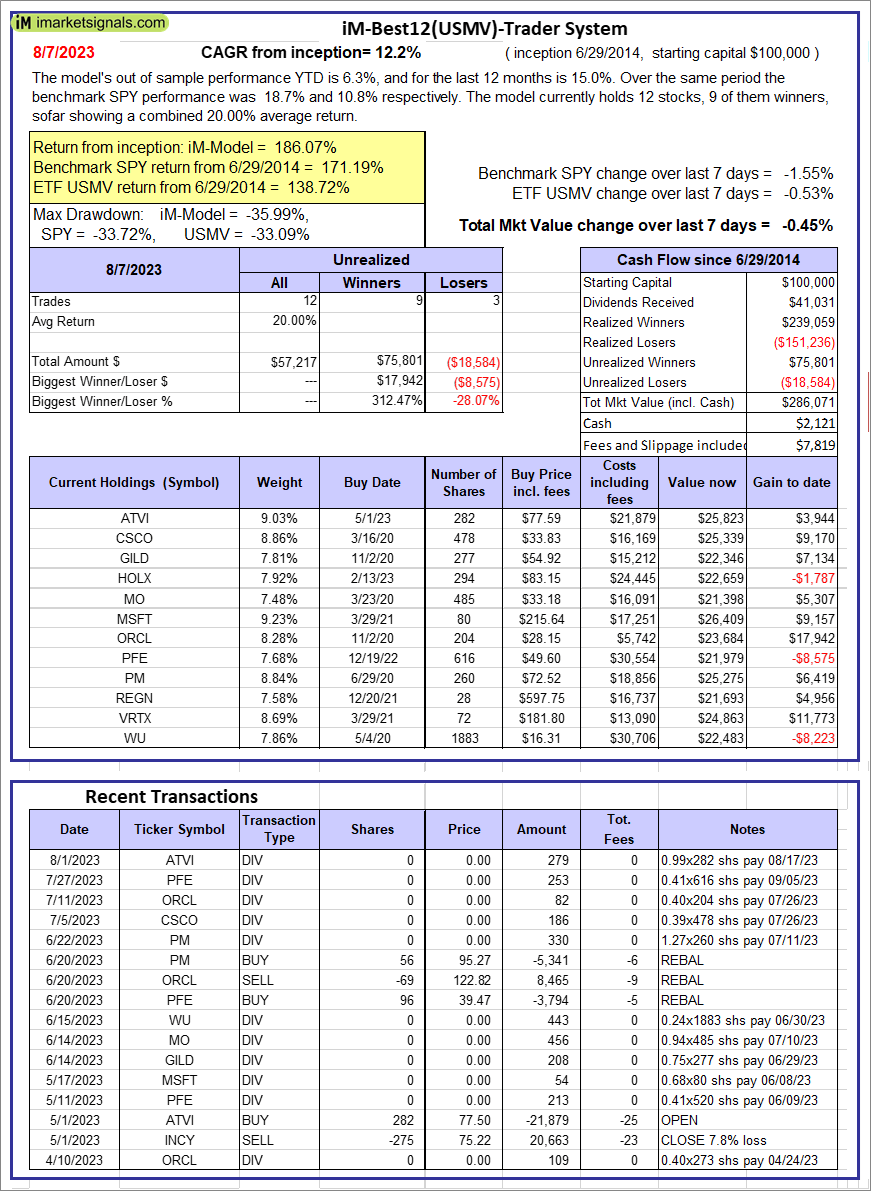 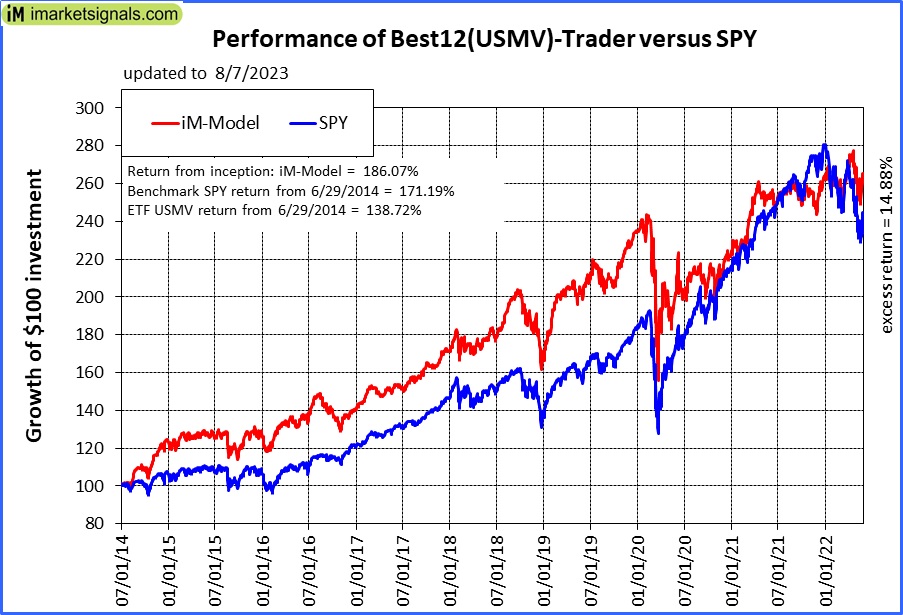 |
iM-Best12(USMV)-Trader: The model’s out of sample performance YTD is 6.3%, and for the last 12 months is 15.0%. Over the same period the benchmark SPY performance was 18.7% and 10.8% respectively. Since inception, on 6/30/2014, the model gained 186.07% while the benchmark SPY gained 171.19% and the ETF USMV gained 138.72% over the same period. Over the previous week the market value of iM-Best12(USMV)-Trader gained -0.45% at a time when SPY gained -1.55%. A starting capital of $100,000 at inception on 6/30/2014 would have grown to $286,071 which includes $2,121 cash and excludes $7,819 spent on fees and slippage. |
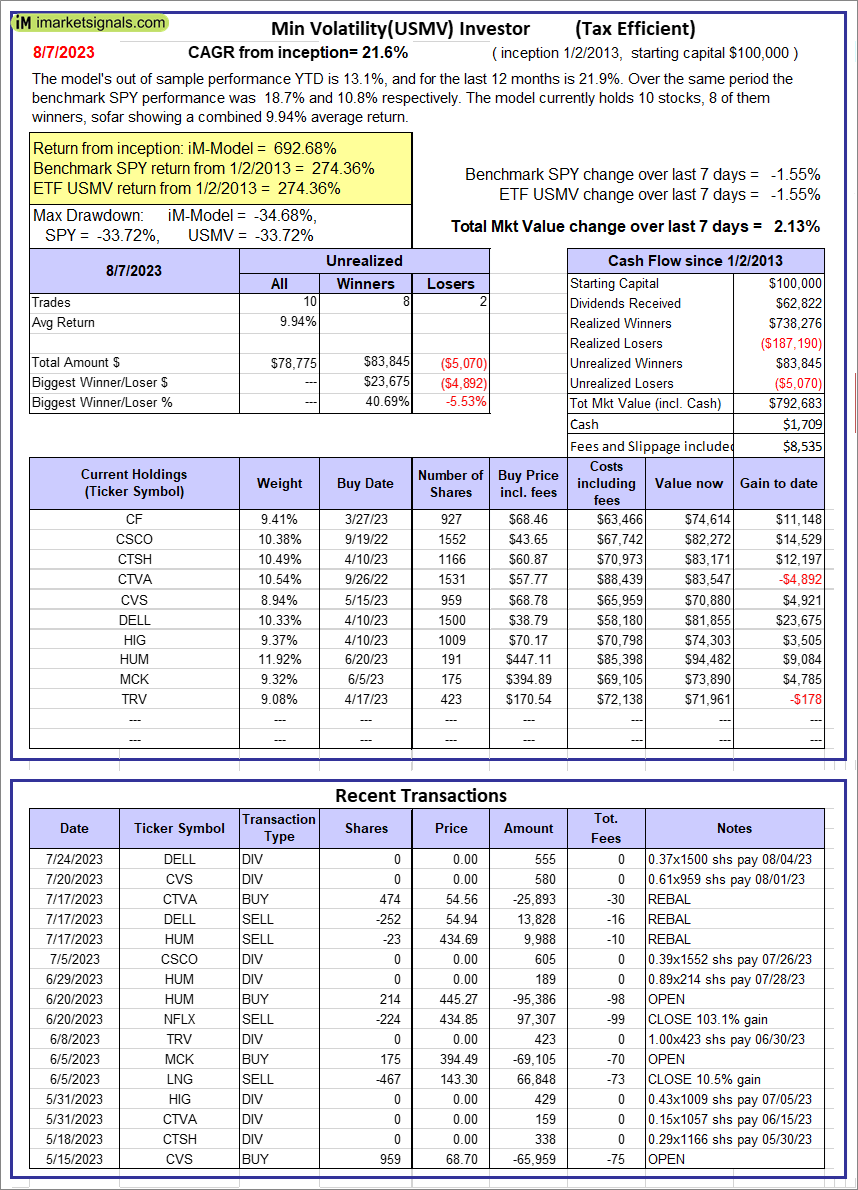 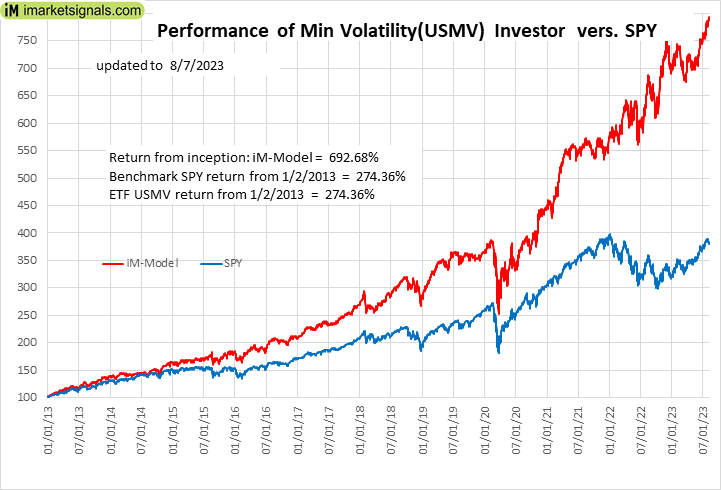 |
iM-Min Volatility(USMV) Investor (Tax Efficient): The model’s out of sample performance YTD is 13.1%, and for the last 12 months is 21.9%. Over the same period the benchmark SPY performance was 18.7% and 10.8% respectively. Since inception, on 1/3/2013, the model gained 692.68% while the benchmark SPY gained 274.36% and the ETF USMV gained 274.36% over the same period. Over the previous week the market value of iM-Best12(USMV)Q1 gained 2.13% at a time when SPY gained -1.55%. A starting capital of $100,000 at inception on 1/3/2013 would have grown to $792,683 which includes $1,709 cash and excludes $8,535 spent on fees and slippage. |
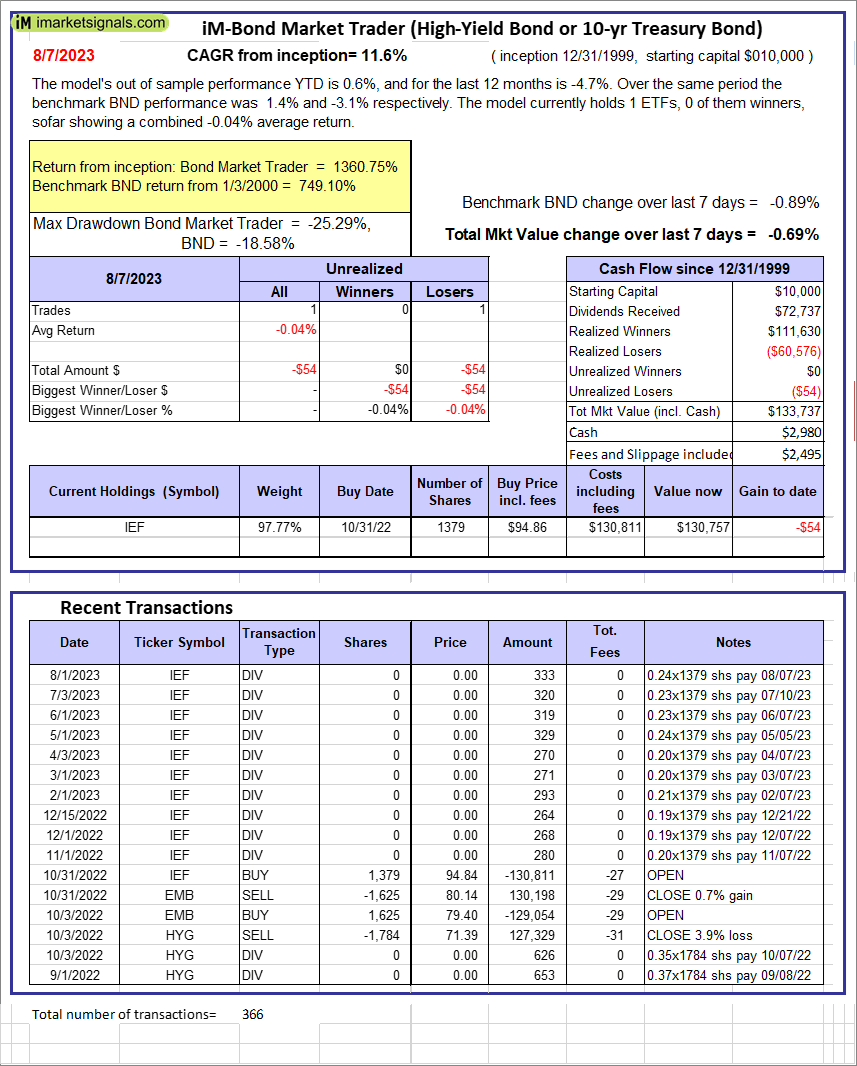 |
iM-Bond Market Trader (High-Yield Bond or 10-yr Treasury Bond): The model’s out of sample performance YTD is 0.6%, and for the last 12 months is -4.7%. Over the same period the benchmark BND performance was 1.4% and -3.1% respectively. Over the previous week the market value of the iM-Bond Market Trader (High-Yield Bond or 10-yr Treasury Bond) gained -0.69% at a time when BND gained -0.89%. A starting capital of $10,000 at inception on 1/3/2000 would have grown to $133,737 which includes $2,980 cash and excludes $2,495 spent on fees and slippage. |
|
|
iM-ModSum/YieldCurve Timer: The model’s out of sample performance YTD is 2.9%, and for the last 12 months is -1.3%. Over the same period the benchmark SPY performance was 18.7% and 10.8% respectively. Over the previous week the market value of iM-PortSum/YieldCurve Timer gained -0.71% at a time when SPY gained -1.55%. A starting capital of $100,000 at inception on 1/1/2016 would have grown to $259,397 which includes $539 cash and excludes $1,367 spent on fees and slippage. |
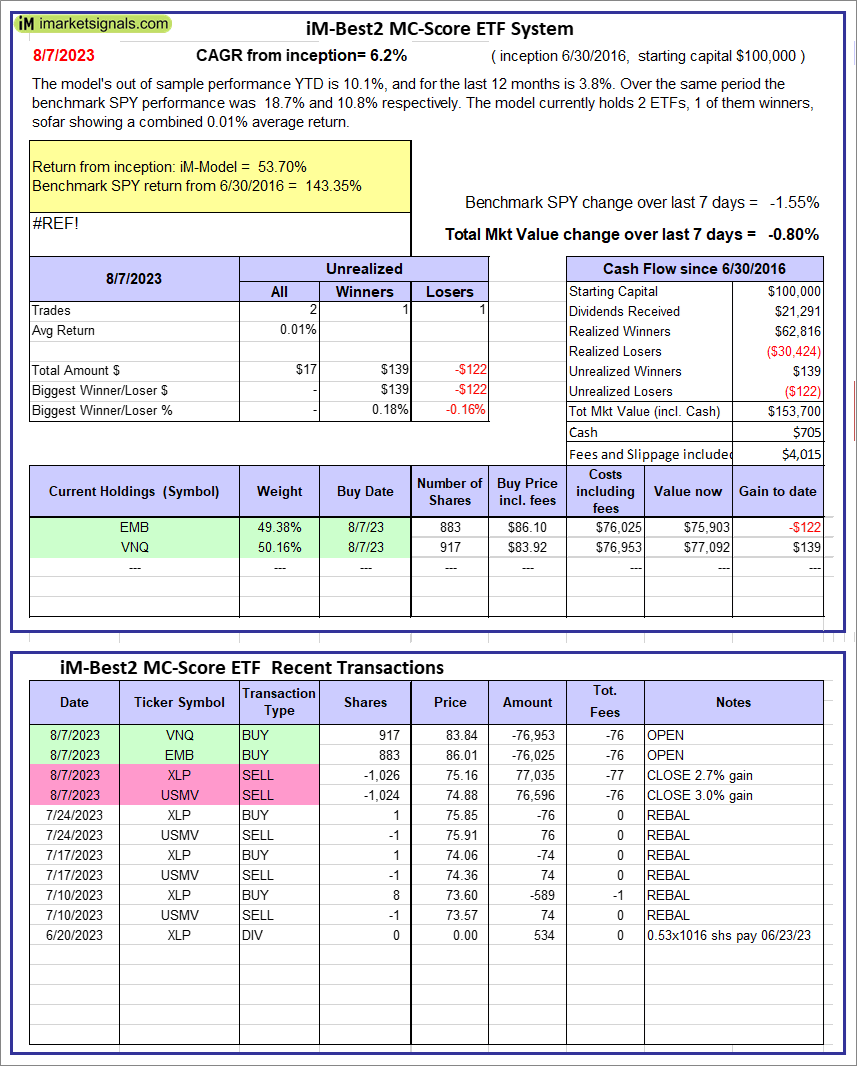 |
iM-Best2 MC-Score ETF System: The model’s out of sample performance YTD is 10.1%, and for the last 12 months is 3.8%. Over the same period the benchmark SPY performance was 18.7% and 10.8% respectively. Over the previous week the market value of the iM-Best2 MC-Score ETF System gained -0.80% at a time when SPY gained -1.55%. A starting capital of $100,000 at inception on 6/30/2016 would have grown to $153,700 which includes $705 cash and excludes $4,015 spent on fees and slippage. |
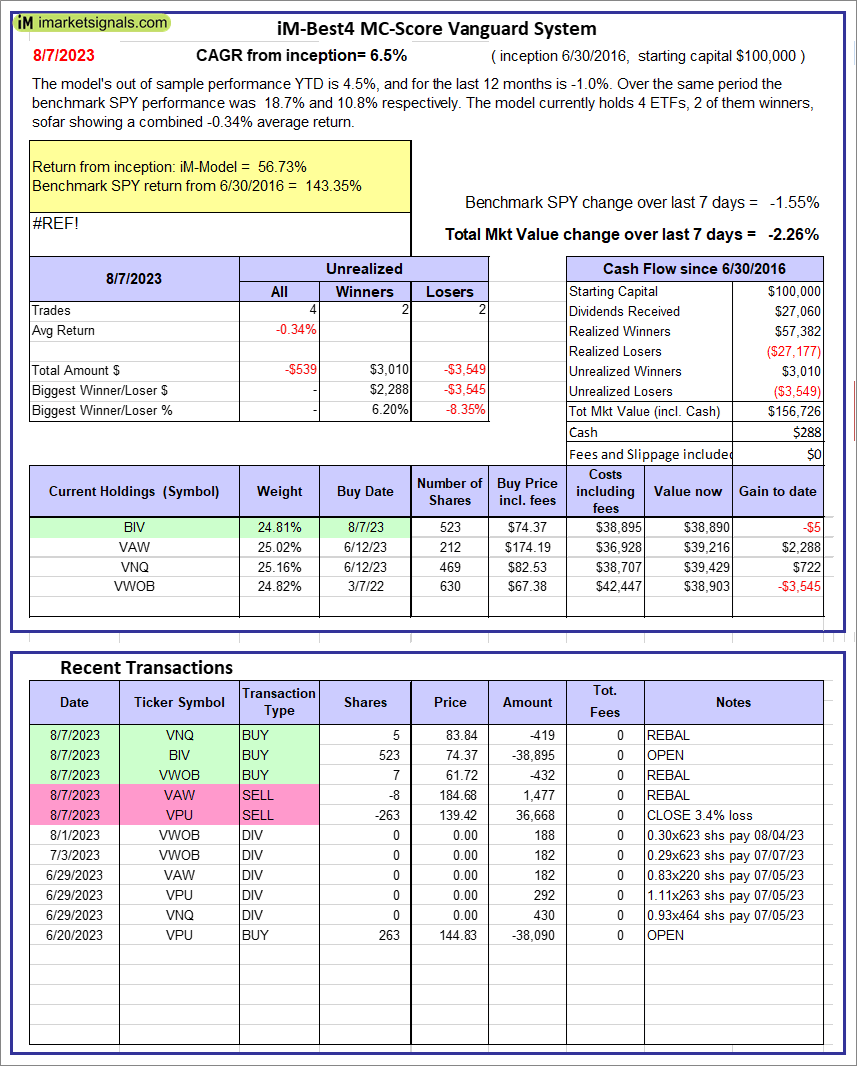 |
iM-Best4 MC-Score Vanguard System: The model’s out of sample performance YTD is 4.5%, and for the last 12 months is -1.0%. Over the same period the benchmark SPY performance was 18.7% and 10.8% respectively. Over the previous week the market value of the iM-Best4 MC-Score Vanguard System gained -2.26% at a time when SPY gained -1.55%. A starting capital of $100,000 at inception on 6/30/2016 would have grown to $156,726 which includes $288 cash and excludes $00 spent on fees and slippage. |
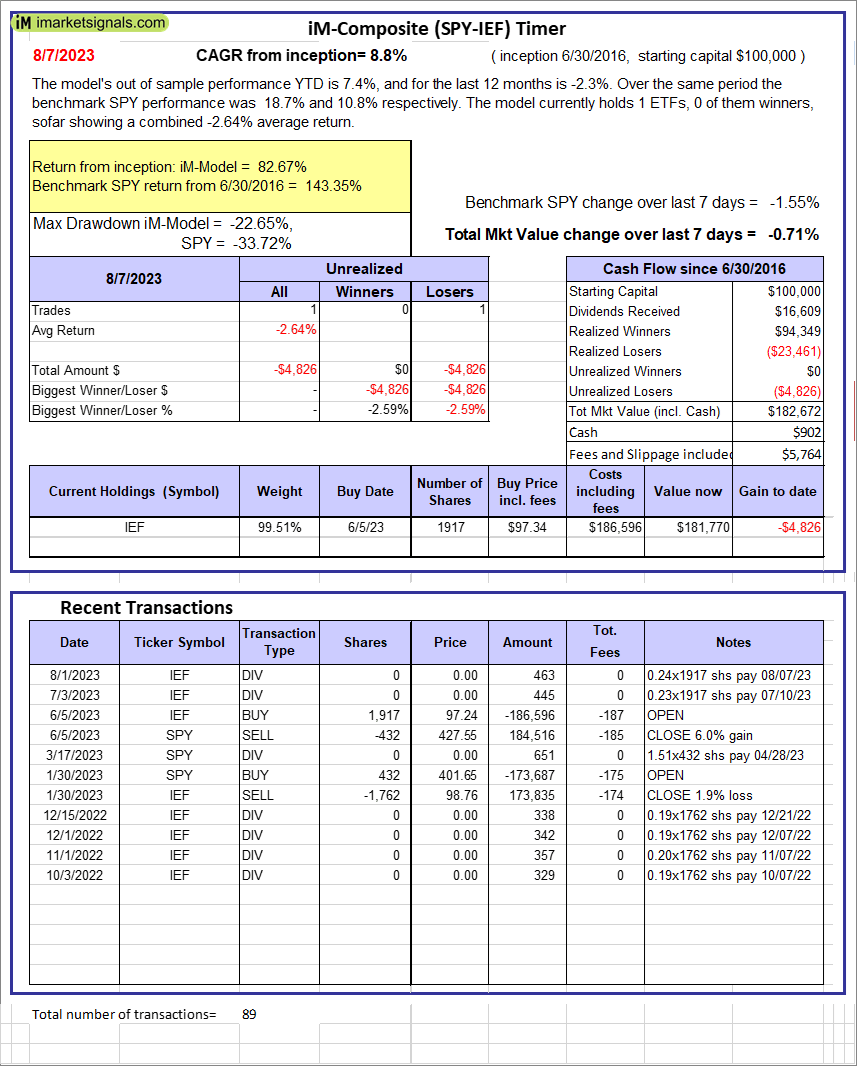 |
iM-Composite (SPY-IEF) Timer: The model’s out of sample performance YTD is 7.4%, and for the last 12 months is -2.3%. Over the same period the benchmark SPY performance was 18.7% and 10.8% respectively. Over the previous week the market value of the iM-Composite (SPY-IEF) Timer gained -0.71% at a time when SPY gained -1.55%. A starting capital of $100,000 at inception on 6/30/2016 would have grown to $182,672 which includes $902 cash and excludes $5,764 spent on fees and slippage. |
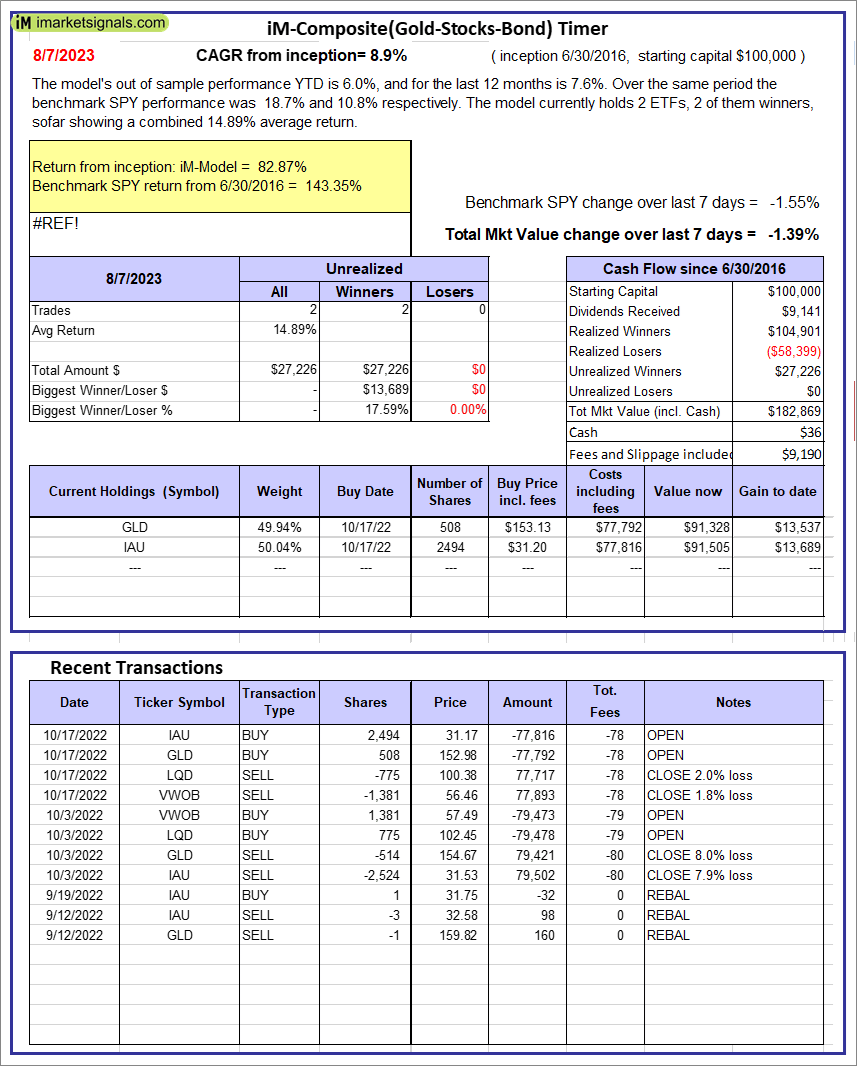 |
iM-Composite(Gold-Stocks-Bond) Timer: The model’s out of sample performance YTD is 6.0%, and for the last 12 months is 7.6%. Over the same period the benchmark SPY performance was 18.7% and 10.8% respectively. Over the previous week the market value of the iM-Composite(Gold-Stocks-Bond) Timer gained -1.39% at a time when SPY gained -1.55%. A starting capital of $100,000 at inception on 6/30/2016 would have grown to $182,869 which includes $36 cash and excludes $9,190 spent on fees and slippage. |
iM-Best Reports – 8/7/2023
Posted in pmp SPY-SH
Leave a Reply
You must be logged in to post a comment.